


Social anxiety is characterised by fear of social situations and of interactions with others. Individuals experiencing social anxiety frequently avoid social situations due to fear of public scrutiny and negative evaluation (Hofmann & DiBartolo, Reference Hofmann and DiBartolo2014). Research findings indicate that public speaking is the most prevalent social fear (Furmark, Reference Furmark2002; Ruscio et al., Reference Ruscio, Brown, Chiu, Sareen, Stein and Kessler2008). Other common social fears include interacting with strangers, dating, and going to parties (Hofmann, Heinrichs, & Moscovitch, Reference Hofmann, Heinrichs and Moscovitch2004). Research findings show that these fears can cause impairments in social functioning and are associated with lower levels of educational attainment, higher risk of unemployment, and difficulties in forming intimate relationships (Crome et al., Reference Crome, Grove, Baillie, Sunderland, Teesson and Slade2015; Fehm, Pelissolo, Furmark, & Wittchen, Reference Fehm, Pelissolo, Furmark and Wittchen2005).
Despite the various harmful impacts of high social anxiety, few individuals with social anxiety seek professional help (Crome et al., Reference Crome, Grove, Baillie, Sunderland, Teesson and Slade2015; Fehm et al., Reference Fehm, Pelissolo, Furmark and Wittchen2005). One possible reason for the low rate of help seeking might be that social anxiety leads these individuals to avoid interactions with mental health care providers, just as they avoid interactions with others.
Socially anxious individuals may meet criteria for a diagnosis of social anxiety disorder, as described by the Diagnostic and Statistical Manual of Mental Disorders (DSM-5; American Psychiatric Association, 2013). According to the DSM-5, a diagnosis of social anxiety disorder (also known as social phobia) reflects clinically significant levels of social anxiety. Furthermore, the DSM-5 includes a ‘performance only’ specifier for individuals fearing only public speaking or performance situations.
Anxiety in social situations is a common human experience (Ruscio, Reference Ruscio2010). Therefore, some experts argue it is best to conceptualise social anxiety as existing along a continuum ranging from fears that are adaptive to those that cause substantial impairment (Hofmann & DiBartolo, Reference Hofmann and DiBartolo2014). Ruscio (Reference Ruscio2010) suggested that all levels of social anxiety are important to consider and that researchers may overlook important information by excluding milder cases that fall below the diagnostic threshold.
Theoretical and Treatment Models of Social Anxiety
Cognitive behaviour therapy (CBT) is the first-line treatment for social anxiety (Pilling et al., Reference Pilling, Mayo-Wilson, Mavranezouli, Kew, Taylor and Clark2013). While the main evidence-based CBT tools for social anxiety include exposure, cognitive restructuring, social skills training and relaxation training, standard treatment almost always includes exposure as a key component (Heimberg, Reference Heimberg2002).
The therapist and the client typically generate a hierarchy of social situations to use in gradual in vivo or imaginal exposure (Deacon & Abramowitz, Reference Deacon and Abramowitz2004; Rodebaugh, Holaway, & Heimberg, Reference Rodebaugh, Holaway and Heimberg2004). In vivo exposure involves direct confrontation of actual feared stimuli, whereas imaginal exposure involves visualising feared situations (Olatunji, Cisler, & Deacon, Reference Olatunji, Cisler and Deacon2010). The client gradually confronts each situation, from least to most feared, and engages with each item until anxiety decreases (Rodebaugh et al., Reference Rodebaugh, Holaway and Heimberg2004).
There are two prevailing theoretical models related to learning that explain how exposure therapy reduces anxiety (Abramowitz, Reference Abramowitz2013). Emotional processing theory (Foa & Kozak, Reference Foa and Kozak1986) and the inhibitory learning model (Craske et al., Reference Craske, Kircanski, Zelikowsky, Mystkowski, Chowdhury and Baker2008) both postulate that exposure allows individuals to learn corrective information about a feared stimulus. Emotional processing theory specifically postulates that feared stimuli activate a fear structure (Foa & Kozak, Reference Foa and Kozak1986). When corrective information is incompatible with this fear structure, it is replaced with a new, non-fear structure (Foa & Kozak, Reference Foa and Kozak1986). However, the inhibitory learning model emphasises tolerating rather than replacing fear (Craske et al., Reference Craske, Kircanski, Zelikowsky, Mystkowski, Chowdhury and Baker2008). It posits that while old, fear-based learning is not erased by extinction, new learning can inhibit its expression (Craske et al., Reference Craske, Kircanski, Zelikowsky, Mystkowski, Chowdhury and Baker2008).
A large body of research supports the efficacy of in vivo and imaginal exposure treatments for reducing symptoms of social anxiety, although the methods do not work for all individuals with social anxiety (e.g., Acarturk, Cuijpers, van Straten, & de Graaf, Reference Acarturk, Cuijpers, van Straten and de Graaf2009; Feske & Chambless, Reference Feske and Chambless1995; Gould, Buckminster, Pollack, Otto, & Massachusetts, Reference Gould, Buckminster, Pollack, Otto and Massachusetts1997; Powers, Sigmarsson, & Emmelkamp, Reference Powers, Sigmarsson and Emmelkamp2008; Turner, Beidel, & Jacob Reference Turner, Beidel and Jacob1994).
Virtual Reality Exposure Therapy
In recent years, exposure therapy through virtual reality has gained substantial attention as an intervention for social anxiety (Powers & Emmelkamp, Reference Powers and Emmelkamp2008; Wallach, Safir, & Bar-Zvi, Reference *Wallach, Safir and Bar-Zvi2009). Virtual reality technology integrates computer graphics, visual displays, motion tracking and other sensory devices to give the user a multisensory and realistic experience (Bush, Reference Bush2008; Krijn, Emmelkamp, Olafsson, & Biemond, Reference Krijn, Emmelkamp, Olafsson and Biemond2004; Powers & Emmelkamp, Reference Powers and Emmelkamp2008). A head-mounted display is typically used to immerse clients in the virtual environment (Krijn et al., Reference Krijn, Emmelkamp, Olafsson and Biemond2004).
During virtual reality exposure therapy (VRET), the client confronts computer-generated simulations of feared situations (Anderson et al., Reference *Anderson, Price, Edwards, Obasaju, Schmertz, Zimand and Calamaras2013). Trained therapists conduct the treatment in a private, safe, and controlled environment (Bush, Reference Bush2008). Virtual technology is programmable, and environments can be customised to clients’ specific social anxieties, in accordance with their fear and avoidance hierarchy (Krijn et al., Reference Krijn, Emmelkamp, Olafsson and Biemond2004; Vanni et al., Reference Vanni, Conversano, Del Debbio, Landi, Carlini, Fanciullacci and Dell'Osso2013).
VRET may be useful in addressing the shortcomings of established methods of exposure, particularly in relation to cost-effectiveness, convenience, treatment acceptability, treatment availability, and difficulties with clients visualising scenes during imaginal exposure (Anderson et al., Reference *Anderson, Price, Edwards, Obasaju, Schmertz, Zimand and Calamaras2013; Choy, Fyer, & Lipsitz, Reference Choy, Fyer and Lipsitz2007; Krijn et al., Reference Krijn, Emmelkamp, Olafsson and Biemond2004). Furthermore, VRET offers an appealing and novel treatment approach, and may be useful for those who show reluctance toward participating in vivo or imaginal exposure (Benedek & Wynn, Reference Benedek and Wynn2016; Bush, Reference Bush2008). Because of these advantages, VRET might have the potential to lead individuals to seek treatment who otherwise might not do so (Powers & Emmelkamp, Reference Powers and Emmelkamp2008).
The Efficacy of Virtual Reality Exposure Therapy for Social Anxiety
To date, three meta-analyses have explored the efficacy of VRET for a range of anxiety disorders (Opriş et al., Reference Opriş, Pintea, García-Palacios, Botella, Szamosközi and David2012; Parsons & Rizzo, Reference Parsons and Rizzo2008; Powers & Emmelkamp, Reference Powers and Emmelkamp2008). One other meta-analysis (Kampmann, Emmelkamp, & Morina, Reference Kampmann, Emmelkamp and Morina2016) investigated the efficacy of treating social anxiety with a variety of technological interventions, including VRET.
Parsons and Rizzo (Reference Parsons and Rizzo2008) investigated the pre-post effects of VRET for social phobia and reported a meta-analytic effect size of 0.96, 95% CI [0.34, 1.59], indicating a reduction in anxiety symptoms following VRET. However, the authors only analysed results for VRET conditions and did not compare their findings to waitlist control groups or standard treatments, making it difficult to determine the relative efficacy of VRET. In contrast, Powers and Emmelkamp (Reference Powers and Emmelkamp2008) did make a comparison between VRET and control conditions for two social phobia studies. They reported a between-groups, meta-analytic Hedges’ g of 0.73 (no reported confidence interval), indicating that VRET was more efficacious than control conditions in the treatment of social anxiety. The meta-analysis combined waitlist control conditions and standard exposure control conditions in one meta-analysis, making the results hard to interpret.
More recently, Opriş et al. (Reference Opriş, Pintea, García-Palacios, Botella, Szamosközi and David2012) and Kampmann, Emmelkamp, and Morina (Reference Kampmann, Emmelkamp and Morina2016) examined the efficacy of VRET compared to waitlist controls. Opriş et al. (Reference Opriş, Pintea, García-Palacios, Botella, Szamosközi and David2012) reported a d of 1.01, 95% CI [0.69, 1.33] across three social phobia studies, indicating VRET outperformed waitlist on outcome measures of social anxiety. Kampmann, Emmelkamp, and Morina (Reference Kampmann, Emmelkamp and Morina2016) reported a similarly large and significant effect size across three studies, with g = 0.82, 95% CI [0.13, 1.51]. Both authors also compared VRET to standard, empirically supported treatments for social anxiety, including in vivo and imaginal exposure. Opriş et al. (Reference Opriş, Pintea, García-Palacios, Botella, Szamosközi and David2012) reported a non-significant effect size in favour of in vivo and imaginal exposure (d = 0.13, 95% CI [−0.11, 0.38] for three social phobia studies, suggesting that VRET and standard treatments had comparable efficacy. Kampmann, Emmelkamp, and Morina (Reference Kampmann, Emmelkamp and Morina2016) reported similar non-significant findings in favour of VR in comparison to empirically supported treatments across three studies, with g = −0.24, 95% CI [−0.71, 0.23]. A difference between these two meta-analyses was that Kampmann, Emmelkamp, and Morina (Reference Kampmann, Emmelkamp and Morina2016) restricted their analysis to randomised control trials and participants with diagnosed social anxiety disorder, whereas Opriş et al. (Reference Opriş, Pintea, García-Palacios, Botella, Szamosközi and David2012) did not require participants to have a clinical diagnosis and included studies with various methodological designs (e.g., non-random, quasi-random).
In each of these meta-analyses, researchers examined the efficacy of VRET for social anxiety by including it as a subcategory of a larger analysis. Within these subanalyses, the number of studies on social anxiety ranged from two to four, and the total number of participants ranged from 50 to 216. Moreover, the researchers included some small studies with low participant numbers. When compared to bigger studies, smaller studies often show larger and different treatment effects (Sterne, Gavaghan, & Egger, Reference Sterne, Gavaghan and Egger2000). Further, small studies are regularly selected for publication because of their statistically significant results (Sterne et al., Reference Sterne, Gavaghan and Egger2000). This phenomenon contributes to publication bias (publishing only favourable results) and can therefore affect the generalisability of effect sizes in meta-analysis (Sterne et al., Reference Sterne, Gavaghan and Egger2000). Although Kampmann, Emmelkamp, and Morina (Reference Kampmann, Emmelkamp and Morina2016) acknowledged the issue of publication bias in the report of their meta-analysis, they could not examine its influence on effect sizes in their VRET analysis because of the low number of studies included.
Individual studies considered in the reviewed meta-analyses investigated the efficacy of VRET for social anxiety by assessing participants’ social anxiety symptomatology with various outcome measures, such as the Liebowitz Social Anxiety Scale (Liebowitz, Reference Liebowitz1987), which has high levels of reliability and validity (Heimberg et al., Reference Heimberg, Horner, Juster, Safren, Brown, Schneier and Liebowitz1999), and behavioural measures, such as total time speaking, which have face validity.
In sum, previous meta-analytic studies of the effects of VRET for social anxiety have had two main deficiencies: a very low number of studies and a lack of evaluation of publication bias. While a meta-analysis only requires a minimum of two studies (Valentine, Pigott, & Rothstein, Reference Valentine, Pigott and Rothstein2010), increasing this number tends to enhance the generalisability of results (Schmidt & Hunter, Reference Schmidt and Hunter2014).
Aims and Hypotheses of the Present Study
The overall objective of the present study was to examine, through two meta-analyses, the efficacy of VRET for reducing symptoms of social anxiety. We aimed to improve on prior analyses by employing a more methodologically rigorous design. We further aimed to consider the impact of publication bias in order to improve the precision of effect size estimates. First, we assessed the efficacy of VRET compared to a waitlist control. Second, we compared the efficacy of VRET to the standard treatments of in vivo or imaginal exposure. We tested the following hypotheses in two separate meta-analyses:
H1:
Virtual reality exposure therapy would demonstrate greater efficacy in reducing social anxiety than a waitlist control condition.
H2:
The standard treatments of in vivo or imaginal exposure would demonstrate greater efficacy in reducing social anxiety when compared to virtual reality exposure therapy.
Method
Literature Search
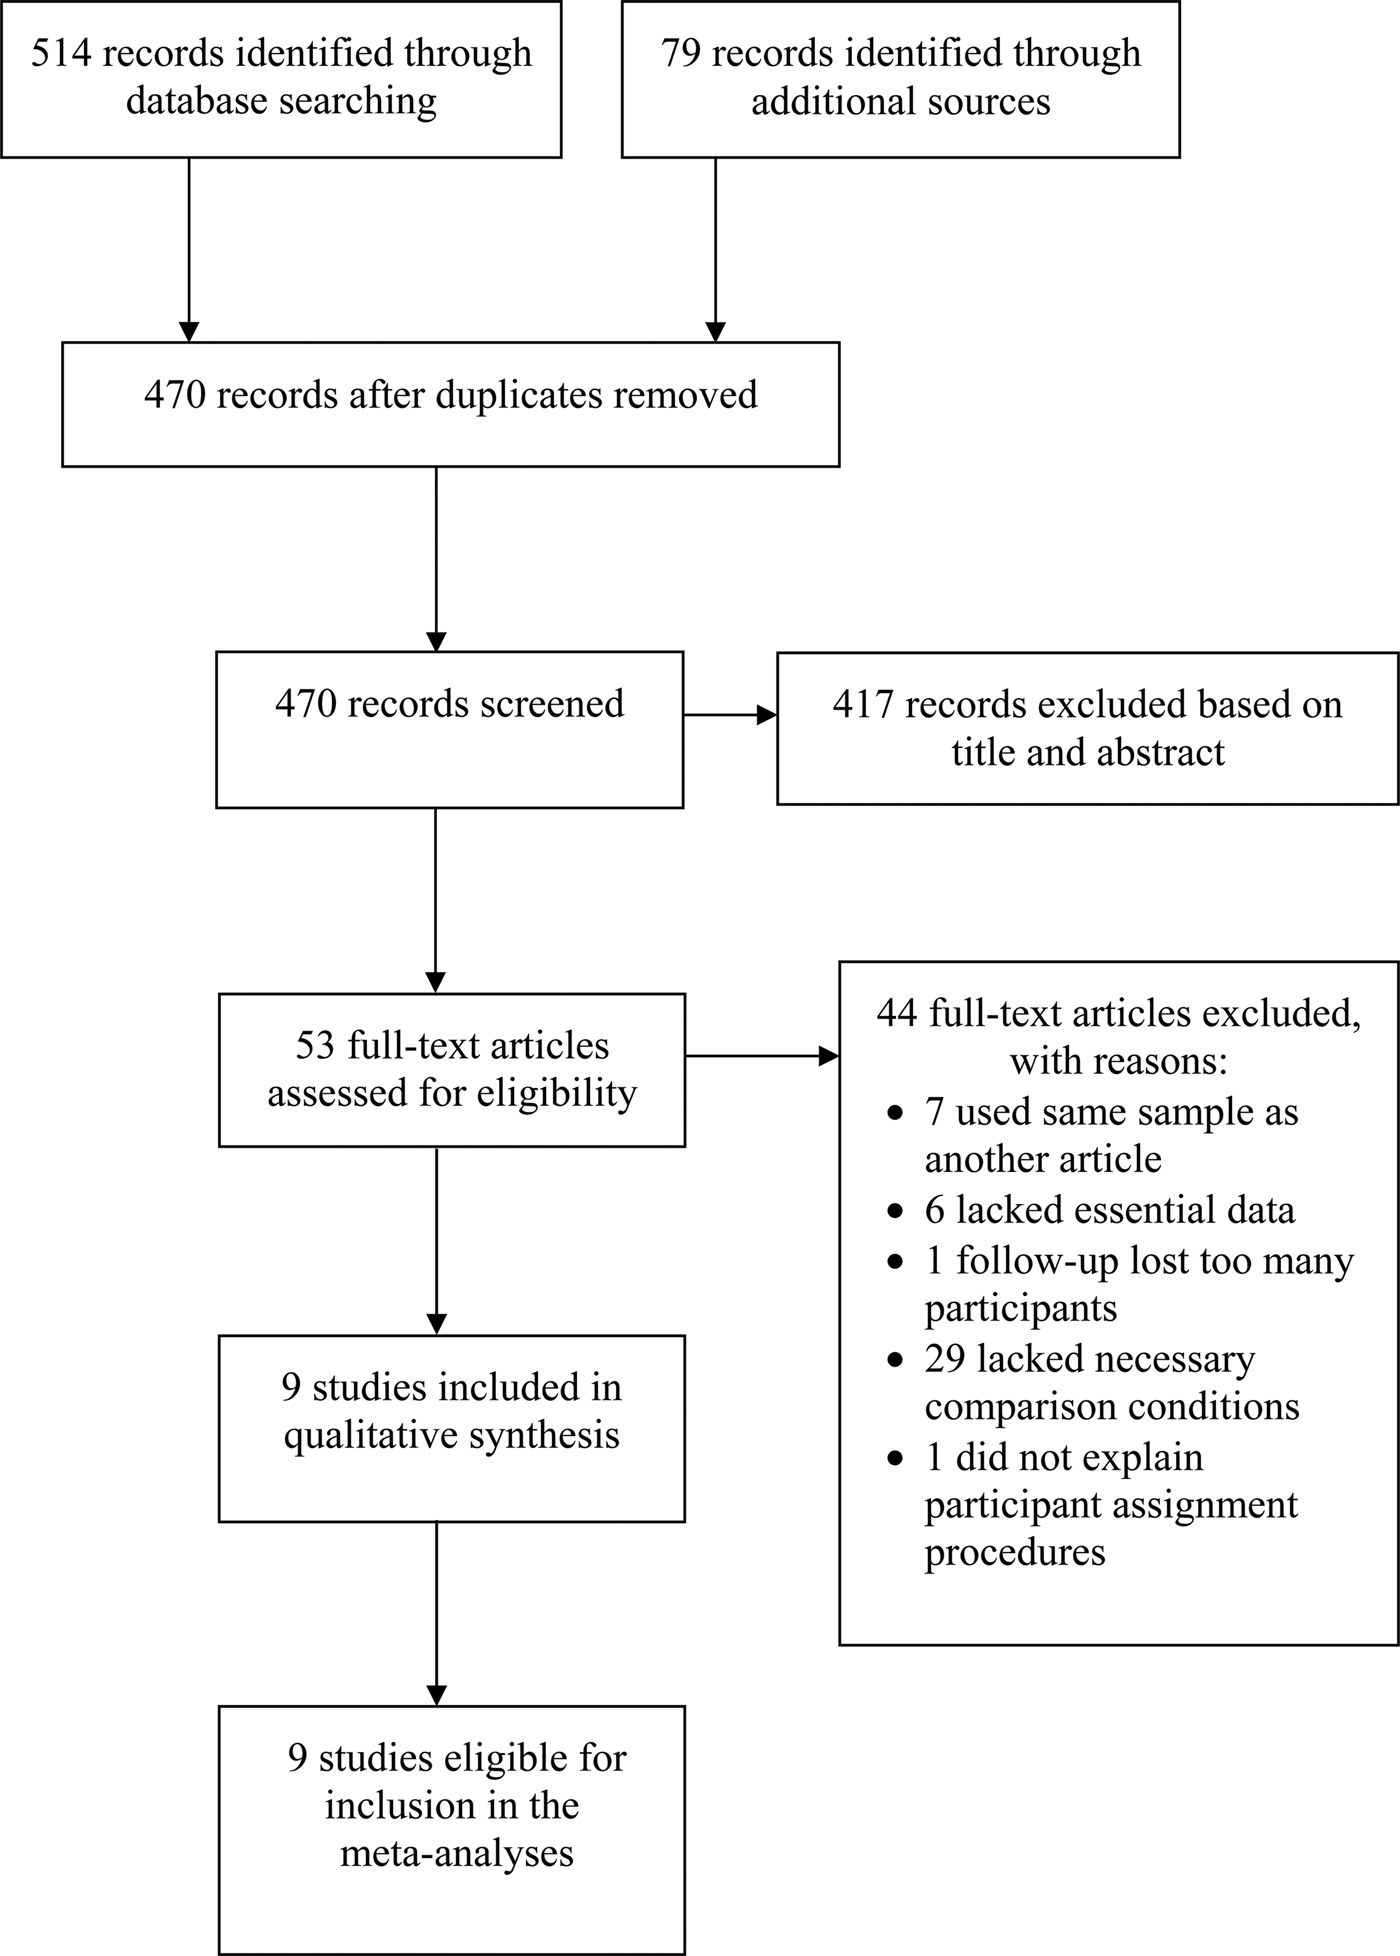
We searched the electronic databases PubMed, EBSCOhost, Proquest Central, PsychINFO and Proquest Dissertations and Theses in July 2017 for published and unpublished studies. We searched the databases using Boolean operators to link the search terms and phrases ‘virtual reality exposure therapy’ or ‘VRET’ or ‘virtual reality therapy’ or ‘VRT’ and ‘social anxiety’ or ‘social phobia’. We sought studies in Google Scholar by searching in the title using the exact phrases ‘virtual reality exposure therapy’ or ‘virtual reality therapy’, ‘VRT’, or ‘VRET’, and at least one of the terms ‘social’, ‘anxiety’, or ‘phobia’. There were no date limits set on the search. Articles had to be in English. We sought further studies from reference lists of retrieved articles. We wrote to authors of studies included in the meta-analysis to enquire after unpublished studies investigating the effects of VRET on social anxiety. We evaluated studies for inclusion by systematically analysing the title and abstract and then the full text. Figure 1 provides a summary of the search process.
PRISMA 2009 flow diagram.
Inclusion Criteria and Evaluation Process
Studies had to meet the following criteria for inclusion in the meta-analysis: (1) The study must be a well-controlled trial with random assignment, quasi-random assignment or participant matching procedures that minimise bias. (2) The study must not use the same sample as another study. (3) The study report must be in English. (4) The study must have a VRET condition and at least one comparison condition, which is a waitlist or an exposure treatment using in vivo or imaginal exposure. (5) Comparison treatments must not include VRET. (6) The article must provide treatment assessment data for social anxiety symptomatology, such as appropriate reporting of means and standard deviations. (7) Social anxiety must be the main target of the intervention.
We excluded measures not relating directly to social anxiety, such as depression, general anxiety, and quality-of-life scales. Excluding these measures maintained the focus on social anxiety. We used outcome-measure totals rather than subscale values, if researchers reported both. Two studies used the Self-Statements During Public Speaking (Hofmann & DiBartolo, Reference Hofmann and DiBartolo2000) scale, which contains positive and negative subscales. The negative subscale is a direct measure of social anxiety, shows more sensitivity to change than the positive scale, is more highly correlated with social anxiety, and is better able to differentiate between individuals with and without social anxiety (Hofmann & DiBartolo, Reference Hofmann and DiBartolo2000). As a result, we included only the negative subscale in the analysis.
The time of final comparison for each of the two meta-analysis was the latest measured time point during which participants remained in their originally allocated conditions, unless more than half the participants were lost by that time point. If available, we used carry-forward intention-to-treat (ITT) data because it offers a more conservative estimate of treatment outcomes (Gupta, Reference Gupta2011). In ITT, the pretreatment scores of participants who do not complete the postassessment are carried forward to serve as their post-intervention scores.
The authors Heuett and Heuett (Reference *Heuett and Heuett2011) informed us, upon our contacting them, that they randomly assigned participants in their study to treatment conditions but not to the waitlist. The waitlist was comprised of individuals who filled out pretest forms incorrectly or were absent during the baseline assessment. There was evident systematic bias in the participant assignment to this condition. Therefore, we excluded the waitlist conditions from the meta-analysis. Furthermore, the data reported for two of the outcome measures at pretreatment in Heuett and Heuett's imaginal exposure condition were implausible in an absolute sense and inconsistent with the other conditions, likely due to printing errors in the article. Therefore, we excluded from the analysis the results reported for the Willingness to Communicate scale and the Self-Perceived Communication Competence scale.
The results reported in Safir, Wallach, and Bar-Zvi (Reference *Safir, Wallach and Bar-Zvi2012) are the follow-up assessment for Wallach et al. (Reference *Wallach, Safir and Bar-Zvi2009). We used the 1-year data in Safir et al. (Reference *Safir, Wallach and Bar-Zvi2012) for the comparison of VRET and standard treatments. Since the researchers did not assess waitlist at 1 year, we used the 12-week time point for the VRET and waitlist comparison.
We included two studies that used quasi-random assignment to condition and one study that used matching of participants prior to assignment to condition. Wallach et al. (Reference *Wallach, Safir and Bar-Zvi2009) allocated participants to conditions by order of arrival, which is not true random assignment (Torgerson & Torgerson, Reference Torgerson and Torgerson2008). Further, Wallach et al. (Reference *Wallach, Safir and Bar-Zvi2009) used weighted assignment later in the study due to sample attrition, which allowed the researchers to maintain groups of equal size. Harris, Kemmerling, and North (Reference *Harris, Kemmerling and North2002) allocated four counsellor-referred participants straight to the waitlist and randomly assigned the remaining participants. Klinger et al. (Reference *Klinger, Bouchard, Légeron, Roy, Lauer, Chemin and Nugues2005) matched participants on key variables (e.g., age, gender) before assignment to conditions. Despite the lack of random assignment, we considered this a well-controlled trial and included it in the meta-analysis.
Study Coding and Intercoder Agreement
Two of us jointly coded the following information for each study: publication characteristics (author and year of publication); age of participants; nature of the comparison group (treatment with exposure or waitlist); nature of participant assignment; outcome measures for assessing social anxiety symptoms; time from baseline to final comparison of conditions; number of treatment sessions; study results (sample size, pre- and postassessment means and standard deviations); and the effect direction (positive or negative).
The third author independently checked the coding by randomly selecting four studies, which included 25 lines of data (out of a total of 50 lines) and 275 entries. For continuous data entries, we considered an agreement to be a variance of anything less than 5% of the original coded value. The agreement rate was 96%. Where there were disagreements, we made final decisions by consensus.
Statistical Procedure and Data Analysis
We calculated effect sizes using the coded values of the included studies, such as pre- and postassessment means and standard deviations for conditions. We used Hedges’ g, which is closely related to Cohen's (Reference Cohen1988) d, as the unbiased estimate of effect size. We used a random-effects model in the analysis to allow for the possibility that effect sizes between studies differ (Borenstein, Hedges, Higgins, & Rothstein, Reference Borenstein, Hedges, Higgins and Rothstein2010). The Q-value and I 2 assessed heterogeneity across studies. While the Q-value is a significance test, I 2 reports what percentage of total variability across studies in meta-analysis is due to between-study variability rather than to chance. Higgins and Thompson (Reference Higgins and Thompson2002) suggested tentative values of I 2 in which 30% is mild, and exceeding 50% is large. A 95% confidence interval and a p value were computed for each model. We assessed the impact of publication bias using Orwin's (Reference Orwin1983) failsafe N, Duvall and Tweedie's (Reference Duval and Tweedie1998) trim and fill method, and by viewing funnel plots. Negative values of g suggested results favoured standard treatment efficacy, whereas positive values indicated results favoured VRET efficacy. We conducted all analyses using Comprehensive Meta-Analysis (Version 3.3.070, 2014).
We first performed analyses with all studies relevant to each analysis. However, not every study used random assignment. Lacking randomisation makes these studies more susceptible to confounding bias (see Faber, Ravaud, Riveros, Perrodeau, & Dechartres, Reference Faber, Ravaud, Riveros, Perrodeau and Dechartres2016). Randomised control trials are considered the gold standard in research design and provide the best evidence for assessing the efficacy of treatment (Faraoni & Schaefer, Reference Faraoni and Schaefer2016). Further, randomised trials increase the statistical power and precision of estimated effects in meta-analysis (Wetterslev, Thorlund, Brok, & Gluud, Reference Wetterslev, Thorlund, Brok and Gluud2008). So, we conducted a second set of analyses including only trials using random assignment.
Results
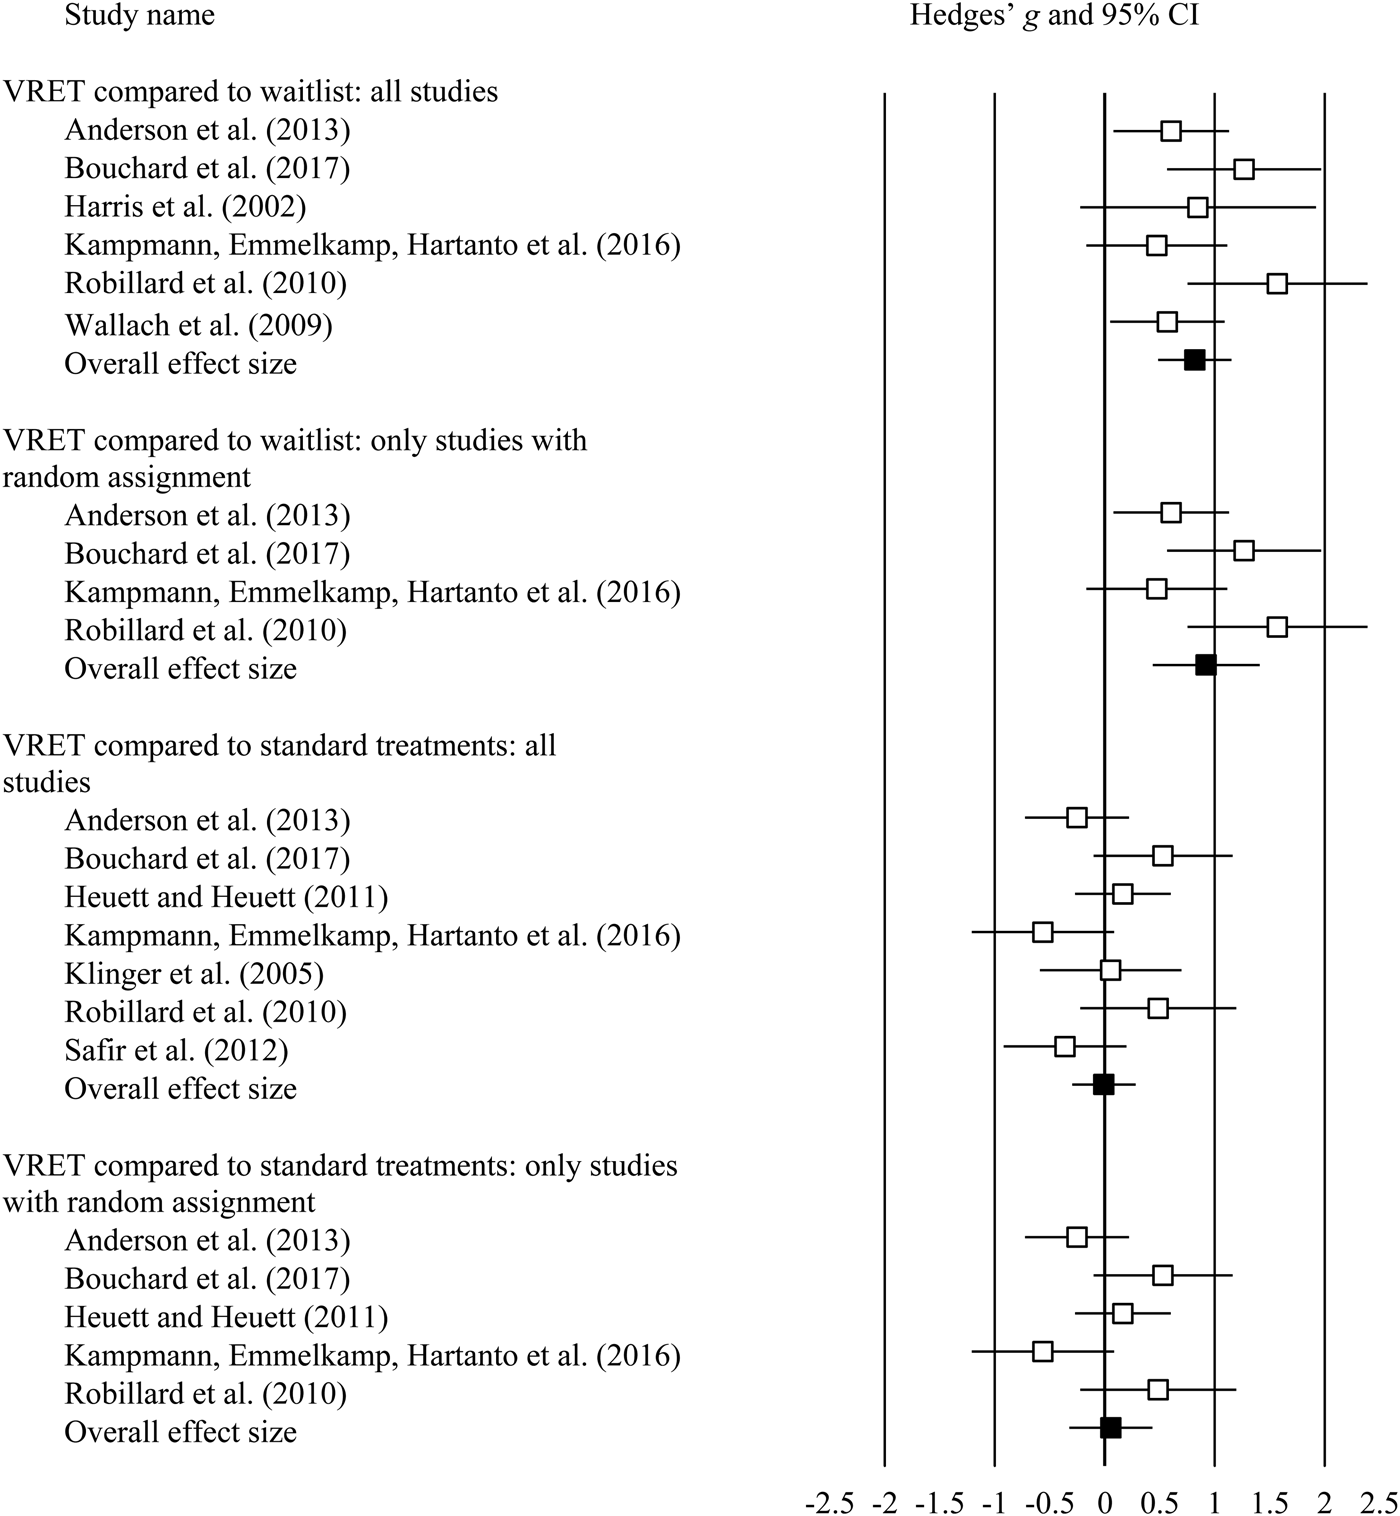
The search strategy resulted in nine relevant studies, with a total of 573 participants. The meta-analysis data file can be obtained by contacting the corresponding author. Table 1 provides a summary of the key characteristics of the included studies. Figure 2 shows: (1) the studies used in the comparison of VRET and waitlist control conditions analysis, and (2) the studies used in the comparison of VRET and in-vivo or imaginal exposure therapy analysis and a forest plot of the effect sizes.
Studies included in each analysis and a forest plot of their effect size estimates. In the forest plot, white boxes represent the measured effect size for each study, and the confidence intervals define the precision of each estimate. Black boxes represent the overall effect summary for each analysis.
Studies Included in Meta-Analyses and Key Characteristics
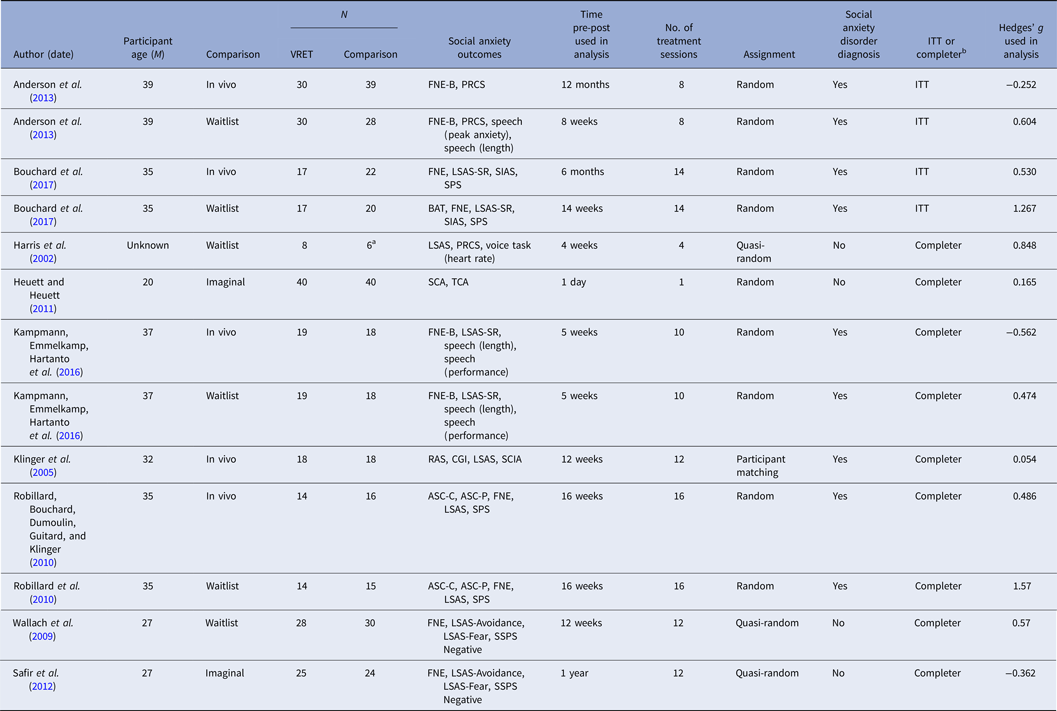
Note: FNE-B = The Fear of Negative Evaluation — Brief Form; PRCS = Personal Report of Confidence as a Speaker; FNE = Fear of Negative Evaluation, LSAS-SR = Leibowitz Social Anxiety Scale — Self-Reported version; SIAS = Social Interaction Anxiety Scale; SPS = Social Phobia Scale; BAT = Behavioural Assessment Task; LSAS = Leibowitz Social Anxiety Scale; SCA = state communication apprehension; TCA = trait communication apprehension; RAS = Rathus Assertiveness Schedule; CGI = Clinical Global Impressions Scale; SCIA = The Questionnaire on Social Contexts Inducing Anxiety; ASC-C = Appraisal of Social Concerns — consequences; ASC-P = Appraisal of Social Concerns — probability; SSPS = Self-Statements During Public Speaking; Completer = Completed post-treatment assessment.
an = 5 for voice task. bITT = Carry-forward intention-to-treat analysis.
Virtual Reality Exposure Therapy Compared to Waitlist
Six studies reported results relevant to a comparison of VRET and waitlist control conditions. The overall effect size across the six studies and their 233 participants was significant, with g = 0.82, p < .001, 95% CI [0.49, 1.15]. This finding supported the first research hypothesis that VRET would lead to better outcomes than a waitlist control. A Q-value of 7.40, df(5), p = .193, indicated no significant heterogeneity across the studies. Hence, moderator analyses would be inappropriate. The I 2 value of 32.40 suggested that 32% of variance was due to heterogeneity across studies rather than to chance.
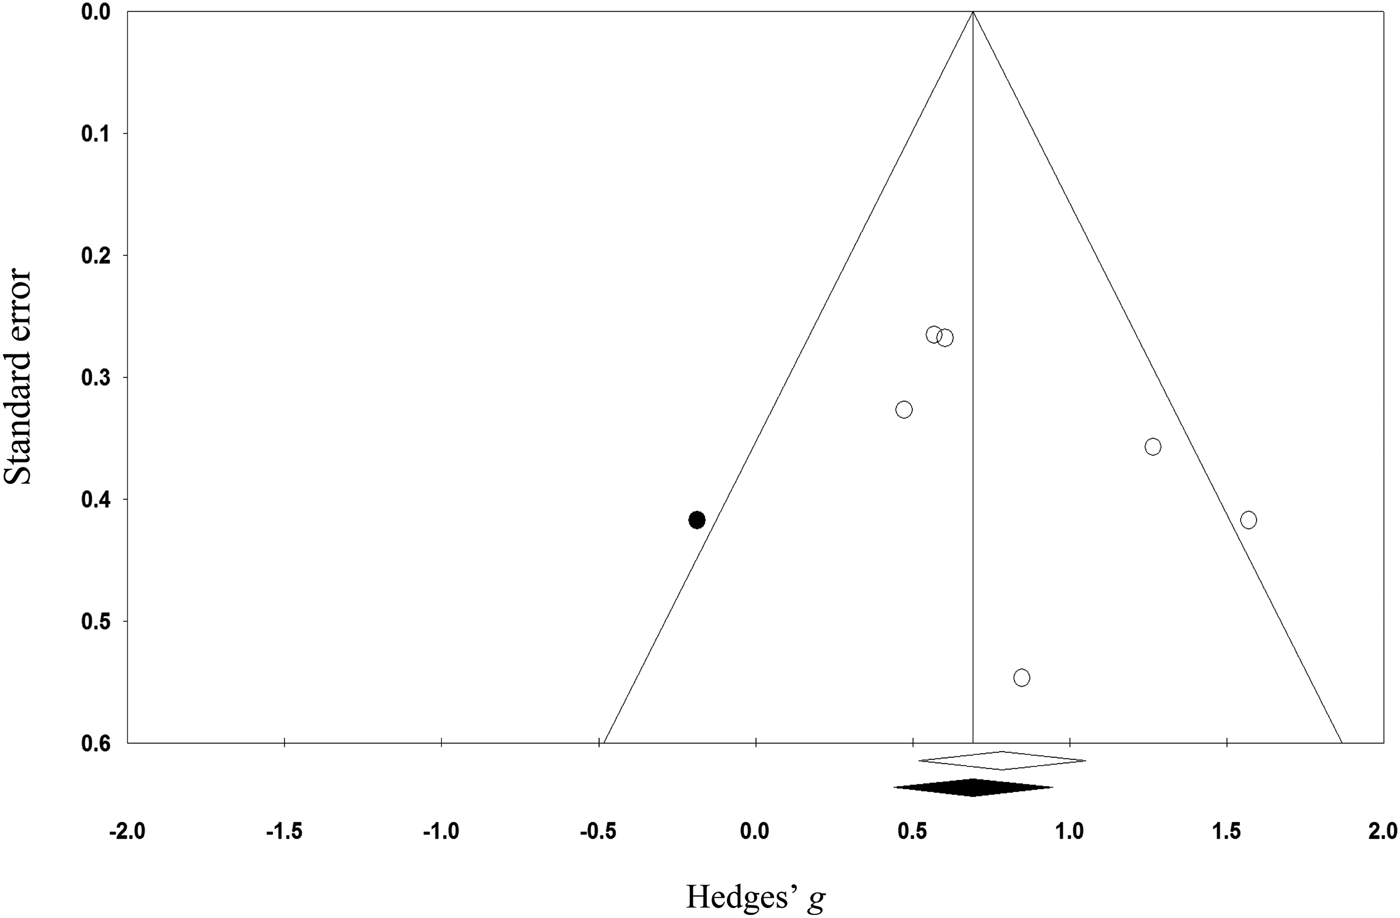
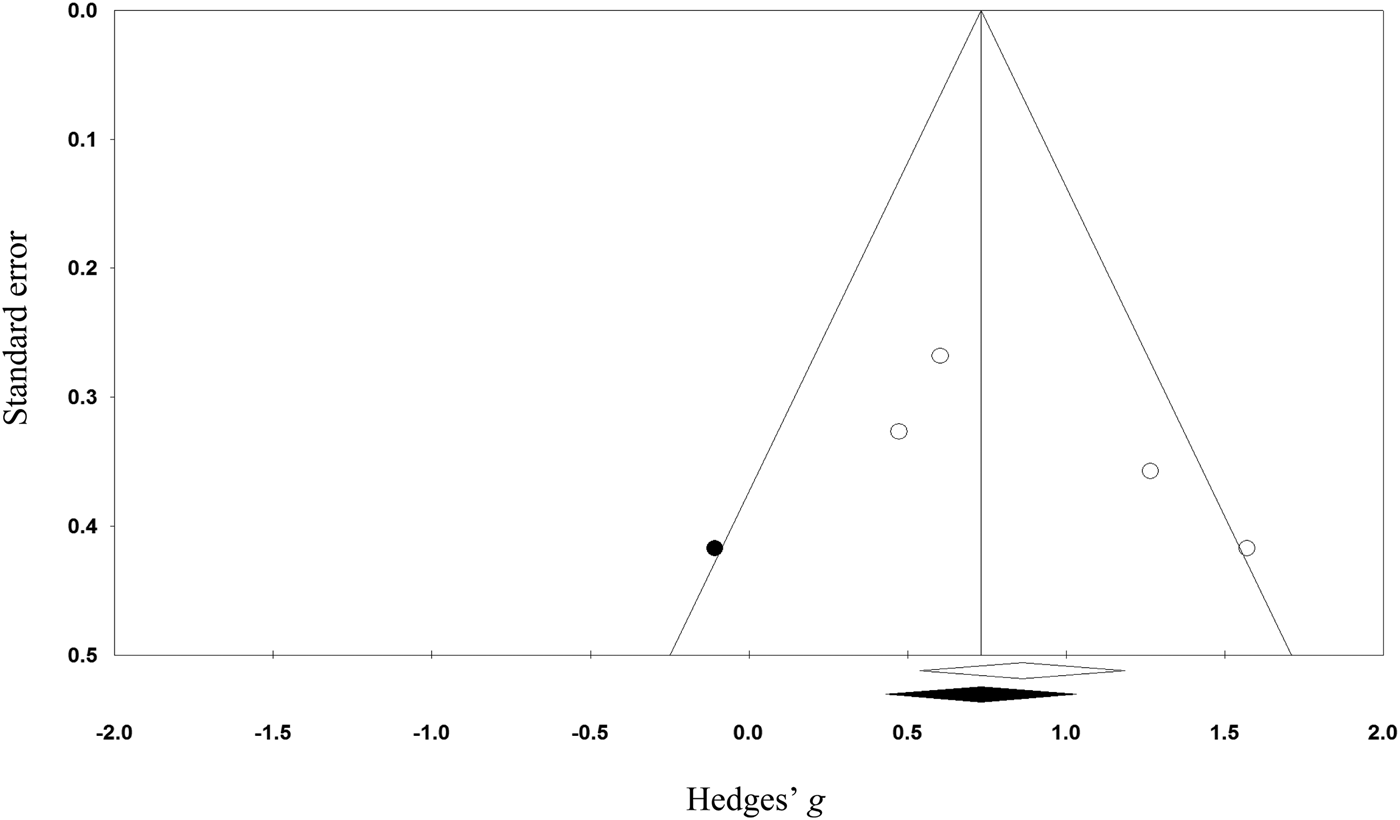
The funnel plot (Figure 3) showed moderate asymmetry of effect sizes for the six studies, suggesting potential publication bias. Duvall and Tweedie's (Reference Duval and Tweedie1998) trim and fill also indicated publication bias and corrected for this by adding one missing study to the plot, leading to an adjusted effect size of g = 0.71, 95% CI [0.34, 1.09]. Orwin's fail-safe N indicated that it would take 18 missing studies with g = 0 to bring the overall effect size down to a trivial level (trivial g = 0.2).
Funnel plot showing study effect sizes and standard error. White circles represent the six studies included in the analysis. The black circle shows the imputed study.
With the analysis limited to the four studies with random assignment, the overall effect size across a total of 161 participants was significant, with g = 0.92, p < .001, 95% CI [0.44, 1.41]. A Q-value of 6.51, df(3), p = .089, indicated that the set of studies were not significantly heterogeneous, I 2 = 53.90.
With only studies that used random assignment, the funnel plot showed minor to moderate asymmetry, suggesting some publication bias (Figure 4). Duvall and Tweedie's (Reference Duval and Tweedie1998) trim and fill indicated bias and imputed one missing study into the funnel plot. Taking this bias into account, the resulting effect size fell to g = 0.76, 95% CI [0.25, 1.27]. Orwin's fail-safe N indicated that it would take 14 missing studies with g = 0 to bring the overall effect size down to a trivial level (trivial g = 0.2).
Funnel plot of effect sizes and standard error in the analysis of studies using random assignment. White circles represent included studies. The black circle shows the imputed study.
Virtual Reality Exposure Therapy Compared to Standard Treatments
There were seven studies and a total of 340 participants included in the analysis of all studies comparing VRET to in vivo or imaginal exposure. The overall effect was in the direction of standard treatments; however, the effect size was extremely small and non-significant, with g = −0.01, p = .955, 95% CI [−0.30, 0.28]. A Q-value of 10.68, df(6), p = .099, I 2 = 43.83, indicated no significant heterogeneity across the studies. Hence, moderator analyses would be inappropriate.
When only considering studies with random assignment, the overall effect across five studies and 255 participants was in favour of VRET, with g = 0.06, p = .770, 95% CI [−0.32, 0.43]. The studies were not significantly heterogeneous, Q = 8.95, p = .062, I 2 = 55.31.
There were similar results in publication bias analyses for the seven studies and for the five studies that used random assignment. There was no asymmetry detected in the funnel plots of effect sizes. Further, Duvall and Tweedie's (Reference Duval and Tweedie1998) trim and fill did not impute any missing studies. Orwin's failsafe N analysis was not useful because the Hedges’ g values were already in the trivial category.
Discussion
Nine well-controlled trials provided information about the efficacy of VRET for treating social anxiety. The results of the first meta-analysis, consisting of six studies and 233 participants, showed a medium-to-large, significant overall effect size, indicating that VRET was more efficacious than waitlist. This finding provided support for the first hypothesis, that VRET is efficacious. Results of the second meta-analysis, consisting of seven studies and 340 participants, showed no significant differences in effect sizes when comparing VRET to in vivo or imaginal exposure. This finding did not support the second hypothesis, which was that the usual exposure treatment would be more efficacious than VR exposure treatment. Analyses including only trials with random assignment produced similar results for both hypotheses.
Virtual Reality Exposure Therapy Compared to Waitlist
The results indicated that VRET is superior to waitlist conditions in reducing symptoms of social anxiety. This finding was consistent with smaller past meta-analyses by Opriş et al. (Reference Opriş, Pintea, García-Palacios, Botella, Szamosközi and David2012) and Kampmann, Emmelkamp, and Morina (Reference Kampmann, Emmelkamp and Morina2016). The present results indicate that VRET tends to reduce symptoms of social anxiety. Further, the findings provide support for the extinction aspect of learning theory, for the corrective learning element of emotional processing theory (Foa & Kozak, Reference Foa and Kozak1986), and for the inhibitory learning model (Craske et al., Reference Craske, Kircanski, Zelikowsky, Mystkowski, Chowdhury and Baker2008).
This study was the first to address publication bias when considering VRET for social anxiety. In the comparison between VRET and waitlist, results showed that effect sizes went from large to medium when taking this bias into account, suggesting there was some initial overestimation of the overall effect size. A lack of investigation into publication bias in previous research raises questions about the validity of their findings, and the adjusted effect size of the present meta-analysis could be a more accurate reflection of the effect. Clinicians frequently use meta-analyses as a resource to determine best treatment options for clients (Petitti, Reference Petitti2000), and the present study's findings may provide a more methodologically sound basis for informing treatment decisions.
Virtual Reality Exposure Therapy Compared to Standard Treatments
The results obtained from this set of studies showed no significant difference in effect sizes between VRET and in vivo or imaginal exposure. This finding is in line with results of the meta-analyses of Kampmann, Emmelkamp, and Morina (Reference Kampmann, Emmelkamp and Morina2016) and Opriş et al. (Reference Opriş, Pintea, García-Palacios, Botella, Szamosközi and David2012). While the results suggest that there is no significant advantage to using one treatment approach over another, the non-significant difference between these two conditions does not by itself prove a lack of difference. Rather, it indicates that studies to date do not collectively show that VRET is less effective than standard treatments for social anxiety.
The fact that the second hypothesis was not supported might be explained by the ‘dodo bird conjecture’, which postulates that when bona fide psychotherapies are compared, they produce equivalent outcomes (Wampold et al., Reference Wampold, Mondin, Moody, Stich, Benson and Ahn1997). Moreover, Wampold et al. (Reference Wampold, Mondin, Moody, Stich, Benson and Ahn1997) reported smaller differences in effect when comparing treatments belonging to the same conceptual category of treatment, than to treatments belonging to dissimilar categories. Considering in vivo exposure, imaginal exposure, and VRET contain common features inherent to the category of exposure-based behavioural interventions (Oskam, Reference Oskam2005), similarity of treatment effects found in the present meta-analysis is in line with Wampold's (Reference Wampold, Mondin, Moody, Stich, Benson and Ahn1997) findings. Common factors could also explain the negligible difference between these exposure therapies (Drisko, Reference Drisko2004). Common factor models posit that if psychotherapies are equally efficacious, it is due to essential ingredients that they all share (e.g., therapeutic alliance, placebo effects) rather than the unique elements of the therapy (Drisko, Reference Drisko2004; Imel & Wampold, Reference Imel, Wampold, Brown and Lent2008).
The results of the present two meta-analyses indicate that VR exposure treatment tends to be efficacious, with no significant evidence that it leads to less benefit than the usual treatments of in vivo and imaginal exposure. These results may be useful for clients and clinicians seeking evidence to inform treatment decisions.
The present results add to prior meta-analyses of the efficacy of VRET for social anxiety by: (1) including about double the number of studies, (2) adjusting for publication bias, and (3) reporting results for both RCTs and for all well-controlled studies. These advantages make the results more reliable and generalisable.
Study Limitations
Despite including more studies than previous investigations, this analysis was still based on a small number of studies. It is possible, despite our comprehensive search process, that additional studies exist that are relevant to the present meta-analysis. Including the results might lead to different results. However, Orwin's failsafe N indicates that many studies with no effect would have to be included to change the conclusion about the effects of VRET compared to no treatment.
Future Directions
The potential benefits of VRET signify a need for additional high-quality trials investigating its optimal application as an intervention for social anxiety. Adding more studies with increased methodological rigour to the existing body of research would assist with improving the generalisability of findings. Researchers could maximise the usefulness of future studies by conducting randomised control trials, using large sample sizes, including follow-up data, and using well-validated measures of social anxiety outcomes. Increasingly realistic and multifaceted virtual reality technology offers the opportunity to research how to maximise the beneficial use of virtual reality in reducing social anxiety.
VR exposure treatment has potential advantages over the usual exposure in vivo or in imagery. These potential advantages include greater acceptability, along with easier provision for some clients of varied social situations than is possible in vivo or in imagery. In the future, researchers could compare the willingness of socially anxious individuals to seek or to accept VRET compared to other types of exposure treatments. This matter is important because so few socially anxious individuals ever seek treatment (Crome et al., Reference Crome, Grove, Baillie, Sunderland, Teesson and Slade2015; Fehm et al., Reference Fehm, Pelissolo, Furmark and Wittchen2005). Finally, researchers could evaluate the effects of VR exposure without therapist involvement. Such intervention, possibly delivered through inexpensive mobile phone applications and using inexpensive VR hardware, could provide a new, valuable option to individuals who are too socially anxious to seek professional help or who live far from expert therapists.


