

Implications
This study explores conservation and development strategies for local cattle breeds based on farmer surveys. Quantified strengths, weaknesses, opportunities and threats can be used as an ideal basis to form objective strategies at breed level. This combined approach results in promising strategies even with a limited stakeholder approach. Described approach represents farmers’ individual convenience better than existing quantitative strategy decision tools on their own.
Introduction
Many local breeds have been replaced by high-yielding breeds over the last few centuries, resulting in loss of local breeds (Meuwissen, Reference Meuwissen2009; FAO, 2010). Due to this breeding history, populations of many local breeds have dangerously decreased and some of them are even threatened by extinction (Fernández et al., Reference Fernández, Meuwissen, Toro and Mäki-Tanila2011). By now two local cattle breeds from Northern Germany are listed as endangered livestock breeds by ‘The Society for the Conservation of Old and Endangered Livestock Breeds’. Both breeds are red cattle breeds with a milk-emphasised dual purpose, namely the German Angler (GA) and the Red Dual-Purpose cattle (RDP). According to Meuwissen (Reference Meuwissen2009), the best conservation strategies are an increased profitability achieved by genetic improvements and the promotion of breed-specific products. The FAO (2010) suggests a guideline to develop breeding strategies for the sustainable management of animal genetic resources also based on the implementation of effective genetic gain programs. However, Martín-Collado et al. Reference Martín-Collado, Díaz, Mäki-Tanila, Colinet, Duclos, Hiemstra and Gandini(2013) explore conservation and development strategies for local European cattle breeds, which focused production systems and the marketing of new products. Thus, considered aspects in case of effective conservation strategies may be more widespread than just prioritising genetic gain. Furthermore, strategies embracing many breeds should refer to general issues, whereas specific strategies and actions for single breeds should be identified at breed level (Martín-Collado et al., Reference Martín-Collado, Díaz, Mäki-Tanila, Colinet, Duclos, Hiemstra and Gandini2013). Investigated actions at breed level may be not only convenient for single breeds, but may also inspire the strategy decision process regarding small endangered livestock populations when done by a limited number of stakeholder groups. The aim of the present study was to explore conservation and development strategies at breed level based on quantified strengths, weaknesses, opportunities and threats (SWOT) for two local cattle breeds in Northern Germany.
Material and methods
Data
The data comprised comprehensive questionnaires completed by farmers, who rear one of the two local cattle breeds, namely either the GA or the RDP breed. Both breeds are local in Schleswig-Holstein, which is the most Northern state of Germany. The initial list of possible respondents consisted of 200 questionnaires (100 per breed) and was selected by the breeding organisation RSH (Rinderzucht Schleswig-Holstein e.G., Germany) due to farmers’ individual breed activity and engagement. The design and sending of the questionnaires as well as the collection of completed surveys were also done by the breeding organisation. In total, 158 farmers (79%) filled out the questionnaires, thereof 78 participants for GA (78%) and 80 participants for RDP (80%). Each questionnaire consisted of a total of 12 queries, open-ended and multiple-choice questions including information on sub-items, such as farm, herd, expectations, reproduction, traits and difficulties as well as handwritten farmers’ personal opinions on the breeds’ SWOT (Supplementary Material S1).
Quantified strategy decision tool
To identify strategies using an organised approach, the FAO (2010) suggested employing the SWOT analysis from Weihrich (Reference Weihrich1982). A SWOT analysis is used to identify SWOT in order to enhance the profitability of an individual production system. This qualitative method has the disadvantage of high subjectivity during its application in decision-making (Hill and Westbrook, Reference Hill and Westbrook1997; Pesonen et al., Reference Pesonen, Kurttila, Kangas, Kajanus and Heinonen2000; Martín-Collado et al., Reference Martín-Collado, Díaz, Mäki-Tanila, Colinet, Duclos, Hiemstra and Gandini2013). Therefore, Kurttila et al. Reference Kurttila, Pesonen, Kangas and Kajanus(2000) and Saaty and Vargas (Reference Saaty and Vargas2001) developed a combination of the Analytic Hierarchy Process (AHP) method, which is a quantitative tool from Saaty (Reference Saaty1980), and the SWOT analysis to obtain more complex and reliable decisions. This hybrid method improves the quantitative information basis and forces the decision-maker to think over and analyse the situation more precisely and in more depth (Kurttila et al., Reference Kurttila, Pesonen, Kangas and Kajanus2000). SWOT-AHP methodology has been applied in the fields of forestry (Kangas et al., Reference Kangas, Pesonen, Kurttila and Kajanus2001), silvopasture adoption (Shreshta et al., Reference Shreshta, Alavalapati and Kalmbacher2004) and livestock (Wasike et al., Reference Wasike, Magothe, Kahi and Peters2011).
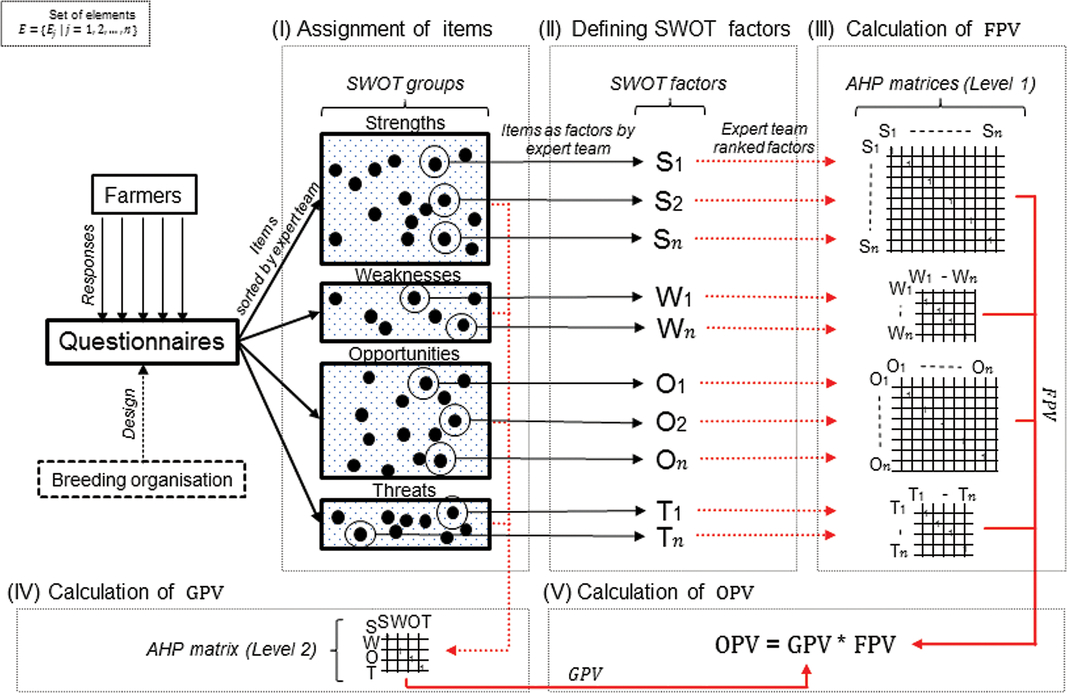
In the current study, the SWOT-AHP was used to quantify identified SWOT. Statistical analyses and computations for eigenvalues, priority vectors and quality control parameters within the SWOT-AHP methodology were performed by using the R-software (R Core Team, 2018). The SWOT-AHP approach was divided into five steps (Figure 1) and is described below:
(I) Assignment of items
The farmers’ responses were allocated as items by an expert team into four single SWOT groups of SWOT. Expert team members were previously identified through the application of certain qualification criteria. These criteria comprised: (1) long-time experiences with both local cattle breeds in practice, (2) deep knowledge of respective production systems and the local environment and (3) profound background in population genetics and management of small populations. In total, four scientists from two German animal breeding departments passed the qualification criteria, and thus, formed the team of experts. Experts discussed their attitudes and valuations as soon as they had reached consensus. The number of items and SWOT factors allocated for each SWOT group by the team of experts exhibited substantial flexibility and was allowed to differ between both breeds.
(II) Defining SWOT factors
The farmers’ items were defined as SWOT factors by the expert team (Tables 1 and 2). Generally, the number of SWOT factors within each SWOT group can vary depending on the number of allocated items.
(III) Computation of priority scores for SWOT factors
The computations of the factor priority vector (FPV), the group priority vector (GPV) and overall priority vector (OPV) were performed with AHP rankings by the named expert team above based on the frequency of SWOT factors among farmers. The fundamental scale from Saaty (Reference Saaty1980) was used for such AHP rankings (Table 3). This scale represented a transformation from verbal judgements into numerical judgements to determine the relative importance of each element. There were five verbal judgements, which were ranked by their importance from equal to extreme (equal, moderate, strong, very strong and extreme). These judgements were translated into the numeric values of: 1, 3, 5, 7 and 9 with four intermediate values (2, 4, 6, 8) for compromises in importance. In other words, the scale indicated how important or dominant one element was over another element (Saaty, Reference Saaty2008). The elements for FPV were individual SWOT factors within each SWOT group and for GPV the four single SWOT groups. The elements were ranked within AHP matrices of different levels: Level 1 for the SWOT factors within each SWOT group and Level 2 for the SWOT groups (Figure 1). Kahraman et al. Reference Kahraman, Demirel and Demirel(2007), Borajee and Yakchalie (Reference Boraje and Yakchali2011) and Görener et al. Reference Görener, Toker and Uluçay(2012) defined the set of elements as E={Ej | j=1, 2, …, n}. The results of the n-ranked elements were resumed in an evaluation matrix A (n * n). Each element aij (i, j= 1, 2, …, n) was the quotient of the weights of the elements wij (i, j= 1, 2, …, n). In this matrix, the element aij=1, when the weights of elements wi=wj. The ranked elements were also expressed via a square and reciprocal matrix:
Each matrix was normalised and their relative weights (Aw) were determined. The relative weights were given by the correct eigenvector (w) corresponding to the largest eigenvalue (λ max), as $$\[A=({{a}_{ij}})=\left[ \begin{matrix} 1 \and {{{w}_{1}}}/{{{w}_{2}}}\; \and \cdots \and {{{w}_{1}}}/{{{w}_{n}}}\; \\ {{{w}_{2}}}/{{{w}_{1}}}\; \and 1 \and \cdots \and {{{w}_{2}}}/{{{w}_{n}}}\; \\ \vdots \and \vdots \and \ddots \and \vdots \\ {{{w}_{n}}}/{{{w}_{1}}}\; \and {{{w}_{n}}}/{{{w}_{2}}}\; \and \cdots \and 1 \\ \end{matrix} \right];{{a}_{ij}}=\frac{{{w}_{i}}}{{{w}_{j}}},{{a}_{ij}}\ne 0\]$$
The largest eigenvalue (λ max) was computed by forming the sum of the single normalised eigenvector (w) per row multiplied by the computed priority vector per corresponding column:$${A_w}{} = \lambda _{{\rm{max}}}}{\rm{*}}w$$
If the pairwise comparisons were completely consistent, the matrix A had rank 1 and λ max = n. In this case, weights could be obtained by normalising any of the rows or columns of A. The priority vectors of FPV and GPV were computed by dividing the single normalised eigenvectors (w) per column by the sum of all single normalised eigenvectors per column for the single matrices:$$\lambda _{{\rm{max}}}} = \sum \left( {\mathop \sum \limits_{ij} {w_{\left( {{\rm{row}}} \right)}}*{{\mathop \sum \nolimits_{ij} {w_{\left( {{\rm{column}}} \right)}}} \over {\sum \left( {\mathop \sum \nolimits_{ij} {w_{\left( {{\rm{column}}} \right)}}} \right)}}} \right){\rm{}}$$
It should be noted that the quality of the results was related to the consistency of the comparison judgements. As a quality control, the inconsistency ratio (iCR) of the ranked elements was computed as a ratio between the consistency index (CI) and random index (RI):$${\rm{FPV}}/{\rm{GPV}} = {{\mathop \sum \nolimits_{ij} {w_{\left( {{\rm{column}}} \right)}}} \over {\mathop \sum \left({{\mathop \sum \nolimits_{ij} {w_{\left( {{\rm{column}}} \right)}}} }}\right)$$
The iCR provided information on the inconsistency of the ranked elements. An iCR ≤ 0.1 was acceptable as a criterion (Kahraman et al., Reference Kahraman, Demirel and Demirel2007; Borajee and Yakchali, Reference Boraje and Yakchali2011). Thus, the ranking of the elements had to be repeated by the team of experts when the iCR exceeded this threshold. The CI was computed by using the subsequent formula:$${\rm{iCR}} = {{{\rm{CI}}} \over {{\rm{RI}}}}$$
The RI was defined as an expected value of the CI depending on an individual number of ranked elements n. These fixed values were obtained from the study of Aguarón and Moreno-Jiménez Reference Aguarón and Moreno-Jiménez(2003) for further computations of the CI parameter (Table 4). The authors simulated 100,000 matrices for several sizes of n and calculated standard values for RI.$${\rm{CI}} = {\lambda _{\rm{max}}-{\rm n} \over {\rm n - 1}}$$
$$\[A=({{a}_{ij}})=\left[ \begin{matrix} 1 \and {{{w}_{1}}}/{{{w}_{2}}}\; \and \cdots \and {{{w}_{1}}}/{{{w}_{n}}}\; \\ {{{w}_{2}}}/{{{w}_{1}}}\; \and 1 \and \cdots \and {{{w}_{2}}}/{{{w}_{n}}}\; \\ \vdots \and \vdots \and \ddots \and \vdots \\ {{{w}_{n}}}/{{{w}_{1}}}\; \and {{{w}_{n}}}/{{{w}_{2}}}\; \and \cdots \and 1 \\ \end{matrix} \right];{{a}_{ij}}=\frac{{{w}_{i}}}{{{w}_{j}}},{{a}_{ij}}\ne 0\]$$
The largest eigenvalue (λ max) was computed by forming the sum of the single normalised eigenvector (w) per row multiplied by the computed priority vector per corresponding column:$${A_w}{} = \lambda _{{\rm{max}}}}{\rm{*}}w$$
If the pairwise comparisons were completely consistent, the matrix A had rank 1 and λ max = n. In this case, weights could be obtained by normalising any of the rows or columns of A. The priority vectors of FPV and GPV were computed by dividing the single normalised eigenvectors (w) per column by the sum of all single normalised eigenvectors per column for the single matrices:$$\lambda _{{\rm{max}}}} = \sum \left( {\mathop \sum \limits_{ij} {w_{\left( {{\rm{row}}} \right)}}*{{\mathop \sum \nolimits_{ij} {w_{\left( {{\rm{column}}} \right)}}} \over {\sum \left( {\mathop \sum \nolimits_{ij} {w_{\left( {{\rm{column}}} \right)}}} \right)}}} \right){\rm{}}$$
It should be noted that the quality of the results was related to the consistency of the comparison judgements. As a quality control, the inconsistency ratio (iCR) of the ranked elements was computed as a ratio between the consistency index (CI) and random index (RI):$${\rm{FPV}}/{\rm{GPV}} = {{\mathop \sum \nolimits_{ij} {w_{\left( {{\rm{column}}} \right)}}} \over {\mathop \sum \left({{\mathop \sum \nolimits_{ij} {w_{\left( {{\rm{column}}} \right)}}} }}\right)$$
The iCR provided information on the inconsistency of the ranked elements. An iCR ≤ 0.1 was acceptable as a criterion (Kahraman et al., Reference Kahraman, Demirel and Demirel2007; Borajee and Yakchali, Reference Boraje and Yakchali2011). Thus, the ranking of the elements had to be repeated by the team of experts when the iCR exceeded this threshold. The CI was computed by using the subsequent formula:$${\rm{iCR}} = {{{\rm{CI}}} \over {{\rm{RI}}}}$$
The RI was defined as an expected value of the CI depending on an individual number of ranked elements n. These fixed values were obtained from the study of Aguarón and Moreno-Jiménez Reference Aguarón and Moreno-Jiménez(2003) for further computations of the CI parameter (Table 4). The authors simulated 100,000 matrices for several sizes of n and calculated standard values for RI.$${\rm{CI}} = {\lambda _{\rm{max}}-{\rm n} \over {\rm n - 1}}$$
(IV) Calculation of the GPV
The GPVs were computed for each corresponding SWOT group by the expert team based on the frequency of farmers’ items included in each SWOT group. Computation details for the GPV are described in step III computation of priority scores for SWOT factors.
(V) Calculation of the OPV
However, the OPVs were calculated by multiplying the single FPVs of the single SWOT factors with the corresponding GPVs of each SWOT group:
The number of computed OPVs should correspond with the number of computed FPVs.$${\rm{OPV}} = {\rm{GPV*FPV}}$$


Methodical implementation of AHP based on farmer surveys for local cattle breeds. SWOT=strengths weaknesses opportunities threats; AHP=Analytic Hierarchy Process; GPV=group priority vector; FPV=factor priority vector; OPV=overall priority vector.
Priority scores of ranked SWOT factors for GA
SWOT=strengths weaknesses opportunities threats; GA= German Angler; GPV=group priority vector; FPV=factor priority vector; OPV=overall priority vector.
Priority scores of ranked SWOT factors for RDP
SWOT=strengths weaknesses opportunities threats; RDP=Red Dual-Purpose cattle; GPV=group priority vector; FPV=factor priority vector; OPV=overall priority vector.
Fundamental scale to determine the relative importance of each element for the German Angler and Red Dual-Purpose cattle by Saaty Reference Saaty(1980) and Yüksel and Dağdeviren Reference Yüksel and Dağdeviren(2007)
Fixed values of RI dependent on the size of matrices to obtain strategy consistency for the German Angler and Red Dual-Purpose cattle by Aguarón and Moreno-Jiménez Reference Aguarón and Moreno-Jiménez(2003)
n=ranked elements; RI=random index.
Conservation and development strategies at breed level
In general, SWOT strategies embracing single breeds should be identified at breed level (Martín-Collado et al., Reference Martín-Collado, Díaz, Mäki-Tanila, Colinet, Duclos, Hiemstra and Gandini2013) and not just from a selected team of experts. Especially, in small endangered populations the number of experts or stakeholders is limited and a multi-stakeholder approach for single local breeds may be not achievable. Thus, identified strategies can be misleading. Furthermore, the identification of SWOT factors is often unbalanced (Karppi et al., Reference Karppi, Kokkonen and Lähteenmäki-Smith2001) and a multi-stakeholder approach was preferred in several studies to avoid subjectivity (Impoinvil et al., Reference Impoinvil, Ahmad, Troyo, Keating, Githeko, Mbogo, Kibe, Githure, Gad, Hassan, Orshan, Warburg, Calderón-Arguedas, Sánchez-Loria, Velit-Suarez, Chadee, Novak and Beier2007; Martín-Collado et al., Reference Martín-Collado, Díaz, Mäki-Tanila, Colinet, Duclos, Hiemstra and Gandini2013). Quantified SWOT have been identified by applying the quantified strategy decision tool of SWOT-AHP in the step before. To improve the limited amount of stakeholder groups, quantified SWOT factors with the three highest OPVs per SWOT group were comprehensively discussed face-to-face with unbiased representatives of further stakeholder groups, that is, farmers, breeders and staff of the breeding organisation (breeding board). Face-to-face discussions were performed in one group meeting with the following respective representatives: 3 (farmers), 3 (breeders) and 3 (breeding board) per breed. All representatives were equally weighted and discussed their attitudes as soon as they had reached consensus. Then promising conservation and development strategies at breed level were collectively transformed together. This formation process was refereed and protocolled by the expert team.
Results
Quantified strategy decision tool
Farmer surveys were allocated by the expert team and resulted in a total of 87 items, whereby 42 belonged to GA farmers and 45 to RDP farmers. For GA, all 42 items were divided and 15 items were subsequently sorted into the SWOT group of strengths, 7 items into weaknesses, 12 into opportunities and 8 into threats (Table 1 and Figure 2(a)). For RDP, all 45 items were divided and assigned as amounts of 16, 6, 14 and 9 into strengths, weaknesses, opportunities and threats, respectively (Table 2 and Figure 2(a)). The strengths comprised the highest number of items, whereas the weaknesses contained the lowest number of items for both breeds.
(a) Frequency of allocated items and (b) computed GPV via SWOT group for GA and RDP. SWOT=strengths weaknesses opportunities threats; GA=German Angler; RDP=Red Dual-Purpose cattle; GPV=group priority vector.
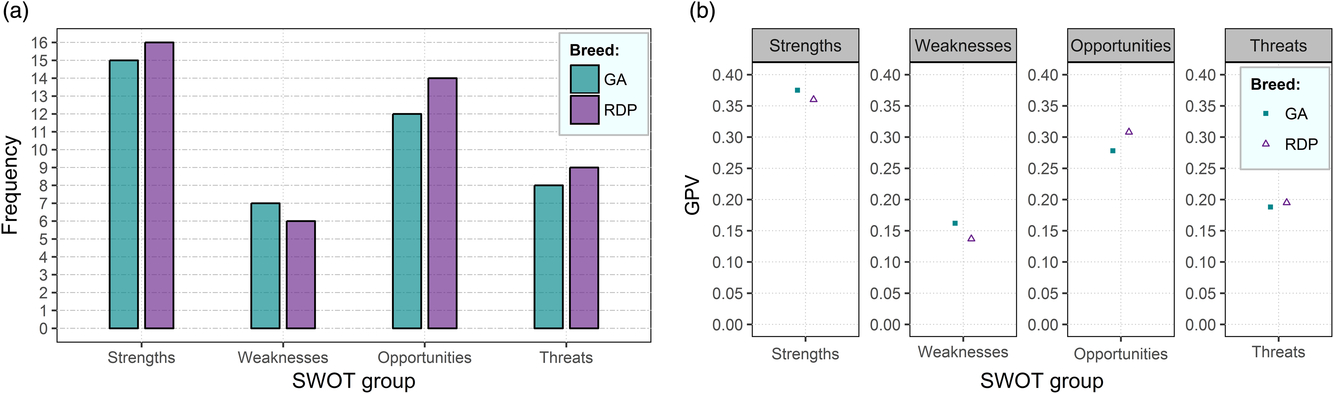
The three highest FPVs for the strengths were 0.141 for SWOT factor number 8 (S8), 0.101 (S12) and 0.101 (S13) for GA (Table 1 and Figure 3(a)) and 0.120 (S9), 0.110 (S14) and 0.100 (S11) for RDP. The three highest FPVs in weaknesses were 0.316 (W6), 0.226 (W7) and 0.129 (W4) for GA and 0.415 (W4), 0.175 (W5) and 0.153 (W6) for RDP. The three highest FPVs in opportunities were 0.142 (O2), 0.113 (O8) and 0.111 (O7) for GA and 0.110 (O3), 0.109 (O12) and 0.107 (O6) for RDP and in threats 0.230 (T3), 0.170 (T4) and 0.132 (T5) for GA and 0.230 (T6), 0.164 (T3) and 0.146 (T5) for RDP (Table 2 and Figure 3(a)). For GA, the computed GPVs were 0.375 for strengths, 0.162 for weaknesses, 0.278 for opportunities and 0.188 for threats (Table 1 and Figure 2(b)). However, for RDP, the calculated GPVs were 0.360 for strengths, 0.137 for weaknesses, 0.308 for opportunities and 0.188 for threats (Table 2 and Figure 2(b)).
Computed (a) FPV and (b) OPV via SWOT factor for GA and RDP. SWOT factors with three highest OPVs are highlighted (red) for each SWOT group. SWOT=strengths weaknesses opportunities threats; GA=German Angler; RDP=Red Dual-Purpose cattle; FPV=factor priority vector; OPV=overall priority vector.
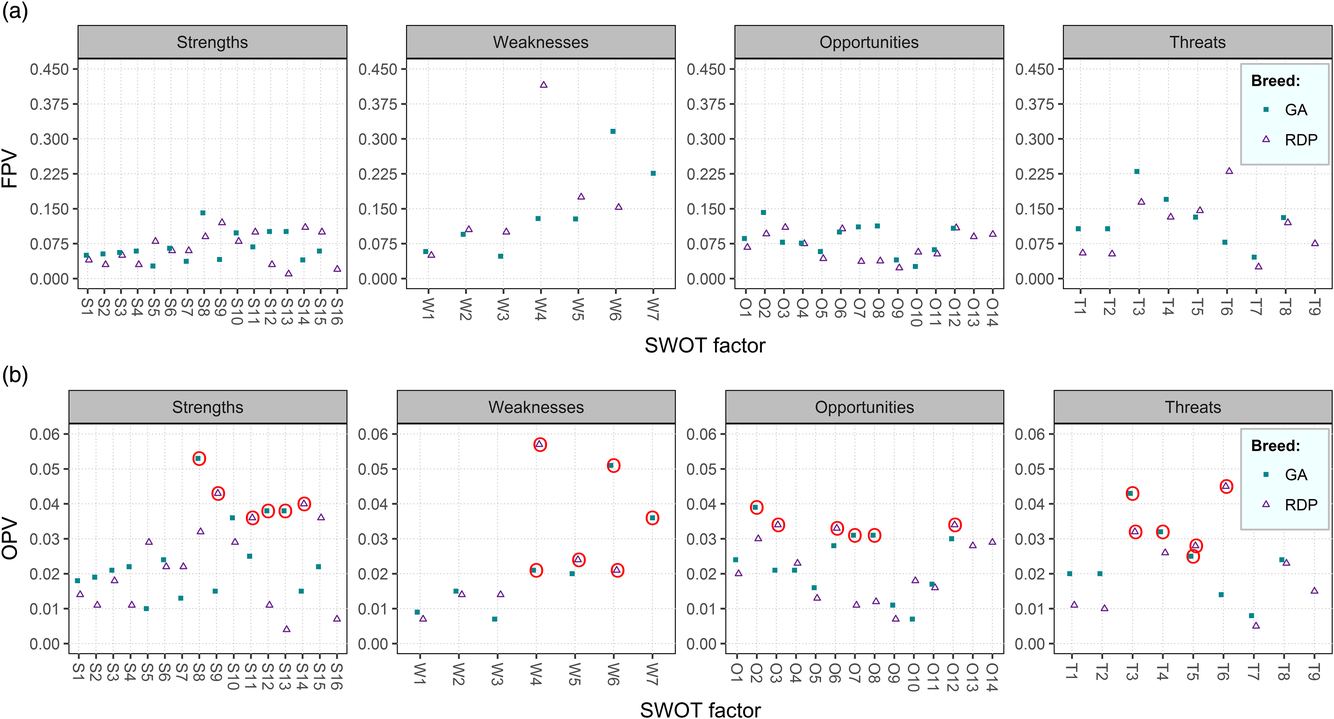
The three highest OPVs were 0.053 (S8), 0.038 (S12) and 0.038 (S13) for GA and 0.043 (S9), 0.040 (S14) and 0.036 (S11) in strengths for RDP. The three highest OPVs were 0.051 (W6), 0.036 (W7) and 0.021 (W4) for GA and 0.057 (W4), 0.024 (W5) and 0.021 (W6) for RDP in weaknesses, 0.039 (O2), 0.031 (O8) and 0.031 (O9) for GA and 0.034 (O3), 0.034 (O12) and 0.033 (O6) for RDP in opportunities, and 0.043 (T3), 0.032 (T4) and 0.025 (T5) for GA and 0.045 (T6), 0.032 (T3) and 0.028 (T5) for RDP in threats (Tables 1 and 2). The three highest OPVs within each SWOT group were highlighted in the graph for each local breed (Figure 3(b)).
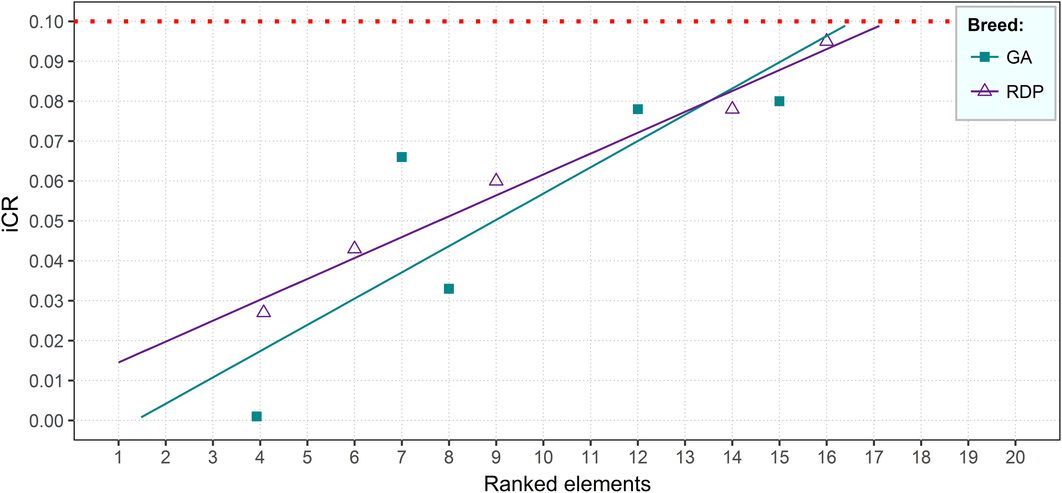
The iCR values for GA and RDP are shown in Figure 4. The iCR of the ranked SWOT factors within the four single SWOT groups was 0.080 for GA in strengths (iCRS), 0.066 in weaknesses (iCRW), 0.078 in opportunities (iCRO) and 0.033 in threats (iCRT). The iCR of the ranking between the SWOT groups (iCRG) was 0.001. For RDP, the iCR within each group was 0.095 in strengths (iCRS), 0.043 in weaknesses (iCRW), 0.078 in opportunities (iCRO) and 0.060 in threats (iCRT). The iCR of the ranked four individual SWOT groups (iCRG) was 0.027.
Quality control of comparison judgements via ranked elements for the GA and RDP. The threshold for the iCR is highlighted (red dotted line). GA=German Angler; RDP=Red Dual-Purpose cattle; iCR=inconsistency ratio.
Conservation and development strategies at breed level
Discussions with the respective stakeholder revealed for GA prioritised strengths of daily gain, meat quality, milk production and the usage of new biotechnologies. Furthermore, quantified weaknesses of genetic gain, especially for milk yield, and high rates of inbreeding have been comprehensively considered. In addition, opportunities of organic farming and breed-specific characteristics as well as threats of low milk prices and a high dependency regarding the dairy business were debated in order to explore effective conservation and development strategies at breed level.
Three final conservation and development strategies have been formulated for the GA:
(1) Changing relative weights and the relevant breeding goal to drift from milk to meat,
(2) Implementation of selection programs including genetic gain and the rate of inbreeding,
(3) Selection of unique and breed characteristic components on product level, that is, milk-fat and fine muscle fibers.
However, for RDP defined strengths were robustness, high adaptability for different housing systems and a balanced dual-purpose of milk and meat. Quantified weaknesses were inbreeding, breed extinction, genomic selection with young bulls and milk yield. Additionally, opportunities of organic farming and dual-purpose aspects as well as threats of low milk and decreasing beef cattle prices have been regarded during the strategy developments.
For RDP, three final conservation and development strategies have been formulated:
(1) Adjust relative weights and the relevant breeding goal to balance milk and meat yield,
(2) Increasing genetic gain and avoid extinction by implementing targeted selection programs,
(3) Selection of unique and breed characteristic traits on breed level, that is, environmental robustness.
Discussion
Quantified strategy decision tool
For both breeds, the quality control parameters iCRG, iCRS, iCRW, iCRO and iCRT were ≤ 0.1 (Figure 4). Hence, the quality of all comparison judgements of the ranked elements and the SWOT-AHP analysis in general were consistent. Nevertheless, the ratio between the ranked elements and iCR showed a strong dependency. The iCR was enhanced by an increased number of ranked elements. This suggests that the iCR threshold should also include the number of ranked elements to overcome limitation problems of ranked elements in order to make the AHP method more comprehensive and flexible.
Conservation and development strategies at breed level
Emphasis on meat traits will be enhanced in the breeding goal for both breeds in order to drift from milk to meat in a balanced way. Economic and biological weights as well as correlations between these traits have to be analysed in advance. Especially for the investigation of actual economic weights, product prices have to be comprehensively collected and compared on markets. Additionally, measured additive genetic variance between commercial traits is of special importance in order to assess biological weights carefully. The final identification of relative weights and the conclusive breeding goal can be indicated by using the appropriate contingent valuation method (CVM) from Davis (Reference Davis1963). CVM implies a widely used non-market valuation methodology in order to analyse environmental cost-benefits and assess environmental impacts (Cummings et al., Reference Cummings, Brookshire and Schulze1986; Mitchell and Carson, Reference Mitchell and Carson1989). This method would be achievable to derive, for example, non-market values in breeding goals (Nielsen et al., Reference Nielsen, Olesen, Navrud, Kolstad and Amer2011) in case of these local breeds.
The adaptation of special breeding approaches, like the traditional or advanced Optimum Contribution Selection (Meuwissen, Reference Meuwissen1997; Wellmann et al. Reference Wellmann, Hartwig and Bennewitz2012), was prospectively proposed for these local breeds. The Optimum Contribution Selection is a selection method, which enables to increase genetic gain and simultaneously restrict the rate of inbreeding. This is of major importance to maintain small or endangered breeds with a threatened productivity and an enhanced rate of inbreeding (bottleneck population). Consequently, inbreeding depression and breed extinction can be avoided through mating strategies and genetic improvement. Therefore, specific breeding bulls can be suggested for mating at farm level. At this, it has major relevance that farmers follow such suggestions and attend their mating records faithfully.
Focusing unique and breed characteristic components will result in high-quality products, which can be offered on niche markets with higher earnings. Therefore, selection on such specific traits may be intensified by the breeding organisation and could lead to an added value on product level (Verrier et al., Reference Verrier, Markey and Lauvie2018; Bernués, Reference Bernués2018; Martín-Collado et al., Reference Martín-Collado, Díaz, Serrano, Zanoli and Naspeti2018; Hiemstra et al., Reference Hiemstra, Remjin, Hoving-Bolink, Amat and Traon2018). In case of the GA, these added values on product level are milk fat (5.5%) and fine muscle fibers as meat quality trait. However, for RDP the added value will be not on product level but rather on the production system level following the approach from Verrier (Reference Verrier2014) and the study of Schäler et al. Reference Schäler, Thaller and Hinrichs(2018), where unique traits were investigated within the respective natural production conditions. In case of the RDP, such added value on production system level is robustness in harsh environments. Thus, the RDP may become more efficient regarding pasture feeding and health traits compared to high-yielding breeds (e.g. Holstein Friesian) under the same environmental conditions. Identified added values on product and production level may be also suitable for local or organic agriculture production schemes. Hence, dependency on commercial milk markets and prices is effectively reduced due to the concentration of niche markets, the supply of high quality products and a balanced milk–meat relation.
An implementation of all conservation and development strategies is planned for each breed. According to Gandini and Oldenbroek (Reference Gandini, Oldenbroek and Oldenbroek2007) and Meuwissen (Reference Meuwissen2009), it can be concluded that such explored strategies, which include the definition of relevant breeding goals, novel marketing products and genetic improvements, are adequate to move further from conservation to utilisation. Explored conservation and development strategies indicate promising and versatile as well as farmer- and consumer-oriented strategies at breed level, even when the number of stakeholder groups was limited. Notice, exploration and design of breeding strategies may be constrained by a biased representation of representatives per stakeholder group. However, if the representation is unbiased a small number of members may well represent a stakeholder group. Thus, it is not the number as such, but whether they are unbiased representatives of the stakeholder group as a whole that matters.
Conclusion
Quantified SWOT establish an ideal basis for the exploration of conservation and development strategies. Therefore, quantified SWOT factors have to be comprehensively discussed with further stakeholder groups and their unbiased representatives at breed level. This integrated approach results in strategies which are realistic, objective and consider individual convenience of the farmers’ more than a quantitative strategy decision tool on its own.
Acknowledgements
Financial support from the Ministry of Energy, Agriculture, Environment, Nature, and Digitalization within the framework of the European Innovation Partnership (EIP Agri) is gratefully acknowledged. In addition, the authors give special thanks to the large number of farmers faithfully supporting this project. We would like to extend our sincere appreciation to the breeding organisation (RSH e.G.) and to Arche Warder – centre of rare livestock breeds, which is the leading partner in this EU project.
Declaration of interest
All authors declare that there is no conflict of interest.
Ethics statement
Animal Care and Use Committee approval was not obtained for this study because data were obtained from farmer surveys.
Software and data repository resources
None of the data were deposited in an official repository.
Supplementary material
To view supplementary material for this article, please visit https://doi.org/10.1017/S1751731119001447.


 Open access