


1. Introduction
Aqueous foams are packings of gas bubbles in liquid, as illustrated in figure 1. They have elasticity from the surface tension of the interfaces, and plasticity due to bubble rearrangements (Weaire & Hutzler Reference Weaire and Hutzler1999). A foam's properties hence differ substantially from those of its components (Cantat et al. Reference Cantat, Cohen-Addad, Elias, Graner, Höhler, Pitois, Rouyer and Saint-Jalmes2013), and it is a model rheological material whose microstructure is accessible in experiments (Denkov et al. Reference Denkov, Tcholakova, Höhler and Cohen-Addad2012; Stewart & Hilgenfeldt Reference Stewart and Hilgenfeldt2023). Foams also have a multitude of applications, from foods and drinks (Weaire & Hutzler Reference Weaire and Hutzler1999) to soil treatment (Géraud et al. Reference Géraud, Jones, Cantat, Dollet and Méheust2016) and fire suppression (Martin Reference Martin2012b).
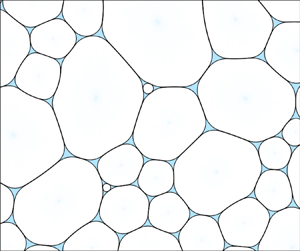
Simulated foam structure for (a) liquid fraction  $\phi = 10\,\%$ and no bubble attraction, and (b) $\phi = 3\,\%$ and contact angle $\theta = 10^\circ$, taken from our simulations. The components of the foam are labelled, and the interface discretisation (schematically), local interface separation $h$ at a mesh vertex, and $\theta$ are shown. The surface tension in the films and Plateau borders is $\gamma _{f}$ and $\gamma _\infty$, respectively, with $\gamma _{f} = \gamma _\infty \cos \theta$ (Langevin Reference Langevin2020, p. 88).

However, foams are unstable, ageing due to coarsening in addition to film breakage (Chae & Tabor Reference Chae and Tabor1997) – we consider the latter no further, noting that it can be suppressed in experiments (Roth, Jones & Durian Reference Roth, Jones and Durian2013; Pasquet et al. Reference Pasquet, Galvani, Requier, Cohen-Addad, Höhler, Pitois, Rio, Salonen and Langevin2023b). Coarsening arises from the diffusion of dissolved gas through the liquid, primarily through the thin films between bubbles; the gas is transported from small to large bubbles due to the higher pressures of the former (Schimming & Durian Reference Schimming and Durian2017). Thus, the mean bubble volume increases as the small bubbles vanish (Lambert et al. Reference Lambert, Mokso, Cantat, Cloetens, Glazier, Graner and Delannay2010). This process may be detrimental in fire-suppression applications, for example, due to the increased mixing of air and fuel vapour within larger bubbles (Martin Reference Martin2012b), and can hasten the perishing of foods (Martin Reference Martin2012a). While the dynamics of a confined foam under coarsening differ from bulk foams, the pressure difference required to initiate flow through a porous medium, during soil treatment for example, is also affected by coarsening (Jones, Getrouw & Vincent-Bonnieu Reference Jones, Getrouw and Vincent-Bonnieu2018). Additionally, foam coarsening is an accessible model for grain growth in crystalline solids (Smith Reference Smith1952).
In the dry limit of small liquid fraction  $\phi$, which is the ratio of liquid area to total foam area (Cantat et al. Reference Cantat, Cohen-Addad, Elias, Graner, Höhler, Pitois, Rouyer and Saint-Jalmes2013), the coarsening growth rate of a bubble in a two-dimensional foam is determined only by its number of neighbours, through von Neumann's law (von Neumann Reference von Neumann1952) which we discuss in § 3.3.1. Experiments and simulations (Glazier & Weaire Reference Glazier and Weaire1992; Stavans Reference Stavans1993) both show that the dry foam approaches a scaling state, in which the bubble size and neighbour-number distributions scale uniformly with time $t$ (Mullins Reference Mullins1986; Lambert et al. Reference Lambert, Mokso, Cantat, Cloetens, Glazier, Graner and Delannay2010). For a given bubble, let $R$ be the radius of a circle with the same area (Princen Reference Princen1988), i.e. its effective radius. It may be shown that the mean effective radius increases as $\langle R \rangle \sim t^{1/2}$ in such a state, since diffusion through thin films between bubbles is the dominant mode of gas transfer in a dry foam (Mullins Reference Mullins1986). Similarly, the scaling state of a three-dimensional dry foam is also well established, with the same behaviour of $\langle R \rangle$ (Thomas, de Almeida & Graner Reference Thomas, de Almeida and Graner2006; Lambert et al. Reference Lambert, Mokso, Cantat, Cloetens, Glazier, Graner and Delannay2010), where $R$ is now the radius of a sphere with the same volume. However, the individual bubble growth rates depend upon their precise geometries in this case (MacPherson & Srolovitz Reference MacPherson and Srolovitz2007; Cantat et al. Reference Cantat, Cohen-Addad, Elias, Graner, Höhler, Pitois, Rouyer and Saint-Jalmes2013).
But real foams always have non-zero  $\phi$, and large values may be encountered in applications such as fire suppression (Laundess et al. Reference Laundess, Rayson, Dlugogorski and Kennedy2011) and the fabrication of solid foams (Cantat et al. Reference Cantat, Cohen-Addad, Elias, Graner, Höhler, Pitois, Rouyer and Saint-Jalmes2013; Galvani et al. Reference Galvani2023). For coarsening in the wet limit $\phi \to 1$, i.e. Ostwald ripening (Stavans Reference Stavans1993), a scaling state is obtained with $\langle R \rangle \sim t^{1/3}$ in two and three dimensions (Cantat et al. Reference Cantat, Cohen-Addad, Elias, Graner, Höhler, Pitois, Rouyer and Saint-Jalmes2013, p. 77). The exponent differs from the dry case because diffusion through the bulk liquid is now the dominant gas transfer mechanism (Mullins Reference Mullins1986). However, less is known about coarsening at moderate $\phi$. Experiments are difficult to control because drainage of the foam's liquid under gravity occurs on shorter time scales than coarsening (Weaire & Hutzler Reference Weaire and Hutzler1999; Born et al. Reference Born2021). Nevertheless, experiments have been performed using diamagnetic levitation of foams (Isert, Maret & Aegerter Reference Isert, Maret and Aegerter2013), as well as in microgravity on the International Space Station (ISS) (Born et al. Reference Born2021; Galvani et al. Reference Galvani2023; Pasquet et al. Reference Pasquet2023a,Reference Pasquet, Galvani, Requier, Cohen-Addad, Höhler, Pitois, Rio, Salonen and Langevinb). A narrow transition was found between the limiting growth exponents $1/2$ and $1/3$ of $\langle R \rangle$, over an interval of around $15\,\%$ or less in $\phi$ (i.e. $\Delta \phi = 0.15$) near the unjamming transition $\phi = \phi _{c}$ at which the bubbles (in a foam without bubble attraction) lose contact. This occurs at $\phi _{c} \approx 16\,\%$ in two dimensions, and $\phi _{c} \approx 36\,\%$ in three (Cantat et al. Reference Cantat, Cohen-Addad, Elias, Graner, Höhler, Pitois, Rouyer and Saint-Jalmes2013, p. 195).
The theory of coarsening at moderate  $\phi$ also remains limited. In two dimensions, bubble growth laws have been developed for foams to which the decoration theorem applies (Bolton & Weaire Reference Bolton and Weaire1991; Roth et al. Reference Roth, Jones and Durian2013; Schimming & Durian Reference Schimming and Durian2017). This theorem states that a two-dimensional equilibrium wet foam containing only Plateau borders which meet exactly three films, typically holding when $\phi \lesssim 3\,\%$ (Jing et al. Reference Jing, Feng, Cox and Hutzler2021), is also an equilibrium dry foam when the Plateau borders are omitted (Bolton & Weaire Reference Bolton and Weaire1991). These growth laws have been compared with experiments in Hele-Shaw cells (Roth et al. Reference Roth, Jones and Durian2013; Chieco & Durian Reference Chieco and Durian2021), accounting for the Plateau borders along the bounding plates. An interpolation between the known growth laws for zero and large $\phi$ was proposed, and found, when averaged, to agree with simulations at intermediate $\phi$ (Fortuna et al. Reference Fortuna, Thomas, de Almeida and Graner2012). The gas flow rates between adjacent circular or spherical bubbles, present near the unjamming transition $\phi _{c}$ (in the absence of bubble attraction), have also been derived (Schimming & Durian Reference Schimming and Durian2017). The latter work has been extended to three-dimensional bubbles with films, although the growth rates of individual bubbles are not yet predicted (Durian Reference Durian2023). We are not aware of any general and rigorous growth laws for $0 < \phi < \phi _{c}$, in either two dimensions (except when the decoration theorem applies) or three. Nor are we aware of a fully developed theory that predicts quantitatively the transition in growth exponents observed experimentally, although progress has been made by Durian (Reference Durian2023).
Several simulations of coarsening in wet foams have been performed (Bolton & Weaire Reference Bolton and Weaire1991; Gardiner, Dlugogorski & Jameson Reference Gardiner, Dlugogorski and Jameson2000; Fortuna et al. Reference Fortuna, Thomas, de Almeida and Graner2012; Thomas et al. Reference Thomas, Belmonte, Graner, Glazier and de Almeida2015; Khakalo et al. Reference Khakalo, Baumgarten, Tighe and Puisto2018). Evidence for scaling states has been found over a range of  $\phi$, in two and three dimensions. However, the Potts model simulations (Fortuna et al. Reference Fortuna, Thomas, de Almeida and Graner2012; Thomas et al. Reference Thomas, Belmonte, Graner, Glazier and de Almeida2015) predict a different form for the transition of the growth exponent of $\langle R \rangle$ with $\phi$, compared with experiments (Isert et al. Reference Isert, Maret and Aegerter2013; Pasquet et al. Reference Pasquet, Galvani, Requier, Cohen-Addad, Höhler, Pitois, Rio, Salonen and Langevin2023b) and simulations (Khakalo et al. Reference Khakalo, Baumgarten, Tighe and Puisto2018) using the bubble model (Durian Reference Durian1995). As $\phi$ increases from zero, an immediate decrease of the exponent from $1/2$ is observed in the Potts model simulations, resulting in a discrepancy for $\phi < \phi _{c}$. While the bubble-model simulations qualitatively reproduce the experimental transition (albeit in two dimensions), the relative rate of diffusion across films and Plateau borders is not predicted.
Most numerical studies have used models which are suited to simulating large numbers of bubbles –  $3000$ to $10\,000$ for the bubble model (Khakalo et al. Reference Khakalo, Baumgarten, Tighe and Puisto2018), and approximately $10^5$ for the Potts model (Fortuna et al. Reference Fortuna, Thomas, de Almeida and Graner2012; Thomas et al. Reference Thomas, Belmonte, Graner, Glazier and de Almeida2015) – but which do not include accurate bubble deformation. A bubble's growth rate depends on the portion of its surface in contact with other bubbles, along with its pressure and those of its neighbours (Roth et al. Reference Roth, Jones and Durian2013), each of which is determined by the bubble geometry. The pressure is related to interface curvature via the Young–Laplace law (Weaire & Hutzler Reference Weaire and Hutzler1999). To our knowledge, only Bolton & Weaire (Reference Bolton and Weaire1991), Benzi et al. (Reference Benzi, Sbragaglia, Scagliarini, Perlekar, Bernaschi, Succi and Toschi2015) and Pelusi, Sbragaglia & Benzi (Reference Pelusi, Sbragaglia and Benzi2019) have performed numerical coarsening studies that accurately model the bubble shapes in wet foams. The first study is limited to small $\phi$, while the latter two, which used a lattice Boltzmann approach, were primarily concerned with bubble rearrangements during coarsening.
Furthermore, the effect of the foam's contact angle  $\theta$ on coarsening has not been widely investigated. As illustrated in figure 1(b), this is the angle between the tangents of the film and Plateau-border interfaces where they meet (Ivanov & Toshev Reference Ivanov and Toshev1975; Denkov, Petsev & Danov Reference Denkov, Petsev and Danov1995), which arises from an imbalance in their surface tensions (Cantat et al. Reference Cantat, Cohen-Addad, Elias, Graner, Höhler, Pitois, Rouyer and Saint-Jalmes2013, p. 49). We neglect for the moment the transition region between these interfaces (Kralchevsky & Ivanov Reference Kralchevsky and Ivanov1985b). The contact angle is determined by the surfactant, via the disjoining pressure (Langevin Reference Langevin2020, p. 88), and increases with the degree of attraction between bubbles (Princen Reference Princen1983). A characteristic property of foams with $\theta > 0$ is flocculation, whereby bubbles cluster due to their attraction (Princen Reference Princen1983; Cox et al. Reference Cox, Kraynik, Weaire and Hutzler2018). While $\theta$ may be negligible in typical foams (Höhler, Seknagi & Kraynik Reference Höhler, Seknagi and Kraynik2021), a contact angle of $\theta \approx 4^\circ$ is thought to have affected the results of the ISS coarsening experiments, by delaying the transition in growth exponents to $\phi > \phi _{c}$ (Pasquet et al. Reference Pasquet, Galvani, Requier, Cohen-Addad, Höhler, Pitois, Rio, Salonen and Langevin2023b). Furthermore, experiments have produced films with $\theta > 10^\circ$ (Princen Reference Princen1968; Seknagi Reference Seknagi2022). Contact angles also occur in emulsions (Bibette et al. Reference Bibette, Mason, Gang, Weitz and Poulin1993), to which we expect our results also apply, due to their similar structure to foams (Weaire & Hutzler Reference Weaire and Hutzler1999). Prior work has been done to characterise foam structure at $\theta > 0$ (Cox et al. Reference Cox, Kraynik, Weaire and Hutzler2018; Feng et al. Reference Feng, Jing, Ma and Wang2021; Jing et al. Reference Jing, Feng, Cox and Hutzler2021; Jing & Feng Reference Jing and Feng2023), along with foam rheology (Menon, Govindarajan & Tewari Reference Menon, Govindarajan and Tewari2016). We are not aware of numerical studies investigating the effects of $\theta > 0$ on coarsening, although non-zero $\theta$ has been used for technical reasons (Fortuna et al. Reference Fortuna, Thomas, de Almeida and Graner2012; Thomas et al. Reference Thomas, Belmonte, Graner, Glazier and de Almeida2015).
In this article, we present a quasistatic numerical model of coarsening in two-dimensional wet foams, which accurately models the bubble geometries, and allows  $\theta > 0$. Two-dimensional foams are widely studied as more tractable models of the real three-dimensional systems (Kähärä, Tallinen & Timonen Reference Kähärä, Tallinen and Timonen2014; Cox et al. Reference Cox, Kraynik, Weaire and Hutzler2018; Khakalo et al. Reference Khakalo, Baumgarten, Tighe and Puisto2018), and can be approximately realised in Hele-Shaw cells (Smith Reference Smith1952; Roth et al. Reference Roth, Jones and Durian2013). Our approach to the foam structure is adapted from the models of Kähärä et al. (Reference Kähärä, Tallinen and Timonen2014) and Boromand et al. (Reference Boromand, Signoriello, Ye, O'Hern and Shattuck2018), the latter having been widely applied, including to foams and emulsions (Boromand et al. Reference Boromand, Signoriello, Lowensohn, Orellana, Weeks, Ye, Shattuck and O'Hern2019; Golovkova et al. Reference Golovkova, Montel, Pan, Wandersman, Prevost, Bertrand and Pontani2021). These methods are suited to relatively small systems, with approximately $1700$ bubbles or fewer. We implement our simulations in Kenneth Brakke's Surface Evolver software (Brakke Reference Brakke1992, Reference Brakke2013).
We vary  $\theta$ by altering the attractive component of the disjoining pressure. Droplet attraction in emulsions has previously (Golovkova et al. Reference Golovkova, Montel, Pan, Wandersman, Prevost, Bertrand and Pontani2021) been implemented in the model of Boromand et al. (Reference Boromand, Signoriello, Ye, O'Hern and Shattuck2018) using a similar approach.
Our coarsening model is inspired by that applied analytically by Marchalot et al. (Reference Marchalot, Lambert, Cantat, Tabeling and Jullien2008) and Schimming & Durian (Reference Schimming and Durian2017), and approximates the gas flow through both the liquid films and the Plateau borders.
Our guiding assumption is that results from accurately modelled small systems, for which the scaling state is likely inaccessible (Thomas et al. Reference Thomas, de Almeida and Graner2006), may give insight into coarsening in macroscopic foams, including by refining the necessary approximations used in simulations of large systems.
We describe our numerical methods in § 2. Section 3 gives our results from simulating two-dimensional disordered foams at various  $\phi$, for several values of $\theta$ comparable to those observed experimentally (Princen Reference Princen1968), and we conclude in § 4. Instead of simulating the time evolution of foams under coarsening, we consider the instantaneous bubble growth rates, and related properties, in foams at structural equilibrium, due to our relatively small system sizes of $256$ and $1024$ bubbles. Analytical approximations are developed to assist with interpretation, and we give a model for the bubble film lengths in Appendix A. Methods we use for measuring simulated foam and bubble properties are described in Appendix B, and a test of foam equilibration is discussed in Appendix C.
2. Numerical methods
We begin by summarising our methods for equilibrating foams, before defining our coarsening model, and our approach for generating the initial foam structure.
2.1. Structural model
2.1.1. Discretisation
The foam structure is modelled using the approach of Kähärä et al. (Reference Kähärä, Tallinen and Timonen2014) and Boromand et al. (Reference Boromand, Signoriello, Ye, O'Hern and Shattuck2018). The bubbles are bounded by a closed interface, with arbitrary shape, of mesh vertices connected by straight edges. This is illustrated schematically in figure 1(b). Hence, all liquid–gas interfaces are explicitly included – the bubbles are disconnected, and their rearrangements can occur without adjustments in the discretisation. We emphasise that vertices and edges refer here (and throughout) to elements of the discretisation, rather than to the infinitesimal Plateau borders and films, respectively, in a dry foam.
The bubble areas are fixed, unlike in the models of Kähärä et al. (Reference Kähärä, Tallinen and Timonen2014) and Boromand et al. (Reference Boromand, Signoriello, Ye, O'Hern and Shattuck2018), taking the foam's gas to be effectively incompressible (Cantat et al. Reference Cantat, Cohen-Addad, Elias, Graner, Höhler, Pitois, Rouyer and Saint-Jalmes2013, p. 27). The liquid is identified with the region outside the bubbles. Since coarsening occurs on substantially longer time scales than structural equilibration (Thomas et al. Reference Thomas, Belmonte, Graner, Glazier and de Almeida2015), we use a quasistatic approach like Boromand et al. (Reference Boromand, Signoriello, Ye, O'Hern and Shattuck2018). This contrasts with Kähärä et al. (Reference Kähärä, Tallinen and Timonen2014), who applied their model to flowing foams. We also neglect gravity, and therefore choose to measure all pressures relative to the uniform pressure of the liquid (thus taken to be zero).
Another approach (Bolton & Weaire Reference Bolton and Weaire1992; Jing et al. Reference Jing, Wang, Lv, Wang and Luo2015; Cox et al. Reference Cox, Kraynik, Weaire and Hutzler2018) is instead to assume that the films separating bubbles have zero thickness, and to treat them separately from the Plateau-border interfaces. While this likely has advantages in numerical efficiency, since the interfaces are all circular arcs (Bolton & Weaire Reference Bolton and Weaire1992), handling bubble rearrangements in this model is complex for wet foams (Cox et al. Reference Cox, Kraynik, Weaire and Hutzler2018), particularly in three dimensions (Weaire & Hutzler Reference Weaire and Hutzler1999, p. 80). Furthermore, a small amount of bubble adhesion is often needed for numerical stability (Jing et al. Reference Jing, Wang, Lv, Wang and Luo2015; Cox et al. Reference Cox, Kraynik, Weaire and Hutzler2018), and the criteria for adding or removing a film between slightly contacting bubbles could induce artefacts near the unjamming transition.
However, a disadvantage of the model we use is that, for numerical convergence, the film thickness  $h_0$ must not be too small, though the minimum thickness can be decreased by refining the mesh. For the degree of refinement we use (stated in § 3), the minimum usable film thickness is approximately $10^{-2} \langle R \rangle$, where $\langle R \rangle$ is the mean bubble radius. This is substantially larger than in real foams, for which $h_0 \lesssim 10^{-4} \langle R \rangle$ (Cantat et al. Reference Cantat, Cohen-Addad, Elias, Graner, Höhler, Pitois, Rouyer and Saint-Jalmes2013, pp. 18–20). The film thickness is set by the interactions between different interfaces, which we now describe.
2.1.2. Disjoining pressure
Similarly to Kähärä et al. (Reference Kähärä, Tallinen and Timonen2014), we implement bubble interactions through a disjoining pressure acting between nearby liquid–gas interfaces. This ensures that bubbles do not overlap at equilibrium. In order to allow  $\theta$ to be varied, we select a disjoining pressure inspired by the Derjaguin–Landau–Vervey–Overbeck (DLVO) theory for parallel flat interfaces with separation $h$ (Cantat et al. Reference Cantat, Cohen-Addad, Elias, Graner, Höhler, Pitois, Rouyer and Saint-Jalmes2013, p. 94), which we also use between curved interfaces. The interface separation in the latter case (see figure 1) is discussed further in § 2.1.4.
The DLVO model includes an electrostatic repulsion term dominant at smaller  $h$, which has the form ${\rm e}^{-\kappa h}$ for constant $\kappa > 0$. A van der Waals attraction proportional to $1/h^3$ is present which dominates at larger $h$ (Langevin Reference Langevin2020, pp. 89–93). Since we expect transient bubble overlaps ( $h \leq 0$) in the simulations, during structural relaxation only, we alter the form of the second interaction to $h {\rm e}^{-\kappa h}$ to improve stability. We also select $\kappa = 1/h_0$, where $h_0$ is the equilibrium film thickness – a choice which is again made for stability, as discussed at the end of this subsection. Hence, we use the disjoining pressure
 \begin{equation} \varPi_{D}(h) = A (1 - \alpha h) \, {\rm e}^{{-}h / h_0} , \end{equation}
where  $A$,
$A$,  $\alpha$ and $h_0$ are positive constants. Positive disjoining pressure corresponds to interface repulsion. Our aim in selecting this form is a qualitative model for $\varPi _{D}$, which allows arbitrary $\theta$ to be set via the constant $\alpha$ (i.e. by varying the relative strengths of the attractive and repulsive components). While (2.1) agrees qualitatively with DLVO theory for $h$ of moderate value and above, it does not reproduce the dominance of van der Waals attraction over electrostatic repulsion in the latter model at very small $h$, nor the consequent local maximum of $\varPi _{D}(h)$. This omission corresponds to the assumption that only common black films, for which $\varPi _{D}$ is below this maximum, are present in the foams we simulate (Cantat et al. Reference Cantat, Cohen-Addad, Elias, Graner, Höhler, Pitois, Rouyer and Saint-Jalmes2013, pp. 97–98). We note that the real functional form of $\varPi _{D}$ depends upon the surfactant (Langevin Reference Langevin2020).
We are not aware of prior studies using this form for  $\varPi _{D}$. Kähärä et al. (Reference Kähärä, Tallinen and Timonen2014) and Boromand et al. (Reference Boromand, Signoriello, Ye, O'Hern and Shattuck2018) use a repulsive harmonic interaction. Golovkova et al. (Reference Golovkova, Montel, Pan, Wandersman, Prevost, Bertrand and Pontani2021) incorporate attractive interactions, but use a piecewise-linear form for $\varPi _{D}$ without relating its attractive components to a contact angle. We performed test simulations using a similar piecewise-linear $\varPi _{D}$, varying the range of attractive interactions, to confirm that our results are not sensitive to the disjoining pressure model.
The constants  $A$ and $\alpha$ in (2.1) are set as follows. We enforce that the equilibrium film thickness $h_0$, which is a parameter of the simulations, is attained by a flat film separating two bubbles whose pressures equal the foam's capillary pressure $\varPi _{C}$. This is the area-weighted mean bubble pressure – if the $i$th bubble has area $A_i$ and pressure $p_i$, then (Höhler et al. Reference Höhler, Seknagi and Kraynik2021)
 \begin{equation} \varPi_{C} = \frac{\sum_i A_i p_i}{\sum_i A_i} , \end{equation}
recalling that our liquid pressure is zero. Hence,  $\varPi _{D}(h_0) = \varPi _{C}$ by balancing the pressures on the flat film interfaces (Toshev & Ivanov Reference Toshev and Ivanov1975). We note that $\varPi _{C}$ is not known before the simulations are run, so this condition is applied iteratively, as described in § 2.3. Films separating bubbles with different pressures will have different equilibrium thicknesses (Princen Reference Princen1988), as discussed later.
The remaining degree of freedom is used to obtain the desired  $\theta$. Let $\gamma (h)$ be the surface tension (in dimensions of force, since our model is two-dimensional) of a liquid–gas interface in a flat film of thickness $h$, and let $\gamma _\infty$ be the tension of an isolated interface outside a film. Then (Langevin Reference Langevin2020, p. 88)
 $$\begin{gather} \gamma(h) = \gamma_\infty + \frac{1}{2} \int_h^\infty \varPi_{D}(s) \, {\rm d} s , \end{gather}$$
 $$\begin{gather}\cos[\theta(h)] = \gamma(h) / \gamma_\infty . \end{gather}$$
The latter result arises from balancing the surface tension forces at one end of a flat film (Kralchevsky & Ivanov Reference Kralchevsky and Ivanov1985a), with  $\theta$ defined as in figure 2. There is strictly no discontinuity in the tangents of simulated liquid–gas interfaces which corresponds to $\theta$, due to the transition regions between films and Plateau borders (Kralchevsky & Ivanov Reference Kralchevsky and Ivanov1985b). An interesting consequence of (2.3) and (2.4) is that $\varPi _{D}$ must have an attractive component even for $\theta (h) = 0$ (Ivanov & Toshev Reference Ivanov and Toshev1975), so that $\gamma (h) = \gamma _\infty$. This is because $\varPi _{D}(h) > 0$ in an equilibrium film (Cantat et al. Reference Cantat, Cohen-Addad, Elias, Graner, Höhler, Pitois, Rouyer and Saint-Jalmes2013, p. 96). The contact angle is undefined if $\gamma (h) > \gamma _\infty$.
Definition of the contact angle  $\theta$ accounting for the transition region between films and Plateau borders. A circular arc describing the Plateau-border interface outside the transition region is depicted, along with a line similarly describing the film interface. Their angle of intersection gives $\theta$ (Kralchevsky & Ivanov Reference Kralchevsky and Ivanov1985b; Denkov et al. Reference Denkov, Petsev and Danov1995).

The contact angle  $\theta _{m}$ measured by approximating the simulated bubble interfaces by a collection of circular arcs (Kralchevsky & Ivanov Reference Kralchevsky and Ivanov1985b; Denkov et al. Reference Denkov, Petsev and Danov1995), as described in Appendix B.3, differs from the value of $\theta$ expected from (2.4) with $h = h_0$. When $\theta (h_0) = 0$, we find a typical $\theta _{m} \approx 3^\circ$ for $\phi \approx \phi _{c}$, which manifests the attractive component of $\varPi _{D}$ in this case, while the discrepancy decreases as $\theta (h_0)$ increases. As discussed further in § 3.3.2, we find that $h > h_0$ for films in foams near the unjamming transition. Hence, from (2.3), and the short-range repulsion in $\varPi _{D}$, (2.4) then predicts a larger contact angle. We parametrise our foams with respect to $\theta (h_0)$, denoted $\theta$ henceforth, which we recall determines the interface tension in a flat film between bubbles with the capillary pressure.
By substituting (2.1) into (2.3) and (2.4) for  $h = h_0$, and applying the above condition $\varPi _{D}(h_0) = \varPi _{C}$, our disjoining pressure is
 \begin{align} \varPi_{D}(h) &= \frac{2 \gamma_\infty}{h_0} \left[\left(1 - \cos\theta + \frac{\varPi_{C} h_0}{\gamma_\infty}\right)\right. \nonumber\\ &\quad \left. - \left(1 - \cos\theta + \frac{\varPi_{C} h_0}{2 \gamma_\infty}\right) \frac{h}{h_0}\right] {\rm e}^{1 - h / h_0} . \end{align}
In order to model foams with no bubble attraction, we also implement a repulsive disjoining pressure
 \begin{equation} \varPi_{D}(h) = \dfrac{\varPi_{C}}{e - 1} \begin{cases} {\rm e}^{2 - h / h_0} - 1 , & \text{for }h \leq 2 h_0 ;\\ 0, & \text{otherwise} . \end{cases} \end{equation}
This is obtained by omitting the term in  $\alpha$ from (2.1), and including a cutoff such that $\varPi _{D}(h) = 0$ for $h > 2 h_0$ (so bubble neighbours can be reliably calculated). A constant is subtracted for $h \leq 2 h_0$ so $\varPi _{D}(h)$ is continuous, and the condition $\varPi _{D}(h_0) = \varPi _{C}$ is then applied. We note that $\gamma (h) > \gamma _\infty$ and $\theta$ is undefined (inevitable for a repulsive $\varPi _{D}$), by (2.3) and (2.4). Equations (2.5) and (2.6) are plotted in figure 3.
The form of disjoining pressure  $\varPi _{D}$ we use, given by (2.5) and (2.6), versus film thickness $h$ (relative to its equilibrium value $h_0$). For $\theta > 0$, the capillary pressure $\varPi _{C}$ does not scale out. The larger value is representative of a simulated foam with $\phi = 2\,\%$, and the smaller for a flocculated foam with larger $\phi$ (see § 3.1). Each curve satisfies $\varPi _{D}(h_0) = \varPi _{C}$, as stated in the text.

Equation (2.3) is not exact for curved interfaces, which are ubiquitous in foams, and a realistic disjoining pressure would depend upon the interface curvature (Denkov et al. Reference Denkov, Petsev and Danov1995). However, we neglect these effects as a simplifying assumption. This is the Derjaguin approximation, justified when the radii of curvature of the interfaces are large compared with their separation  $h$ (Denkov et al. Reference Denkov, Petsev and Danov1995). The latter assumption does not hold in general for our simulations, although it is appropriate for the weakly curved interfaces of thin films. The mean ratio of film-interface radius of curvature to film thickness is measured to be approximately $1500$ in our simulations (at $\phi = 2\,\%$ and $10\,\%$ for repulsive $\varPi _{D}$, and $\phi = 2\,\%$ and $25\,\%$ at $\theta = 10^\circ$), but the ratio varies from around $9$ up to approximately $10^5$ for individual films. This variation is due to that in curvature rather than in film thickness. We measure both film properties using the methods described in Appendix C.
We now explain further the requirement for larger  $h_0$ in our simulations than in real foams, along with our selection of $\kappa = 1/h_0$ for (2.1). For a given mesh refinement, it appears necessary for convergence that $\varPi _{D}$ not vary too rapidly with $h$ near $h_0$. This may be related to a discretisation-induced difference between $h$ on the two sides of a film, discussed later in Appendix C. In the context of the simulations, $h_0$ could in principle be set arbitrarily small, but, to avoid unphysical interface overlaps at equilibrium, $|\varPi _{D}'(h_0)|$ would need to be correspondingly large (recalling that variations in bubble pressure correspond to variations in the value of $\varPi _{D}$ in equilibrium films). Furthermore, even allowing for our larger $h_0$, convergence requires that $|\varPi _{D}'(h_0)|$ is much smaller than found in real foams (Bergeron & Radke Reference Bergeron and Radke1992), giving rise to larger variations in film thickness between bubbles of different pressure. However, we note that some variations are expected in real foams (Princen Reference Princen1988). The derivative $|\varPi _{D}'(h_0)|$ is set by the choice of $\kappa$, defined above – we take $\kappa = 1/h_0$ in (2.1), which is large enough that bubbles do not overlap at equilibrium, but sufficiently small for the simulations to converge at the mesh refinement we use (stated in § 3). We discuss the resulting variations in the film thickness of bubbles in § 3.3.2.
The disjoining pressure  $\varPi _{D}(h)$ is applied to each mesh vertex on the liquid–gas interfaces, unlike Kähärä et al. (Reference Kähärä, Tallinen and Timonen2014) and Boromand et al. (Reference Boromand, Signoriello, Ye, O'Hern and Shattuck2018) who apply it to the edges in their foam models. We set $h$ equal to the shortest distance to another interface (the local interface separation), as shown in figure 1(b).
2.1.3. Vertex neighbours
To determine the local interface separation  $h$ at a mesh vertex $v_i$, neighbour searches are first performed to find the vertex closest to $v_i$ which lies on a different interface, illustrated in figure 4(a).
Schematic of (a) the local neighbour search, and (b) the piecewise-linear interface extrapolation. The outward unit normals to the edges adjoining the neighbouring vertex in (b) are  $\boldsymbol {n}_1$ and $\boldsymbol {n}_2$, the displacement of the vertex from its neighbour is $\boldsymbol {d}$, and $h$ is the extrapolated shortest distance from the vertex to an opposing interface.

In order to improve the efficiency of these searches, compared with a brute-force approach, we use the fact that all vertices lie on particular bubble interfaces, and their adjoining vertices thereon do not change. Our nearest-neighbour algorithm is as follows.
(i) Cover each bubble with a circle whose centre is the centroid of its vertices, and whose radius is the minimum required to cover each of these vertices.
(ii) For each bubble, determine the bubbles whose circles overlap its own, illustrated in figure 5. These are the neighbouring bubbles, and are found by calculating the distance between each circle centre. This search is sufficiently fast since our systems contain relatively few bubbles (no more than $1024$). For these overlap checks, the circle radii are scaled by $125\,\%$ (an arbitrary value, but sufficiently large). If a scaling were not performed, then interface overlaps would occur during bubble rearrangements, as some bubbles would intersect one another before registering as neighbours.
(iii) For each vertex
$v_i$ on each bubble, calculate the closest vertex on each neighbouring bubble. If the latter bubble was a neighbour during the last pass of the algorithm, then the previously closest vertex provides an initial guess. Otherwise, we take the vertex closest to the centroid of the bubble on which $v_i$ lies (since this vertex need only be found once for all vertices on the bubble of $v_i$). The closest vertex is then obtained through a local search along the neighbouring bubble's interface, starting at the guessed vertex, and, at each step, moving to an adjoining vertex if it is closer to $v_i$. This is illustrated in figure 4(a). The process is only guaranteed to give a vertex at a local minimum of distance, but works well in practice due to the smooth bubble geometries (see figure 1) and the choice of initial guess.(iv) For each vertex
$v_i$ on each bubble, compare the distance to the closest vertex on each neighbouring bubble. The closest of these is then the nearest neighbour of vertex $v_i$.


Schematic of the covering circles used to determine neighbouring bubbles for the purpose of finding vertex neighbours. The circle for a particular bubble is shown, including its fringe used to improve numerical stability, along with the circles of its neighbouring bubbles (i.e. those that overlap the first circle).

We are not aware of descriptions of the nearest-neighbour approaches used in prior simulations of this type, although we note that Okuda & Hiraiwa (Reference Okuda and Hiraiwa2023a) use octrees in comparable three-dimensional simulations of biological cells (Okuda & Hiraiwa Reference Okuda and Hiraiwa2023b). The efficiency of these algorithms appears to be of importance in scaling such foam simulations to larger systems and higher mesh refinement.
2.1.4. Interface extrapolation
Having determined the nearest neighbour of each vertex, we then calculate the local interface separation  $h$. We could set $h$ equal to the distance from the vertex to its neighbour, but this would result in an unrealistic roughness in the interfaces – this approach has previously been used to model static friction in other materials (Boromand et al. Reference Boromand, Signoriello, Ye, O'Hern and Shattuck2018).
Issues of interface extrapolation or interpolation also arise in other fluid dynamics simulations. For example, Bazhlekov, Anderson & Meijer (Reference Bazhlekov, Anderson and Meijer2004) use a spherical interpolation between vertices to obtain the local interface separation in three-dimensional boundary integral simulations.
Instead, we use a piecewise-linear interface extrapolation, such that the local interface separation is the minimum distance to the half-infinite extensions of the two edges adjoining the neighbour vertex, as illustrated in figure 4(b). Let  $\boldsymbol {n}_1$ and $\boldsymbol {n}_2$ be outward unit normals to the edges, and let $\boldsymbol {d}$ be the displacement of the considered vertex from its neighbour. Then we define
 \begin{equation} h = \begin{cases} \max\left(\boldsymbol{d} \boldsymbol{\cdot} \boldsymbol{n}_1, \boldsymbol{d} \boldsymbol{\cdot} \boldsymbol{n}_2 \right), & \text{if the neighbouring interface is convex} ,\\ \min\left(\boldsymbol{d} \boldsymbol{\cdot} \boldsymbol{n}_1, \boldsymbol{d} \boldsymbol{\cdot} \boldsymbol{n}_2\right), & \text{if the neighbouring interface is concave} . \end{cases} \end{equation}
The two cases are shown in figure 6. Equation (2.7) ensures that  $h < 0$ if the vertex overlaps the neighbour interface during structural relaxation, so the disjoining pressure acts to oppose the overlap. However, (2.7) differs from the exact piecewise-linear interface extrapolation when the considered vertex is closest to its neighbouring vertex, rather than another point on the latter's adjoining edges. In the absence of overlap, this can occur only for convex neighbouring interfaces, when the considered vertex lies in the shaded sector of figure 6(a), where the effect on a distance contour is shown: $h$ is underestimated by (2.7) here.
Illustrations of (2.7) for (a) convex, and (b) concave, neighbouring interfaces, with notation from figure 4(b). The edges adjoining the neighbour vertex are shown, as are the infinite extensions thereof (dotted lines). The considered vertex may in principle lie anywhere relative to the neighbour, including in the shaded sector of (a) where  $h$ would be the distance to the neighbour vertex itself in an exact implementation of the piecewise-linear extrapolation. The dotted and dashed lines in this sector show a given $h$ contour using the exact extrapolation and (2.7), respectively.

The difference from the exact extrapolation is expected to cause only small errors in  $h$, due to the smooth interfaces of equilibrium foams and our degree of mesh refinement. Hence, the angle of the sector in figure 6(a) is anticipated to be small in practice. For the $1024$-bubble foams discussed in § 3 (for repulsive $\varPi _{D}$ and $\theta = 10^\circ$, and at liquid fraction $2\,\%$ and $25\,\%$), approximately $4\,\%$ of vertices are affected by the difference at liquid fraction $\phi = 2\,\%$, rising to approximately $22\,\%$ at $\phi = 25\,\%$. For these affected vertices, the resulting root-mean-square relative error in $h$ is below around $0.2\,\%$, and the maximum magnitude of the relative error is approximately $2.3\,\%$. These errors are judged to be small enough to justify using the simplified (2.7).
We use the above extrapolation due to its closeness to the geometry of the discretisation. Other approaches might allow improved convergence at lower mesh refinement, and may avoid the imbalance in  $h$ between the interfaces of a curved film noted in Appendix C. Kähärä et al. (Reference Kähärä, Tallinen and Timonen2014) and Boromand et al. (Reference Boromand, Signoriello, Ye, O'Hern and Shattuck2018) bypass the issue of interface extrapolation by explicitly calculating the shortest distance between edges. However, we determine neighbouring vertices, rather than neighbouring edges, under the assumption of greater efficiency, due to the simpler distance calculations involved.
2.1.5. Implementation
We implement our simulations using the Surface Evolver, developed by Kenneth Brakke (Brakke Reference Brakke1992, Reference Brakke2013). This software is frequently applied in the study of foams (Kraynik, Reinelt & van Swol Reference Kraynik, Reinelt and van Swol2003; Jing et al. Reference Jing, Wang, Lv, Wang and Luo2015; Höhler et al. Reference Höhler, Seknagi and Kraynik2021), usually under the assumption that the liquid films have zero thickness.
The Surface Evolver may be extended using its scripting language. We have implemented finite film thickness in this manner, via a disjoining pressure and neighbour searches. Our scripts are not compiled, so it is likely that our simulations could be made faster by implementing the routines in the software's public source code. We also do not take advantage of any significant parallel processing.
We note that pairwise repulsion between vertices already exists in the Surface Evolver as ‘knot’ energies (Brakke Reference Brakke2013). However, it is not straightforward to adapt these to our purposes, due to our desire for interface extrapolation and interactions only between nearest neighbours.
As is usual in the Surface Evolver, local energy minimisation is used to obtain the equilibrium foam structures. Let  $\varGamma _{F}$ be the union of all liquid–gas interfaces in the simulated foam. Then the foam's total energy (recalling that its liquid and gas are treated as incompressible) is given by
 \begin{equation} E = \int_{\varGamma_{F}} \gamma(h) \, {\rm d} l , \end{equation}
where  $\gamma (h)$ is obtained from (2.3), and $h$ is the local interface separation from (2.7) (which varies around $\varGamma _{F}$). This quantity is minimised using conjugate gradient iterations, as implemented in the Surface Evolver (Brakke Reference Brakke1992, Reference Brakke2013).
Let  $\boldsymbol {x}_i$ be the position of the $i$th vertex, $\boldsymbol {x}_{i_1}$ and $\boldsymbol {x}_{i_2}$ those of its adjoining vertices on the same interface, $\boldsymbol {x}_n$ that of its nearest neighbour, and $\boldsymbol {x}_{n_1}$ and $\boldsymbol {x}_{n_2}$ those of its neighbour's adjoining vertices. We will consider foams with periodic boundary conditions, so these positions are those of the nearest copies of the vertices to $\boldsymbol {x}_i$. Define $l_i = (|\boldsymbol {x}_{i_1} - \boldsymbol {x}_i| + |\boldsymbol {x}_{i_2} - \boldsymbol {x}_i|) / 2$ as the length of interface associated with the $i\text {th}$ vertex (half the length of its adjoining edges), and $h_i(\boldsymbol {x}_i, \boldsymbol {x}_n, \boldsymbol {x}_{n_1}, \boldsymbol {x}_{n_2})$ as the corresponding local interface separation (calculated as in § 2.1.4). Also, let $L_i = |\boldsymbol {x}_{i_1} - \boldsymbol {x}_i|$ be the length of the $i\text {th}$ edge, between the $i\text {th}$ vertex and its adjoining vertex at $\boldsymbol {x}_{i_1}$. If there are $N$ vertices, the energy $E$ is hence expressed in the simulations as
 \begin{equation} E(\{\boldsymbol{x}_i\}) = \sum_{i=1}^N \left(\gamma_\infty L_i(\boldsymbol{x}_i, \boldsymbol{x}_{i_1}) + \frac{l_i(\boldsymbol{x}_i, \boldsymbol{x}_{i_1}, \boldsymbol{x}_{i_2})}{2} \int_{h_i(\boldsymbol{x}_i, \boldsymbol{x}_n, \boldsymbol{x}_{n_1}, \boldsymbol{x}_{n_2})}^\infty \varPi_{D}(s) \, {\rm d} s \right) , \end{equation}
where the integrals are determined explicitly from (2.5) or (2.6). If  $x_k$ is the $k\text {th}$ coordinate in $\{\boldsymbol {x}_i\}$, then we approximate the gradient $\boldsymbol {\nabla } E(\{x_k\})$ by (in component form)
 \begin{equation} \frac{\partial E}{\partial x_k} \approx \sum_{i=1}^N \left(\gamma_\infty \frac{\partial L_i}{\partial x_k} - l_i \varPi_{D}(\bar{h}_i) \frac{\partial \bar{h}_i}{\partial x_k} \right) , \end{equation}
where  $\bar {h}_i(\boldsymbol {x}_i) \equiv h_i(\boldsymbol {x}_i, \boldsymbol {x}_n, \boldsymbol {x}_{n_1}, \boldsymbol {x}_{n_2})$ for fixed neighbour positions (i.e. these are taken as parameters rather than variables). This replacement is made because our implementation does not allow derivatives of $h_i$ with respect to the neighbour coordinates. We compensate by doubling the second summed term in (2.9) when calculating $\boldsymbol {\nabla } E$, as done in (2.10). Using Newton's third law, this is equivalent to including such derivatives under the approximation that each vertex is the nearest neighbour of its own nearest neighbour, with each vertex having the same $l_i$ as its neighbour (these lengths are equal to a tolerance of $20\,\%$ for around half of vertices), and that the corresponding distances $h_i$ are those between the vertices. We find that, of the vertices close enough to their neighbour that $\varPi _{D}$ is not negligible (i.e. $h_i < 8 h_0$, by figure 3), approximately $3/4$ are the neighbour of their neighbour in our simulations. As an approximation, we have also neglected the contributions to $\boldsymbol {\nabla } E$ from derivatives of $l_i$ in (2.10), interpreted as corrections from $\varPi _{D}$ to the surface tension in the first summed term of (2.10). These corrections are expected to be small for our $\theta \lesssim 10^\circ$ (see § 3) by (2.4), and to increase with $\theta$.
The bubble area constraints mentioned in § 2.1.1 are set using Lagrange multipliers via the Surface Evolver's usual procedures (Brakke Reference Brakke1992), which gives the gas pressure of each bubble as the value of the corresponding multiplier.
Equation (2.10), including the mentioned constraint terms and an added restriction that vertices can move only in the direction normal to their interface, is used to evolve the vertex coordinates  $x_k$ at each conjugate gradient iteration, using the Surface Evolver's internal routines. Because the bubbles are expected to rearrange slowly, we perform the time-consuming neighbour searches every $20$ iterations. However, the local interface separations $\bar {h}_i$ are recalculated before each iteration, using the current coordinates of the vertex neighbours. After the same interval of $20$ iterations, the edges on each individual bubble interface are set to a uniform length, with a tolerance of $5\,\%$, by using the Surface Evolver's vertex averaging routines (edge elasticity was instead implemented by Kähärä et al. (Reference Kähärä, Tallinen and Timonen2014)). The energy $E$, obtained from (2.9), is checked every $20$ iterations to see whether it has changed by less than a threshold (specified in § 3) since the last check. If so, then the foam is considered equilibrated.
Transiently, and usually during the early stages of structural relaxation, the assumptions of the interface extrapolation may fail. For example, spikes in the discretisation of a bubble's interface (i.e. vertices with a large displacement from those adjoining them on the interface) may result in a large interface overlap ( $h \ll 0$) being falsely registered for a vertex. This would cause the vertex to experience an extremely large repulsive force, resulting in further spikes which may render the mesh unusable. To avoid this, we detect instances of large overlap (according to the interface extrapolation), and set the coordinates of the overlapping vertex and its neighbour to the mean coordinates of the vertices adjoining them on their interfaces. We also detect spikes using the angle turned by successive edges on an interface, suppressing them by the same method. Small interface overlaps, which do not result in the overlapping vertex swapping neighbours, can be resolved without such interventions (see §§ 2.1.2 and 2.1.4).
Our use of the Surface Evolver's relaxation routines to implement vertex interactions (we term this method 1 for structural relaxation) have resulted in the following caveat: the vertex neighbour properties (and hence the  $\bar {h}_i$) are not recalculated during a given conjugate gradient iteration, interfering with the automatic selection of an ideal step size (Brakke Reference Brakke1992). This slows relaxation, and means the energy is no longer guaranteed to decrease. In practice, we find that this method is still considerably faster than gradient descent with a fixed step size (method 2, to which the caveat does not apply), and that systematic energy increases are rare for our system parameters (with their occurrence also being reduced at higher mesh refinement). We tried implementing our vertex interactions in the Surface Evolver source code to allow an exact use of the conjugate gradient algorithm (method 3), but we found the result unreliable due to the step size decreasing to zero prior to convergence being clearly established. This may be due to an incompatibility between the system energy and its calculated gradient, noting that our vertex interactions are asymmetric, but the issue remains unresolved. Therefore, we use method 1 in the results reported here.
We have compared foams equilibrated by each of methods 1 to 3 (for  $256$ bubbles, $\phi = 2\,\%$, and $\theta = 10^\circ$), and find them consistent, with method 1 resulting in the lowest final energy (this energy differs by less than $0.002\,\%$ among the methods). For method 3, we included the contributions to $\boldsymbol {\nabla } E$ from derivatives of $l_i$ in (2.9) (recalling that we expect these contributions to increase with $\theta$), and so this comparison also tests our mentioned neglect of these contributions in method 1, which we use hereafter. We provide a further check of the equilibration of our simulated foams in Appendix C.
2.2. Coarsening model
Having given our methods for structural relaxation, we now describe our coarsening model.
Coarsening occurs due to the transport of dissolved gas through the foam's liquid (Cantat et al. Reference Cantat, Cohen-Addad, Elias, Graner, Höhler, Pitois, Rouyer and Saint-Jalmes2013). Let  $c(\boldsymbol {r}, t)$ be the gas concentration at position $\boldsymbol {r}$ in the liquid, and at time $t$. Following Schimming & Durian (Reference Schimming and Durian2017), we assume that almost all the gas transfer between bubbles occurs when the gas concentration is close to equilibrium. Hence, $c$ satisfies Laplace's equation
 \begin{equation} \nabla^2 c = 0 . \end{equation}
Boundary conditions are given by Henry's law  $c = H p$ on the interface of each bubble, where $p$ is the bubble's pressure and $H$ is Henry's constant, related to the solubility (Cantat et al. Reference Cantat, Cohen-Addad, Elias, Graner, Höhler, Pitois, Rouyer and Saint-Jalmes2013, p. 109). Only differences in $c$ are relevant, so pressures relative to that of the liquid may be used.
Let  $\delta F$ be the gas flow rate (in dimensions of area per time) across an element $\delta l$ of a bubble's interface, due to a nearby bubble. Using the approach of Marchalot et al. (Reference Marchalot, Lambert, Cantat, Tabeling and Jullien2008) and Schimming & Durian (Reference Schimming and Durian2017), we approximate this rate as that between two infinite, parallel, straight interfaces, separated by the local interface separation $h$ (the same as used to determine $\varPi _{D}$). Let the pressure difference between the two bubbles be $\Delta p$. The solution of Laplace's equation is linear between such interfaces, so (Cantat et al. Reference Cantat, Cohen-Addad, Elias, Graner, Höhler, Pitois, Rouyer and Saint-Jalmes2013, p. 109)
 \begin{equation} \delta F \approx D H \, \delta l \Delta p / h , \end{equation}
where  $D$ is a diffusion coefficient. The gas flows towards the bubble with lower pressure. We apply this approximation to each vertex, taking $\delta l$ to be half the sum of the lengths of the two adjoining edges (i.e. $l_i$ for the $i\text {th}$ vertex, from § 2.1.5). The relevant quantities are illustrated in figure 7.
Illustration of the quantities used in (2.12). With these definitions,  $\delta F$ is a contribution to the loss of gas from the bubble with pressure $p_1$.

By summing  $\delta F$ over each vertex on a bubble's interface, we obtain an approximation to its area growth rate $\dot {A}$, which accounts for gas transfer through both the thin films and Plateau borders.
Both contributions were previously included in lattice Boltzmann simulations (Benzi et al. Reference Benzi, Sbragaglia, Scagliarini, Perlekar, Bernaschi, Succi and Toschi2015; Pelusi et al. Reference Pelusi, Sbragaglia and Benzi2019), although these studies were focused on the motion of bubbles during coarsening, rather than their growth rates. The contributions were also present in the phase-field simulations of Fan et al. (Reference Fan, Chen, Chen and Voorhees2002). However, their focus was not on foam-like systems. Otherwise, to our knowledge, prior simulations of wet foams with accurate bubble geometries have only included gas flow through the films (Bolton & Weaire Reference Bolton and Weaire1991) – this is the border blocking assumption (Roth et al. Reference Roth, Jones and Durian2013). Simulations using simplified bubble geometries have implemented approximate contributions of both types (Fortuna et al. Reference Fortuna, Thomas, de Almeida and Graner2012; Thomas et al. Reference Thomas, Belmonte, Graner, Glazier and de Almeida2015; Khakalo et al. Reference Khakalo, Baumgarten, Tighe and Puisto2018), although more work is needed to justify their forms for the Plateau border contributions, which were originally derived for  $\phi \gg \phi _{c}$.
Schimming & Durian (Reference Schimming and Durian2017) compared their approximate gas flow rates through Plateau borders, obtained by a similar approach to the above, with those given by solving Laplace's equation numerically. They obtained close agreement for thin films. However, our simulations use relatively thick films to ensure convergence, and  $\delta l$ is finite (around one hundredth of the bubble perimeter), whereas $\delta l \to 0$ in their analytical results. Therefore, the error in our bubble growth rates is not fully characterised, though we expect the approximation to be effective in thin films, since it is based on the solution to Laplace's equation between parallel straight interfaces. We also note that each element of interface can exchange gas with only one neighbouring bubble, which may induce further errors in the gas flow through Plateau borders, where neighbouring bubbles meet (R. Höhler, personal communication). However, comparing the predictions of our coarsening model with existing growth laws in § 3.3, we find fair agreement for the gas flow through Plateau borders at small and large liquid fractions, thus supporting our approximate approach.
We note that our coarsening model does not conserve the total area of gas in the foams. Let  $\sigma (\dot {A})$ denote the standard deviation of the bubble growth rate distribution. Since the mean growth rate satisfies $\langle \dot {A} \rangle = 0$ when the gas is conserved (Cantat et al. Reference Cantat, Cohen-Addad, Elias, Graner, Höhler, Pitois, Rouyer and Saint-Jalmes2013, p. 105), a dimensionless measure of non-conservation is $|\langle \dot {A} \rangle | / \sigma (\dot {A})$. For the systems described later in § 3, this relative error takes a value below $1\,\%$ for $\theta = 10^\circ$. For repulsive $\varPi _{D}$, the error increases from less than $1\,\%$ at $\phi = 2\,\%$ to approximately $2\,\%$ when $\phi \approx \phi _{c}$. At $\phi = 24.5\,\%$, for which the bubbles are out of contact, the error is around $8\,\%$. For small $\phi$, we believe that this error comes partly from a difference in $h$ between the interfaces of a thin film, caused by the discretisation, which is discussed in Appendix C.
2.3. Generation of disordered foams
We now describe our process for generating the initial disordered foam structure.
As is usual (Cox et al. Reference Cox, Kraynik, Weaire and Hutzler2018; Jing et al. Reference Jing, Feng, Cox and Hutzler2021), we begin with a Voronoi tessellation of the plane, with a domain containing the desired number of bubbles subject to periodic boundary conditions. These tessellations are obtained using the vor2fe software by Kenneth Brakke (Brakke Reference Brakke1986). The resulting dry foam is then equilibrated using standard techniques (Brakke Reference Brakke1992), with one straight edge per liquid film for efficiency. Relaxing the dry foam before setting the liquid fraction  $\phi$ (Jing et al. Reference Jing, Wang, Lv, Wang and Luo2015) is useful for computational efficiency.
To obtain a more representative bubble area distribution for coarsening foams than that of a Voronoi tiling, we sample areas  $A$ from the distribution fitted by Roth et al. (Reference Roth, Jones and Durian2013) to experimental data for quasi-two-dimensional foams (i.e. foams in Hele-Shaw cells). This is a compressed exponential distribution, defined (up to normalisation) by (Roth et al. Reference Roth, Jones and Durian2013)
 \begin{equation} \rho(A / \langle A \rangle) = \left(\frac{A}{\langle A \rangle}\right)^{\beta_1 - 1} \exp\left[-\beta_2 \left(\frac{A}{\langle A \rangle}\right)^{\beta_1}\right] , \end{equation}
where  $\langle A \rangle$ is the mean area, $\beta _1 = 1.21$, and $\beta _2 = 0.926$. The sampled areas are randomly assigned to the bubbles in the Voronoi foam (Jing et al. Reference Jing, Wang, Lv, Wang and Luo2015), without regard to their initial areas. The bubble areas are changed gradually, in tenths of the difference between the old and new values, with equilibration at each step. We note that the data of Roth et al. (Reference Roth, Jones and Durian2013) are for foams with small $\phi$, and may differ from the truly two-dimensional case we model.
The sampled areas are more polydisperse than those obtained from a Voronoi tessellation. Let  $R_{2 1} \equiv \langle R^2 \rangle / \langle R \rangle$ (Cantat et al. Reference Cantat, Cohen-Addad, Elias, Graner, Höhler, Pitois, Rouyer and Saint-Jalmes2013, p. 251). Then the bubble distributions have a polydispersity $\mathcal {P} = R_{2 1} / \sqrt {\langle R^2 \rangle } - 1$ (Cox et al. Reference Cox, Kraynik, Weaire and Hutzler2018) of $0.093$ for the sampled areas and $0.036$ for the Voronoi tessellations. The former value was evaluated numerically from (2.13), and the latter calculated for a single 16 384-cell tessellation (though $\mathcal {P}$ fluctuates for the relatively small foams we study in § 3). We have not observed qualitative differences in the foam or bubble properties considered in § 3 when the Voronoi-tessellation areas are used. The same relationships between growth rate and radius, for example, are observed at the lower polydispersity, but only over the narrower interval of realised bubble radii. Hence, even if the sampled area distribution is unrealistic for larger $\phi$, its high polydispersity remains useful for characterising the relationships for a wider range of bubble radii.
Next, the system is annealed following the approach of Kraynik et al. (Reference Kraynik, Reinelt and van Swol2003), adapted to two dimensions, so that the distribution of bubble topology better approximates that in a real foam (Kraynik et al. Reference Kraynik, Reinelt and van Swol2003). By applying linear transformations to the foam's periodic domain, along with the mesh vertices therein, a sequence of extensional step strains with size  $\{6/5, 5/6, 5/6, 6/5\}$ (Kraynik et al. Reference Kraynik, Reinelt and van Swol2003) is applied along both axes in turn, with relaxation after every strain. Further transformations are then applied to the periodic domain and the vertices, by applying cycles of simple and extensional shear (Weaire & Hutzler Reference Weaire and Hutzler1999), to relax the deviatoric stress, measured according to Appendix B.1, to zero (within a tolerance $10^{-5}\,\gamma _\infty / \langle R \rangle$). We do this by applying small shears of the respective type to estimate the modulus, before using a shear which would zero the strain given this modulus and the present stress, were the system linear. Stress relaxation of the initial structure was performed in the dry foam coarsening simulations of Herdtle & Aref (Reference Herdtle and Aref1992). We have not investigated the effects of varying this preparation process.
The liquid fraction  $\phi$ is then set, by duplicating the mesh edges and vertices associated with each bubble (since these are shared by neighbours in the dry model), and uniformly expanding the simulation domain to $1/(1 - \phi )$ of its original area. The same transformation is applied to the bubble centroids, while the bubble shapes and sizes are maintained. Hence, $\phi$ is set by effectively adding liquid to the system, keeping the gas area fixed (Cox et al. Reference Cox, Kraynik, Weaire and Hutzler2018).
We next subdivide all edges on the bubble interfaces  $m$ times in order to obtain the desired mesh refinement. Some of the initial edges are very short, so these are skipped to improve convergence. The longer edges are further subdivided to compensate. The mean number of edges (and vertices) per bubble is then $n_{e} = 6 \times 2^m$, since $6$ is the mean number of bubble neighbours (and hence mesh edges) in the initial dry foam (Weaire & Hutzler Reference Weaire and Hutzler1999, p. 29). After initial structural relaxation, vertices are added or deleted to ensure small and large bubbles have acceptable numbers of vertices. The criteria are that we refine once all edges longer than $1.05/n_{e}$ of the perimeter of a circle with the mean bubble area (i.e. not much longer than edges in a typical bubble with its initial refinement), and we delete half of each bubble's edges which are shorter than $4.76/n_{e}$ (approximately $1/20$ for $m = 4$, as used in § 3) of the perimeter of a circle with the smallest bubble's area.
The foam's structure is relaxed using the approach of § 2.1. We recall, from § 2.1.2, that the strength of  $\varPi _{D}$ (determining the equilibrium film thickness $h_0$) is set via the foam's capillary pressure $\varPi _{C}$, which is not known beforehand. Hence, we initially relax the foam using a rough estimate of $\varPi _{C}$ adapted from Princen (Reference Princen1979). This is the result for hexagonal foams except with $\phi _{c}$ shifted to $16\,\%$, suitable for disordered foams (Cantat et al. Reference Cantat, Cohen-Addad, Elias, Graner, Höhler, Pitois, Rouyer and Saint-Jalmes2013, p. 195), and $R$ replaced by $R_{2 1}$:
 \begin{equation} \varPi_{C} \approx \frac{\gamma_\infty}{R_{2 1}} \sqrt{\frac{1 - \phi}{1 - \phi_{c}} \frac{\phi_{c}}{\phi}} . \end{equation}
A measurement of  $\varPi _{C}$ in the relaxed foam, obtained from (2.2) directly, is used to reset the strength of $\varPi _{D}$, and the foam is relaxed again. We find that around five iterations of this process are needed for $\varPi _{C}$ to converge to precision $10^{-2} \gamma _\infty / \sqrt {A_{F}}$ (where $A_{F}$ is the area of the foam's periodic domain). Once this is done, the desired equilibrium film thickness $h_0$ is approximately obtained. However, as mentioned in § 2.1.2, the film thickness will vary between bubbles, due to their variations in pressure (Princen Reference Princen1988).
Finally, the deviatoric stress is relaxed again (now with a larger tolerance  $10^{-3}\gamma _\infty / \langle R \rangle$, due to the extra computational cost for a wet foam), giving an initial wet foam structure that is intended to be representative of a bulk foam. In the next section, we analyse coarsening-related bubble properties within such foam samples. We use five distinct samples containing $256$ bubbles, along with a single sample of $1024$ bubbles, which are analysed at different liquid fractions and contact angles, as described below. As noted in § 1, we do not coarsen these samples with time (i.e. evolve the bubble areas according to their growth rates) due to the small system sizes (Thomas et al. Reference Thomas, de Almeida and Graner2006).
3. Results
We now present our main results, on coarsening-related properties of two-dimensional disordered wet foams, for various liquid fractions  $\phi$ and contact angles $\theta$.
Our simulations follow a similar method to that of Bolton & Weaire (Reference Bolton and Weaire1990) in gradually increasing  $\phi$, and relaxing the foam's structure at each step (we also relax the film thickness and applied stress at every $\phi$). Their approach has been applied by Cox et al. (Reference Cox, Kraynik, Weaire and Hutzler2018), Jing et al. (Reference Jing, Feng, Cox and Hutzler2021), Feng et al. (Reference Feng, Jing, Ma and Wang2021) and Jing & Feng (Reference Jing and Feng2023). We thereby capture the flocculation (Cox et al. Reference Cox, Kraynik, Weaire and Hutzler2018) discussed in § 3.1, whereas qualitatively different foam structures result if $\phi$ is set to a large value in a single step.
We perform these liquid fraction sweeps from  $\phi = 2\,\%$ to $25\,\%$. The upper bound is arbitrary, and chosen so that data is obtained for foams with liquid fractions above the unjamming transition without bubble attraction, i.e. $\phi _{c} \approx 16\,\%$ (Cantat et al. Reference Cantat, Cohen-Addad, Elias, Graner, Höhler, Pitois, Rouyer and Saint-Jalmes2013, p. 195). The lower bound is determined by convergence. Previous simulations (with $\theta > 0$) using a different structural model have used the same upper bound (Cox et al. Reference Cox, Kraynik, Weaire and Hutzler2018; Jing et al. Reference Jing, Feng, Cox and Hutzler2021).
Simulations are run for  $\theta \in \{0, 2.5^\circ, 5^\circ, 7.5^\circ, 10^\circ \}$, and for repulsive $\varPi _{D}$. Our range for $\theta$ is comparable to prior numerical studies (Feng et al. Reference Feng, Jing, Ma and Wang2021; Jing et al. Reference Jing, Feng, Cox and Hutzler2021), and does not exceed contact angles observed in foam experiments (Princen Reference Princen1968; Seknagi Reference Seknagi2022). Larger values of $\theta$ could be studied, but result in slower convergence and require higher mesh refinement. We also note $\theta = 10^\circ$ is small enough that $\sin \theta \approx \theta$ and $\cos \theta \approx 1$. We use these approximations while obtaining theoretical results below.
We set the equilibrium film thickness  $h_0$ to $\langle R \rangle / 100$. Our simulations cannot converge for values much below $\langle R \rangle / 200$ at the selected degree of refinement, stated below, recalling our comments in § 2.1.
The simulated foams contain  $256$ or $1024$ bubbles. Our energy-change threshold for halting structural relaxation is $10^{-6} \gamma _\infty \sqrt {A_{F}}$ (over $20$ conjugate gradient iterations), where $A_{F}$ is the area of the foam's periodic domain, and we use $m = 4$ refinements of the initial dry-foam mesh. Hence, the mean number of vertices per bubble is initially $96$, before the discretisation of large or small bubbles is adjusted. The liquid fraction is incremented in steps of $\Delta \phi = 0.5\,\%$. These parameters have been varied to check convergence. The growth rates at $\phi = 2\,\%$ for $m = 4$ differ from their values at $m = 5$ by approximately $10\,\%$. The difference corresponds to a uniform scaling for all bubbles to a good approximation, and may be related to convergence of the Young–Laplace law as applied to the films. This is discussed in Appendix C where we describe a convergence test in detail.
The execution time for one liquid fraction sweep with  $256$ bubbles is approximately 100 h on a personal computer with a recent $16$-core Intel i7 processor, 16 GB of random-access memory, and a solid-state drive, recalling that no parallel processing is used. A sweep with $1024$ bubbles takes around 700 h. The execution times are usually lower for smaller $\theta$ and larger $\phi$, and when bubble areas are taken directly from the initial Voronoi tessellation.
In § 3.1 below, we describe the global properties of the simulated foams. Next, in § 3.2, we discuss coarsening-related properties of individual bubbles, and develop some analytical approximations. Section 3.3 concerns the variation of the simulated bubble growth rates with  $\phi$, and their comparison with prior growth laws. Finally, in § 3.4, we consider the aggregated properties of the foam's bubbles, in order to better quantify their variation with $\phi$ and $\theta$.
3.1. Foam properties
Let  $\bar {\boldsymbol {\tau }}_{F}$ be the stress tensor spatially averaged, after Batchelor (Reference Batchelor1970), over a two-dimensional foam. Let $A_{F}$ be the foam's total area, $A_k$ the area and $p_k$ the pressure of the $k\text {th}$ bubble, and let $\boldsymbol {t}$ be the unit tangent and $\gamma$ the surface tension at a point on the union $\varGamma _{F}$ of all liquid–gas interfaces in the foam. Also let $\delta _{i j}$ be the Kronecker delta symbol. Then the components of $\bar {\boldsymbol {\tau }}_{F}$ are (Batchelor Reference Batchelor1970; Cantat et al. Reference Cantat, Cohen-Addad, Elias, Graner, Höhler, Pitois, Rouyer and Saint-Jalmes2013, pp. 175–177)
 \begin{equation} (\bar{\boldsymbol{\tau}}_{F})_{i j} = \frac{1}{A_{F}} \left(\int_{\varGamma_{F}} \gamma t_i t_j \,{\rm d} l - \sum_k p_k A_k \delta_{i j}\right) , \end{equation}
recalling that we set the liquid pressure to zero. Our means of measuring  $\bar {\boldsymbol {\tau }}_{F}$ in the simulations is given in Appendix B.1. The osmotic pressure (Princen Reference Princen1979) is then given by (Hutzler & Weaire Reference Hutzler and Weaire1995; Höhler et al. Reference Höhler, Seknagi and Kraynik2021)
 \begin{equation} \varPi_{O} ={-}\tfrac{1}{2} \operatorname{Tr} \bar{\boldsymbol{\tau}}_{F} . \end{equation}
This is the average pressure in the foam, above that of the liquid (Höhler et al. Reference Höhler, Seknagi and Kraynik2021). It is also approximately the pressure that a piston would need to exert on the foam to maintain its present  $\phi$, where this piston is permeable to the liquid but not the bubbles (Princen Reference Princen1979; Höhler et al. Reference Höhler, Seknagi and Kraynik2021).
In figure 8, we plot the simulated variation of  $\varPi _{O}$ with effective liquid fraction (defined below) for several $\theta$. The osmotic pressure is positive for $\phi$ up to a threshold value, at all considered $\theta$. This threshold is approximately the unjamming transition $\phi _{c} \approx 16\,\%$ (Cantat et al. Reference Cantat, Cohen-Addad, Elias, Graner, Höhler, Pitois, Rouyer and Saint-Jalmes2013, p. 195) for small $\theta$, as expected (Hutzler & Weaire Reference Hutzler and Weaire1995), and decreases for larger $\theta$, as for hexagonal foams (Princen Reference Princen1979). For $\phi$ above the threshold, $\varPi _{O} \approx 0$, so the foam is no longer under compression. For repulsive $\varPi _{D}$ and $\theta = 0$, the variation of $\varPi _{O}$ with $\phi$ is in qualitative agreement with prior simulation results (Hutzler & Weaire Reference Hutzler and Weaire1995), including, via figure 8(b), the apparent scaling $\varPi _{O} \sim (\phi - \phi _{c})^2$ near $\phi _{c}$. At larger $\theta$, the greater differences between individual runs at small $\varPi _{O}$, reflected in the error bars of figure 8(b), are interpreted to arise from an observed dependence on initial conditions, mentioned below, in the manner in which flocculation progresses.
Osmotic pressure  $\varPi _{O}$ versus effective liquid fraction, defined in (3.3), in foams with different contact angles $\theta$. Data is given for $1024$-bubble runs in (a), while (b) gives the variation of $\sqrt {\varPi _{O}}$ for $256$-bubble runs to clarify the zero of $\varPi _{O}$. The data in (b) is averaged over five different initial foams, with the square root then being taken, and the error bars give the propagated sample standard deviation of the linear data. For comparison, the solid (dashed) curve is for a $1500$-bubble foam with $\theta = 10.8^\circ$ ( $\theta = 5.1^\circ$) and $h_0 = 0$, simulated with the model of Cox et al. (Reference Cox, Kraynik, Weaire and Hutzler2018). The curves in (b) end when $\varPi _{O} < 0$.

Alongside our data, we plot that obtained using the same simulation model as Cox et al. (Reference Cox, Kraynik, Weaire and Hutzler2018), i.e. the Surface Evolver with  $h_0 = 0$. Good agreement is observed. To make the comparison, we correct for our finite film thickness by plotting against the effective liquid fraction $\phi _{eff}$, instead of $\phi$, obtained by subtracting from the foam's liquid area a strip of width $h_0/2$ around the perimeter of each bubble (Princen Reference Princen1979; Khan & Armstrong Reference Khan and Armstrong1989). If $\langle P \rangle$ is the mean bubble perimeter (the perimeter $P$ is to be distinguished from the foam polydispersity $\mathcal {P}$), and $\langle A \rangle$ the mean bubble area, then
 \begin{equation} \phi_{eff} = \phi - (1 - \phi) \frac{h_0 \langle P \rangle} {2 \langle A \rangle} . \end{equation}
For a  $1024$-bubble foam with $\phi = 2\,\%$, we find $\phi _{eff} \approx 1.14\,\%$, with the deviation decreasing as $\phi$ increases. The contact angle $\theta$ does not have a strong effect. A three-dimensional version of (3.3) was used by Mason et al. (Reference Mason, Lacasse, Grest, Levine, Bibette and Weitz1997).
In figure 9, we show the foam structure at  $\phi = 25\,\%$ for several $\theta$. These foams all have $\varPi _{O} \approx 0$, recalling figure 8, and so it is clear that a variety of structures can have zero osmotic pressure. For repulsive $\varPi _{D}$, the osmotic pressure is zero because the bubbles are not touching. However, when there is bubble attraction the foam flocculates, as found by Cox et al. (Reference Cox, Kraynik, Weaire and Hutzler2018) in simulated foams, and as is well known in emulsions (Bibette et al. Reference Bibette, Mason, Gang, Weitz and Poulin1993). A clustered structure with many contacting bubbles is energetically favourable, due to the decrease of interface tension within films, recalling (2.4) (Princen Reference Princen1983; Cox et al. Reference Cox, Kraynik, Weaire and Hutzler2018). The presence of bubble attraction, and hence flocculation, for $\theta = 0$ is a consequence of finite film thickness, as discussed in § 2.1.2. At $\theta = 10^\circ$, different initial foam structures result in different manners of flocculation (e.g. some will form a single fissure, while others form multiple large Plateau borders).
Simulated structure of  $256$-bubble periodic foams at $\phi = 25\,\%$, for (a) repulsive $\varPi _{D}$, (b) $\theta = 0$ and (c) $\theta = 10^\circ$. A square subset of each foam, with area equal to that of the periodic domain, is shown. Since the latter domain is deformed due to stress relaxation (§ 2.3), some simulated bubbles may be omitted or may appear twice. Each foam was generated from the same initial dry structure.

We note, from figure 8, that  $\varPi _{O} < 0$ for a range of $\phi$ near $16\,\%$ at contact angle $\theta = 10^\circ$ (including for the data with $h_0 = 0$). This would correspond to the foam exerting suction on the confining piston mentioned above. As $\phi$ is further increased, $\varPi _{O}$ increases towards zero. We interpret this behaviour as arising from the energy cost for a bubble to lose a neighbour at high $\theta$. Bubbles therefore experience some extension before they detach, and this regime, in which the foam is not fully flocculated, has $\varPi _{O} < 0$. Our interpretation is supported by the observation that, when $\phi$ is decreased again from $25\,\%$, $\varPi _{O}$ remains non-negative (not shown). This hysteresis is in contrast to the behaviour for repulsive $\varPi _{D}$ (Hutzler & Weaire Reference Hutzler and Weaire1995).
Next, in figure 10, we plot the mean number of bubble neighbours  $\langle n \rangle$. We measure $n$ for a bubble $B_i$ by counting the distinct bubbles from whose interfaces the vertices of $B_i$ experience a positive (i.e. repulsive) $\varPi _{D}$. The behaviour of $\langle n \rangle$ has been studied in detail for $\theta > 0$ (Feng et al. Reference Feng, Jing, Ma and Wang2021; Jing et al. Reference Jing, Feng, Cox and Hutzler2021; Jing & Feng Reference Jing and Feng2023), and by Winkelmann et al. (Reference Winkelmann, Dunne, Langlois, Möbius, Weaire and Hutzler2017) and Boromand et al. (Reference Boromand, Signoriello, Lowensohn, Orellana, Weeks, Ye, Shattuck and O'Hern2019) without bubble attraction (the latter using a comparable model to ours). Unlike the prior studies that we are aware of, we have used the same model for both cases.
Mean number of neighbours  $\langle n \rangle$ versus effective liquid fraction, defined in (3.3), for foams with various degrees of bubble attraction. Data from single runs are plotted for $1024$-bubble foams, while the data for $256$-bubble foams is averaged over five runs (the error bars give the sample standard deviation). The solid curve is the PLAT data at $\theta = 0$ and $h_0 = 0$ given by Jing et al. (Reference Jing, Feng, Cox and Hutzler2021), and we also compare with $h_0 = 0$ simulations at $\theta = 10.8^\circ$ (dashed curve) and $\theta = 5.1^\circ$ (dotted curve) using the approach of Jing et al. (Reference Jing, Feng, Cox and Hutzler2021) and Cox et al. (Reference Cox, Kraynik, Weaire and Hutzler2018) – the same runs as in figure 8.

The simulation data given by Jing et al. (Reference Jing, Feng, Cox and Hutzler2021), obtained using the PLAT software, is in good agreement for smaller  $\phi _{eff}$. The deviation at larger values may be due to our finite film thickness. In figure 10, we also compare with simulations using the same model as Jing et al. (Reference Jing, Feng, Cox and Hutzler2021) for $\theta > 0$. The disagreement is much larger (surprisingly, given the consistency in figure 8), although the qualitative behaviour (Feng et al. Reference Feng, Jing, Ma and Wang2021) is the same. The approximate plateaus to which $\langle n \rangle$ decreases are considerably lower in our simulations, and the failure of the decoration theorem, resulting in $\langle n \rangle < 6$ (Bolton & Weaire Reference Bolton and Weaire1990), occurs at smaller $\phi _{eff}$. Our deviations from Jing et al. (Reference Jing, Feng, Cox and Hutzler2021) are slightly smaller, but still large, and we find less of a difference than them between zero and slight bubble attraction.
Although the simulations with  $\theta > 0$ that we compare with in figure 10 have a much lower polydispersity ( $\mathcal {P} = 0.008$ for $\theta = 10.8^\circ$ and $\mathcal {P} = 0.041$ for $\theta = 5.1^\circ$, for $\mathcal {P}$ as defined in § 2.3) than we use, we do not believe that this can account for the whole discrepancy. For identical initial dry foam structures, we found in tests that the variation of $\langle n \rangle$ still showed a large difference between the predictions of the simulations described here, and of those following the techniques of Jing et al. (Reference Jing, Feng, Cox and Hutzler2021) (which have zero film thickness $h_0$). Instead, we suggest that the cause may be the finite size of the transition region (Kralchevsky & Ivanov Reference Kralchevsky and Ivanov1985b) between films and Plateau borders when $h_0 > 0$, which should limit the minimum film length (which is zero for $h_0 = 0$) to finite values, and thus decrease the maximum attractive force that a bubble may exert on a neighbour. Attractive contributions to the force come from the ends of the film, where the interface separation passes through the minimum of $\varPi _{D}$ (see figure 3), while the contributions from the rest of the film are repulsive since $\varPi _{D} > 0$ there (Denkov et al. Reference Denkov, Petsev and Danov1995). The contributions from the film ends are constant for fixed $\theta$ (see Appendix A), whereas the repulsive contribution increases (in magnitude) with film length, as it is given by integrating $\varPi _{D}$ along the film. Hence, the maximum attractive force decreases with increasing minimum film length. A reduction in the maximum force would result in earlier detachment of adhered bubbles for $h_0 > 0$ as $\phi$ is increased, thus lowering $\langle n \rangle$ compared with the case for $h_0 = 0$.
Finally, we note that care is needed when increasing  $\phi$ in our simulations with bubble attraction, due to the fragility of the bubble clusters, which can easily be broken apart if the step $\Delta \phi$ is too large. This would decrease $\langle n \rangle$, although our convergence tests imply that this is not the cause of our differences from prior data.
3.2. Bubble properties
We now turn to the properties of individual bubbles. As noted in § 1, the growth rate of a bubble is determined partly by its pressure  $p$ and the length $L$ of its perimeter along which it is in contact with its neighbours, i.e. its film length (Lemlich Reference Lemlich1978; Roth et al. Reference Roth, Jones and Durian2013). Therefore, we focus on these properties, before considering the growth rates themselves in § 3.3.
3.2.1. Bubble pressures
In figure 11, we plot the scaled pressures of the bubbles against their effective radii  $R$. Let $r_{PB}$ be the radius of curvature of a bubble's Plateau borders, given via the Young–Laplace law $p = \gamma _\infty / r_{PB}$ (Weaire & Hutzler Reference Weaire and Hutzler1999). Then the plotted property is $p R / \gamma _\infty = R / r_{PB}$, which is a measure of bubble deformation. From the figure, this ratio approaches unity as $R \to 0$, i.e. the smallest bubbles are circular and undeformed. These are analogous to ‘rattlers’ which exist in the Plateau borders of a polydisperse foam (Khakalo et al. Reference Khakalo, Baumgarten, Tighe and Puisto2018; Galvani et al. Reference Galvani2023). At smaller liquid fractions, $R / r_{PB}$ increases with $R$, so larger bubbles experience relatively more deformation (Bolton & Weaire Reference Bolton and Weaire1991). This is illustrated in figure 12. At higher liquid fractions, $R / r_{PB} \approx 1$ for all $R$, as expected for repulsive $\varPi _{D}$, because all bubbles are approximately circular at $\phi$ near and above that of the unjamming transition (Durian Reference Durian1995). However, we see from figure 11(b) that $R / r_{PB} \approx 1$ also holds in foams with bubble attraction at large $\phi$ (i.e. flocculated foams), consistent with theory for ordered foams (Princen Reference Princen1979), although there is a greater spread in $R / r_{PB}$ for larger $\theta$ at all $\phi$.
Scaled pressure  $p R / \gamma _\infty = R / r_{PB}$ versus effective radius $R$, where $r_{PB}$ is the Plateau border curvature radius, for individual bubbles in $1024$-bubble foams at various liquid fractions. Data for (a) repulsive $\varPi _{D}$ and (b) $\theta = 10^\circ$ is shown, and compared with (3.8) using the osmotic pressure measured in the simulations. We also compare with a version of (3.8) for which the factor $1/(1 - \phi )$ mentioned in the text is retained.

Illustration of the observation that larger bubbles are more deformed in a wet foam (Bolton & Weaire Reference Bolton and Weaire1991), using a simulation with  $\phi = 3.5\,\%$ and repulsive $\varPi _{D}$. The smallest bubbles are almost circular.

The relationship between  $R$ and $p R / \gamma _\infty$ appears linear to a good approximation. To interpret this, we use the approach of Höhler et al. (Reference Höhler, Seknagi and Kraynik2021). They generalised to arbitrary polydispersity an established relation (Princen Reference Princen1988) between the osmotic and capillary pressures in three-dimensional monodisperse foams. The same proof in two dimensions, extended from $\theta = 0$ to our considered contact angles $\theta \lesssim 10^\circ$, for which $\cos \theta \approx 1$, gives
 \begin{equation} \varPi_{C} \approx \frac{\varPi_{O}}{1 - \phi} + \frac{\gamma_\infty}{R_{2 1}} . \end{equation}
This incorporates an approximation of each bubble's perimeter by that of a circle with equal area (Kraynik et al. Reference Kraynik, Grassia, Cox, Neethling, van Swol, Evans, Schroeder-Turk and Mecke2012). A verification that (3.4) holds in our simulations is given in figure 13. We now adapt the argument of Höhler et al. (Reference Höhler, Seknagi and Kraynik2021), which they apply over the entire foam, to a single bubble of effective radius  $R$ and pressure $p$, and make additional simplifying assumptions. Let $\bar {\boldsymbol {\tau }}$ be the stress tensor spatially averaged over the considered bubble, including its interface $\varGamma$. Let $h$ be the local interface separation at a point on $\varGamma$, with $\gamma (h)$ the corresponding surface tension and $\boldsymbol {t}$ the unit tangent. Let $A = {\rm \pi}R^2$ be the bubble's area. Hence, in component form, (Batchelor Reference Batchelor1970; Cantat et al. Reference Cantat, Cohen-Addad, Elias, Graner, Höhler, Pitois, Rouyer and Saint-Jalmes2013, pp. 175–177)
 \begin{equation} \bar{\tau}_{i j} = \frac{1}{A} \oint_\varGamma \gamma(h) t_i t_j \, {\rm d} l - p \delta_{i j} , \end{equation}
where  $\delta _{i j}$ is the Kronecker delta. We note that averaged stresses over individual bubbles in a dry foam were considered by Kraynik et al. (Reference Kraynik, Grassia, Cox, Neethling, van Swol, Evans, Schroeder-Turk and Mecke2012). Also let $\bar {p} = -\tfrac {1}{2} \operatorname {Tr} \bar {\boldsymbol {\tau }}$ be the bubble's reduced pressure, defined analogously to $\varPi _{O}$ (Höhler et al. Reference Höhler, Seknagi and Kraynik2021). This reduced pressure differs from the bubble's gas pressure $p$. Using (3.5), we obtain
 \begin{equation} \bar{p} = p - \frac{1}{2 {\rm \pi}R^2} \oint_\varGamma \,{\rm d} l \,\gamma (h) . \end{equation}
Next, we evaluate the integral, using that  $\gamma (h) \approx \gamma _\infty$ in the films, from (2.4) and recalling that we have $\cos \theta \approx 1$ since $\theta \lesssim 10^\circ$. We also approximate the bubble perimeter as that of a circle with the same area. The error in doing so is around $6\,\%$ for a simulated dry foam (Kraynik et al. Reference Kraynik, Grassia, Cox, Neethling, van Swol, Evans, Schroeder-Turk and Mecke2012), and expected to be smaller for larger $\phi$. Hence, we obtain
 \begin{equation} \bar{p} \approx p - \frac{\gamma_\infty}{R}. \end{equation}
As a first approximation, we take the reduced pressure  $\bar {p}$ to be the same for all bubbles. Since $\bar {p}$ is related to the forces applied externally to the bubble (Landau et al. Reference Landau, Lifshitz, Kosevich and Pitaevskiĭ1986, p. 7), as shown in Appendix A, this corresponds to a mean-field assumption (Lemlich Reference Lemlich1978; Feitosa et al. Reference Feitosa, Halt, Kamien and Durian2006) that the environment of each bubble is comparable. Substituting (3.7) into (3.4), and using (2.2) for $\varPi _{C}$, gives $\bar {p} = \varPi _{O} / (1 - \phi )$. Hence, for $\theta \lesssim 10^\circ$,
 \begin{equation} p \approx \varPi_{O} + \frac{\gamma_\infty}{R} , \end{equation}
omitting the factor of  $1-\phi$ for simplicity, which we find is a good approximation for all considered $\phi$ in two dimensions (see figure 11). This is the single-bubble analogue of the more rigorous (3.4). Its agreement with the data, shown in figure 11, indicates that bubbles approximately obey an effective Young–Laplace law, with a mean-field external pressure $\varPi _{O}$ (whose value is currently taken from the simulations, but not fitted). Agreement also exists when the bubble areas are taken directly from a Voronoi tessellation (data not shown). We therefore suggest that the pressure environment of the bubbles, determined by their neighbours, is comparable throughout the foam (Jorjadze, Pontani & Brujic Reference Jorjadze, Pontani and Brujic2013), and does not have a strong systematic variation with the bubble size.
Capillary pressure versus liquid fraction for  $1024$-bubble foams with repulsive $\varPi _{D}$ and $\theta = 10^\circ$. Comparison is made to (3.4) for both cases, using $\varPi _{O}$ as measured in the simulations at each liquid fraction step. The prediction of $\varPi _{C}$ is linearly interpolated between these steps for clarity.

We are not aware of prior discussions of (3.8) for polydisperse wet foams in the literature, although a comparable exact result for dry foams (when approximated as having straight films) is known (Li et al. Reference Li, Moazzeni, Liu and Lin2023). The osmotic pressure diverges in this limit, so the relation is between the radius of a bubble and its pressure relative to some zero. It would be interesting to see, through similar simulations, whether this type of simple approximation also holds in three-dimensional polydisperse wet foams. As shown in the next section, (3.8) may be applied to develop models for other bubble properties.
3.2.2. Film lengths
We now consider the total length  $L$ of the thin films adjoining a given bubble in the simulated foams, which we recall is another determinant of the bubble's growth rate. Noting figure 1(b), $L$ is the length of the bubble's liquid–gas interface in contact with other bubbles, and we describe our method for measuring $L$ in Appendix B.3. Comparably to Denkov et al. (Reference Denkov, Petsev and Danov1995), we measure $L$ in our simulations by approximating each film interface with a circular arc, and determining the latter's intersection with (or closest approach to) circular arcs approximating the two adjoining Plateau-border interfaces (cf. figure 2). These interfaces are expected to approach circular arcs for high levels of mesh refinement, by the Young–Laplace law (Weaire & Hutzler Reference Weaire and Hutzler1999). The bubble film lengths are plotted in figure 14 for small and large $\phi$. We plot the ratio of $L$ to the bubble perimeter $P$ in figure 14(a), i.e. the proportion of bubble interface adjoining a thin film. The length per film, relative to $P$, is given in figure 14(b).
Ratio of film length to perimeter versus effective radius for individual bubbles (with  $n$ neighbours) in a $1024$-bubble foam, (a) at $\phi = 2\,\%$ with repulsive $\varPi _{D}$, and (b) at $\phi = 25\,\%$ with $\theta = 10^\circ$. Comparison is made with (3.9), with $\varPi _{O}$ taken from the simulations in (a), and assumed to be zero in (b) due to flocculation. The relative length per film $L / (n P)$ is plotted in (b), since this is predicted directly by (3.9) for $\varPi _{O} = 0$.

At  $\phi = 2\,\%$, figure 14(a) shows that $L / P$ decreases with decreasing bubble radius $R$, in agreement with the observation that smaller bubbles experience less deformation (Bolton & Weaire Reference Bolton and Weaire1991). As $R$ increases, $L / P$ appears to saturate. No qualitative variation in this behaviour with $\theta$ was observed. At large $\phi$, where $L$ is smaller due to decreased bubble deformation, the film proportion depends strongly on $\theta$ due to flocculation, as shown in § 3.4.1.
Certain features of  $L / P$ may be captured by an analytic approximation, as for the bubble pressures. Let $\bar {R} \equiv R / R_{2 1}$ and $\bar {\varPi } \equiv \varPi _{O} R_{2 1} / \gamma _\infty$ (Princen Reference Princen1988) be dimensionless measures of bubble size and osmotic pressure, respectively. In Appendix A, we argue that
 \begin{equation} \frac{L}{P} \approx 2 \frac{\bar{\varPi} \bar{R} + n \theta / {\rm \pi}}{1 + \left(2 \bar{\varPi} + 1\right) \bar{R}} . \end{equation}
This is derived by relating the reduced bubble pressure  $\bar {p}$ to the forces applied to the bubble's interface by its neighbours, and approximating this pressure by $\varPi _{O}$ as previously. We assume $\theta \lesssim 10^\circ$, as considered in our simulations, so that $\sin \theta \approx \theta$ and $\cos \theta \approx 1$. The predictions of this equation are compared with the simulated values of $L$ in figure 14.
The general variation of  $L$ with $R$ at low liquid fractions and for repulsive $\varPi _{D}$ is captured, although the spread at a given $R$ is not. The approximations used to derive (3.9) effectively average the explicit dependence upon $n$. In particular, we neglect the detailed geometry of a bubble's films, which we expect to vary with $n$ due to constraints from Plateau's laws (Weaire & Hutzler Reference Weaire and Hutzler1999; Roth et al. Reference Roth, Jones and Durian2013), at small $\phi$ where the decoration theorem holds (Bolton & Weaire Reference Bolton and Weaire1991). Hence, the bands in figure 14(a) are not reproduced.
An isotropic model (Roth et al. Reference Roth, Jones and Durian2013) might predict the spread in  $L$ at small $\phi$, including the bands for different neighbour numbers $n$. However, its reliance on the decoration theorem precludes applicability to moderate $\phi$, which is our regime of interest.
For foams with  $\theta > 0$, an approximate relation between $n$ and $R$ in wet foams is needed for (3.9) to predict $L$ as a function of $R$ only. This is beyond our scope, and so we gauge (3.9) via $L / (n P)$ (the relative length per film) in flocculated foams for which $\varPi _{O} \approx 0$. Again, a broad agreement with the data is seen in figure 14(b). We emphasise that, in general, the explicit $n$ term does not account for the whole dependence of $L$ on $n$, such as the bands in figure 14(a), due to the mentioned averaging. These bands are present at small $\phi$ for all $\theta$ in the considered range.
Equation (3.9) predicts that  $L/P$ increases with $n$ (all else being fixed) when $\theta > 0$, whereas figure 14(a) shows a decrease with $n$ for repulsive $\varPi _{D}$. The latter pattern is still present for $\theta > 0$, at small $\phi$ (data not shown). We interpret it as follows. Consider an idealised Plateau border adjoining $n$ bubbles, each of which has equal pressure so that the border has $n$-fold rotational symmetry. The area of this Plateau border grows with $n$ for fixed pressures, and so a bubble with given radius $R$ will experience less deformation (i.e. will have smaller $L / P$) when inserted into the border if $n$ is larger. However, this level of geometric detail is omitted from the derivation of (3.9), as noted above. Hence, the remaining dependence on $n$ in (3.9) should be interpreted as an approximate correction for $\theta > 0$, increasing the length of the films due to attraction between the bubbles (Feng et al. Reference Feng, Jing, Ma and Wang2021), as discussed further in § 3.4.1.
The behaviour of  $L$ appears more complex than that of $p$, described previously. Nevertheless, we show in § 3.4.1 that an approximate averaging of (3.9) over all bubbles describes the mean film lengths very well.
3.3. Bubble growth rates
We now summarise the simulated bubble growth rates, recalling that these include gas transfer across films and through Plateau borders, as described in § 2.2. We describe in § 3.3.1 how the growth rates change as  $\phi$ is increased. We then compare our simulations with prior models: in § 3.3.2, we consider the relationship between a bubble's growth rate and its effective number of neighbours $n_{eff}$ (Fortuna et al. Reference Fortuna, Thomas, de Almeida and Graner2012), before studying the gas flow through Plateau borders in § 3.3.3.
3.3.1. Effects of liquid fraction
At  $\phi = 0$, which is inaccessible to our simulations, the growth rate of a bubble with $n$ neighbours obeys von Neumann's law (von Neumann Reference von Neumann1952),
 \begin{equation} \dot{A} = \frac{2 {\rm \pi}D H \, \gamma(h_0)}{3 h_0} \left(n - 6\right) , \end{equation}
where  $D$ and $H$ are, respectively, a diffusion coefficient and Henry's constant (see § 2.2), and $\gamma (h_0)$ is the film-interface tension from (2.4). The prefactor multiplying $n - 6$, which is constant for a particular foam, is derived, for example, by Cantat et al. (Reference Cantat, Cohen-Addad, Elias, Graner, Höhler, Pitois, Rouyer and Saint-Jalmes2013, p. 109). Hence, a bubble's growth rate is determined only by its neighbour number $n$ in a dry foam, so that the growth rates fall into discrete bands.
When  $\phi$ is increased to small values, such that almost all Plateau borders still connect exactly three films (i.e. the decoration theorem is approximately satisfied (Bolton & Weaire Reference Bolton and Weaire1991)), the growth rates remain predominantly determined by $n$, although the reduction of gas flow by the Plateau borders induces a dependence upon bubble size and shape (Bolton & Weaire Reference Bolton and Weaire1991; Roth et al. Reference Roth, Jones and Durian2013). In figure 15(a), we plot the bubble growth rates at $\phi = 2\,\%$, noting that a sequence of bands, as predicted by (3.10) for $\phi = 0$, is still apparent at this small liquid fraction. These plotted growth rates are in qualitative agreement with experiments and theory for quasi-two-dimensional foams – in particular, for fixed $n$, the absolute growth rates tend to increase slightly with increasing bubble size (Roth et al. Reference Roth, Jones and Durian2013). This implies that larger bubbles experience less blocking of gas transfer by the Plateau borders (Bolton & Weaire Reference Bolton and Weaire1991), again consistent with their greater observed deformation. As discussed in § 3.3.2, the absolute growth rates of the smallest bubbles are enhanced by their thinner films in our simulations.
Individual bubbles growth rates versus effective radius in a particular  $1024$-bubble foam at different liquid fractions $\phi$, with repulsive $\varPi _{D}$. The number of neighbours $n$ of each bubble is shown. In (a) $\phi = 2\,\%$; in (b) $\phi = 6.5\,\%$; and in (c) $\phi = 15.5\,\%$. The growth rates are scaled so that the rates from von Neumann's law, (3.10), are the integers. A bubble with $n = 14$ lies outside the plotted domain in (a), to better show the banding of the growth rates.

When  $\phi$ is increased further, the Plateau borders grow, and the degree of border blocking increases (Roth et al. Reference Roth, Jones and Durian2013). The primary effect of this is to reduce the absolute growth rates, as shown in figure 15(b). However, the decoration theorem also fails for more bubbles as they detach from their neighbours with increasing $\phi$. The geometric constraints from Plateau's laws (Weaire & Hutzler Reference Weaire and Hutzler1999) are relaxed for such bubbles, resulting in growth rates that lie between the bands hitherto occupied.
Eventually,  $\phi$ is high enough that most of the bubbles adjoin at least one Plateau border which connects more than three films. As shown in figure 15(c), banding in the growth rates is no longer discernible.
The absolute growth rates continue to decrease with increasing  $\phi$, except in the presence of adhesion, where they eventually decrease to a plateau due to flocculation. This is considered further in § 3.4.2. Due to the inclusion of gas flow through the Plateau borders in our model, the growth rates do not shrink to zero at the unjamming transition $\phi _{c} \approx 16\,\%$ for repulsive $\varPi _{D}$. Instead they continue to decrease in magnitude as the bubbles move apart. We expect that our approximation for the growth rates, (2.12) from § 2.2, declines in accuracy as $\phi$ increases beyond this transition, as the gas dissolved in the bulk liquid becomes the main source and sink for bubbles, rather than pairwise transfer between adjacent bubbles (Fortuna et al. Reference Fortuna, Thomas, de Almeida and Graner2012). However, as justified in § 3.3.3, we believe that the coarsening approximation remains valid for flocculated foams, since bubbles remain in contact.
3.3.2. Effective neighbour number
We now compare our simulated growth rates with results from the literature. Fortuna et al. (Reference Fortuna, Thomas, de Almeida and Graner2012) introduced the effective number of neighbours  $n_{eff}$ of a bubble in a two-dimensional wet foam, defined as follows. Let $\varTheta$ be the angle turned by the bubble interface's tangent as its film interfaces are traversed, illustrated in figure 16. Contributions to $\varTheta$ from a convex interface, as in this figure, are positive. Then (Fortuna et al. Reference Fortuna, Thomas, de Almeida and Graner2012)
 \begin{equation} n_{eff} = 6 - 3 \varTheta / {\rm \pi}. \end{equation}
This is equivalent to the bubble's actual number of neighbours  $n$ for $\phi = 0$, and is equal to $6$ in a wet foam when $n = 0$ (Fortuna et al. Reference Fortuna, Thomas, de Almeida and Graner2012). If $n_{eff} < 6$, then (3.11) implies that the film interfaces of the bubble tend to be convex, and so its pressure tends to be larger than those of its neighbours, i.e. it is smaller than average, in a loose sense, from (3.8). The converse is true for $n_{eff} > 6$. In fact, by repeating the derivation (von Neumann Reference von Neumann1952) of von Neumann's law in a wet foam, assuming small uniform film thickness $h_0$ and $\theta = 0$, it can be shown that the border-blocking growth rate of a bubble (i.e. including only gas flow through the films) is exactly
 \begin{equation} \dot{A}_{BB} = \frac{2 {\rm \pi}\gamma_\infty D H}{3 h_0} (n_{eff} - 6) . \end{equation}
This is von Neumann's law with  $n$ replaced by $n_{eff}$, and was derived in a slightly different form by Bolton & Weaire (Reference Bolton and Weaire1991). Fortuna et al. (Reference Fortuna, Thomas, de Almeida and Graner2012) validate this result, in conjunction with an approximation for the Plateau border gas flow, using Potts model simulations. For $\theta > 0$, the only change to (3.12) is that $\gamma _\infty$ becomes $\gamma (h_0)$ from (2.4). Since we consider $\theta \lesssim 10^\circ$, for which $\cos \theta \approx 1$, we have $\gamma (h_0) \approx \gamma _\infty$.
Schematic of the definition of the angle  $\varTheta$ (Fortuna et al. Reference Fortuna, Thomas, de Almeida and Graner2012), described in the text.

We measure  $\varTheta$, and hence $n_{eff}$, by noting that the contribution to $\varTheta$ from a bubble's $j\text {th}$ film is $l_j / r_j$ (Fortuna et al. Reference Fortuna, Thomas, de Almeida and Graner2012), where $l_j$ is the film's length (Appendix B.3), and $r_j$ is its radius of curvature. The latter is positive if the film is convex with respect to the bubble, and is defined using the augmented Young–Laplace equation (Kralchevsky & Ivanov Reference Kralchevsky and Ivanov1985b; Denkov et al. Reference Denkov, Petsev and Danov1995) according to Appendix B.2.
Figure 17 shows our bubble growth rates  $\dot {A}$ plotted against $n_{eff}$ (including contributions from gas flow through the Plateau borders). The two quantities are closely related at all $\phi$ and $\theta$ we have investigated, provided that the bubbles have neighbours (including in flocculated foams). Otherwise $n_{eff} = 6$ identically, while the growth rates still vary.
Bubble growth rate versus  $n_{eff}$ in a $1024$-bubble foam (a) at $\phi = 2\,\%$ for repulsive $\varPi _{D}$, and (b) at $\phi = 25\,\%$ for different $\theta$. A large bubble with $n = 14$ neighbours is omitted from (a), for clarity. The black lines are (3.12) for the set film thickness $h_0$.

This close relationship between  $\dot {A}$ and $n_{eff}$ (with the sign of $\dot {A}$ being well determined by the sign of $n_{eff} - 6$) was not apparent to us from the simulations performed by Fortuna et al. (Reference Fortuna, Thomas, de Almeida and Graner2012), likely due to the fact that the Potts model does not accurately capture bubble geometry. In principle, deviations from (3.12) give the gas transfer through Plateau borders, although the following caveats should be considered.
A separate group of bubbles may be observed in figure 17 at  $\phi = 25\,\%$ and $\theta = 0$, with $n_{eff} < 6$ and growth rates considerably smaller than other bubbles at the same $n_{eff}$ (close to the vertical line). These are interpreted to result from difficulties in defining and measuring film lengths and radii of curvature in extremely short films with a film thickness comparable to their length, due to the transition regions between films and Plateau borders (Kralchevsky & Ivanov Reference Kralchevsky and Ivanov1985b). The group is smaller at higher mesh refinement, but is not practical to eliminate.
We previously mentioned film thickness variations due to our form for  $\varPi _{D}$, in § 2.1.2. The effect of these on the bubble growth rates is shown in figure 18, where we plot our simulated border-blocking growth rates against (3.12), for which the thickness of each film is the set value $h_0$. We measure the border-blocking growth rate of a bubble with pressure $p$ as follows. Let the bubble's $j\text {th}$ film (of $n$) have length $l_j$ (Appendix B.3), thickness $h_j$ (Appendix B.2), and adjoin a bubble with pressure $p_j$. Then (Bolton & Weaire Reference Bolton and Weaire1991; Cantat et al. Reference Cantat, Cohen-Addad, Elias, Graner, Höhler, Pitois, Rouyer and Saint-Jalmes2013)
 \begin{equation} \dot{A}_{BB} = D H \sum_{j=1}^n \frac{l_j}{h_j} (p_j - p) . \end{equation}
We observe from figure 18 that large deviations from (3.12) are mainly restricted to small bubbles. We interpret this by noting that smaller bubbles have higher gas pressure by (3.8), and so the disjoining pressure in their films must be larger to maintain equilibrium, recalling § 2.1.2 (Toshev & Ivanov Reference Toshev and Ivanov1975). Hence, by figure 3, these films are thinner than those of larger bubbles, enhancing the absolute growth rates of small bubbles (Princen Reference Princen1988). Bubble pressure increases nonlinearly with decreasing size, so large bubbles do not show a decrease in their absolute growth rates to the same degree.
Simulated border-blocking bubble growth rates in a  $1024$-bubble foam with repulsive $\varPi _{D}$ at $\phi = 2\,\%$, compared with their scalings to approximately account for film thickness variations between bubbles. Here $\langle h_{f} \rangle$ is a bubble's mean film thickness – a representative thickness is measured (according to Appendix B.2) for each of its films, and the mean of these thicknesses is calculated. The black line is (3.12) with $h_0$ replaced by $h$.
$h$.

We approximately correct for the film thickness variations by scaling the growth rates with the measured mean film thickness  $\langle h_{f} \rangle$ (see caption of figure 18), reducing the differences for small bubbles. This simple scaling cannot be done for the total growth rates, since the dependence on film thickness of Plateau border transfer is different, as seen in the next section. While discrepancies are still present, part of which we expect to come from thickness variations between the individual films of each bubble (agreement is not substantially improved at higher mesh refinement), our results are consistent with (3.12).
In figure 17(b) at  $\phi = 25\,\%$, the growth rates are also affected by the fact that the foam-wide mean film thickness is larger than the set value $h_0$ (by a factor of approximately $1.59$ for $\theta = 0$). We interpret this by observing that the interfaces of short films between bubbles with equal pressure retain curvature over their whole lengths in our simulations, interpreted as being due to the finite transition regions between films and Plateau borders (Kralchevsky & Ivanov Reference Kralchevsky and Ivanov1985b). The augmented Young–Laplace equation (Kralchevsky & Ivanov Reference Kralchevsky and Ivanov1985b; Denkov et al. Reference Denkov, Petsev and Danov1995), given in Appendix B.2, then requires a weaker disjoining pressure than for zero curvature, and hence a thicker film.
3.3.3. Gas transfer through Plateau borders
Schimming & Durian (Reference Schimming and Durian2017) derive a bubble growth law in two-dimensional wet foams at small  $\phi$ (satisfying the decoration theorem), which accounts for gas flow through the Plateau borders. It is assumed that $\theta = 0$, and the geometry is simplified by taking each side of each border to have equal curvature. Let $r_{PB}$ be the radius of curvature of a bubble's Plateau border interfaces (given by the Young–Laplace law in terms of the bubble pressure $p$), let $r_j$ be the signed radius of curvature of its $j\text {th}$ film (measured as in Appendix B.2), and define the circularity $C = (R / n) \sum _{j = 1}^n 1/r_j$ (Roth et al. Reference Roth, Jones and Durian2013) where $n$ is the bubble's number of neighbours. Then the contribution to the bubble's growth rate from Plateau-border transfer, termed border crossing, is (Schimming & Durian Reference Schimming and Durian2017)
 \begin{equation} \dot{A}_{BC} \approx{-}2 {\rm \pi}\gamma_\infty D H \frac{n C}{R} \sqrt{\frac{r_{PB}}{h_0}} . \end{equation}
We believe that a typographical error resulted in an extra factor of  $1/\sqrt {3}$ for Schimming & Durian (Reference Schimming and Durian2017), which we have corrected. We plot a comparison between this approximation and our results for a repulsive disjoining pressure at $\phi = 2\,\%$ in figure 19. Part of the difference is believed to come from the transition regions at the ends of the films (Kralchevsky & Ivanov Reference Kralchevsky and Ivanov1985b) – the approach we use to measure the film lengths (Appendix B.3) tends to include part of these regions, which are omitted in the derivation of (3.14). Therefore, the film lengths are overestimated in the simulations, and thus also the proportion of the growth rates due to gas transfer through the films. We note that the definition of film length is ambiguous for finite film thickness, due to these transition regions. Other contributions to the difference in figure 19 come from the approximations made in our coarsening model (see § 2.2) and in (3.14) from Schimming & Durian (Reference Schimming and Durian2017). Agreement is not improved at higher mesh refinement (and is worse for the smallest bubbles, in the cluster with smallest $\dot {A}_{BC}$).
Border-crossing growth rate, defined as the difference between the total and border-blocking rates, versus  $n_{eff}$ in a $1024$ bubble foam at $\phi = 2\,\%$ with repulsive $\varPi _{D}$. The simulations are compared with (3.14).

We also recall that our selected  $h_0$ is large compared with real foams. This is instead expected to exaggerate the border-crossing rates relative to the gas flow through the films in our simulations (Schimming & Durian Reference Schimming and Durian2017), which is a separate effect from the underestimation at a given $h_0$, discussed above.
Near to the unjamming transition, at which the film lengths decrease to zero (Cantat et al. Reference Cantat, Cohen-Addad, Elias, Graner, Höhler, Pitois, Rouyer and Saint-Jalmes2013, p. 195), the bubble growth rate due to one neighbour was given by Schimming & Durian (Reference Schimming and Durian2017) for  $\theta = 0$. Let $R_i$ be the effective radius of the bubble's $i\text {th}$ neighbour, and $h_i$ the minimum distance between their interfaces. By adding contributions from each neighbour, and neglecting the effect of other neighbours on each contribution, which would tend to reduce the absolute growth rates (Evilevitch et al. Reference Evilevitch, Rescic, Jönsson and Olsson2002),
 \begin{equation} \dot{A} \approx {\rm \pi}\gamma_\infty D H \sum_{i = 1}^n \sqrt{\frac{2}{h_i}} \frac{R - R_i}{\sqrt{R R_i (R + R_i)}}. \end{equation}
This is compared with our simulations in figure 20, which show good agreement, provided that contributions from all nearby bubbles are included – not just those in contact, but also those nearly in contact. Nearby bubbles are taken here to be those counted as neighbours by the vertex neighbour algorithm (see § 2.1.3 and figure 5), and contacting bubbles are those which exert  $\varPi _{D} > 0$ on a vertex of the considered bubble.
Total bubble growth rates plotted against (3.15) (Schimming & Durian Reference Schimming and Durian2017) for a  $1024$-bubble foam at $\phi = 16\,\%$ (set in one step, rather than increased gradually) with repulsive $\varPi _{D}$. We do not expect the means of setting $\phi$ to have a large effect for this $\varPi _{D}$. The contacting and nearby bubbles are as specified in the main text. The black line has unit gradient.

While the issue of accounting for long-range gas transfer in simulations (R. Höhler, personal communication) remains unresolved (for which our approximation described in § 2.2 is likely poor), and may be particularly important due to our thick films, we observe here that the two different approaches to the bubble gas flow rates are consistent. Equation (3.15) uses an approximation for small  $h_i$, although we find the exact prediction (Schimming & Durian Reference Schimming and Durian2017), which gives larger absolute growth rates, differs by less than $10\,\%$ for $h_1 \leq 2 R$ when $R_1 \leq 10 \, R$ and $n = 1$. We expect that most of the difference between the two datasets plotted in figure 20 is due to bubbles which are only just out of contact, noting from figure 5 that the vertex neighbour algorithm can count fairly distant bubbles as neighbours.
Our use of the growth rate approximation (§ 2.2) for flocculated foams, in which bubbles retain close contacts as  $\phi$ is increased, is also supported by the above results for foams with repulsive $\varPi _{D}$ near unjamming. This is because the geometry is similar except for the retention of short films in the flocculated foams, while we expect the coarsening approximation to be effective for films as noted in § 2.2.
3.4. Statistics of bubble properties
We now give averaged properties of the bubbles in the simulated foams, in order to quantify some of our observations regarding their variation with  $\phi$ and $\theta$.
3.4.1. Film lengths
First, we consider the averaged bubble film lengths  $L$. Recalling our approximation, (3.9), we may estimate its prediction of the mean ratio of film length to perimeter, for $\theta \lesssim 10^\circ$, as
 \begin{equation} \left\langle \frac{L}{P} \right\rangle \approx \frac{\bar{\varPi} + \langle n \rangle \theta / {\rm \pi}}{1 + \bar{\varPi}} \end{equation}
by setting  $R = R_{2 1}$ and $n = \langle n \rangle$ on the right-hand side. For $\theta = 0$, this has an equivalent form to an existing approximation for the film areas in a monodisperse three-dimensional foam (Höhler et al. Reference Höhler, Seknagi and Kraynik2021; Pasquet et al. Reference Pasquet, Galvani, Requier, Cohen-Addad, Höhler, Pitois, Rio, Salonen and Langevin2023b).
Equation (3.16) is compared with our simulations in figure 21(a), and we observe a very close agreement, including in flocculated foams. We note that our simulations with repulsive  $\varPi _{D}$, rather than $\theta = 0$, should be compared with the predictions of (3.16) for $\theta = 0$, since the simulations with $\theta = 0$ include some bubble attraction due to our finite film thickness $h_0$. We have assumed $h_0 \to 0$ in the derivation of (3.9) (see Appendix A), and thus (3.16). From figure 21, the film lengths initially decrease with liquid fraction, as the bubbles become less deformed. For repulsive $\varPi _{D}$, the lengths vanish as the bubbles separate at the unjamming transition, while they decrease to an approximate plateau for $\theta \geq 0$ due to flocculation. Our results for $\theta > 0$ are in qualitative agreement with those of Feng et al. (Reference Feng, Jing, Ma and Wang2021), who measured the total length of all films in foams simulated using a different model, and are consistent with the interpretation that $\theta > 0$ caused films to be retained at $\phi > \phi _{c}$ in the ISS coarsening experiments (Pasquet et al. Reference Pasquet, Galvani, Requier, Cohen-Addad, Höhler, Pitois, Rio, Salonen and Langevin2023b).
Mean ratio of film length to perimeter versus  $\phi$, for repulsive $\varPi _{D}$ alongside various $\theta$. In (a), simulations with $1024$ bubbles are compared with (3.16), and error bars give the standard deviation of the simulated $L / P$ distribution. The values of $\bar {\varPi }$ and $\langle n \rangle$ in (3.16) are taken from the simulations at each liquid fraction step, with linear interpolation of the predicted $\langle L / P \rangle$ between these steps. In (b), single runs with $1024$ bubbles are shown alongside the mean of five runs with $256$ bubbles. Error bars in (b), giving the sample standard deviation of $\langle L / P \rangle$ in the latter simulations, are omitted since they are close to the markers in size.

We note that (3.16) predicts that the plateau satisfies  $\langle L / P \rangle \approx \langle n \rangle \, \theta / {\rm \pi}$, since $\varPi _{O} \approx 0$ in a flocculated foam (Princen Reference Princen1983). Similar predictions of the mean film area in flocculated three-dimensional foams have been made, which instead vary as $\theta ^2$ (Durian Reference Durian2023; Pasquet et al. Reference Pasquet, Galvani, Requier, Cohen-Addad, Höhler, Pitois, Rio, Salonen and Langevin2023b).
The error in (3.16) is larger for smaller  $\phi$, likely due to the greater deformation of bubbles, and the geometric simplifications made while deriving (3.9) (see Appendix A). We note that the exact mean $\langle L / P \rangle$ predicted by (3.9) behaves similarly, although is a slightly worse approximation to the data in the plateau.
3.4.2. Growth rates
Next, we consider the averaged bubble growth rates. Noting that  $\langle \dot {A} \rangle \equiv \langle {\rm d} A / {\rm d} t \rangle = 0$ because the system is closed and the gas is taken as incompressible (neglecting that our coarsening approximation does not conserve the gas exactly, as discussed in § 2.2), we consider the root-mean-square growth rate $\sqrt {\langle \dot {A}^2\rangle } \equiv \sqrt {\langle ({\rm d}A / {\rm d}t)^2 \rangle }$. Since this measures typical instantaneous bubble growth rates (in absolute value), we use it as a proxy for the rate at which the foam would coarsen at early times.
In figure 22, we plot the variation of  $\sqrt {\langle \dot {A}^2\rangle }$ with $\phi$, for several values of $\theta$. As expected, the coarsening rate decreases with increasing $\phi$ for small liquid fractions, since the Plateau borders grow larger and further frustrate the flow of gas (Roth et al. Reference Roth, Jones and Durian2013). The contact angle does not have a strong effect in this regime.
Root-mean-square growth rate versus  $\phi$, for repulsive $\varPi _{D}$ and various $\theta$. Results for single $1024$-bubble runs are shown, along with the mean of five runs with $256$ bubbles (the error bars give the sample standard deviation).

For repulsive  $\varPi _{D}$, the coarsening rate decreases for all $\phi$, since the gas flow between separated bubbles (see figure 9) decreases as their separation increases (Schimming & Durian Reference Schimming and Durian2017). However, as observed for the film lengths, the presence of bubble attraction causes the coarsening rate to decrease to a plateau. As noted in § 3.1, the bubbles flocculate (Cox et al. Reference Cox, Kraynik, Weaire and Hutzler2018), thereby retaining films that allow for efficient gas transfer. The typical film length increases with $\theta$, and so the plateau values likewise increase. We recall that there is bubble attraction for $\theta = 0$ in our model, due to the finite film thickness. Hence, we are consistent with reports that flocculation in emulsions increases the coarsening rate (Djerdjev & Beattie Reference Djerdjev and Beattie2008), along with the interpretation that $\theta > 0$ caused the $\langle R \rangle$ growth exponent (see § 1) to remain equal to $1/2$ (i.e. its value for dry foams) at higher $\phi$ than expected in experiments on the ISS (Pasquet et al. Reference Pasquet, Galvani, Requier, Cohen-Addad, Höhler, Pitois, Rio, Salonen and Langevin2023b). However, obtaining growth exponents from our simulations would require following coarsening through time, which is not feasible for large enough systems at present.
For similar reasons, we have not investigated the relationship between  $\sqrt {\langle \dot {A}^2\rangle }$ and the coarsening rate at early times $t$. For a system with many bubbles, and a sufficiently coarse time resolution, the discontinuous increases of $\langle A \rangle$ when bubbles vanish, with ${\rm d} \langle A \rangle / {\rm d} t = 0$ between these events, are averaged to give a differentiable function $\langle A \rangle$ of time (Cantat et al. Reference Cantat, Cohen-Addad, Elias, Graner, Höhler, Pitois, Rouyer and Saint-Jalmes2013, p. 105). In this limit, the coarsening rate could be measured by ${\rm d} \langle A \rangle / {\rm d} t$ for example, whereas $\langle \dot {A} \rangle = 0$ as noted above.
The early-time coarsening rate might differ qualitatively from  $\sqrt {\langle \dot {A}^2\rangle }$ in its dependence on $\phi$, since, for example, it has been suggested that the structure of flocculated foams may change substantially under coarsening (Pasquet et al. Reference Pasquet, Galvani, Requier, Cohen-Addad, Höhler, Pitois, Rio, Salonen and Langevin2023b). Furthermore, based on a comparison with simulations using bubble areas directly from a Voronoi tessellation, we believe that the variation shown in figure 22 depends quantitatively on polydispersity, but not qualitatively. Since we expect the foam's polydispersity to initially change with time during coarsening (Thomas et al. Reference Thomas, de Almeida and Graner2006), we do not believe that $\sqrt {\langle \dot {A}^2\rangle }$ will be constant in time.
Finally, we recall (3.13) for a bubble's border-blocking growth rate, which states that the contribution from each film is proportional to the pressure difference between a bubble and its neighbour, multiplied by the ratio of film length to thickness (Bolton & Weaire Reference Bolton and Weaire1991; Cantat et al. Reference Cantat, Cohen-Addad, Elias, Graner, Höhler, Pitois, Rouyer and Saint-Jalmes2013). Equation (3.8) can be used to approximate the bubble's pressure  $p$, and we estimate the neighbour pressures as equal and constant throughout the foam (Pasquet et al. Reference Pasquet, Galvani, Requier, Cohen-Addad, Höhler, Pitois, Rio, Salonen and Langevin2023b). Again using (3.8), the neighbour pressure is expressed in terms of a critical radius $R_0$ (Lemlich Reference Lemlich1978; Chieco & Durian Reference Chieco and Durian2023), whose value is obtained as described below. Equation (3.9) approximates the bubble's total film length $L$, and we use $P \approx 2 {\rm \pi}R$ (Kraynik et al. Reference Kraynik, Grassia, Cox, Neethling, van Swol, Evans, Schroeder-Turk and Mecke2012) therein. Hence, we obtain an approximate border-blocking bubble growth law
 \begin{equation} \dot{A}_{BB} \approx \frac{4 {\rm \pi}\gamma_\infty D H}{h_0} \left(\frac{R}{R_0} - 1\right) \frac{\bar{\varPi} \bar{R} + n \, \theta / {\rm \pi}}{1 + (2 \bar{\varPi} + 1) \bar{R}} , \end{equation}
where the foam's critical bubble radius  $R_0$ is determined by the condition $\langle \dot {A}_{BB} \rangle = 0$ mentioned above (Lemlich Reference Lemlich1978; Pasquet et al. Reference Pasquet, Galvani, Requier, Cohen-Addad, Höhler, Pitois, Rio, Salonen and Langevin2023b). We assume $\theta \lesssim 10^\circ$ in (3.8) and (3.9), and hence also in (3.17). This gives the growth rate solely in terms of the bubble radius and foam properties, notwithstanding the aforementioned need to relate $n$ to $R$, and thus is a (two-dimensional) generalisation of the Lemlich (Reference Lemlich1978) approach to allow for a variation in relative film length with bubble size. Recalling figure 14, smaller bubbles have shorter films relative to their size, and thus experience a larger degree of border blocking (Bolton & Weaire Reference Bolton and Weaire1991). While (3.17) does not accurately give the growth rates of individual bubbles, as shown in figure 23, it may be fruitful to analyse the size distributions it predicts in the coarsening scaling state (Lemlich Reference Lemlich1978; De Smet, Deriemaeker & Finsy Reference De Smet, Deriemaeker and Finsy1997; Yarranton & Masliyah Reference Yarranton and Masliyah1997), particularly whether it can reproduce the large population of small bubbles observed recently by Galvani et al. (Reference Galvani2023) through the enhanced border blocking of such bubbles.
Border-blocking growth rates versus effective radius in a  $1024$-bubble foam with repulsive $\varPi _{D}$. The liquid fraction is (a) $\phi = 2\,\%$ and (b) $\phi = 10\,\%$. Comparison is made with (3.17), where $R_0$ is fitted as stated in the text, and $\varPi _{O}$ is as measured in the simulations. The simulated growth rates are scaled by the average film thickness $\langle h_{f}\rangle$ for each bubble, as described in § 3.3.2, and $h_0$ is replaced by $\langle h_{f} \rangle$ in (3.17), to improve agreement for small bubbles.

In proposing (3.17), we follow the suggestion of Pasquet et al. (Reference Pasquet, Galvani, Requier, Cohen-Addad, Höhler, Pitois, Rio, Salonen and Langevin2023b) to investigate growth laws which generalise the Lemlich (Reference Lemlich1978) approach by accounting for correlations between bubble pressures and film lengths. A three-dimensional growth law of a different form, derived by considering gas flow through the bulk liquid (rather than the films), but which also incorporates correlations between pressure and efficiency of diffusion, was studied numerically by Yarranton & Masliyah (Reference Yarranton and Masliyah1997). Another three-dimensional growth law, again of a form different to (3.17), was studied by De Smet et al. (Reference De Smet, Deriemaeker and Finsy1997).
4. Conclusions
We have described simulations for studying coarsening in two-dimensional wet aqueous foams, with a structural model based upon the work of Kähärä et al. (Reference Kähärä, Tallinen and Timonen2014) and Boromand et al. (Reference Boromand, Signoriello, Ye, O'Hern and Shattuck2018), and a coarsening approximation inspired by the analytical work of Marchalot et al. (Reference Marchalot, Lambert, Cantat, Tabeling and Jullien2008) and Schimming & Durian (Reference Schimming and Durian2017). Our methods allow for arbitrary liquid fractions  $\phi$, and support contact angles $\theta$ up to approximately $10^\circ$. The interfaces interact through a model disjoining pressure, although our selected form could be swapped for another.
We have applied this model to polydisperse foams, containing  $256$ or $1024$ bubbles. The liquid fraction $\phi$ has been varied by gradually increasing its value within particular foam samples, following the approach of Bolton & Weaire (Reference Bolton and Weaire1990) and Cox et al. (Reference Cox, Kraynik, Weaire and Hutzler2018), but using a different structural model. We have analysed the coarsening-related properties of these foams. For the considered range of contact angles $\theta \lesssim 10^\circ$, the bubble pressures $p$ were found to obey an effective Young–Laplace law relating them to the osmotic pressure $\varPi _{O}$, and we derived an approximation for the bubble film lengths $L$. When the averaged film length is estimated from the latter result, it takes an equivalent form to a previously proposed approximation in three dimensions for $\theta = 0$ (Höhler et al. Reference Höhler, Seknagi and Kraynik2021; Pasquet et al. Reference Pasquet, Galvani, Requier, Cohen-Addad, Höhler, Pitois, Rio, Salonen and Langevin2023b), and also agrees well with our simulations.
Turning to the coarsening-induced bubble growth rates, we showed that their root-mean-square values decrease to a plateau with increasing  $\phi$ in foams with attractive bubble interactions, due to the previously simulated (Cox et al. Reference Cox, Kraynik, Weaire and Hutzler2018) flocculation of bubbles. The effective neighbour number $n_{eff}$ of Fortuna et al. (Reference Fortuna, Thomas, de Almeida and Graner2012) was found to be closely related to the growth rate (determining whether bubbles grow or shrink to a good approximation) whenever bubbles had films between them, caused by either the osmotic pressure or flocculation.
We also compared our simulations of gas flow through Plateau borders with existing predictions (Schimming & Durian Reference Schimming and Durian2017). Qualitative agreement was found for bubbles at small  $\phi$, along with quantitative agreement at the unjamming transition for zero bubble attraction. An underestimate of the border gas flow rates at small $\phi$ is believed to arise partly from ambiguity in the film lengths due to our finite film thickness. Approximations made in our coarsening model and in the predictions of Schimming & Durian (Reference Schimming and Durian2017) also contribute.
Our simulations remain computationally expensive, and so we have not considered the time-dependence of foams under coarsening here. However, it may be possible to obtain the time scale over which coarsening occurs in small systems, and to observe its relationship to the root-mean-square growth rates we considered. Such time scales have been investigated by Khakalo et al. (Reference Khakalo, Baumgarten, Tighe and Puisto2018), without bubble attraction.
The approach we use seems most suited to accurately simulating foams on a small scale (with around  $1000$ bubbles), in order to develop models of their properties. These could then be implemented in large-scale coarsening simulations using the bubble model (Durian Reference Durian1995), for example. The analytical approximations we have presented here may be a starting point for this process, recalling that our expressions for the bubble pressures and film lengths can be combined to give an approximate growth law. As noted above, the properties of the resulting scaling states could be analysed (Lemlich Reference Lemlich1978; De Smet et al. Reference De Smet, Deriemaeker and Finsy1997; Yarranton & Masliyah Reference Yarranton and Masliyah1997), which may contribute to the interpretation of experiments of coarsening in wet foams performed in microgravity (Born et al. Reference Born2021; Galvani et al. Reference Galvani2023; Pasquet et al. Reference Pasquet, Galvani, Requier, Cohen-Addad, Höhler, Pitois, Rio, Salonen and Langevin2023b).
As noted in § 2.1.5, the implementation of our simulation model could be improved, including the equilibration algorithm, which may result in larger foams becoming feasible to simulate. The coarsening approximation could also be tested against accurate solutions of Laplace's equation within the foam's liquid, partly to gauge the importance of long-range gas transfer (R. Höhler, personal communication) for which the approximation is expected to be poor. The equilibrium film thickness  $h_0$ could be varied to determine its effect on our results, along with our small derivative of the disjoining pressure at $h_0$. These changes to the disjoining pressure could be investigated using smaller systems at higher mesh refinement, to improve convergence. An alternative interface extrapolation or interpolation might also resolve the imbalance in film thickness noted in Appendix C. We expect our large $h_0$ to have increased the proportion of gas transfer through Plateau borders (Schimming & Durian Reference Schimming and Durian2017).
Our analytical approximations could be extended by investigating the relationship between bubble radius and neighbour number (Durand et al. Reference Durand, Käfer, Quilliet, Cox, Talebi and Graner2011), and between the osmotic pressure and the mean neighbour number. By using an independent empirical expression for the osmotic pressure, similar to those described by Höhler et al. (Reference Höhler, Seknagi and Kraynik2021), these approximations could be made fully predictive. Finally, as noted by Pasquet et al. (Reference Pasquet, Galvani, Requier, Cohen-Addad, Höhler, Pitois, Rio, Salonen and Langevin2023b), coarsening in flocculated foams and emulsions at large  $\phi$ has not been widely studied. We note that the structure of flocculated systems differs greatly as the contact angle is varied (Bibette et al. Reference Bibette, Mason, Gang, Weitz and Poulin1993).
Another extension is to perform similar studies of three-dimensional wet foams (albeit for fewer bubbles). We have adapted the simulation model to this case, noting that the approach of Boromand et al. (Reference Boromand, Signoriello, Ye, O'Hern and Shattuck2018) has been similarly adapted by Wang et al. (Reference Wang, Treado, Boromand, Norwick, Murrell, Shattuck and O'Hern2021). A comparable three-dimensional approach for biological cells was also used by Van Liedekerke et al. (Reference Van Liedekerke, Neitsch, Johann, Warmt, Gonzàlez-Valverde, Hoehme, Grosser, Kaes and Drasdo2020). Such models have not yet been applied to the simulation of foams, to our knowledge, although simulations with zero film thickness have been performed by A. M. Kraynik (personal communication).
Acknowledgements
The authors wish to acknowledge useful discussions with T. Davies, F. Graner, R. Höhler and A. Kraynik, along with K. Brakke for developing the Surface Evolver.
Funding
J.M. funded by ESA REFOAM MAP contract 4000129502.
Declaration of interests
The authors report no conflict of interest.
Data availability statement
The data upon which this work is based, including the simulation code, is available at the Aberystwyth Research Portal (https://doi.org/10.20391/b2be2c00-151e-43df-90ed-5c900af55160).
Appendix A. Analytical model for film lengths
We now derive the approximation for a bubble's film length  $L$ used in § 3.2.2, assuming mechanical equilibrium (as holds in our simulations). The approach was inspired by Höhler et al. (Reference Höhler, Seknagi and Kraynik2021), and is based upon a standard equilibrium result relating the stress tensor $\bar {\boldsymbol {\tau }}$, averaged in the manner of Batchelor (Reference Batchelor1970) over a domain $\mathcal {S}$ of area $A$ as in (3.5), to the force per unit length $\boldsymbol {f}$ that the domain's surroundings apply to its boundary $\varGamma$ (Landau et al. Reference Landau, Lifshitz, Kosevich and Pitaevskiĭ1986, pp. 6–7):
 \begin{equation} \bar{\tau}_{i j} = \frac{1}{2 A} \oint_\varGamma \,{\rm d} l (f_i r_j + f_j r_i) , \end{equation}
where  $\boldsymbol {r}$ is the displacement of a point on $\varGamma$ from an arbitrary fixed origin. Let $\mathcal {S}$ be the domain of a bubble of effective radius $R$ and pressure $p$, including its interface (which is then equivalent to $\varGamma$). Our definition of the bubble's reduced pressure $\bar {p} = -\tfrac {1}{2} \operatorname {Tr} \bar {\boldsymbol {\tau }}$ (§ 3.2.1) then gives
 \begin{equation} \bar{p} ={-}\frac{1}{2 {\rm \pi}R^2} \, \oint_\varGamma \,{\rm d} l \,\boldsymbol{f} \boldsymbol{\cdot} \boldsymbol{r}. \end{equation}
This relates the reduced pressure to the forces applied to the bubble's interface. Let  $\boldsymbol {n}$ be the outward unit normal to $\varGamma$, and $\varPi _{D}$ the corresponding disjoining pressure. Then $\boldsymbol {f} = -\varPi _{D} \boldsymbol {n}$ since we set the liquid pressure to zero (§ 2.1.1). Let us take the limit of small film thickness $h_0$. Therefore, where $\varGamma$ adjoins Plateau borders, $\boldsymbol {f} = \boldsymbol {0}$. On the interface of a film shared with a bubble of pressure $p_i$, we have $\varPi _{D} = (p + p_i) / 2$ (Exerowa & Kruglyakov Reference Exerowa and Kruglyakov1998, p. 90). Under a mean-field approximation (Lemlich Reference Lemlich1978), let $p_i$ be the foam's capillary pressure $\varPi _{C}$. This is given in turn by (3.4) (Höhler et al. Reference Höhler, Seknagi and Kraynik2021), again dropping the factor $1/(1-\phi )$. We also use (3.8) for $p$. Thus, adjoining the film interfaces,
 \begin{equation} \varPi_{D} \approx \frac{\gamma_\infty}{2 R} \left[1 + (2 \bar{\varPi} + 1) \bar{R}\right] , \end{equation}
where  $\gamma _\infty$ is the isolated interface tension from § 2.1.2, $\bar {\varPi } = \varPi _{O} / (\gamma _\infty / R_{2 1})$ (Princen Reference Princen1988) with $\varPi _{O}$ the foam's osmotic pressure and $R_{2 1} \equiv \langle R^2 \rangle / \langle R \rangle$ (Cantat et al. Reference Cantat, Cohen-Addad, Elias, Graner, Höhler, Pitois, Rouyer and Saint-Jalmes2013, p. 251), and $\bar {R} = R / R_{2 1}$.
At the points of  $\varGamma$ where the films and Plateau borders meet, a transversal line tension acts to maintain equilibrium for contact angle $\theta > 0$ (Kralchevsky & Ivanov Reference Kralchevsky and Ivanov1985a). This is exerted by the medium-range attraction in $\varPi _{D}$ (see figure 3). We model this interaction as a singular contribution to $\boldsymbol {f}$, i.e. as forces $\boldsymbol {F} = \gamma _\infty \boldsymbol {n} \sin \theta \approx \gamma _\infty \theta \boldsymbol {n}$ (Kralchevsky & Ivanov Reference Kralchevsky and Ivanov1985a) applied at the film-border transition points (again using $\sin \theta \approx \theta$ as we consider $\theta \lesssim 10^\circ$).
Substituting the above expressions for  $\boldsymbol {f} = -\varPi _{D} \boldsymbol {n}$ into (A2), and making the rough approximation $\boldsymbol {r} \approx R \boldsymbol {n}$ (i.e. that the bubble is circular), we obtain
 \begin{equation} \bar{p} \approx \frac{\gamma_\infty}{2 {\rm \pi}R} \left\{\left[1 + (2 \bar{\varPi} + 1) \bar{R}\right] \frac{L}{2 R} - 2 n \theta\right\}, \end{equation}
where  $L$ is the bubble's total film length, and $n$ is its number of neighbours. Finally, we approximate $\bar {p}$ by the osmotic pressure $\varPi _{O}$, as discussed in § 3.2.1. Rearranging (A4), and using that the perimeter $P \approx 2 {\rm \pi}R$ (Kraynik et al. Reference Kraynik, Grassia, Cox, Neethling, van Swol, Evans, Schroeder-Turk and Mecke2012), then gives our approximation for the bubble's film length $L$, (3.9).
Appendix B. Measurement of foam and bubble properties
We describe here our methods for measuring various properties of the simulated foams and bubbles. In Appendix B.1, we define the averaged stress of the foam in terms of the discretisation, before giving our approaches for measuring the radius of curvature (Appendix B.2), length and contact angle (Appendix B.3) of a thin film between two bubbles.
B.1. Foam stress
For the purposes of stress relaxation (§ 2.3) and calculating the foam's osmotic pressure  $\varPi _{O}$, we use the spatial average of the foam's stress tensor $\bar {\boldsymbol {\tau }}_{F}$, defined in (3.1) (Batchelor Reference Batchelor1970; Cantat et al. Reference Cantat, Cohen-Addad, Elias, Graner, Höhler, Pitois, Rouyer and Saint-Jalmes2013, pp. 175–177). We discretise the integral according to the simulation mesh. Let $A_{F}$ be the foam's area (i.e. the area of the periodic domain), and let the $n\text {th}$ mesh edge have length $l_n$ and unit tangent vector $\boldsymbol {t}_n = (t_{n 1}, t_{n 2})$. We take the surface tension $\gamma _n$ on this edge to be the mean of that at its two vertices, obtained from (2.3). Let the $k\text {th}$ bubble have area $A_k$ and pressure $p_k$ (the latter obtained as a Lagrange multiplier, by § 2.1.5). Then we evaluate the components of the stress from
 \begin{equation} (\bar{\boldsymbol{\tau}}_{F})_{i j} = \frac{1}{A_{F}} \left(\sum_{{edge\ n}} \gamma_n t_{n i} t_{n j} l_n - \sum_{{bubble\ k}} p_k A_k \delta_{i j}\right) , \end{equation}
where  $\delta _{i j}$ is the Kronecker delta. The deviatoric stress obtained from this equation is also used to relax the stress of our initial dry foams (§ 2.3), for which each edge corresponds to a film and $\gamma _n = 2 \gamma _\infty$.
B.2. Film radius of curvature
Consider a thin film between bubbles labelled  ${A}$ and ${B}$, with gas pressures $p_{A}$ and $p_{B}$, respectively. Let the radius of curvature of the respective liquid–gas interface of the film be $r_{A}$ or $r_{B}$. The radius is positive if the respective interface is convex relative to the adjoining bubble. Let, respectively, the surface tensions of the interfaces be $\gamma _{A}$ and $\gamma _{B}$, calculated from (2.3), and let their disjoining pressures be $\varPi _{A}$ and $\varPi _{B}$, obtained from (2.5) or (2.6). We measure the interface properties by averaging over the middle third of vertices experiencing positive disjoining pressure inside the film. At least one vertex is used, and often no more for the interfaces of short films. By averaging over the central part of the film only, we aim to reduce the effects of the transition regions at its ends. The film thickness is larger in these regions, and so the interface tension and disjoining pressure differ from their values in the interior of the film. The augmented Young–Laplace equation gives (Kralchevsky & Ivanov Reference Kralchevsky and Ivanov1985b; Denkov et al. Reference Denkov, Petsev and Danov1995)
 \begin{equation} p_{A} = \gamma_{A} / r_{A} + \varPi_{A}, \end{equation}
and likewise for the  ${B}$ interface. Rearranging (B2) for the interface curvature radius, we measure the radius of curvature $r$ of the simulated film itself as $1/r = (1 / r_{A} - 1/r_{B}) / 2$, i.e. using the mean of the two interface curvatures, taken to be positive if the interface is convex with respect to bubble ${{\rm A}}$. The negative sign arises since $r_{B}$ is defined as positive if the corresponding interface is convex with respect to bubble ${{\rm B}}$, in which case it is concave with respect to ${{\rm A}}$. When determining the properties of bubble A, such as $n_{eff}$ (§ 3.3.2), we correct for the film thickness by subtracting half the measured interface separation $h_{A}$ from $r$ (we expect this correction to be small). We measure $h_{A}$ according to § 2.1.4, and average it in the same manner as $\gamma _{A}$ and $\varPi _{A}$.
B.3. Film length and contact angle
The length of the thin film between any contacting bubbles  ${A}$ and ${B}$ (adopting the notation of Appendix B.2) is defined as follows, using a similar construction to that applied by Denkov et al. (Reference Denkov, Petsev and Danov1995) when a transition region exists between films and Plateau borders, as in our simulations. More precisely, we quantify the length $l$ of liquid–gas interface on bubble A which adjoins the film. The same construction is used to measure the contact angle $\theta _{m}$.
First, a vertex is found which lies in the middle third of the collection of vertices on the interface of bubble A which experience positive disjoining pressure  $\varPi _{D}$ from bubble B, i.e. a vertex which lies towards the middle of the considered film. The position of this film vertex and its outward unit normal relative to bubble A (taken as the mean outward normal of the adjoining edges) are noted. Using these, along with the film radius of curvature $r$ from Appendix B.2 (incorporating the film thickness correction), a circular arc of radius $|r|$ is found which passes through the vertex's position and has the same normal vector there (outward from the corresponding circle if $r > 0$, otherwise oriented inward). This arc is taken to describe the film interface.
The interface of bubble A is then traversed in both directions from the film vertex to find vertices located near the middle of the Plateau-border interfaces adjoining the film. The border vertices selected are those at the first local maximum of interface separation  $h$ (§ 2.1.4) encountered outside the film (i.e. for which $\varPi _{D} \leq 0$) in the two directions. Arcs are constructed in the above manner, now with radius $r_{PB} = \gamma _\infty / p_{A} > 0$ by the Young–Laplace law.
The construction described above is illustrated in figure 24 for repulsive  $\varPi _{D}$ and $\theta = 10^\circ$. If, as in the latter case, the border arcs intersect with the film arc, the film-interface length $l$ is taken as the length of the film arc between the outer intersections with the border arcs. The contact angle $\theta _{m}$ is also directly obtained as the angles at which these intersections occur. When defining $\theta _{m}$ for a film, we use the mean of the angles measured at both outer intersections.
Diagram of the construction used to measure film-interface length  $l$ and contact angle $\theta _{m}$, for the bubble at the upper left-hand side. Arcs describing the film and Plateau border interfaces are shown, along with the vertices used to position these arcs. In (a), the set contact angle is $\theta = 10^\circ$. The inset (b) illustrates the film-border transition region when the film and border arcs do not intersect, for repulsive $\varPi _{D}$.

If the arcs do not intersect, as in figure 24(b) for repulsive  $\varPi _{D}$, then we take $l$ to be the arclength between points on the film arc which are closest to the border arcs. The contact angle $\theta _{m}$ is then undefined. This is as expected for repulsive $\varPi _{D}$, but an intersection can be absent for individual films when the set contact angle is $\theta \geq 0$, due, for example, to film thickness variations or interface discretisation. Since the set angles $\theta \lesssim 10^\circ$ are small, we expect fluctuations in $\theta _{m}$ due to the mesh to be fairly large for individual films. We take $\theta _{m} = 0$ in the absence of an intersection.
The length  $l$ and angle $\theta _{m}$ can be derived straightforwardly from the above definitions. We omit the equations for brevity, but note that care is needed in treating short films at large $\theta$, where the border arcs may overlap to the extent that the ordering of their centres of curvature, relative to the film, is reversed compared with that of the corresponding Plateau borders.
A bubble's total film length  $L$ is given by the sum of $l$ over each of its films.
Appendix C. The Young–Laplace law in the simulated foams
We describe here a validation of the relaxed foam structure predicted by our simulations. Similarly to Kähärä et al. (Reference Kähärä, Tallinen and Timonen2014), we verify that the Young–Laplace law holds for the liquid–gas interfaces, although we focus on those adjoining the thin liquid films between bubbles. Since such interfaces experience a considerable disjoining pressure  $\varPi _{D}$ from the other film interface, they satisfy the augmented Young–Laplace equation, i.e. (B2).
Consider the thin film discussed in Appendix B.2. Let the curvature of the liquid–gas interfaces of the film be  $\chi _{A} = 1 / r_{A}$ and $\chi _{B} = 1 / r_{B}$. Then taking the difference of the augmented Young–Laplace equation as applied to both interfaces gives a pressure difference
 \begin{equation} \Delta p = p_{A} - p_{B} = \chi_{A} \gamma_{A} - \chi_{B} \gamma_{B} + \varPi_{A} - \varPi_{B} , \end{equation}
for this film. We suppose that the bubbles are labelled so bubble A has the higher pressure. In figure 25, we compare this prediction of  $\Delta p$ with that measured directly from a simulation at liquid fraction $\phi = 2\,\%$ and contact angle $\theta = 10^\circ$, for which we expect convergence of the foam structure to be hardest to achieve. We define a film as existing between a pair of bubbles whenever both have vertices experiencing positive $\varPi _{D}$ from the other bubble. The interface properties, such as the surface tensions $\gamma _{A}$ and $\gamma _{B}$, are obtained by the same averaging as described in Appendix B.2. However, the curvature at a vertex is instead obtained from the Surface Evolver mean_curvature attribute (Brakke Reference Brakke2013), i.e. in magnitude, the maximum relative rate of change in total adjoining edge length as the vertex is moved. The curvature used here therefore differs from that defined in Appendix B.2, to make it independent of the simulated bubble pressures.
Comparison of measured and predicted pressure differences, denoted  $\Delta p_{m}$ and $\Delta p_{p}$, respectively, for every film in a $256$-bubble foam at $2\,\%$ liquid fraction and $10^\circ$ contact angle. Convergence parameters are as in § 3. Predictions are taken from the augmented Young–Laplace equations for the film interfaces and from the film Young–Laplace equation, i.e. (C1) and (C2), respectively. We take $\Delta p_{m} > 0$ for each film, and scale the pressure differences by the capillary pressure $\varPi _{C}$. The inset magnifies the data for small pressure differences – approximately $70\,\%$ of the films lie within its frame. The black line has unit gradient.

We see close agreement between the predictions of the augmented Young–Laplace equation for the film pressure differences, and those measured in the simulation. This suggests that the methods we use do provide equilibrated foams. The root-mean-square error between the predicted and measured pressure differences, divided by the mean measured pressure difference, is  $1.8\,\%$.
One further mesh refinement than we use in § 3 is required to obtain similar agreement with the Young–Laplace law applied to each film treated as a single interface, i.e.
 \begin{equation} \Delta p = \gamma_{f} \chi_{f} , \end{equation}
where  $\gamma _{f}$ is the film's tension and $\chi _{f}$ is its curvature. We take $\chi _{f} = (\chi _{A} - \chi _{B}) / 2$ as in Appendix B.2, and (Cantat et al. Reference Cantat, Cohen-Addad, Elias, Graner, Höhler, Pitois, Rouyer and Saint-Jalmes2013, p. 49)
 \begin{equation} \gamma_{f} = \gamma_{A} + \gamma_{B} + (h_{A} \varPi_{A} + h_{B} \varPi_{B}) / 2 , \end{equation}
where  $h_{A}$ and $h_{B}$ are the local interface separations (§ 2.1.4) averaged in the same way (stated in Appendix B.2) as the other properties of interfaces A and B, respectively. We recall, from the same appendix, that $\gamma _{A}$ and $\gamma _{B}$ are the tensions of the film's two liquid–gas interfaces, given by (2.3). The other term in (C3) accounts for the effect on the film tension $\gamma _{f}$ of the finite-thickness layer of liquid in the film, which has lower pressure than the gas on either side (Platikanov & Exerowa Reference Platikanov and Exerowa2019). We have averaged between the two sides of the film to reduce discretisation effects.
The predictions of (C2) are also plotted in figure 25 for our level of mesh refinement. We attribute the systematic deviation to an imbalance in the disjoining pressures  $\varPi _{A}$ and $\varPi _{B}$ of (C1), arising from coarseness in the mesh – the sketch in figure 26 shows that the vertices of the higher-pressure bubble (A) have smaller interface separation than those of the lower-pressure bubble (B), so $\varPi _{A} > \varPi _{B}$ (see figure 3). This imbalance does not necessarily occur if the vertices are exactly lined up (which is a special case), due to an approximation in our interface extrapolation described in § 2.1.4 (see figure 6). Outliers in figure 25 are believed to be caused by very short films. The relative error, defined above, with these predicted pressure differences is $27\,\%$ at our refinement, and $7.3\,\%$ in the same foam at one further refinement.
Sketch of a discretised thin film between two bubbles, where  $h_{A}$ is a typical local interface separation for a vertex of bubble ${{\rm A}}$, obtained according to § 2.1.4, and $h_{B}$ is a typical separation for a vertex of bubble ${{\rm B}}$. We exaggerate the curvature of the film relative to the edge length for clarity. The vertices are staggered for the same reason.

The results are similar for repulsive  $\varPi _{D}$, though agreement with (C2) is better. There is reduced scatter, and the systematic deviation is decreased, interpreted as due to the smaller derivative of $\varPi _{D}$ at $h_0$ in this case (see figure 3). Recalling the discussion in § 2.1.2, this is another reason to avoid a rapidly varying $\varPi _{D}(h)$, and the imbalance between $\varPi _{A}$ and $\varPi _{B}$ might cause the convergence problems in such a case. The relative error at our refinement for repulsive $\varPi _{D}$ is $17\,\%$, and that at one further refinement is $3.0\,\%$, for the same foam. Agreement with (C2) improves at higher $\phi$ for both $\theta = 10^\circ$ and repulsive $\varPi _{D}$.
We do not find it practical to use a higher refinement than that chosen for § 3 except in test systems, due to the computation time required. The results here suggest that this refinement is sufficient for the augmented Young–Laplace equation to be well satisfied, in addition to providing evidence that our numerical methods provide relaxed foams. While agreement with the film Young–Laplace equation, formulated as in (C2), is poorer, its improvement with refinement suggests that our simulations approach the correct limit. Finally, we note that convergence of the results in § 3 has been checked with respect to refinement, indicating that they do not exhibit the sensitivity of (C2).


 Open access