





1. Introduction
Recent worldwide emphasis on achieving the goal of low-cost, carbon-free electricity generation has provided renewed momentum for the development of energy production via fusion. In addition to investments from public entities worldwide, a vibrant fusion industry ecosystem has evolved to play a crucial role in pushing beyond fusion from science and technology research to the development of commercial fusion power plants (FPPs). Commonwealth Fusion Systems (CFS) is a private fusion company headquartered in Devens, MA which is pursuing a high-field path to fusion energy based on the tokamak concept. In 2021 CFS completed the construction and testing of the world’s first high-field tokamak superconducting magnet, the Toroidal Field Model Coil, to demonstrate that high-temperature superconductors offered a viable path to creating fusion devices at high magnetic field ( ${\gt} 12$
T). CFS’s proposed development of tokamak-based FPPs leverages years of existing physics-based work while reducing the overall capital cost for fusion devices by utilising more compact designs enabled by high-temperature superconductor magnets. Currently, the SPARC tokamak (Creely et al. Reference Creely, Greenwald and Ballinger2020) is under construction by CFS to achieve
${\gt} 12$
T). CFS’s proposed development of tokamak-based FPPs leverages years of existing physics-based work while reducing the overall capital cost for fusion devices by utilising more compact designs enabled by high-temperature superconductor magnets. Currently, the SPARC tokamak (Creely et al. Reference Creely, Greenwald and Ballinger2020) is under construction by CFS to achieve $Q \gt 1$
in a compact high-field device. However, SPARC is only an intermediate step between current devices and a tokamak capable of generating electricity from fusion. The next device along the fusion roadmap is the development of the ARC tokamak, a high-field FPP targeting the production of gigawatt levels of fusion power.
$Q \gt 1$
in a compact high-field device. However, SPARC is only an intermediate step between current devices and a tokamak capable of generating electricity from fusion. The next device along the fusion roadmap is the development of the ARC tokamak, a high-field FPP targeting the production of gigawatt levels of fusion power.
As we transition from current fusion devices, focused on scientific discovery, to those capable of creating electricity from fusion, the need for accurate scoping of the performance in these devices has also increased – to aid in design, optimisation and eventual safe operation. Historically, tokamak designs such as ITER were based purely on empirical scaling laws derived from multi-machine databases of observational data, with more rigorous modelling only occurring after the initial machine design. However, the advent of more reliable models for plasma transport, heating and equilibrium has made physics-based projections of tokamak performance possible, and routine enough to be used for machine design. Most such studies have relied on reduced, physics-based transport models, which are fast and relatively accurate, but are generally ‘tuned’ to reproduce the results of more first-principles-based models such as nonlinear gyrokinetics. Nearly 30 years of validation efforts on tokamaks worldwide (Ross & Dorland Reference Ross and Dorland2002; Candy & Waltz Reference Candy and Waltz2003; White et al. Reference White2008; Casati et al. Reference Casati2009; Holland et al. Reference Holland, White, McKee, Shafer, Candy, Waltz, Schmitz and Tynan2009; Angioni et al. Reference Angioni, McDermott, Fable, Fischer, Pütterich, Ryter and Tardini2011; Howard et al. Reference Howard, Greenwald, Mikkelsen, Reinke, White, Ernst, Podpaly and Candy2012; Casson et al. Reference Casson2013; Guttenfelder et al. Reference Guttenfelder2013; White et al. Reference White2013; Citrin et al. Reference Citrin2014 Field et al. Reference Field, Dunai, Ghim, Hill, McMillan, Roach, Saarelma, Schekochihin and Zoletnik2014; Gorler et al. Reference Gorler, White, Told, Jenko, Holland and Rhodes2014; Navarro et al. Reference Navarro, Happel, Görler, Jenko, Abiteboul, Bustos, Doerk and Told2015; Bonanomi et al. Reference Bonanomi, Mantica, Citrin, Goerler and and2018) have provided confidence that nonlinear gyrokinetics is in fact an accurate model of turbulence and transport in the tokamak core, but computational cost has made it generally prohibitively expensive for profile predictions. However, utilising high-performance computing, machine learning techniques and GPU acceleration, it is now possible to perform predictions of fusion devices at high fidelity, enabling more accurate modelling of fusion plasmas. Throughout this paper we refer to both ‘medium’- and ‘high’-fidelity integrated modelling. For the purposes of this work medium fidelity refers to predictions based on physics-based models which include quasi-linear transport models such as TGLF (Staebler, Kinsey & Waltz Reference Staebler, Kinsey and Waltz2007) and Qualikiz (Citrin et al. Reference Citrin2017) which capture crucial physics relevant for core plasma turbulence but rely on saturation rules determined from nonlinear gyrokinetics. In contrast, high fidelity refers to profile predictions that utilise nonlinear gyrokinetics to perform profile predictions.
In this paper we (i) examine predictions of fusion power and gain (Q) of the ARC V3A design point, (ii) determine how uncertain input parameters affect the overall accuracy of our projections and (iii) obtain insight into the turbulence and transport properties of ARC. This analysis focused on the most current ARC design (V3A), but it is anticipated that the design will continue to evolve and that final ARC designs will leverage new insights gained through operation of SPARC. The remainder of this paper is organised as follows. Section 2 provides an overview of the ARC tokamak for the reader, a description of the performance goals and discussion of the operational point examined in this paper. Section 3 focuses on physics-based, medium-fidelity modelling. We give a brief overview of the analysis codes that were utilised to produce integrated modelling predictions of the ARC operational point and compare the predictions of different models with each other and zero-dimensional (0-D) approaches. The sensitivity of results to poorly constrained modelling inputs is examined and the implications discussed. Section 4 presents results focused on high-fidelity, nonlinear gyrokinetic predictions of ARC performance and transport. Profile predictions based on neoclassical and gyrokinetic turbulence modelling are presented and contrasted with lower-fidelity modelling. We discuss the nature of the turbulence in ARC and the implications of this turbulence for accurate modelling. Finally, § 5 provides a brief overview of this paper’s findings, discusses the sensitivity of modelling results and discusses important avenues for research on existing devices that can close open questions for FPPs such as ARC.
2. ARC performance goals, operational point and POPCON modelling
The ARC tokamak is currently in development by CFS. This device is slated for construction and operations in the 2030 s. ARC is part of the high-field tokamak path to fusion energy and the natural progression of the SPARC tokamak (Creely et al. Reference Creely, Greenwald and Ballinger2020; Rodriguez-Fernandez, Howard & Candy Reference Rodriguez-Fernandez, Howard and Candy2022) currently under construction in Devens, MA. The origin of the ARC tokamak concept arises from a paper published by Sorbom et al. (Reference Sorbom2015). However, significant evolution in this concept design point has occurred since the original paper. In fact, the 2015 paper featured only 0-D evaluation of the core performance and a comparatively low-fidelity investigation of the magnets and structural design. The version of ARC presented here results from a more rigorous investigation of all aspects of the power plant design point. ARC is a high-field tokamak that utilises high-temperature superconducting magnets, anticipated to leverage REBCO technology (Seeber Reference Seeber2023) currently being used in the construction of the SPARC tokamak. ARC V3A is a large tokamak with major and minor radii of R = 4.62 m, a = 1.18 m, yielding a plasma volume of 189 m $^3$
, making this device larger than the JET tokamak (
$^3$
, making this device larger than the JET tokamak ( $R=2.96$
m) but smaller than ITER (
$R=2.96$
m) but smaller than ITER ( $R=6.2$
m). In contrast to the original paper, ARC is expected to use pulsed operation with estimated flattop times of 900 s and will operate with an on-axis toroidal field
$R=6.2$
m). In contrast to the original paper, ARC is expected to use pulsed operation with estimated flattop times of 900 s and will operate with an on-axis toroidal field $B_T=11.4$
T and a plasma current of
$B_T=11.4$
T and a plasma current of $I_p=12.0$
MA, resulting in
$I_p=12.0$
MA, resulting in $q_{95}=3.7$
and
$q_{95}=3.7$
and $q_{*}=3.0$
. A flexible coil set is expected to enable significant shaping, providing access to higher-performance operational regimes with seperatrix elongations and triangularity of
$q_{*}=3.0$
. A flexible coil set is expected to enable significant shaping, providing access to higher-performance operational regimes with seperatrix elongations and triangularity of $\kappa _{sep}=1.8$
and
$\kappa _{sep}=1.8$
and $\delta _{sep}=0.65$
. Up to 50 MW of auxiliary heating will be available, utilising H-minority heating via ion cyclotron resonance heating (ICRH) at
$\delta _{sep}=0.65$
. Up to 50 MW of auxiliary heating will be available, utilising H-minority heating via ion cyclotron resonance heating (ICRH) at ${\sim}$
180 MHz to provide on-axis heating. The results covered in this paper are indicative of conditions that should be obtained shortly after the achievement of the current flattop where current profile is expected to be mostly relaxed, but small changes in the evolution of the profile may continue to occur within the 900 s flattop. Changes to the current profile (and safety factor profile) may have non-negligible impact on predicted performance. However, such investigations are out of the scope of this paper and are left for future work. In this paper we therefore assume an approximate steady-state solution of plasma current density profile. It is also worth noting that the ARC design assumes the use of demountable coils. This provides a unique flexibility to modify and optimise the vacuum vessel to provide access to slightly different plasma shapes and volumes – with different vessels representing a trade-off between performance and component lifetimes due to necessary adjustment to shielding. For a more complete description of the ARC tokamak, including descriptions of coils and vessel components, we refer the reader to Hillesheim et al. (Reference Hillesheim2026). Two such configurations were investigated as part of this work and are described briefly in § 3.
${\sim}$
180 MHz to provide on-axis heating. The results covered in this paper are indicative of conditions that should be obtained shortly after the achievement of the current flattop where current profile is expected to be mostly relaxed, but small changes in the evolution of the profile may continue to occur within the 900 s flattop. Changes to the current profile (and safety factor profile) may have non-negligible impact on predicted performance. However, such investigations are out of the scope of this paper and are left for future work. In this paper we therefore assume an approximate steady-state solution of plasma current density profile. It is also worth noting that the ARC design assumes the use of demountable coils. This provides a unique flexibility to modify and optimise the vacuum vessel to provide access to slightly different plasma shapes and volumes – with different vessels representing a trade-off between performance and component lifetimes due to necessary adjustment to shielding. For a more complete description of the ARC tokamak, including descriptions of coils and vessel components, we refer the reader to Hillesheim et al. (Reference Hillesheim2026). Two such configurations were investigated as part of this work and are described briefly in § 3.
The ARC point was chosen to provide approximately 1.13 GW of total fusion power generation with an anticipated ${\sim} 415$
MW of net electricity, after efficiencies and subtracting the power to run the plant. The operational point was designed using the well-known plasma operational contour (POPCON) modelling technique (Houlberg, Attenberger & Hively Reference Houlberg, Attenberger and Hively1982), similar to what was used in the initial SPARC design (Creely et al. Reference Creely, Greenwald and Ballinger2020) but with updated, more conservative, assumptions inspired by higher-fidelity modelling and more recent analysis of similar operational points.
${\sim} 415$
MW of net electricity, after efficiencies and subtracting the power to run the plant. The operational point was designed using the well-known plasma operational contour (POPCON) modelling technique (Houlberg, Attenberger & Hively Reference Houlberg, Attenberger and Hively1982), similar to what was used in the initial SPARC design (Creely et al. Reference Creely, Greenwald and Ballinger2020) but with updated, more conservative, assumptions inspired by higher-fidelity modelling and more recent analysis of similar operational points.
The POPCON for the ARC design point is shown in figure 1. This figure plots the projected operational contours in both volume-averaged density ( $\langle n_e\rangle$
) and volume-averaged temperature (
$\langle n_e\rangle$
) and volume-averaged temperature ( $\langle T_e\rangle$
) space given a set of assumptions about the energy confinement and the assumed profile shapes to calculate the resulting performance. The operational window for ARC based on this analysis is represented by the blue shaded region in figure 1. As stated above, the assumptions made in the ARC POPCON modelling are conservative, using an energy confinement time relative to the
$\langle T_e\rangle$
) space given a set of assumptions about the energy confinement and the assumed profile shapes to calculate the resulting performance. The operational window for ARC based on this analysis is represented by the blue shaded region in figure 1. As stated above, the assumptions made in the ARC POPCON modelling are conservative, using an energy confinement time relative to the $\tau _{98,y2}$
scaling (
$\tau _{98,y2}$
scaling ( $H_{98,y2}$
) (Doyle et al. Reference Doyle1999) of only 0.9. This is especially notable given that the original ARC concept paper and other similar power plant design studies assume H factors greatly exceeding 1.0 (Sorbom et al. Reference Sorbom2015; Buttery et al. Reference Buttery2021). The profile shapes assumed use a set of functional forms meant to approximate realistic profile shapes. Values of
$H_{98,y2}$
) (Doyle et al. Reference Doyle1999) of only 0.9. This is especially notable given that the original ARC concept paper and other similar power plant design studies assume H factors greatly exceeding 1.0 (Sorbom et al. Reference Sorbom2015; Buttery et al. Reference Buttery2021). The profile shapes assumed use a set of functional forms meant to approximate realistic profile shapes. Values of $a/L_{T}$
and
$a/L_{T}$
and $a/L_{n}$
are assumed to be approximately constant from r/a = 0.35 to r/a = 0.9. Inside of this region, the normalised gradient scale length profile is assumed to linearly transition to a value of zero on axis; outside of this region, the profile value is considered a free parameter to adjust to match the volume-averaged density and the total stored energy consistent with the assumed energy confinement time. This approach yields parametrised, but more realistic, profile shapes than traditional parabolic profile assumptions. Additional assumptions made are a 50/50 mix of deuterium and tritium with
$a/L_{n}$
are assumed to be approximately constant from r/a = 0.35 to r/a = 0.9. Inside of this region, the normalised gradient scale length profile is assumed to linearly transition to a value of zero on axis; outside of this region, the profile value is considered a free parameter to adjust to match the volume-averaged density and the total stored energy consistent with the assumed energy confinement time. This approach yields parametrised, but more realistic, profile shapes than traditional parabolic profile assumptions. Additional assumptions made are a 50/50 mix of deuterium and tritium with $T_i/T_e= 0.9$
,
$T_i/T_e= 0.9$
, $Z_{eff} = 1.5$
,
$Z_{eff} = 1.5$
, $n_i/n_e=0.85$
, and density peaking is predicted to approximately follow Angioni’s empirical density peaking scaling (Angioni et al. Reference Angioni2009). The empirical density peaking for these conditions is found to be
$n_i/n_e=0.85$
, and density peaking is predicted to approximately follow Angioni’s empirical density peaking scaling (Angioni et al. Reference Angioni2009). The empirical density peaking for these conditions is found to be $n_e(\psi =0.2)/\langle n_e\rangle =1.52$
for electrons, with a value of 1.42 being assumed for the main ion (D and T) peaking to allow for some conservatism. As demonstrated in figure 1 the plasma is projected to operate well above the L to H threshold, as calculated with Martin scaling (Martin et al. Reference Martin and Takizuka2008) and well below any
$n_e(\psi =0.2)/\langle n_e\rangle =1.52$
for electrons, with a value of 1.42 being assumed for the main ion (D and T) peaking to allow for some conservatism. As demonstrated in figure 1 the plasma is projected to operate well above the L to H threshold, as calculated with Martin scaling (Martin et al. Reference Martin and Takizuka2008) and well below any $\beta$
limits. The chosen point in the potential operational window is projected to produce a fusion power of 1133 MW (
$\beta$
limits. The chosen point in the potential operational window is projected to produce a fusion power of 1133 MW ( $P_{fus}$
) at a plasma gain (Q) of
$P_{fus}$
) at a plasma gain (Q) of ${\sim} 51$
at volume-averaged temperatures and densities of
${\sim} 51$
at volume-averaged temperatures and densities of $\langle T_e\rangle =11.4$
keV and
$\langle T_e\rangle =11.4$
keV and $\langle n_e\rangle =2.44\times 10^{20}$
m
$\langle n_e\rangle =2.44\times 10^{20}$
m $^{-3}$
. A more complete list of the operational point parameters can be found in table 1. We note that the analysis discussed in this paper focuses on a steady-state H-mode operational point in ARC. Determination of the operational path (i.e. density and heating programming) needed to access this eventual steady-state H-mode requires time-dependent modelling, which is planned for future work. However, initial calculations suggest that 50 MW of ICRH should be sufficient for H-mode access in ARC. The following sections primarily focus on analysis of core performance and transport. For more information on divertor and heat flux considerations, the reader is referred to Eich et al. (Reference Eich, Body, Looby, Ballinger, Creely, Hillesheim, Snyder, Howard, Masline and Wigram2026).
$^{-3}$
. A more complete list of the operational point parameters can be found in table 1. We note that the analysis discussed in this paper focuses on a steady-state H-mode operational point in ARC. Determination of the operational path (i.e. density and heating programming) needed to access this eventual steady-state H-mode requires time-dependent modelling, which is planned for future work. However, initial calculations suggest that 50 MW of ICRH should be sufficient for H-mode access in ARC. The following sections primarily focus on analysis of core performance and transport. For more information on divertor and heat flux considerations, the reader is referred to Eich et al. (Reference Eich, Body, Looby, Ballinger, Creely, Hillesheim, Snyder, Howard, Masline and Wigram2026).
The POPCON for the ARC design point is plotted. The shaded blue region indicates the currently projected operational window which is subject to future design updates.

Summary of performance from various models of the ARC operational point. The $P_{LH}$
utilised is taken from Martin et al. (Reference Martin and Takizuka2008).
$P_{LH}$
utilised is taken from Martin et al. (Reference Martin and Takizuka2008).

3. ARC performance projections using physics-based modelling
While POPCONs provide a way to rapidly evaluate and visualise plasma conditions within a large design space, the development of modern integrated modelling tool sets enables similar scoping studies to be performed with physics-based modelling. In this section, we briefly describe the suite of tools that were employed to perform modelling of the ARC operational point, discuss results from medium-fidelity modelling and the sensitivity of the reported results to uncertain inputs and assumptions.
3.1. Description of the modelling set-up
Medium-fidelity modelling of the ARC design point utilised a range of models to accurately simulate the numerous physical phenomena (transport, magnetohydrodynamics, heating, radiation, current diffusion and fast particles) required for the prediction of ARC performance. In this section, we briefly describe the models employed but the reader is referred to the included references for additional information on each of the models and their implementation.
3.1.1. Coupled TRANSP–PORTALS
TRANSPFootnote 1 is a well-known framework for interpretative modelling utilised extensively throughout worldwide fusion community. TRANSP solves the time-dependent, coupled, energy and particle conservation equations while providing models for known sources and sinks that are present in the ARC plasma. Given an initial geometry and a set of profiles, TRANSP performs a fixed boundary equilibrium calculation while evolving current diffusion and modelling a wide range of phenomena. ARC inductive operation at high current results in a large q = 1 surface in the ARC design point. Sawteeth were modelled with the Porcelli model (Porcelli, Boucher & Rosenbluth Reference Porcelli, Boucher and Rosenbluth1996), resulting in a relaxed q profile to just below 1 near the magnetic axis and an inversion radius around mid-radius (see figure 5). ARC will utilise ICRH with a baseline assumption (that may be optimised in the future) of 3 % hydrogen minority heating scheme to provide the entirety of the external heating. The ICRH was modelled via the full-wave TORIC code (Brambilla Reference Brambilla1999) and the ohmic heating profile was calculated within TRANSP. The Monte Carlo fast-ion code NUBEAM (Pankin et al. Reference Pankin, McCune, Andre, Bateman and Kritz2004) was used for the calculation of fusion alphas.
Kinetic profiles ( $n_e$
,
$n_e$
, $T_e$
and
$T_e$
and $T_i$
) were predicted using the PORTALS framework (Rodriguez-Fernandez et al. Reference Rodriguez-Fernandez, Howard and Candy2022; Rodriguez-Fernandez et al. Reference Rodriguez-Fernandez, Howard, Saltzman, Kantamneni, Candy, Holland, Balandat, Ament and White2024a
) with TGLF SAT2 (Staebler et al. Reference Staebler, Candy, Howard and Holland2016) and NEO (Belli & Candy Reference Belli and Candy2008) calculating the turbulent and neoclassical transport, respectively, and a neural network trained specifically for ARC (EPED neural network (EPED-NN), described below) used to provide an edge boundary condition. Following an initial interpretive TRANSP simulation, profile predictions are performed using the sources and sinks from TRANSP while self-consistently calculating radiation, alpha power and exchange during the profile convergence process. The results from these profile predictions are then passed back to TRANSP where it is run interpretively to model the sources (ICRH, ohmic power, alpha heating, etc.), current diffusion and sawteeth. This results in kinetically constrained, magnetic equilibria and source/sink profiles. Results are passed back to PORTALS, the pedestal is updated consistent with changes in the geometry and profiles and the process continues. In practice, 3–5 total iterations of (TRANSP
$T_i$
) were predicted using the PORTALS framework (Rodriguez-Fernandez et al. Reference Rodriguez-Fernandez, Howard and Candy2022; Rodriguez-Fernandez et al. Reference Rodriguez-Fernandez, Howard, Saltzman, Kantamneni, Candy, Holland, Balandat, Ament and White2024a
) with TGLF SAT2 (Staebler et al. Reference Staebler, Candy, Howard and Holland2016) and NEO (Belli & Candy Reference Belli and Candy2008) calculating the turbulent and neoclassical transport, respectively, and a neural network trained specifically for ARC (EPED neural network (EPED-NN), described below) used to provide an edge boundary condition. Following an initial interpretive TRANSP simulation, profile predictions are performed using the sources and sinks from TRANSP while self-consistently calculating radiation, alpha power and exchange during the profile convergence process. The results from these profile predictions are then passed back to TRANSP where it is run interpretively to model the sources (ICRH, ohmic power, alpha heating, etc.), current diffusion and sawteeth. This results in kinetically constrained, magnetic equilibria and source/sink profiles. Results are passed back to PORTALS, the pedestal is updated consistent with changes in the geometry and profiles and the process continues. In practice, 3–5 total iterations of (TRANSP $\rightarrow$
EPED-NN
$\rightarrow$
EPED-NN $\rightarrow$
PORTALS) are required before convergence of the equilibrium + transport is complete. This process is similar to that outlined in the STEP framework (Meneghini et al. Reference Meneghini2020) and provides a relatively rapid (
$\rightarrow$
PORTALS) are required before convergence of the equilibrium + transport is complete. This process is similar to that outlined in the STEP framework (Meneghini et al. Reference Meneghini2020) and provides a relatively rapid ( ${\sim} 4$
hours per condition on 32 CPU cores) way to obtain time-independent evaluation of operational points. The results of the coupled TRANSP–PORTALS workflow serve as the basis for all other modelling presented here.
${\sim} 4$
hours per condition on 32 CPU cores) way to obtain time-independent evaluation of operational points. The results of the coupled TRANSP–PORTALS workflow serve as the basis for all other modelling presented here.
3.1.2. ASTRA
The integrated modelling suite ASTRA (Pereverzev et al. Reference Pereverzev, Yushmanov, D.A.P.A.T. and Z.1991) was also used to assess the performance of the nominal ARC operational point and provide a comparison point with other established workflows. Similar to TRANSP, ASTRA solves time-dependent transport equations (one-dimensional transport while considering two-dimensional geometry) while providing models for the plasma sources and sinks. As ASTRA does not natively include the Porcelli sawtooth model or TORIC for evaluation of the ICRH deposition, results from the interpretive TRANSP modelling were utilised in ASTRA. Specifically, the current density profile and heating deposition profiles obtained from TRANSP were fixed in the ASTRA simulations, while transport, pedestal (via EPED-NN) and radiation were evolved self-consistently to obtain the ASTRA results in this paper. For additional details on the ASTRA framework and implementation, the reader is referred to Pereverzev et al. (Reference Pereverzev, Yushmanov, D.A.P.A.T. and Z.1991).
3.1.3. TORAX
TORAX (Citrin et al. Reference Citrin2024) is a JAX-Python implementation of a one-dimensional time-dependent tokamak plasma transport solver with considerations for two-dimensional magnetic geometry, similar to TRANSP and ASTRA. The auto-differentiation capabilities of JAX allow for implicit time stepping schemes for the time-dependent solution, significantly increasing the dynamically chosen time-step sizes from explicit solvers while respecting the plasma dynamics and thus accelerating the simulation. However, this capability demands each of its components to be in a differentiable form (e.g. analytic expressions or neural network surrogates) to fully leverage this accelerated numerical scheme. The TORAX simulations presented here derive their initial and boundary conditions from the converged reference PORTALS–TRANSP simulation, then evolve the $n_e$
,
$n_e$
, $T_e$
,
$T_e$
, $T_i$
profiles using QLK-NN (van de Plassche et al. Reference van de Plassche, Citrin, Bourdelle, Camenen, Casson, Dagnelie, Felici, Ho, Van Mulders and Contributors2026) as the turbulent transport model until a new steady state is achieved. Fixed ICRH profiles from the reference TRANSP simulation and internally self-consistent analytic ohmic, fusion, radiation and exchange source calculations provide the balancing terms for the transport equations. Since the core region is expected to be heavily impacted by the presence of sawteeth, and TORAX currently does not implement a sawtooth model, an inner transport patch was applied in these simulations to empirically estimate these effects while allowing convergence towards a stationary solution. This method has been demonstrated and discussed in previous integrated modelling studies with other models (Ho et al. Reference Ho, Citrin, Auriemma, Bourdelle, Casson, Kim, Manas, Szepesi, Weisen and Contributors2019; Fajardo et al. Reference Fajardo, Angioni, Kim, Koechl, Fable, Loarte and Polevoi2024).
$T_i$
profiles using QLK-NN (van de Plassche et al. Reference van de Plassche, Citrin, Bourdelle, Camenen, Casson, Dagnelie, Felici, Ho, Van Mulders and Contributors2026) as the turbulent transport model until a new steady state is achieved. Fixed ICRH profiles from the reference TRANSP simulation and internally self-consistent analytic ohmic, fusion, radiation and exchange source calculations provide the balancing terms for the transport equations. Since the core region is expected to be heavily impacted by the presence of sawteeth, and TORAX currently does not implement a sawtooth model, an inner transport patch was applied in these simulations to empirically estimate these effects while allowing convergence towards a stationary solution. This method has been demonstrated and discussed in previous integrated modelling studies with other models (Ho et al. Reference Ho, Citrin, Auriemma, Bourdelle, Casson, Kim, Manas, Szepesi, Weisen and Contributors2019; Fajardo et al. Reference Fajardo, Angioni, Kim, Koechl, Fable, Loarte and Polevoi2024).
3.1.4. ARC EPED-NN and pedestal assumptions
To provide a boundary condition for the core ( $r/a \sim 0.0\ \mathrm{ to }\ 0.95$
) modelling workflows, an EPED-NN was developed around the ARC parameter space. EPED (Snyder et al. Reference Snyder2009, Reference Snyder, Groebner, Hughes, Osborne, Beurskens, Leonard, Wilson and Xu2011) is a well-known model which predicts the pedestal width and height (pressure or average temperature) via calculated criticality conditions for nearly local kinetic ballooning modes (KBM) and non-local peeling–ballooning modes. It has undergone extensive comparison with experiment, typically demonstrating agreement within
$r/a \sim 0.0\ \mathrm{ to }\ 0.95$
) modelling workflows, an EPED-NN was developed around the ARC parameter space. EPED (Snyder et al. Reference Snyder2009, Reference Snyder, Groebner, Hughes, Osborne, Beurskens, Leonard, Wilson and Xu2011) is a well-known model which predicts the pedestal width and height (pressure or average temperature) via calculated criticality conditions for nearly local kinetic ballooning modes (KBM) and non-local peeling–ballooning modes. It has undergone extensive comparison with experiment, typically demonstrating agreement within $\pm 20$
% of experimentally measured pedestal pressures (Snyder et al. Reference Snyder2019; Fenstermacher et al. Reference Fenstermacher, Baylor and de la Luna2025). The EPED-NN used in this paper was trained on approximately 14 000 EPED runs performed with variations of EPED inputs around anticipated ARC operational values (
$\pm 20$
% of experimentally measured pedestal pressures (Snyder et al. Reference Snyder2019; Fenstermacher et al. Reference Fenstermacher, Baylor and de la Luna2025). The EPED-NN used in this paper was trained on approximately 14 000 EPED runs performed with variations of EPED inputs around anticipated ARC operational values ( $B_T$
,
$B_T$
, $I_p$
,
$I_p$
, $n_{ped}$
,
$n_{ped}$
, $\kappa$
,
$\kappa$
, $\delta$
,
$\delta$
, $\beta _N$
,
$\beta _N$
, $Z_{eff}$
,
$Z_{eff}$
, $\epsilon$
,
$\epsilon$
, $R$
,
$R$
, $n_{sep}/n_{ped}$
and
$n_{sep}/n_{ped}$
and $T_{sep}$
). As shown in figures 2(a) and 2(b), this network is found to reproduce the EPED predictions in both pedestal pressure and width in ARC parameter space to a high accuracy (
$T_{sep}$
). As shown in figures 2(a) and 2(b), this network is found to reproduce the EPED predictions in both pedestal pressure and width in ARC parameter space to a high accuracy ( $\text{RMSE} = 2.7$
%). However, as demonstrated in figure 2(c) the neural network is often found to be least accurate at the transition from peeling- to ballooning-limited pedestals. The EPED model accurately predicts the pedestal height and width in Type I edge-localised mode (ELM) and quiescent H-mode (QH) discharges (Snyder et al. Reference Snyder, Osborne, Burrell, Groebner, Leonard, Nazikian, Orlov, Schmitz, Wade and Wilson2012). However Type I ELM H-modes are potentially an undesirable operational point for ARC due to large bursts of heat and particle flux associated with Type I ELMs, and there is significant uncertainty over whether ARC will have sufficient
$\text{RMSE} = 2.7$
%). However, as demonstrated in figure 2(c) the neural network is often found to be least accurate at the transition from peeling- to ballooning-limited pedestals. The EPED model accurately predicts the pedestal height and width in Type I edge-localised mode (ELM) and quiescent H-mode (QH) discharges (Snyder et al. Reference Snyder, Osborne, Burrell, Groebner, Leonard, Nazikian, Orlov, Schmitz, Wade and Wilson2012). However Type I ELM H-modes are potentially an undesirable operational point for ARC due to large bursts of heat and particle flux associated with Type I ELMs, and there is significant uncertainty over whether ARC will have sufficient $E \times B$
shear in the edge for QH operation. The EPED model is currently the most validated pedestal model available to the fusion community, and it typically provides an upper limit for the pedestal pressure in regimes other than Type I ELM and QH. For example, ELM suppression with resonant magnetic perturbations is predicted to constrain the width of the pedestal via three-dimensional field penetration near the pedestal top (Snyder et al. Reference Snyder, Osborne, Burrell, Groebner, Leonard, Nazikian, Orlov, Schmitz, Wade and Wilson2012; Hu et al. Reference Hu, Nazikian, Grierson, Logan, Orlov, Paz-Soldan and Yu2020), resulting in an observed
$E \times B$
shear in the edge for QH operation. The EPED model is currently the most validated pedestal model available to the fusion community, and it typically provides an upper limit for the pedestal pressure in regimes other than Type I ELM and QH. For example, ELM suppression with resonant magnetic perturbations is predicted to constrain the width of the pedestal via three-dimensional field penetration near the pedestal top (Snyder et al. Reference Snyder, Osborne, Burrell, Groebner, Leonard, Nazikian, Orlov, Schmitz, Wade and Wilson2012; Hu et al. Reference Hu, Nazikian, Grierson, Logan, Orlov, Paz-Soldan and Yu2020), resulting in an observed ${\sim} 10$
%
${\sim} 10$
% ${-}20$
% reduction in the pedestal height from the EPED-predicted value. Similarly, a wide range of improved performance regimes and H-mode varieties have been identified on tokamaks worldwide, many of which are inherently ELM-free and/or offer other potentially favourable pedestal structures (such as I-mode, QCE, EDA H-mode etc.) (Groebner & Saarelma Reference Groebner and Saarelma2023; Fenstermacher et al. Reference Fenstermacher, Baylor and de la Luna2025 and references therein). While the field does not currently possess a complete predictive capability for these regimes, many of these regimes have been demonstrated experimentally to exhibit pedestal pressures that approach those found in type-I ELM H-mode conditions, suggesting that pedestal pressure approaching that predicted by EPED could possibly be attained without large ELMs in future ARC conditions. Definitive confirmation of such conditions will benefit from pedestal model validation in SPARC. We also note that EPED under certain conditions predicts a bifurcation of the pedestal solution, and the existence of a very high ‘Super H’ pedestal solution at significantly higher pedestal pressure than the usual H-mode solution (Snyder et al. Reference Snyder, Solomon, Burrell, Garofalo, Grierson, Groebner, Leonard, Nazikian, Osborne and Belli2015). Very high pedestals consistent with Super-H predictions have been observed on Alcator C-Mod and DIII-D (Hughes et al. Reference Hughes2018; Snyder et al. Reference Snyder2019). In the interest of making conservative projections, Super H solutions are not considered here, but may be explored in future studies. For additional discussion on access to ELM-free regimes, the reader is referred to Eich et al. (Reference Eich, Body, Looby, Ballinger, Creely, Hillesheim, Snyder, Howard, Masline and Wigram2026).
${-}20$
% reduction in the pedestal height from the EPED-predicted value. Similarly, a wide range of improved performance regimes and H-mode varieties have been identified on tokamaks worldwide, many of which are inherently ELM-free and/or offer other potentially favourable pedestal structures (such as I-mode, QCE, EDA H-mode etc.) (Groebner & Saarelma Reference Groebner and Saarelma2023; Fenstermacher et al. Reference Fenstermacher, Baylor and de la Luna2025 and references therein). While the field does not currently possess a complete predictive capability for these regimes, many of these regimes have been demonstrated experimentally to exhibit pedestal pressures that approach those found in type-I ELM H-mode conditions, suggesting that pedestal pressure approaching that predicted by EPED could possibly be attained without large ELMs in future ARC conditions. Definitive confirmation of such conditions will benefit from pedestal model validation in SPARC. We also note that EPED under certain conditions predicts a bifurcation of the pedestal solution, and the existence of a very high ‘Super H’ pedestal solution at significantly higher pedestal pressure than the usual H-mode solution (Snyder et al. Reference Snyder, Solomon, Burrell, Garofalo, Grierson, Groebner, Leonard, Nazikian, Osborne and Belli2015). Very high pedestals consistent with Super-H predictions have been observed on Alcator C-Mod and DIII-D (Hughes et al. Reference Hughes2018; Snyder et al. Reference Snyder2019). In the interest of making conservative projections, Super H solutions are not considered here, but may be explored in future studies. For additional discussion on access to ELM-free regimes, the reader is referred to Eich et al. (Reference Eich, Body, Looby, Ballinger, Creely, Hillesheim, Snyder, Howard, Masline and Wigram2026).
Pedestal (a) top pressures and (b) widths predicted via the ARC EPED-NN are compared with full EPED results. (c) A scan of the pedestal density is shown for EPED and EPED-NN with estimated uncertainty in the NN result represented by the shaded region and the vertical line indicating the nominal operational pedestal density.

Development of new, validated and predictive pedestal models is an open area of research and will be incorporated into future work. For example, the EPED model has recently been extended and coupled to SOLPS to enable coupled pedestal–scrape-off layer (SOL)–divertor predictions, including self-consistent calculation of separatrix conditions and particle sources in the edge plasma, which is a necessary condition for including non-stiff transport models in EPED. Coupled pedestal–boundary calculations are expected to be included in near-future ARC physics studies.
3.2. ARC power balance
Initial analysis of the ARC design point utilised the TRANSP–PORTALS workflow for the calculation of the power balance. The resulting power flows, heating profiles and radiation were calculated self-consistently and provide some insight into the physics of the operational point. The ion and electron power flows calculated via TRANSP–PORTALS calculations are plotted in figures 3(a) and 3(b) with each contribution to the total flows indicated in the legend. As expected in a power plant class fusion device operating with deuterium and tritium, the dominant source of power in the system is provided via fusion alphas with a majority of fusion power transferred to the electrons (130 MW). Operation with high absolute density implies that collisional exchange also plays an important role in the overall power balance. The simulated profiles in this condition have $T_e$
>
$T_e$
> $T_i$
leading to an overall power flow from the electrons to the ion channel due to collisional energy exchange, accounting for about 45 MW of total power loss from the electron channel and representing a source of power to the ions that is approximately equal to that coming from fusion products. The applied auxiliary heating is ohmic + ICRH
$T_i$
leading to an overall power flow from the electrons to the ion channel due to collisional energy exchange, accounting for about 45 MW of total power loss from the electron channel and representing a source of power to the ions that is approximately equal to that coming from fusion products. The applied auxiliary heating is ohmic + ICRH $\sim 22\,\mathrm{MW}$
. The ICRH contributions are calculated using the TORIC module and it is found that this mechanism provides slightly more ion heating than electron heating (after considering the minority slowing down) in this condition. Since the majority of the power input into the system is into the electron species (via ICRH and the slowing down of fusion products), and the presence of electron temperatures that exceed ion temperatures, it might be expected that total power flows are dominated by electron losses. Perhaps counterintuitively, overall transported power is dominated by the ion channel as shown in figure 3(d).
$\sim 22\,\mathrm{MW}$
. The ICRH contributions are calculated using the TORIC module and it is found that this mechanism provides slightly more ion heating than electron heating (after considering the minority slowing down) in this condition. Since the majority of the power input into the system is into the electron species (via ICRH and the slowing down of fusion products), and the presence of electron temperatures that exceed ion temperatures, it might be expected that total power flows are dominated by electron losses. Perhaps counterintuitively, overall transported power is dominated by the ion channel as shown in figure 3(d).
The electron power flows (a), ion power flows (b), radiation contributions (c) and heat fluxes (d) are plotted for the ARC design point. Power sinks in (a,b) are given, for visualisation purposes, a negative sign.

In figure 3 it is found that the ion heat flux exceeds the electron heat flux across the radius, leading to ion-to-electron-heat-flux ratios ( $Q_i/Q_e$
) in the 1.5–3 range across the profile. The ratio of power flows in these conditions has important implications for the dominant turbulence as is discussed in § 4 in more detail. Despite the strong electron heating via fusion, these heat flux ratios are obtained by two mechanisms: (i) strong collisional exchange transferring power from the electrons to ions (
$Q_i/Q_e$
) in the 1.5–3 range across the profile. The ratio of power flows in these conditions has important implications for the dominant turbulence as is discussed in § 4 in more detail. Despite the strong electron heating via fusion, these heat flux ratios are obtained by two mechanisms: (i) strong collisional exchange transferring power from the electrons to ions ( ${\sim} 31$
MW) and (ii) large radiative losses (
${\sim} 31$
MW) and (ii) large radiative losses ( ${\sim} 66$
MW) from the plasma due to the presence of high-Z impurities (tungsten) and the high operating temperatures. Figure 3(c) plots the total radiation and its contributions as calculated within TRANSP–PORTALS. As shown in this figure, bremsstrahlung, line radiation and synchrotron radiation all play potentially important roles in setting the overall radiation losses.
${\sim} 66$
MW) from the plasma due to the presence of high-Z impurities (tungsten) and the high operating temperatures. Figure 3(c) plots the total radiation and its contributions as calculated within TRANSP–PORTALS. As shown in this figure, bremsstrahlung, line radiation and synchrotron radiation all play potentially important roles in setting the overall radiation losses.
In figure 3(a), one can see the overall impact of radiation on electron power flows. Radiation contributions are large, approaching the power flow into the electrons provided by fusion in overall magnitude. As a result, the overall power flowing through the electron channel is substantially smaller than that of the ions, which do not experience similar losses. It is important to note that this radiation is dominated by the presence of a small tungsten concentration, assumed to be $n_W=1.5\times 10^{-5}\times n_e$
. This value was chosen to be consistent with previous modelling of devices such as both SPARC (Rodriguez-Fernandez et al. Reference Rodriguez-Fernandez, Howard and Candy2022) and ITER (Howard et al. Reference Howard2024b
) and has been shown to be attainable in current tungsten-walled fusion devices (Neu et al. Reference Neu2005, Reference Neu2016). We note that the overall radiation produced by tungsten is highly dependent on both the assumed concentration and on the tungsten cooling factors (
$n_W=1.5\times 10^{-5}\times n_e$
. This value was chosen to be consistent with previous modelling of devices such as both SPARC (Rodriguez-Fernandez et al. Reference Rodriguez-Fernandez, Howard and Candy2022) and ITER (Howard et al. Reference Howard2024b
) and has been shown to be attainable in current tungsten-walled fusion devices (Neu et al. Reference Neu2005, Reference Neu2016). We note that the overall radiation produced by tungsten is highly dependent on both the assumed concentration and on the tungsten cooling factors ( $L_z$
) which can exhibit high uncertainty (Putterich et al. Reference Putterich, Neu, Dux, Whiteford, O’Mullane and Summers2010). However, these uncertainties are unlikely to be large enough to qualitatively change the ion dominance of the power balance in these conditions.
$L_z$
) which can exhibit high uncertainty (Putterich et al. Reference Putterich, Neu, Dux, Whiteford, O’Mullane and Summers2010). However, these uncertainties are unlikely to be large enough to qualitatively change the ion dominance of the power balance in these conditions.
3.3. Projected ARC performance
Projections of ARC performance were first performed using the TRANSP–PORTALS framework, with results from this analysis then serving as the starting point for analysis with ASTRA, TORAX and PORTALS–CGYRO. All medium-fidelity integrated modelling workflows attempted to utilise similar physics, although a proper ‘apples to apples’ comparison is not possible given the differences in the codes. Here we attempt to summarise the numerical set-up for each framework. All codes simulated conditions with five assumed species (D, T, H (3 %), lumped impurity and W) with $Z_{eff}=1.5$
. A tungsten concentration of
$Z_{eff}=1.5$
. A tungsten concentration of $1.5\times 10^{-5}\times n_e$
and a lumped impurity of Z = 5, A = 10 were utilised to provide additional dilution and resulting in
$1.5\times 10^{-5}\times n_e$
and a lumped impurity of Z = 5, A = 10 were utilised to provide additional dilution and resulting in $n_{D+T}/n_e=0.85$
. Although seeded impurities will likely be necessary in ARC divertor, the lumped impurity assumed here is not meant to describe any specific impurity but instead to represent some combination of He ash, seeded impurities and any other contaminants. This impurity’s Z is chosen to match the assumed dilution (0.85) and
$n_{D+T}/n_e=0.85$
. Although seeded impurities will likely be necessary in ARC divertor, the lumped impurity assumed here is not meant to describe any specific impurity but instead to represent some combination of He ash, seeded impurities and any other contaminants. This impurity’s Z is chosen to match the assumed dilution (0.85) and $Z_{eff}$
. Self-consistent modelling of seeded impurities and their transport is part of ongoing work. The ICRH power deposition profiles, ohmic heating profiles and current density profiles were obtained from the TRANSP–PORTALS calculations and were fixed during analysis with ASTRA and TORAX. Radiation was calculated consistent with the predicted kinetic profiles but it should be noted that differences in the impurity cooling factors likely contribute to some differences in the total radiation. For transport calculations, ASTRA and TRANSP–PORTALS used TGLF SAT2 for calculation of turbulent driven fluxes (Staebler et al. Reference Staebler, Candy, Howard and Holland2016) and TORAX used a neural network derived from the quasi-linear transport model QualiKiz (QLKNN) (van de Plassche et al. Reference van de Plassche, Citrin, Bourdelle, Camenen, Casson, Dagnelie, Felici, Ho, Van Mulders and Contributors2026) which captures only electrostatic turbulence. The TGLF SAT2 setting used for both the TRANSP and ASTRA workflows included electromagnetic turbulence and added resolution at long wavelengths.Footnote
2
Neoclassical fluxes, generally found to be negligible, calculated via analytic formula for ASTRA, are calculated with NEO (Belli & Candy Reference Belli and Candy2008) in the TRANSP–PORTALS framework, and are currently not implemented in TORAX. All modelling approaches simulate from axis to approximately r/a = 0.9 but there are differences in the core modelling assumptions. TRANSP–PORTALS predictions utilise a relatively sparse radial grid spanning from r/a = 0.35 to 0.9, choosing to linearly interpolate gradient-scale lengths to zero inside of r/a = 0.35. In contrast, ASTRA and TORAX simulate all the way to the plasma axis, with TORAX applying a core flattening of profiles to approximate the impact of sawteeth. Pedestal pressure and width were obtained from EPED-NN and were self-consistently evolved during the ASTRA and TRANSP–PORTALS simulations to adjust for changes in the calculated
$Z_{eff}$
. Self-consistent modelling of seeded impurities and their transport is part of ongoing work. The ICRH power deposition profiles, ohmic heating profiles and current density profiles were obtained from the TRANSP–PORTALS calculations and were fixed during analysis with ASTRA and TORAX. Radiation was calculated consistent with the predicted kinetic profiles but it should be noted that differences in the impurity cooling factors likely contribute to some differences in the total radiation. For transport calculations, ASTRA and TRANSP–PORTALS used TGLF SAT2 for calculation of turbulent driven fluxes (Staebler et al. Reference Staebler, Candy, Howard and Holland2016) and TORAX used a neural network derived from the quasi-linear transport model QualiKiz (QLKNN) (van de Plassche et al. Reference van de Plassche, Citrin, Bourdelle, Camenen, Casson, Dagnelie, Felici, Ho, Van Mulders and Contributors2026) which captures only electrostatic turbulence. The TGLF SAT2 setting used for both the TRANSP and ASTRA workflows included electromagnetic turbulence and added resolution at long wavelengths.Footnote
2
Neoclassical fluxes, generally found to be negligible, calculated via analytic formula for ASTRA, are calculated with NEO (Belli & Candy Reference Belli and Candy2008) in the TRANSP–PORTALS framework, and are currently not implemented in TORAX. All modelling approaches simulate from axis to approximately r/a = 0.9 but there are differences in the core modelling assumptions. TRANSP–PORTALS predictions utilise a relatively sparse radial grid spanning from r/a = 0.35 to 0.9, choosing to linearly interpolate gradient-scale lengths to zero inside of r/a = 0.35. In contrast, ASTRA and TORAX simulate all the way to the plasma axis, with TORAX applying a core flattening of profiles to approximate the impact of sawteeth. Pedestal pressure and width were obtained from EPED-NN and were self-consistently evolved during the ASTRA and TRANSP–PORTALS simulations to adjust for changes in the calculated $\beta _N$
(a core parameter that affects the pedestal predictions, thus generating a feedback loop necessary to perform self-consistent predictions) while TORAX utilised fixed pedestal top conditions obtained from the converged TRANSP–PORTALS simulation, as TORAX currently lacks implementation of EPED-NN. The pedestals for both
$\beta _N$
(a core parameter that affects the pedestal predictions, thus generating a feedback loop necessary to perform self-consistent predictions) while TORAX utilised fixed pedestal top conditions obtained from the converged TRANSP–PORTALS simulation, as TORAX currently lacks implementation of EPED-NN. The pedestals for both $n_e$
and
$n_e$
and $T_e$
were assumed to exhibit a mtanh functional form. The final pedestal for the TRANSP–PORTALS modelling predicted a pedestal top pressure of approximately 360 kPa with a pedestal top width of
$T_e$
were assumed to exhibit a mtanh functional form. The final pedestal for the TRANSP–PORTALS modelling predicted a pedestal top pressure of approximately 360 kPa with a pedestal top width of $\varPsi _{pol}=0.074$
, which serves as the boundary condition for the core modelling.
$\varPsi _{pol}=0.074$
, which serves as the boundary condition for the core modelling.
As demonstrated in figure 2 the ARC design point sits in the peeling branch of H-mode parameter space (as predicted by the EPED model), about $10$
% below the transition from peeling- to ballooning-limited pedestal conditions. The high density of the operational point was chosen to take advantage of the favourable scaling of fusion power with density (
$10$
% below the transition from peeling- to ballooning-limited pedestal conditions. The high density of the operational point was chosen to take advantage of the favourable scaling of fusion power with density ( $P_{fus} \propto n^2$
) while maintaining a safe distance from the peeling–ballooning transition. The input pedestal density (
$P_{fus} \propto n^2$
) while maintaining a safe distance from the peeling–ballooning transition. The input pedestal density ( $2.1\times 10^{20}$
m
$2.1\times 10^{20}$
m $^{-3}$
) to EPED-NN was chosen also to a obtain volume-averaged density as close as possible to that specified in the POPCON scoping of
$^{-3}$
) to EPED-NN was chosen also to a obtain volume-averaged density as close as possible to that specified in the POPCON scoping of $\langle n_e\rangle \sim 2.4\times 10^{20}$
m
$\langle n_e\rangle \sim 2.4\times 10^{20}$
m $^{-3}$
. However, in 1.5-dimensional modelling, the volume-averaged density is not an input but results from a combination of the assumed pedestal density and profile shape, combined with the density profile predictions in the core. Although not explicitly utilised in core modelling, a ratio of separatrix density to pedestal density (
$^{-3}$
. However, in 1.5-dimensional modelling, the volume-averaged density is not an input but results from a combination of the assumed pedestal density and profile shape, combined with the density profile predictions in the core. Although not explicitly utilised in core modelling, a ratio of separatrix density to pedestal density ( $n_{sep}/n_{ped} = 0.4$
) was assumed for the base ARC simulation with a separatrix temperature of 200 eV. These values are inputs to EPED and can play an important role in setting the predicted pedestal pressure, which in turn translates into differences in the core performance. A discussion of the details of these assumptions is given in a paper that is also part of this ARC physics basis collection (Eich et al. Reference Eich, Body, Looby, Ballinger, Creely, Hillesheim, Snyder, Howard, Masline and Wigram2026). Changes in the assumed separatrix density will be investigated as part of future work focused on core-edge integration in ARC conditions.
$n_{sep}/n_{ped} = 0.4$
) was assumed for the base ARC simulation with a separatrix temperature of 200 eV. These values are inputs to EPED and can play an important role in setting the predicted pedestal pressure, which in turn translates into differences in the core performance. A discussion of the details of these assumptions is given in a paper that is also part of this ARC physics basis collection (Eich et al. Reference Eich, Body, Looby, Ballinger, Creely, Hillesheim, Snyder, Howard, Masline and Wigram2026). Changes in the assumed separatrix density will be investigated as part of future work focused on core-edge integration in ARC conditions.
The $T_e$
,
$T_e$
, $T_i$
and
$T_i$
and $n_e$
profiles predicted by TRANSP–PORTALS, ASTRA and TORAX are plotted in figure 4 and the reader is referred again to table 1 for additional performance metrics. Generically, it can be seen that these approaches all yield qualitatively similar profiles, despite the known differences in the modelling approaches and underlying transport models. However, there are clear quantitative differences in the predicted profile shapes, particularly in the predicted electron density. At FPP-relevant temperatures, the highly nonlinear dependence of the fusion power on local values of density and temperature implies that even small changes in the profiles can in principle lead to non-negligible performance changes. Profiles predicted via TRANSP–PORTALS and ASTRA lie in very close agreement, predicting 879 MW (Q = 38.6) and 895 MW (Q = 37.1), respectively. The small variance in performance likely results in part due the differences in predicted near-axis gradients, which are only interpolated in the TRANSP–PORTALS workflow. In contrast, the modest difference in predicted profile shapes shown in TORAX results in dramatically different performance predictions. Increased density and temperature peaking in the near edge yields broader profiles and predicted fusion power of 1295 MW (Q = 51.0). Differences between the integrated modelling results and the POPCON predictions have their origin in the predicted profile shapes relative to those assumed in the 0-D evaluations. As shown in table 1 all medium-fidelity approaches predict similar values of
$n_e$
profiles predicted by TRANSP–PORTALS, ASTRA and TORAX are plotted in figure 4 and the reader is referred again to table 1 for additional performance metrics. Generically, it can be seen that these approaches all yield qualitatively similar profiles, despite the known differences in the modelling approaches and underlying transport models. However, there are clear quantitative differences in the predicted profile shapes, particularly in the predicted electron density. At FPP-relevant temperatures, the highly nonlinear dependence of the fusion power on local values of density and temperature implies that even small changes in the profiles can in principle lead to non-negligible performance changes. Profiles predicted via TRANSP–PORTALS and ASTRA lie in very close agreement, predicting 879 MW (Q = 38.6) and 895 MW (Q = 37.1), respectively. The small variance in performance likely results in part due the differences in predicted near-axis gradients, which are only interpolated in the TRANSP–PORTALS workflow. In contrast, the modest difference in predicted profile shapes shown in TORAX results in dramatically different performance predictions. Increased density and temperature peaking in the near edge yields broader profiles and predicted fusion power of 1295 MW (Q = 51.0). Differences between the integrated modelling results and the POPCON predictions have their origin in the predicted profile shapes relative to those assumed in the 0-D evaluations. As shown in table 1 all medium-fidelity approaches predict similar values of $H_{98,y2}$
, with values ranging from 0.9 to 0.94, in close quantitative agreement with the POPCON assumption (
$H_{98,y2}$
, with values ranging from 0.9 to 0.94, in close quantitative agreement with the POPCON assumption ( $H_{98,y2}=0.9$
). The source of disagreement is found when comparing the volume-averaged quantities and their associated peaking. The POPCON assumptions for profile peaking are significantly higher than those found the TRANSP–PORTALS and ASTRA modelling reflected in particular in the differences in the peaking factors
$H_{98,y2}=0.9$
). The source of disagreement is found when comparing the volume-averaged quantities and their associated peaking. The POPCON assumptions for profile peaking are significantly higher than those found the TRANSP–PORTALS and ASTRA modelling reflected in particular in the differences in the peaking factors $\nu _{ne}$
,
$\nu _{ne}$
, $\nu _{Te}$
and
$\nu _{Te}$
and $\nu _{Ti}$
as well as volume-averaged temperatures (recall that
$\nu _{Ti}$
as well as volume-averaged temperatures (recall that $\langle n_e\rangle$
is essentially chosen to be similar between POPCON and medium-fidelity modelling through the choice of
$\langle n_e\rangle$
is essentially chosen to be similar between POPCON and medium-fidelity modelling through the choice of $n_{ped}$
). This general result is consistent with modelling published for the SPARC primary reference discharge (Rodriguez-Fernandez et al. Reference Rodriguez-Fernandez, Howard, Greenwald, Creely, Hughes, Wright, Holland, Lin and Sciortino2020) which demonstrated that despite similar 0-D agreement between POPCON and medium-fidelity modelling, the predicted performance was significantly lower due to differences in profile shape. All medium-fidelity modelling efforts predict that ARC will operate well below anticipated beta limits (with
$n_{ped}$
). This general result is consistent with modelling published for the SPARC primary reference discharge (Rodriguez-Fernandez et al. Reference Rodriguez-Fernandez, Howard, Greenwald, Creely, Hughes, Wright, Holland, Lin and Sciortino2020) which demonstrated that despite similar 0-D agreement between POPCON and medium-fidelity modelling, the predicted performance was significantly lower due to differences in profile shape. All medium-fidelity modelling efforts predict that ARC will operate well below anticipated beta limits (with $\beta _N = 1.58 {-} 1.94$
) and will operate above the L to H threshold as predicted via the Martin scaling (Martin et al. Reference Martin and Takizuka2008). The range of predicted fusion performance (879–1295 MW) despite nearly identical H factors is impressive and suggests that the projection with energy confinement scalings is insufficient for fusion devices operating at power-plant-relevant plasma conditions. The range of integrated modelling approaches applied would suggest that this ARC design point should expect approximately 1 GW of fusion with a plasma gain of
$\beta _N = 1.58 {-} 1.94$
) and will operate above the L to H threshold as predicted via the Martin scaling (Martin et al. Reference Martin and Takizuka2008). The range of predicted fusion performance (879–1295 MW) despite nearly identical H factors is impressive and suggests that the projection with energy confinement scalings is insufficient for fusion devices operating at power-plant-relevant plasma conditions. The range of integrated modelling approaches applied would suggest that this ARC design point should expect approximately 1 GW of fusion with a plasma gain of ${\sim} 40$
and are within
${\sim} 40$
and are within $\pm 20$
% of the POPCON prediction. Even with the most pessimistic of these medium-fidelity modelling predictions, fusion powers approaching 1 GW should still provide sufficient fusion power to constitute a viable design.
$\pm 20$
% of the POPCON prediction. Even with the most pessimistic of these medium-fidelity modelling predictions, fusion powers approaching 1 GW should still provide sufficient fusion power to constitute a viable design.
The $T_e$
,
$T_e$
, $T_i$
and
$T_i$
and $n_e$
profiles and their respective normalised gradient-scale lengths are plotted for predictions from TRANSP–PORTALS (blue), ASTRA (red) and TORAX (green).
$n_e$
profiles and their respective normalised gradient-scale lengths are plotted for predictions from TRANSP–PORTALS (blue), ASTRA (red) and TORAX (green).

The safety factor profile and magnetic shear profile ( $-(r/q){\rm d}q/{\rm d}r$
) from the TRANSP–PORTALS and CGYRO modelling are shown.
$-(r/q){\rm d}q/{\rm d}r$
) from the TRANSP–PORTALS and CGYRO modelling are shown.

As mentioned above, ARC will employ demountable field coils as part of its design, allowing for significant flexibility in device operation, maintenance and even the ability to interchange physical components such as the tokamak vacuum vessel. Additional potential operational points have been evaluated which are possible within the device design. With trade-off between the longevity of the tokamak components and achieved fusion performance, operational points up to 1100 MW have been identified using the TRANSP–PORTALS framework with the nominal physical assumptions and further investigation may be the subject of future work.
3.4. Design point sensitivity
To investigate the sensitivity of the medium-fidelity modelling results to input assumptions, a series of TRANSP–PORTALS scans were performed around the ARC reference design point. The dependence of performance in H-mode tokamak discharges on pedestal pressure (predicted fusion power typically scales approximately with the square of the pedestal pressure) is well known in the literature (e.g. Kinsey et al. Reference Kinsey, Staebler, Candy, Waltz and Budny2011) and all modelling described in previous sections assumed a pedestal width and pressure consistent with the EPED model. For the purposes of this effort, we chose to scan the assumed edge pressure around the nominal EPED prediction – a range that spans the published level ( $\pm 20$
%) of agreement of EPED with experiment (Snyder et al. Reference Snyder2019; Fenstermacher et al. Reference Fenstermacher, Baylor and de la Luna2025). This exercise provides insight into the range of pedestals that may be accessible for the ARC tokamak, including those at potentially degraded pedestal performance – which may be necessary to avoid ELMs during ARC operation, in the absence of sufficiently detached operational conditions. The results of the pedestal top pressure scan are plotted in figure 2(c). Unsurprisingly, the results are extremely sensitive to changes in pedestal pressure. A
$\pm 20$
%) of agreement of EPED with experiment (Snyder et al. Reference Snyder2019; Fenstermacher et al. Reference Fenstermacher, Baylor and de la Luna2025). This exercise provides insight into the range of pedestals that may be accessible for the ARC tokamak, including those at potentially degraded pedestal performance – which may be necessary to avoid ELMs during ARC operation, in the absence of sufficiently detached operational conditions. The results of the pedestal top pressure scan are plotted in figure 2(c). Unsurprisingly, the results are extremely sensitive to changes in pedestal pressure. A $20$
% increase in the pedestal pressure raises fusion performance from 878 MW to
$20$
% increase in the pedestal pressure raises fusion performance from 878 MW to ${\sim} 1.24$
GW (Q = 55.3) of fusion power production while raising the predicted
${\sim} 1.24$
GW (Q = 55.3) of fusion power production while raising the predicted $H_{98,y2}$
to 0.98, bringing the results into better agreement with the most commonly used H-mode empirical scaling. However, the need to avoid ELMs in power-plant-class devices is well established, and therefore reduction of the pedestal pressure below the EPED-predicted operational point may be necessary for safe operation of the device. A
$H_{98,y2}$
to 0.98, bringing the results into better agreement with the most commonly used H-mode empirical scaling. However, the need to avoid ELMs in power-plant-class devices is well established, and therefore reduction of the pedestal pressure below the EPED-predicted operational point may be necessary for safe operation of the device. A $20$
% decrease in the assumed pedestal pressure drops the predicted performance to approximately 565 MW (
$20$
% decrease in the assumed pedestal pressure drops the predicted performance to approximately 565 MW ( $H_{98,y2} =0.8$
), a significant drop in fusion power, but still producing over half a gigawatt via fusion. It is notable that with this drop in performance the predicted
$H_{98,y2} =0.8$
), a significant drop in fusion power, but still producing over half a gigawatt via fusion. It is notable that with this drop in performance the predicted $H_{98,y2}$
drops to just 0.8, outside of the quoted
$H_{98,y2}$
drops to just 0.8, outside of the quoted $H_{98,y2}$
uncertainty, and the total power through the SOL is likely insufficient to maintain robust H-mode operation. The assumed pedestal top pressure is not the only input assumption that can play a crucial role in setting the overall performance. As outlined in a recent SPARC publication (Muraca et al. Reference Muraca, Rodriguez-Fernandez, Howard, Hall, Fable and Tardini2025), assumptions on parameters such as
$H_{98,y2}$
uncertainty, and the total power through the SOL is likely insufficient to maintain robust H-mode operation. The assumed pedestal top pressure is not the only input assumption that can play a crucial role in setting the overall performance. As outlined in a recent SPARC publication (Muraca et al. Reference Muraca, Rodriguez-Fernandez, Howard, Hall, Fable and Tardini2025), assumptions on parameters such as $n_W/n_e$
and
$n_W/n_e$
and $(T_i/T_e)_{ped}$
can also play a significant role. In this work, we have examined the sensitivity of the ARC results to assumed values of
$(T_i/T_e)_{ped}$
can also play a significant role. In this work, we have examined the sensitivity of the ARC results to assumed values of $n_{sep}/n_{ped}$
,
$n_{sep}/n_{ped}$
, $n_W/n_e$
and
$n_W/n_e$
and $(T_i/T_e)_{ped}$
, and the dependence of results on
$(T_i/T_e)_{ped}$
, and the dependence of results on $P_{ped}$
. These results are plotted in figure 6(b–d). As shown in figure 6(c), when holding the pedestal density constant and scanning
$P_{ped}$
. These results are plotted in figure 6(b–d). As shown in figure 6(c), when holding the pedestal density constant and scanning $n_{sep}$
, there is an apparent weak dependence on the assumed
$n_{sep}$
, there is an apparent weak dependence on the assumed $n_{sep}/n_{ped}$
around the reference conditions. However, this is somewhat misleading, as conditions with
$n_{sep}/n_{ped}$
around the reference conditions. However, this is somewhat misleading, as conditions with $n_{sep}/n_{ped} \geqslant 0.45$
actually operate on the ballooning branch compared with peeling-limited operation for
$n_{sep}/n_{ped} \geqslant 0.45$
actually operate on the ballooning branch compared with peeling-limited operation for $n_{sep}/n_{ped} \leqslant 0.45$
for the nominal value of Greenwald fraction assumed in the operational point (
$n_{sep}/n_{ped} \leqslant 0.45$
for the nominal value of Greenwald fraction assumed in the operational point ( $f_{GW} = 0.9$
). This is important because operation on the ballooning branch means that slight increases in density will not increase fusion but will lead to a significant drop in fusion performance. In figure 6(d) the dependence of the performance on assumed tungsten concentration over the limited range of
$f_{GW} = 0.9$
). This is important because operation on the ballooning branch means that slight increases in density will not increase fusion but will lead to a significant drop in fusion performance. In figure 6(d) the dependence of the performance on assumed tungsten concentration over the limited range of $(0.75{-}4.5)\times 10^{-5}\times n_e$
is shown. To remind the reader, the nominal operational point for the ARC discharge is assumed to be
$(0.75{-}4.5)\times 10^{-5}\times n_e$
is shown. To remind the reader, the nominal operational point for the ARC discharge is assumed to be
(a–d) The sensitivity of the TRANSP–PORTALS modelling results to scans in uncertain input parameters is plotted. The reference case is indicated in red.
 $1.5\times 10^{-5}\times n_e$
with recent publications (Ivanova-Stanik, Chmielewski & Zagorski Reference Ivanova-Stanik, Chmielewski and Zagorski2023) suggesting that lower concentrations may be obtained due to high-density operation. Despite radiation varying from
$1.5\times 10^{-5}\times n_e$
with recent publications (Ivanova-Stanik, Chmielewski & Zagorski Reference Ivanova-Stanik, Chmielewski and Zagorski2023) suggesting that lower concentrations may be obtained due to high-density operation. Despite radiation varying from ${\sim} 57 \ \mathrm{to}\ 110$
MW over the range of scanned values, the dependence on this parameter is weak, with variations in performance likely arising from small differences in numerical convergence. This result is perhaps not completely unexpected as similar burning plasmas have been demonstrated to exhibit extremely stiff transport (Rodriguez-Fernandez et al. Reference Rodriguez-Fernandez, Howard, Greenwald, Creely, Hughes, Wright, Holland, Lin and Sciortino2020; Holland et al. Reference Holland, Bass, Orlov, McClenaghan, Lyons, Grierson, Jian, Howard and Rodriguez-Fernandez2023) implying that changes in the transported power are unlikely to significantly modify predicted profiles. Increasing the fidelity of impurity transport and radiation calculations around ARC design points will be the subject of future work. All modelling results presented made the assumption that
${\sim} 57 \ \mathrm{to}\ 110$
MW over the range of scanned values, the dependence on this parameter is weak, with variations in performance likely arising from small differences in numerical convergence. This result is perhaps not completely unexpected as similar burning plasmas have been demonstrated to exhibit extremely stiff transport (Rodriguez-Fernandez et al. Reference Rodriguez-Fernandez, Howard, Greenwald, Creely, Hughes, Wright, Holland, Lin and Sciortino2020; Holland et al. Reference Holland, Bass, Orlov, McClenaghan, Lyons, Grierson, Jian, Howard and Rodriguez-Fernandez2023) implying that changes in the transported power are unlikely to significantly modify predicted profiles. Increasing the fidelity of impurity transport and radiation calculations around ARC design points will be the subject of future work. All modelling results presented made the assumption that $T_e = T_i$
at the pedestal top. Although the high density and relatively cool plasma present at the pedestal top will likely lead to significant exchange and therefore approximately equal ion and electron temperatures,
$T_e = T_i$
at the pedestal top. Although the high density and relatively cool plasma present at the pedestal top will likely lead to significant exchange and therefore approximately equal ion and electron temperatures, $T_e = T_i$
, it is unclear to what extent this assumption will hold and the temperature ratio
$T_e = T_i$
, it is unclear to what extent this assumption will hold and the temperature ratio $T_i/T_e$
is known to play an important role in stabilising (or destabilising) ion temperature gradient (ITG) turbulence (Casati et al. Reference Casati, Bourdelle, Garbet and Imbeaux2008). As shown in figure 6(b) the performance is very sensitive to the assumed pedestal top temperature ratio. A range of 698–1134 MW is found for a variation of
$T_i/T_e$
is known to play an important role in stabilising (or destabilising) ion temperature gradient (ITG) turbulence (Casati et al. Reference Casati, Bourdelle, Garbet and Imbeaux2008). As shown in figure 6(b) the performance is very sensitive to the assumed pedestal top temperature ratio. A range of 698–1134 MW is found for a variation of $T_i/T_e$
from 0.9 to 1.1. This provides an indication that the dominant turbulence setting ARC core performance is likely ITG – a result that is confirmed in § 4 of this paper. Taken together these results suggest that a wide range of performance predictions are possible within modelling uncertainties and underscore the need for an enhanced understanding of pedestal performance and structure to refine estimates for burning plasmas (such as SPARC) and next-generation fusion devices aimed at higher fusion power generation.
$T_i/T_e$
from 0.9 to 1.1. This provides an indication that the dominant turbulence setting ARC core performance is likely ITG – a result that is confirmed in § 4 of this paper. Taken together these results suggest that a wide range of performance predictions are possible within modelling uncertainties and underscore the need for an enhanced understanding of pedestal performance and structure to refine estimates for burning plasmas (such as SPARC) and next-generation fusion devices aimed at higher fusion power generation.
4. ARC performance projections using nonlinear gyrokinetics
The analysis described in the previous section relies primarily on what are referred to as physics-based models. Such models are routinely applied to both predict and interpret existing fusion experiments due primarily to their balance of accuracy and computational cost. For this reason, they are commonly used in scoping studies for next-generation fusion devices (Fable et al. Reference Fable2019; Buttery et al. Reference Buttery2021). However, recent advances in high-performance computing hardware and the optimisation of high-fidelity turbulence modelling for GPU-based high-performance computing systems have enabled the more routine use of nonlinear gyrokinetics for profile predictions and projections of performance. At the time of writing, nonlinear gyrokinetics is the gold standard for profile predictions, as it is generally believed to be capable of capturing the relevant physical phenomena needed to predict profiles and performance in the core ( $r/a \lt 0.9$
) of tokamak plasmas. Given the need for reliable, high-accuracy modelling, this section covers the prediction of ARC performance via nonlinear gyrokinetic profile prediction.
$r/a \lt 0.9$
) of tokamak plasmas. Given the need for reliable, high-accuracy modelling, this section covers the prediction of ARC performance via nonlinear gyrokinetic profile prediction.
4.1. Simulation and modelling set-up
Predictions of plasma profiles utilising nonlinear gyrokinetics were enabled by surrogate-accelerated profile prediction techniques implemented in the PORTALS code (Rodriguez-Fernandez et al. Reference Rodriguez-Fernandez, Howard, Saltzman, Kantamneni, Candy, Holland, Balandat, Ament and White2024a
). The details of this framework are out of the scope of this paper but the reader is referred to both Rodriguez-Fernandez et al. (Reference Rodriguez-Fernandez, Howard and Candy2022) and Rodriguez-Fernandez et al. (Reference Rodriguez-Fernandez, Howard, Saltzman, Kantamneni, Candy, Holland, Balandat, Ament and White2024a
). However, we summarise the numerical techniques in PORTALS here for completeness. To accelerate the convergence in profile prediction, PORTALS first utilises a small database ( ${\sim} 5$
) of high-fidelity simulations (nonlinear gyrokinetics) to build a surrogate that is capable of reproducing the response of heat and particle fluxes to inputs (
${\sim} 5$
) of high-fidelity simulations (nonlinear gyrokinetics) to build a surrogate that is capable of reproducing the response of heat and particle fluxes to inputs ( $a/L_{T_i}$
,
$a/L_{T_i}$
, $a/L_{T_e}$
,
$a/L_{T_e}$
, $a/L_{n_e}$
, etc.) The surrogates for the nonlinear gyrokinetic fluxes are then used to predict a set of profiles and gradients that are believed to match the transport targets (
$a/L_{n_e}$
, etc.) The surrogates for the nonlinear gyrokinetic fluxes are then used to predict a set of profiles and gradients that are believed to match the transport targets ( $Q_e$
,
$Q_e$
, $Q_i$
,
$Q_i$
, $\varGamma _e$
) when evaluated by the high-fidelity model (nonlinear gyrokinetics). Surrogate-predicted profiles are then tested with the high-fidelity model and the fluxes are reported back to the PORTALS framework. If the fluxes produced are in agreement with the targets, the process concludes and the simulation is deemed converged. However, if the fluxes disagree with the targets, then the results of the high-fidelity model are added to a database, a new surrogate is built and the process continues until convergence is reached between the target fluxes and the results from the high-fidelity model. The surrogate-based approach has been demonstrated to significantly speed up profile predictions compared with traditional methods based on Newton solvers (Rodriguez-Fernandez et al. Reference Rodriguez-Fernandez, Howard, Saltzman, Kantamneni, Candy, Holland, Balandat, Ament and White2024a
) and has recently been utilised to model experiments on both the DIII-D (Howard et al. Reference Howard2024b
) and ASDEX-Upgrade (Bielajew et al. Reference Bielajew2025) tokamaks, demonstrating good agreement with measured profiles and measured turbulent fluctuations.
$\varGamma _e$
) when evaluated by the high-fidelity model (nonlinear gyrokinetics). Surrogate-predicted profiles are then tested with the high-fidelity model and the fluxes are reported back to the PORTALS framework. If the fluxes produced are in agreement with the targets, the process concludes and the simulation is deemed converged. However, if the fluxes disagree with the targets, then the results of the high-fidelity model are added to a database, a new surrogate is built and the process continues until convergence is reached between the target fluxes and the results from the high-fidelity model. The surrogate-based approach has been demonstrated to significantly speed up profile predictions compared with traditional methods based on Newton solvers (Rodriguez-Fernandez et al. Reference Rodriguez-Fernandez, Howard, Saltzman, Kantamneni, Candy, Holland, Balandat, Ament and White2024a
) and has recently been utilised to model experiments on both the DIII-D (Howard et al. Reference Howard2024b
) and ASDEX-Upgrade (Bielajew et al. Reference Bielajew2025) tokamaks, demonstrating good agreement with measured profiles and measured turbulent fluctuations.
The high-fidelity evaluations presented in this paper make use of the NEO (Belli & Candy Reference Belli and Candy2008) and CGYRO (Candy, Belli & Bravenec Reference Candy, Belli and Bravenec2016) codes for calculation of the neoclassical and turbulent contributions to the total fluxes, respectively. The total flux in this context is the simple linear sum of the neoclassical and turbulent contributions (i.e $Q_{neo}+Q_{turb}$
) with the latter playing the dominant role in all calculations performed for the ARC tokamak. CGYRO is a flux-tube gyrokinetic code that has been optimised for multi-scale turbulence simulation and GPU architectures and has been compared with experiments worldwide (Odstrčil et al. Reference Odstrčil, Howard, Sciortino, Chrystal, Holland, Hollmann, McKee, Thome and Wilks2020; Howard et al. Reference Howard2024b
; Bielajew et al. Reference Bielajew2025). Profiles of
$Q_{neo}+Q_{turb}$
) with the latter playing the dominant role in all calculations performed for the ARC tokamak. CGYRO is a flux-tube gyrokinetic code that has been optimised for multi-scale turbulence simulation and GPU architectures and has been compared with experiments worldwide (Odstrčil et al. Reference Odstrčil, Howard, Sciortino, Chrystal, Holland, Hollmann, McKee, Thome and Wilks2020; Howard et al. Reference Howard2024b
; Bielajew et al. Reference Bielajew2025). Profiles of $n_e$
,
$n_e$
, $T_e$
and
$T_e$
and $T_i$
were predicted using the PORTALS framework at five radial locations, r/a = 0.4, 0.55, 0.75, 0.875. 0.9, corresponding to values of normalised square root of the toroidal flux,
$T_i$
were predicted using the PORTALS framework at five radial locations, r/a = 0.4, 0.55, 0.75, 0.875. 0.9, corresponding to values of normalised square root of the toroidal flux, $\rho \sim 0.35,0.48,0.67,0.8,0.83$
. Outside of r/a = 0.9, the profiles are held fixed and consistent with the TRANSP–PORTALS modelling described in § 3. The choice of radial evaluation points and their locations is largely based on previous work, which indicates that this choice of radial locations can produce accurate simulation of inductive tokamak plasmas (Rodriguez-Fernandez et al. Reference Rodriguez-Fernandez, Howard, Saltzman, Kantamneni, Candy, Holland, Balandat, Ament and White2024a
). We note that the innermost location used in this work is at a slightly larger minor radius than previous works (Howard et al. Reference Howard, Rodriguez-Fernandez, Holland and Candy2024a
,Reference Howard
b
). The extremely low values of magnetic shear and low overall values of q (
$\rho \sim 0.35,0.48,0.67,0.8,0.83$
. Outside of r/a = 0.9, the profiles are held fixed and consistent with the TRANSP–PORTALS modelling described in § 3. The choice of radial evaluation points and their locations is largely based on previous work, which indicates that this choice of radial locations can produce accurate simulation of inductive tokamak plasmas (Rodriguez-Fernandez et al. Reference Rodriguez-Fernandez, Howard, Saltzman, Kantamneni, Candy, Holland, Balandat, Ament and White2024a
). We note that the innermost location used in this work is at a slightly larger minor radius than previous works (Howard et al. Reference Howard, Rodriguez-Fernandez, Holland and Candy2024a
,Reference Howard
b
). The extremely low values of magnetic shear and low overall values of q ( $\lt 1 $
) present at r/a = 0.35 (see figure 5) made these simulations extremely computationally challenging, and thus we chose to move outwards slightly to reduce the computational burden and avoid regions that will be strongly dominated by sawteeth. Evaluation of near-axis locations may be the subject of future work focused on evaluation of fast-ion interactions with turbulence and impurity peaking in near-axis conditions. Unless otherwise noted, all simulations performed in this work were nonlinear, featuring the use of four gyrokinetic species: deuterium, tritium, a lumped impurity (Z = 4) and electrons. The validity of the assumption of the lumped impurity has been verified in previous works (Howard et al. Reference Howard, Rodriguez-Fernandez, Holland and Candy2024a
) and is meant to represent the average Z of several impurities such as the H minority (for ICRH), He ash and W introduced from the metal walls. Despite bundling within the nonlinear gyrokinetic code, the PORTALS framework separates the impurity species when calculating radiation contributions to determine the transport targets. Simulations were fully electromagnetic, evolving
$\lt 1 $
) present at r/a = 0.35 (see figure 5) made these simulations extremely computationally challenging, and thus we chose to move outwards slightly to reduce the computational burden and avoid regions that will be strongly dominated by sawteeth. Evaluation of near-axis locations may be the subject of future work focused on evaluation of fast-ion interactions with turbulence and impurity peaking in near-axis conditions. Unless otherwise noted, all simulations performed in this work were nonlinear, featuring the use of four gyrokinetic species: deuterium, tritium, a lumped impurity (Z = 4) and electrons. The validity of the assumption of the lumped impurity has been verified in previous works (Howard et al. Reference Howard, Rodriguez-Fernandez, Holland and Candy2024a
) and is meant to represent the average Z of several impurities such as the H minority (for ICRH), He ash and W introduced from the metal walls. Despite bundling within the nonlinear gyrokinetic code, the PORTALS framework separates the impurity species when calculating radiation contributions to determine the transport targets. Simulations were fully electromagnetic, evolving $\delta \phi , \delta A_{||}$
and
$\delta \phi , \delta A_{||}$
and $\delta B_{||}$
, and included geometry described by the Miller extended harmonic model that is capable of realistic shaping (Arbon, Candy & Belli Reference Arbon, Candy and Belli2020) and Sugama collisions (Sugama, Watanabe & Nunami Reference Sugama, Watanabe and Nunami2009). Typical simulation boxes used in this work were approximately
$\delta B_{||}$
, and included geometry described by the Miller extended harmonic model that is capable of realistic shaping (Arbon, Candy & Belli Reference Arbon, Candy and Belli2020) and Sugama collisions (Sugama, Watanabe & Nunami Reference Sugama, Watanabe and Nunami2009). Typical simulation boxes used in this work were approximately $[L_x, L_y] \sim [120,120]\rho _s$
in the radial and binormal directions and were represented using 512 radial modes (
$[L_x, L_y] \sim [120,120]\rho _s$
in the radial and binormal directions and were represented using 512 radial modes ( $n_r$
), 24 toroidal modes (up to
$n_r$
), 24 toroidal modes (up to $k_\theta \rho _s = 1.2$
), 24 points in theta (
$k_\theta \rho _s = 1.2$
), 24 points in theta ( $n_\theta$
), 24 pitch angles (
$n_\theta$
), 24 pitch angles ( $n_\eta$
) and 8 energies (
$n_\eta$
) and 8 energies ( $n_{energy}$
). These choices of resolutions and simulated range of
$n_{energy}$
). These choices of resolutions and simulated range of $k_\theta \rho _s$
are capable of capturing KBM, microtearing mode (MTM), ITG mode and trapped electron mode (TEM) contributions. High-k TEM/electron temperature gradient (ETG) contributions are not captured but are not believed to play an important role as discussed in the following section. Simulation boxes at r/a = 0.4 were larger than at other radial locations due to the nature of the local turbulence and low magnetic shear. At this radial location 768 radial modes and 32 toroidal modes were used to simulate box sizes
$k_\theta \rho _s$
are capable of capturing KBM, microtearing mode (MTM), ITG mode and trapped electron mode (TEM) contributions. High-k TEM/electron temperature gradient (ETG) contributions are not captured but are not believed to play an important role as discussed in the following section. Simulation boxes at r/a = 0.4 were larger than at other radial locations due to the nature of the local turbulence and low magnetic shear. At this radial location 768 radial modes and 32 toroidal modes were used to simulate box sizes $[L_x, L_y ] \sim [400,160]\rho _s$
. Due to the extreme uncertainty associated with prediction of intrinsic rotation profiles, the rotation in all simulations was set to 0. Since it is generally found that finite rotation has favourable effects on the stabilisation of turbulence, this should be viewed as a conservative assumption – but it also may play an important role in future studies of impurity transport and peaking. Recent investigation into the impact of projected intrinsic rotation on SPARC turbulence (Howard et al. Reference Howard, Rodriguez-Fernandez, Holland, Rice, Greenwald, Candy and Sciortino2021) found very little impact, but more complete investigations of impact in ARC will be the subject of future work. Fast ions were not included in this analysis, despite the fact that they will be present with significant populations in a high-gain device such as ARC. Studies focused on fast-ion interactions with turbulence are a cutting-edge area of research (Di Siena et al. Reference Di Siena2025; Ruiz Ruiz et al. Reference Ruiz Ruiz2025) which is too computationally demanding for this publication but will be the subject of future work dedicated to this subject. Each simulated flux was determined from an approximately 500
$[L_x, L_y ] \sim [400,160]\rho _s$
. Due to the extreme uncertainty associated with prediction of intrinsic rotation profiles, the rotation in all simulations was set to 0. Since it is generally found that finite rotation has favourable effects on the stabilisation of turbulence, this should be viewed as a conservative assumption – but it also may play an important role in future studies of impurity transport and peaking. Recent investigation into the impact of projected intrinsic rotation on SPARC turbulence (Howard et al. Reference Howard, Rodriguez-Fernandez, Holland, Rice, Greenwald, Candy and Sciortino2021) found very little impact, but more complete investigations of impact in ARC will be the subject of future work. Fast ions were not included in this analysis, despite the fact that they will be present with significant populations in a high-gain device such as ARC. Studies focused on fast-ion interactions with turbulence are a cutting-edge area of research (Di Siena et al. Reference Di Siena2025; Ruiz Ruiz et al. Reference Ruiz Ruiz2025) which is too computationally demanding for this publication but will be the subject of future work dedicated to this subject. Each simulated flux was determined from an approximately 500 $a/c_s$
time average spanning a steady portion of the simulation with typical assessed errors on these fluxes being
$a/c_s$
time average spanning a steady portion of the simulation with typical assessed errors on these fluxes being $1\sigma \sim 10$
%.
$1\sigma \sim 10$
%.
The simulation set-up described above is capable of capturing low-k turbulence but does not include any impact of contributions from intermediate- or high-k TEM or ETG. The ion-dominated power flows and the associated ion-to-electron-flux ratios ( $Q_i/Q_e$
) described in § 3 (figure 3) suggest that this is likely an accurate approximation. Based on the so-called transport ‘fingerprints’ paradigm proposed by Kotschenreuther and colleagues (Kotschenreuther et al. Reference Kotschenreuther2019), the heat flux ratios suggest that ITG or KBM will play the dominant role in setting transport in the ARC conditions. As we discuss later in the section, this conclusion appears to be consistent with linear and nonlinear turbulence analysis. However, the use of low-k nonlinear simulations, lack of rotation and fast-ion modelling are approximations which, if relaxed in future work, could lead to differences in the performance projections.
$Q_i/Q_e$
) described in § 3 (figure 3) suggest that this is likely an accurate approximation. Based on the so-called transport ‘fingerprints’ paradigm proposed by Kotschenreuther and colleagues (Kotschenreuther et al. Reference Kotschenreuther2019), the heat flux ratios suggest that ITG or KBM will play the dominant role in setting transport in the ARC conditions. As we discuss later in the section, this conclusion appears to be consistent with linear and nonlinear turbulence analysis. However, the use of low-k nonlinear simulations, lack of rotation and fast-ion modelling are approximations which, if relaxed in future work, could lead to differences in the performance projections.
4.2. Projected ARC performance
The high-fidelity predictions of the ARC design point are plotted in figure 7. A total of 10 iterations (50 nonlinear gyrokinetic simulations: 10 iterations $\times$
5 radial locations) were required to reach convergence of the steady-state predictions. The resulting
$\times$
5 radial locations) were required to reach convergence of the steady-state predictions. The resulting $T_e$
,
$T_e$
, $T_i$
and
$T_i$
and $n_e$
profiles are plotted in figure 7(a–c) with the corresponding gradient-scale lengths for each profile plotted in figure 7(d–f). As shown in this figure the initial profiles (blue) are reasonably close to the final gyrokinetic-predicted profiles (green), suggesting reasonable agreement between predictions with TGLF SAT2 and CGYRO. However, it is important to note that fluxes from the initial profiles (TGLF SAT2) are markedly poorly matched to targets (see figure 8), making the similarity of the final results likely mostly arising from stiff transport. Despite apparent similarity, the changes in profile shapes do lead to significant changes in the overall performance. All profiles (
$n_e$
profiles are plotted in figure 7(a–c) with the corresponding gradient-scale lengths for each profile plotted in figure 7(d–f). As shown in this figure the initial profiles (blue) are reasonably close to the final gyrokinetic-predicted profiles (green), suggesting reasonable agreement between predictions with TGLF SAT2 and CGYRO. However, it is important to note that fluxes from the initial profiles (TGLF SAT2) are markedly poorly matched to targets (see figure 8), making the similarity of the final results likely mostly arising from stiff transport. Despite apparent similarity, the changes in profile shapes do lead to significant changes in the overall performance. All profiles ( $T_e$
,
$T_e$
, $T_i$
and
$T_i$
and $n_e$
) predicted by CGYRO are lower than those predicted by the TGLF modelling with gradient-scale lengths of the ion and electron temperature significantly lower (
$n_e$
) predicted by CGYRO are lower than those predicted by the TGLF modelling with gradient-scale lengths of the ion and electron temperature significantly lower ( ${\sim} 1.5)$
outside of mid-radius, and only slightly higher at the innermost radial location (r/a = 0.4). Consistent with previous work (Howard et al. Reference Howard2024b
), the density profile demonstrates the largest differences when compared with TGLF SAT2. Smaller values of density gradient-scale length are predicted across the radius. To remind the reader, we note that ARC is source-free (no pellet fuelling or neutral beam injection heating) and therefore the flux-matched density profiles are those required to match a null particle flux condition (
${\sim} 1.5)$
outside of mid-radius, and only slightly higher at the innermost radial location (r/a = 0.4). Consistent with previous work (Howard et al. Reference Howard2024b
), the density profile demonstrates the largest differences when compared with TGLF SAT2. Smaller values of density gradient-scale length are predicted across the radius. To remind the reader, we note that ARC is source-free (no pellet fuelling or neutral beam injection heating) and therefore the flux-matched density profiles are those required to match a null particle flux condition ( $\varGamma _e = 0.0$
). Interestingly, the ARC predicted density profile is slightly hollow in the deep core resulting in significantly reduced density peaking and fusion power generation near axis. Recall that the predictions near axis (inside r/a = 0.4) are the result of assuming a linear transition of normalised scale lengths to zero on axis and therefore should be viewed as being less certain. However, the small volume in this near-axis region means that its impact on performance is not critical for the overall predictions. As is discussed in the next section, this hollow profile likely results from the presence of unstable KBM in the low-magnetic-shear region of the plasma. Although TGLF SAT2 was generated using results from nonlinear CGYRO simulations, figure 8 clearly shows differences in the predicted fluxes. Such disagreement, however, is perhaps not surprising, as the SAT2 saturation rule was developed from a relatively small dataset of simulations (64) (Staebler et al. Reference Staebler, Candy, Belli, Kinsey, Bonanomi and Patel2020) and the plasma conditions in ARC and other burning plasmas are generally found to be very stiff. As a result, small differences in predicted gradients can lead to large differences in the predicted fluxes and potentially complicating accurate prediction of profiles.
$\varGamma _e = 0.0$
). Interestingly, the ARC predicted density profile is slightly hollow in the deep core resulting in significantly reduced density peaking and fusion power generation near axis. Recall that the predictions near axis (inside r/a = 0.4) are the result of assuming a linear transition of normalised scale lengths to zero on axis and therefore should be viewed as being less certain. However, the small volume in this near-axis region means that its impact on performance is not critical for the overall predictions. As is discussed in the next section, this hollow profile likely results from the presence of unstable KBM in the low-magnetic-shear region of the plasma. Although TGLF SAT2 was generated using results from nonlinear CGYRO simulations, figure 8 clearly shows differences in the predicted fluxes. Such disagreement, however, is perhaps not surprising, as the SAT2 saturation rule was developed from a relatively small dataset of simulations (64) (Staebler et al. Reference Staebler, Candy, Belli, Kinsey, Bonanomi and Patel2020) and the plasma conditions in ARC and other burning plasmas are generally found to be very stiff. As a result, small differences in predicted gradients can lead to large differences in the predicted fluxes and potentially complicating accurate prediction of profiles.
The initial TRANSP–PORTALS (TGLF SAT2) profiles (blue) are compared with the converged CGYRO profiles (green) for $T_e$
,
$T_e$
, $T_i$
,
$T_i$
, $n_e$
(a–c) and the normalised gradient-scale lengths
$n_e$
(a–c) and the normalised gradient-scale lengths $a/L_{T_e}$
,
$a/L_{T_e}$
, $a/L_{T_i}$
,
$a/L_{T_i}$
, $a/L_{n_e}$
(d–f).
$a/L_{n_e}$
(d–f).

The heat and particle fluxes from the initial (blue) and final (green) profiles are plotted with estimated 2 $\sigma$
error bars indicated.
$\sigma$
error bars indicated.

The predicted lower values of $a/L_{T_i}$
and
$a/L_{T_i}$
and $a/L_n$
and the resulting
$a/L_n$
and the resulting $T_i$
and
$T_i$
and $n_e$
profiles lead to significantly lower performance in these conditions. While predictions from medium-fidelity modelling were typically found to exhibit a wide range of performance of
$n_e$
profiles lead to significantly lower performance in these conditions. While predictions from medium-fidelity modelling were typically found to exhibit a wide range of performance of $P_{fus} = [878 {-} 1295]$
MW for these conditions, less peaked profiles with smaller volume averages result in a predicted fusion power that falls well short of the POPCON operational point, exhibiting
$P_{fus} = [878 {-} 1295]$
MW for these conditions, less peaked profiles with smaller volume averages result in a predicted fusion power that falls well short of the POPCON operational point, exhibiting $P_{fus} =677$
MW with Q = 29.9. The drop in the core profiles also results in a significantly lower predicted value of
$P_{fus} =677$
MW with Q = 29.9. The drop in the core profiles also results in a significantly lower predicted value of $H_{98,y2}$
, energy confinement time and temperature and density peaking factors (see table 1). The calculated
$H_{98,y2}$
, energy confinement time and temperature and density peaking factors (see table 1). The calculated $H_{98,y2}$
for this condition is 0.87 making it lower than most data in the database (Verdoolaege et al. Reference Verdoolaege, Kaye, Angioni, Kardaun, Maslov, Romanelli, Ryter, Thomsen and ASDEX2021) while the density peaking factor falls far below the anticipated Angioni value with CGYRO predicting a density peaking
$H_{98,y2}$
for this condition is 0.87 making it lower than most data in the database (Verdoolaege et al. Reference Verdoolaege, Kaye, Angioni, Kardaun, Maslov, Romanelli, Ryter, Thomsen and ASDEX2021) while the density peaking factor falls far below the anticipated Angioni value with CGYRO predicting a density peaking $n_e(\varPsi = 0.2)/\langle n_e\rangle = 1.18$
compared with an anticipated value of 1.52 obtained from the empirical scaling. The lower density peaking has in recent work been shown to be a consequence of gyro-Bohm transport scaling, the dependence of ITG on collisions and finite-beta effects. It is notable that even the medium-fidelity modelling predicts density peaking values below empirical scalings (table 1), consistent with previous medium-fidelity investigations into projected EU-DEMO conditions (Fable et al. Reference Fable2019). However, the high-fidelity results display even more reduced peaking and thus result in lower performance. Regardless of the modelling performed, this work suggests that ARC (and likely other projected FPPs) should expect to exhibit significantly lower density peaking than empirical scalings. However, despite the lower than desired performance, ARC still exhibits impressive energy confinement, with
$n_e(\varPsi = 0.2)/\langle n_e\rangle = 1.18$
compared with an anticipated value of 1.52 obtained from the empirical scaling. The lower density peaking has in recent work been shown to be a consequence of gyro-Bohm transport scaling, the dependence of ITG on collisions and finite-beta effects. It is notable that even the medium-fidelity modelling predicts density peaking values below empirical scalings (table 1), consistent with previous medium-fidelity investigations into projected EU-DEMO conditions (Fable et al. Reference Fable2019). However, the high-fidelity results display even more reduced peaking and thus result in lower performance. Regardless of the modelling performed, this work suggests that ARC (and likely other projected FPPs) should expect to exhibit significantly lower density peaking than empirical scalings. However, despite the lower than desired performance, ARC still exhibits impressive energy confinement, with $\tau _e$
of 1.26 s, and operates with a plasma gain (
$\tau _e$
of 1.26 s, and operates with a plasma gain ( $Q_{plasma}$
) of approximately 30. For additional comparison between the medium- and high-fidelity modelling the reader is referred to table 1. For the CGYRO case, some further optimisation of performance is likely needed to maintain the desired fusion energy and power flow through the SOL consistent with robust H-mode operation. We note that the density profile flattening predicted by CGYRO results in an average density below the design value corresponding to
$Q_{plasma}$
) of approximately 30. For additional comparison between the medium- and high-fidelity modelling the reader is referred to table 1. For the CGYRO case, some further optimisation of performance is likely needed to maintain the desired fusion energy and power flow through the SOL consistent with robust H-mode operation. We note that the density profile flattening predicted by CGYRO results in an average density below the design value corresponding to $f_{GW}=0.9$
. Increasing the pedestal density to reach
$f_{GW}=0.9$
. Increasing the pedestal density to reach $f_{GW}=0.9$
will increase the predicted pedestal pressure (see figure 2
c), and is expected to significantly increase predicted fusion power and Q. Furthermore, the strong sensitivity of predicted performance to pedestal pressure indicates that performance may be recovered from pedestal optimisation via minor modifications to shape, aspect ratio and/or
$f_{GW}=0.9$
will increase the predicted pedestal pressure (see figure 2
c), and is expected to significantly increase predicted fusion power and Q. Furthermore, the strong sensitivity of predicted performance to pedestal pressure indicates that performance may be recovered from pedestal optimisation via minor modifications to shape, aspect ratio and/or $q$
. A comprehensive optimisation of the coupled core–pedestal system is planned for future work. Sensitivity to pedestal conditions is further studied in the following section.
$q$
. A comprehensive optimisation of the coupled core–pedestal system is planned for future work. Sensitivity to pedestal conditions is further studied in the following section.
4.3. CGYRO sensitivity analysis
The significant sensitivity that was found of performance results to the pedestal top pressure (figure 6
a) and the relatively limited ability to accurately predict pedestal performance in new machines motivated additional CGYRO profile predictions. Through modification of the assumed pedestal top temperatures, the assumed pedestal pressure was varied $\pm 20$
% and the profiles of
$\pm 20$
% and the profiles of $n_e$
,
$n_e$
, $T_e$
and
$T_e$
and $T_i$
were predicted in the same manner as described above. Utilising the existing surrogates allowed for rapid convergence of the profile predictions requiring only nine additional iterations to predict the two new conditions. Consistent with the analysis in § 3, the range of scanned pressure is meant to probe known uncertainties in the EPED model when compared with experiment, and can be viewed as a proxy for assessing the potential benefit of shape and aspect ratio optimisation to increase EPED-predicted pedestal height. The results plotted in figure 9 are largely in line with those from medium-fidelity modelling. Fusion performance ranging from 422 to 960 MW is attainable within these reasonable bounds for the pedestal top pressure with density peaking trending as expected, with higher performance (lower effective collisionality) being slightly more peaked than lower-performing conditions. However, the largest gains are found not in the changes to the predicted density, but instead in the increase in ion temperature resulting largely from raising the boundary conditions with otherwise self-similar profile shapes due to strong ITG transport and associated stiff transport. Interestingly, the 20 % increase in pedestal pressure moves the projected
$T_i$
were predicted in the same manner as described above. Utilising the existing surrogates allowed for rapid convergence of the profile predictions requiring only nine additional iterations to predict the two new conditions. Consistent with the analysis in § 3, the range of scanned pressure is meant to probe known uncertainties in the EPED model when compared with experiment, and can be viewed as a proxy for assessing the potential benefit of shape and aspect ratio optimisation to increase EPED-predicted pedestal height. The results plotted in figure 9 are largely in line with those from medium-fidelity modelling. Fusion performance ranging from 422 to 960 MW is attainable within these reasonable bounds for the pedestal top pressure with density peaking trending as expected, with higher performance (lower effective collisionality) being slightly more peaked than lower-performing conditions. However, the largest gains are found not in the changes to the predicted density, but instead in the increase in ion temperature resulting largely from raising the boundary conditions with otherwise self-similar profile shapes due to strong ITG transport and associated stiff transport. Interestingly, the 20 % increase in pedestal pressure moves the projected $H_{98,y2}$
from 0.87 (in the reference) to 0.95, improving agreement with empirical scalings and raising the total power flow through the edge to 14 % above the L to H threshold. These results suggest that, even with high-fidelity modelling, a
$H_{98,y2}$
from 0.87 (in the reference) to 0.95, improving agreement with empirical scalings and raising the total power flow through the edge to 14 % above the L to H threshold. These results suggest that, even with high-fidelity modelling, a $\gt 500$
MW range of fusion performance may be obtained around the ARC operational point, dependent strongly on the observed pedestal performance.
$\gt 500$
MW range of fusion performance may be obtained around the ARC operational point, dependent strongly on the observed pedestal performance.
The CGYRO-predicted $n_e$
,
$n_e$
, $T_e$
and
$T_e$
and $T_i$
profiles obtained for
$T_i$
profiles obtained for $\pm 20$
% changes in the pedestal pressure are plotted along with the associated fusion power and density peaking.
$\pm 20$
% changes in the pedestal pressure are plotted along with the associated fusion power and density peaking.

4.4. Turbulence and transport in ARC
The profiles predicted via CGYRO + NEO modelling provide insight into the performance that may be achieved in the ARC device. However, additional analysis is required to better understand the nature of the turbulence in this condition. Such investigations are of academic interest, but also are required to understand the necessary physics that must be retained for accurate simulation of ARC and similar tokamak-based FPPs. These results can also provide meaningful targets for investigations on current experiments and SPARC that will enable more relevant validation of existing and emerging transport models. CGYRO was used to perform linear stability analysis at three radial locations, r/a = 0.4, 0.75 and 0.9, to provide a look into the linear instabilities and their radial variation in the base ARC conditions predicted by CGYRO. The results of this analysis are plotted in figure 10.
The linear growth rates ( $\gamma$
) and real frequency (
$\gamma$
) and real frequency ( $\omega$
) of the most unstable linear modes at r/a = 0.4 (green), 0.75 (blue) and 0.9 (red) are plotted versus
$\omega$
) of the most unstable linear modes at r/a = 0.4 (green), 0.75 (blue) and 0.9 (red) are plotted versus $k_\theta \rho _s$
for ion and electron scales.
$k_\theta \rho _s$
for ion and electron scales.

At long wavelengths ( $k_\theta \rho _s \lt 1.0$
) turbulent modes rotating in the ion diamagnetic drift direction that are sensitive to changes in
$k_\theta \rho _s \lt 1.0$
) turbulent modes rotating in the ion diamagnetic drift direction that are sensitive to changes in $a/L_{T_i}$
are found to dominate at all radial locations. Outside of r/a = 0.4, these modes are identified as ITG modes, a conclusion that is largely consistent with the observed heat flux ratios (
$a/L_{T_i}$
are found to dominate at all radial locations. Outside of r/a = 0.4, these modes are identified as ITG modes, a conclusion that is largely consistent with the observed heat flux ratios ( $Q_i/Q_e$
) and transport ‘fingerprints’ arguments (Kotschenreuther et al. Reference Kotschenreuther2019). However, the many low-k modes at r/a = 0.4 take on a more electromagnetic character and are identified as KBM, destabilised by the low magnetic shear (
$Q_i/Q_e$
) and transport ‘fingerprints’ arguments (Kotschenreuther et al. Reference Kotschenreuther2019). However, the many low-k modes at r/a = 0.4 take on a more electromagnetic character and are identified as KBM, destabilised by the low magnetic shear ( $\hat {s}$
= 0.062), relatively high pressure gradients and moderate values of electron beta (
$\hat {s}$
= 0.062), relatively high pressure gradients and moderate values of electron beta ( $\beta _e=0.81$
%) at the radial location. This observation is consistent with the non-negligible electron heat flux driven in the nonlinear simulations, where at r/a = 0.4 approximately 30 % of the total electron heat flux arises from
$\beta _e=0.81$
%) at the radial location. This observation is consistent with the non-negligible electron heat flux driven in the nonlinear simulations, where at r/a = 0.4 approximately 30 % of the total electron heat flux arises from $A_{||}$
contributions. This is in contrast to all other radial locations, where the heat and particle fluxes are almost completely electrostatic. All radial locations exhibit modes propagating in the electron direction at the largest scales (
$A_{||}$
contributions. This is in contrast to all other radial locations, where the heat and particle fluxes are almost completely electrostatic. All radial locations exhibit modes propagating in the electron direction at the largest scales ( $k_\theta \rho _s \lt 0.1$
). These modes exhibit tearing parity (odd
$k_\theta \rho _s \lt 0.1$
). These modes exhibit tearing parity (odd $\delta \phi$
, even
$\delta \phi$
, even $\delta A_{||}$
) and are identified as MTM. Despite their presence as unstable linear modes, their overall impact on the saturated turbulence state appears to generally be minimal in the nonlinear simulation at most radial locations, consistent with previous observations from ASDEX-upgrade conditions where both ITG and MTM coexisted (Doerk et al. Reference Doerk, Dunne, Jenko, Ryter, Schneider and Wolfrum2015). At
$\delta A_{||}$
) and are identified as MTM. Despite their presence as unstable linear modes, their overall impact on the saturated turbulence state appears to generally be minimal in the nonlinear simulation at most radial locations, consistent with previous observations from ASDEX-upgrade conditions where both ITG and MTM coexisted (Doerk et al. Reference Doerk, Dunne, Jenko, Ryter, Schneider and Wolfrum2015). At $k_\theta \rho _s \gt 1.0$
, intermediate- and high-k modes associated with TEM and ETG turbulence are unstable at all radial locations r/a = 0.4, 0.75 and 0.9. However, their presence does not imply the need for simulations spanning both ion and electron scales. Applying existing rules of thumb regarding the importance of high-k TEM/ETG turbulence in the presence of unstable low-k turbulence from both Howard et al. (Reference Howard, Holland, White, Greenwald, Candy and Creely2016) and Creely et al. (Reference Creely, Rodriguez-Fernandez, Conway, Freethy, Howard and and2019), we conclude that the impact of high k is likely negligible. Both the ratio of high-k to low-k
$k_\theta \rho _s \gt 1.0$
, intermediate- and high-k modes associated with TEM and ETG turbulence are unstable at all radial locations r/a = 0.4, 0.75 and 0.9. However, their presence does not imply the need for simulations spanning both ion and electron scales. Applying existing rules of thumb regarding the importance of high-k TEM/ETG turbulence in the presence of unstable low-k turbulence from both Howard et al. (Reference Howard, Holland, White, Greenwald, Candy and Creely2016) and Creely et al. (Reference Creely, Rodriguez-Fernandez, Conway, Freethy, Howard and and2019), we conclude that the impact of high k is likely negligible. Both the ratio of high-k to low-k $(\max(\gamma _{high\text{-}k})/\max(\gamma _{low\text{-}k})$
growth rates and the comparison of low- and high-k growth rates when normalised to the
$(\max(\gamma _{high\text{-}k})/\max(\gamma _{low\text{-}k})$
growth rates and the comparison of low- and high-k growth rates when normalised to the $k_\theta \rho _s$
suggest the impact of multi-scale turbulence is likely small and is similar to conclusions for FPP-relevant predictions in recent works (Howard et al. Reference Howard, Rodriguez-Fernandez, Holland, Rice, Greenwald, Candy and Sciortino2021; Rodriguez-Fernandez et al. Reference Rodriguez-Fernandez, Howard and Candy2022; Holland et al. Reference Holland, Bass, Orlov, McClenaghan, Lyons, Grierson, Jian, Howard and Rodriguez-Fernandez2023; Howard et al. Reference Howard, Rodriguez-Fernandez, Holland and Candy2024a
).
$k_\theta \rho _s$
suggest the impact of multi-scale turbulence is likely small and is similar to conclusions for FPP-relevant predictions in recent works (Howard et al. Reference Howard, Rodriguez-Fernandez, Holland, Rice, Greenwald, Candy and Sciortino2021; Rodriguez-Fernandez et al. Reference Rodriguez-Fernandez, Howard and Candy2022; Holland et al. Reference Holland, Bass, Orlov, McClenaghan, Lyons, Grierson, Jian, Howard and Rodriguez-Fernandez2023; Howard et al. Reference Howard, Rodriguez-Fernandez, Holland and Candy2024a
).
This analysis provides insight into the linearly unstable modes in ARC but does not provide any knowledge of what exists in the turbulent state which is responsible for heat and particle losses. In this work, we have taken advantage of the unique features of the surrogate modelling to examine the sensitivities of the nonlinear gyrokinetic simulation fluxes ( $Q_i$
,
$Q_i$
, $Q_e$
,
$Q_e$
, $\varGamma _e$
) to changes in turbulence drive terms,
$\varGamma _e$
) to changes in turbulence drive terms, $a/L_{T_i}$
,
$a/L_{T_i}$
, $a/L_{T_e}$
and
$a/L_{T_e}$
and $a/L_{n}$
. This analysis essentially amounts to a scan of the relevant drives for the plasma turbulence and can provide more direct insight into the type of turbulence in these conditions. However, instead of using dedicated single-parameter scans, this information in obtained from the nonlinear flux surrogate model and can be rapidly evaluated following a profile prediction. Figure 11 plots the surrogate of the nonlinear gyrokinetic simulations at three radial locations: r/a = 0.4, 0.75 and 0.9. It should be noted that most of the profile variations in the surrogate training set exist within a narrow range of the flux-matched condition (
$a/L_{n}$
. This analysis essentially amounts to a scan of the relevant drives for the plasma turbulence and can provide more direct insight into the type of turbulence in these conditions. However, instead of using dedicated single-parameter scans, this information in obtained from the nonlinear flux surrogate model and can be rapidly evaluated following a profile prediction. Figure 11 plots the surrogate of the nonlinear gyrokinetic simulations at three radial locations: r/a = 0.4, 0.75 and 0.9. It should be noted that most of the profile variations in the surrogate training set exist within a narrow range of the flux-matched condition ( ${\sim} \pm 20$
%). Therefore, evaluations of the fluxes outside this range are likely significant extrapolations and can lead to non-physical fluxes (such as negative values for heat fluxes). However, interpreting the results of this analysis to the region with significant training data (indicated by small error bars) yields useful insight into the response of the fluxes to changes in the turbulence drives.
${\sim} \pm 20$
%). Therefore, evaluations of the fluxes outside this range are likely significant extrapolations and can lead to non-physical fluxes (such as negative values for heat fluxes). However, interpreting the results of this analysis to the region with significant training data (indicated by small error bars) yields useful insight into the response of the fluxes to changes in the turbulence drives.
The nonlinear gyrokinetic surrogates are plotted around the converged PORTALS–CGYRO simulation for $Q_i$
,
$Q_i$
, $Q_e$
and
$Q_e$
and $\varGamma _e$
at r/a = 0.4 (a–c), 0.75 (d–f) and 0.9 (g–i) for scans of primary drive terms
$\varGamma _e$
at r/a = 0.4 (a–c), 0.75 (d–f) and 0.9 (g–i) for scans of primary drive terms $a/L_{T_i}$
(orange),
$a/L_{T_i}$
(orange), $a/L_{T_e}$
(blue) and
$a/L_{T_e}$
(blue) and $a/L_{n}$
(green).
$a/L_{n}$
(green).

All radial locations simulated indicate that the ion heat flux is most sensitive to changes in $a/L_{T_i}$
, consistent with the linear stability analysis presented in figure 10. This conclusion is consistent with the presence of ITG-dominated turbulence and with recent simulations of ITER and FPP-relevant fusion devices (Rodriguez-Fernandez et al. Reference Rodriguez-Fernandez, Howard and Candy2022; Holland et al. Reference Holland, Bass, Orlov, McClenaghan, Lyons, Grierson, Jian, Howard and Rodriguez-Fernandez2023; Howard et al. Reference Howard, Rodriguez-Fernandez, Holland and Candy2024a
). Interestingly, the electron heat fluxes from the surrogates display a dominant dependence on
$a/L_{T_i}$
, consistent with the linear stability analysis presented in figure 10. This conclusion is consistent with the presence of ITG-dominated turbulence and with recent simulations of ITER and FPP-relevant fusion devices (Rodriguez-Fernandez et al. Reference Rodriguez-Fernandez, Howard and Candy2022; Holland et al. Reference Holland, Bass, Orlov, McClenaghan, Lyons, Grierson, Jian, Howard and Rodriguez-Fernandez2023; Howard et al. Reference Howard, Rodriguez-Fernandez, Holland and Candy2024a
). Interestingly, the electron heat fluxes from the surrogates display a dominant dependence on $a/L_{T_e}$
. Such a dependence would generally be attributed to
$a/L_{T_e}$
. Such a dependence would generally be attributed to $\boldsymbol{\nabla }T$
-driven TEM turbulence, but this conclusion is inconsistent with the linear stability in figure 10, the nature of turbulence implied by the heat flux ratios in this plasma, and is in striking contrast to recent ITER results (Howard et al. Reference Howard2024b
). To understand this dependence, a dedicated scan of
$\boldsymbol{\nabla }T$
-driven TEM turbulence, but this conclusion is inconsistent with the linear stability in figure 10, the nature of turbulence implied by the heat flux ratios in this plasma, and is in striking contrast to recent ITER results (Howard et al. Reference Howard2024b
). To understand this dependence, a dedicated scan of $a/L_{T_e}$
was performed around the flux-matched conditions (
$a/L_{T_e}$
was performed around the flux-matched conditions ( $\pm 10)$
% which indicates a much weaker dependence on the TEM drive. In fact, the apparent strong dependence of
$\pm 10)$
% which indicates a much weaker dependence on the TEM drive. In fact, the apparent strong dependence of $a/L_{T_e}$
results from the extremely tight coupling of
$a/L_{T_e}$
results from the extremely tight coupling of $a/L_{T_e}$
and
$a/L_{T_e}$
and $a/L_{T_i}$
during the profile prediction convergence. The strong collisional coupling and inter-dependence of the transport lead to a very strong correlation between the variations of
$a/L_{T_i}$
during the profile prediction convergence. The strong collisional coupling and inter-dependence of the transport lead to a very strong correlation between the variations of $a/L_{T_i}$
and
$a/L_{T_i}$
and $a/L_{T_e}$
during the training of the surrogate models in these PORTALS simulations. As a result, the surrogate model is most likely unable to distinguish between the dependence on the two parameters particularly given the extremely small training database (10 transport simulations per radial location) that was required to achieve convergence. This is highlighted here to demonstrate a potential weakness of reliance completely on surrogates for interpretation of turbulence characteristics. Particle fluxes (figure 11
c, f, i) predicted by the surrogates display a positive dependence on the value of the normalised density gradient-scale length,
$a/L_{T_e}$
during the training of the surrogate models in these PORTALS simulations. As a result, the surrogate model is most likely unable to distinguish between the dependence on the two parameters particularly given the extremely small training database (10 transport simulations per radial location) that was required to achieve convergence. This is highlighted here to demonstrate a potential weakness of reliance completely on surrogates for interpretation of turbulence characteristics. Particle fluxes (figure 11
c, f, i) predicted by the surrogates display a positive dependence on the value of the normalised density gradient-scale length, $a/L_{n}$
, which is consistent with diffusive particle transport. Somewhat more complicated dependencies on
$a/L_{n}$
, which is consistent with diffusive particle transport. Somewhat more complicated dependencies on $a/L_{T_i}$
and
$a/L_{T_i}$
and $a/L_{T_e}$
exist at r/a = 0.4 and 0.9. However, the surrogates at these locations are only accurate very close to the flux-matched point, as indicated by the extremely large uncertainties when moving away from this matched point. The conclusion of this work is that the nonlinear results are generally consistent with those found linearly. The ITG turbulence plays a dominant role across most of the plasma profile with some impact of electromagnetic modes (KBM) at the innermost radial locations. These results provide some unique insights into the type of turbulence that should be studied in current and planned devices, to help improve future predictions of ARC operation and highlight that ARC turbulence is similar to that which has been extensively studied and modelled in many existing fusion devices.
$a/L_{T_e}$
exist at r/a = 0.4 and 0.9. However, the surrogates at these locations are only accurate very close to the flux-matched point, as indicated by the extremely large uncertainties when moving away from this matched point. The conclusion of this work is that the nonlinear results are generally consistent with those found linearly. The ITG turbulence plays a dominant role across most of the plasma profile with some impact of electromagnetic modes (KBM) at the innermost radial locations. These results provide some unique insights into the type of turbulence that should be studied in current and planned devices, to help improve future predictions of ARC operation and highlight that ARC turbulence is similar to that which has been extensively studied and modelled in many existing fusion devices.
5. Conclusions and discussion
This paper outlined the performance and transport predicted for the ARC V3A design point. Modelling using POPCON, performed with conservative assumptions on confinement ( $H_{98,y2} = 0.9$
) and a more realistic parametrisation (than a parabolic profile assumption) for background profiles, was used to determine the initial design point: a plasma operated with
$H_{98,y2} = 0.9$
) and a more realistic parametrisation (than a parabolic profile assumption) for background profiles, was used to determine the initial design point: a plasma operated with $\langle n_e\rangle = 2.44\times 10^{20}$
m
$\langle n_e\rangle = 2.44\times 10^{20}$
m $^{-3}$
and
$^{-3}$
and $\langle T\rangle = 11.4$
keV is projected to produce 1.133 GW of fusion power with an anticipated
$\langle T\rangle = 11.4$
keV is projected to produce 1.133 GW of fusion power with an anticipated ${\sim} 400\,\text{MW}$
of electrical production. This design point was studied using a wide range of integrated modelling tools. Initial predictions of the performance from 1.5-dimensional modelling were provided via a new coupled TRANSP–PORTALS framework, with results from this workflow serving as the starting point for additional analysis. Predicted fusion power from the TRANSP–PORTALS workflow was found to be in good agreement with modelling using ASTRA (879 versus 895 MW) with TORAX, predicting significantly higher performance (1295 MW) due to increased density and temperature peaking. These results are in reasonably good agreement with the 0-D POPCON modelling, generally falling within
${\sim} 400\,\text{MW}$
of electrical production. This design point was studied using a wide range of integrated modelling tools. Initial predictions of the performance from 1.5-dimensional modelling were provided via a new coupled TRANSP–PORTALS framework, with results from this workflow serving as the starting point for additional analysis. Predicted fusion power from the TRANSP–PORTALS workflow was found to be in good agreement with modelling using ASTRA (879 versus 895 MW) with TORAX, predicting significantly higher performance (1295 MW) due to increased density and temperature peaking. These results are in reasonably good agreement with the 0-D POPCON modelling, generally falling within $\pm 20$
% of the POPCON result. However, performance results are extremely sensitive to input assumptions. Values of
$\pm 20$
% of the POPCON result. However, performance results are extremely sensitive to input assumptions. Values of $P_{ped}$
,
$P_{ped}$
, $T_i/T_e$
at
$T_i/T_e$
at $(r/a=0.9)$
,
$(r/a=0.9)$
, $n_W/n_e$
and
$n_W/n_e$
and $n_{sep}/n_{ped}$
were scanned around their nominal assumptions to investigate the sensitivity of the results to known, uncertain inputs. Unsurprisingly, the assumed pedestal top pressure represents a significant lever on fusion performance, producing a range of fusion powers from 565 to 1240 MW of fusion with only a
$n_{sep}/n_{ped}$
were scanned around their nominal assumptions to investigate the sensitivity of the results to known, uncertain inputs. Unsurprisingly, the assumed pedestal top pressure represents a significant lever on fusion performance, producing a range of fusion powers from 565 to 1240 MW of fusion with only a $\pm 20$
% variation around the EPED-predicted pedestal pressure. This indicates that a strong performance benefit can be gained by further optimisation of the coupled core–pedestal system, for example via small modifications of the shape and aspect ratio. A similarly large variation (
$\pm 20$
% variation around the EPED-predicted pedestal pressure. This indicates that a strong performance benefit can be gained by further optimisation of the coupled core–pedestal system, for example via small modifications of the shape and aspect ratio. A similarly large variation ( ${\gt} 400$
MW) in ARC performance can result from changes of only
${\gt} 400$
MW) in ARC performance can result from changes of only $\pm 10$
% in the assumed pedestal top
$\pm 10$
% in the assumed pedestal top $T_i/T_e$
ratio, which is a consequence of an ITG-dominated plasma core and stiff transport in high-performance conditions. Analysis was also performed with nonlinear gyrokinetic profile predictions using the PORTALS framework. This work predicted the profiles of
$T_i/T_e$
ratio, which is a consequence of an ITG-dominated plasma core and stiff transport in high-performance conditions. Analysis was also performed with nonlinear gyrokinetic profile predictions using the PORTALS framework. This work predicted the profiles of $T_e$
,
$T_e$
, $T_i$
and
$T_i$
and $n_e$
from r/a = 0.9 to the axis utilising a combination of nonlinear CGYRO and NEO simulations. Performance predictions from these high-fidelity investigations fell significantly below the medium-fidelity results. Predictions of profile peaking, in both the temperature and, more dramatically, the electron density, differ substantially from both the medium-fidelity modelling and the POPCON assumptions. These differences lead to much reduced overall fusion power predictions with values of only 677 MW predicted for the nominal operational point. However, it was also shown that with this high-fidelity modelling, even
$n_e$
from r/a = 0.9 to the axis utilising a combination of nonlinear CGYRO and NEO simulations. Performance predictions from these high-fidelity investigations fell significantly below the medium-fidelity results. Predictions of profile peaking, in both the temperature and, more dramatically, the electron density, differ substantially from both the medium-fidelity modelling and the POPCON assumptions. These differences lead to much reduced overall fusion power predictions with values of only 677 MW predicted for the nominal operational point. However, it was also shown that with this high-fidelity modelling, even $\pm 20$
% differences in the assumed pedestal pressure can lead to 500 MW differences in fusion power (422–960 MW). Furthermore, the predicted flat density profile results in an average density below the design value of
$\pm 20$
% differences in the assumed pedestal pressure can lead to 500 MW differences in fusion power (422–960 MW). Furthermore, the predicted flat density profile results in an average density below the design value of $f_{GW}=0.9$
, and raising the pedestal density to recover this design value is expected to significantly recover performance. This result underscores the critical need for accurate pedestal modelling, and the substantial benefit of pedestal optimisation, on predicted performance. Turbulence and transport investigations in these plasmas suggest that the core of ARC is generally dominated by ITG turbulence – but has non-negligible contribution from KBM in the low-shear, high-beta region near the core (
$f_{GW}=0.9$
, and raising the pedestal density to recover this design value is expected to significantly recover performance. This result underscores the critical need for accurate pedestal modelling, and the substantial benefit of pedestal optimisation, on predicted performance. Turbulence and transport investigations in these plasmas suggest that the core of ARC is generally dominated by ITG turbulence – but has non-negligible contribution from KBM in the low-shear, high-beta region near the core ( $r/a=0.4$
). However, the stability of the KBM is tightly linked to the q profile and therefore different phases of the sawtooth period may exhibit slightly different characteristics. Further investigations will be the subject of future work and may motivate the use of CGYRO (nonlinear gyrokinetic) profile predictions, along with comprehensive pedestal optimisation employing an updated version of EPED, to optimise performance in future ARC design iterations. These results were largely consistent with previous works concerning FPP-relevant plasma conditions and provide a model for the plasma conditions that should be studied in SPARC to improve ARC projections.
$r/a=0.4$
). However, the stability of the KBM is tightly linked to the q profile and therefore different phases of the sawtooth period may exhibit slightly different characteristics. Further investigations will be the subject of future work and may motivate the use of CGYRO (nonlinear gyrokinetic) profile predictions, along with comprehensive pedestal optimisation employing an updated version of EPED, to optimise performance in future ARC design iterations. These results were largely consistent with previous works concerning FPP-relevant plasma conditions and provide a model for the plasma conditions that should be studied in SPARC to improve ARC projections.
5.1. Sensitivity of results
The sensitivity of the ARC performance predictions to input assumptions was outlined in the proceeding sections, where it was shown that ${\gt}500$
MW changes in predicted fusion can result from reasonable changes in input assumptions. It is expected that similar sensitivities would be found in most FPPs operating with high Q. The is due to the nonlinear dependence of fusion power on changes in density profiles and temperature profiles. However, additional sensitivities exist that warrant some discussion in the context of performance predictions. Much of the modelling in this paper utilised the physics-based model TGLF SAT2, which has been specifically tuned to reproduce a database of nonlinear CGYRO simulations (Staebler et al. Reference Staebler, Candy, Belli, Kinsey, Bonanomi and Patel2020). However, additional proposed saturation rules exist (SAT0 (Staebler et al. Reference Staebler, Kinsey and Waltz2007), SAT1 (Staebler et al. Reference Staebler, Candy, Howard and Holland2016) and SAT3 (Dudding et al. Reference Dudding, Casson, Dickinson, Patel, Roach, Belli and Staebler2022)) and it is worth noting that the choice of saturation rule, choice of electrostatic versus electromagnetic simulation and even small changes in the numerical set-up of these models can result in non-negligible changes in profiles and performance. This is demonstrated in figure 12 which plots predicted performance for a range of TGLF saturation rules (1, 2 and 3) and numerical settings. SAT0 was omitted from this exercise as it does not include a model for the Dimits shift which is known to dramatically effect the performance in ITG-dominated plasma conditions (Staebler et al. Reference Staebler, Candy, Howard and Holland2016). The results of this exercise reveal a 500 MW spread in predicted performance and significant changes in the predicted density profiles as indicated by the nominal
${\gt}500$
MW changes in predicted fusion can result from reasonable changes in input assumptions. It is expected that similar sensitivities would be found in most FPPs operating with high Q. The is due to the nonlinear dependence of fusion power on changes in density profiles and temperature profiles. However, additional sensitivities exist that warrant some discussion in the context of performance predictions. Much of the modelling in this paper utilised the physics-based model TGLF SAT2, which has been specifically tuned to reproduce a database of nonlinear CGYRO simulations (Staebler et al. Reference Staebler, Candy, Belli, Kinsey, Bonanomi and Patel2020). However, additional proposed saturation rules exist (SAT0 (Staebler et al. Reference Staebler, Kinsey and Waltz2007), SAT1 (Staebler et al. Reference Staebler, Candy, Howard and Holland2016) and SAT3 (Dudding et al. Reference Dudding, Casson, Dickinson, Patel, Roach, Belli and Staebler2022)) and it is worth noting that the choice of saturation rule, choice of electrostatic versus electromagnetic simulation and even small changes in the numerical set-up of these models can result in non-negligible changes in profiles and performance. This is demonstrated in figure 12 which plots predicted performance for a range of TGLF saturation rules (1, 2 and 3) and numerical settings. SAT0 was omitted from this exercise as it does not include a model for the Dimits shift which is known to dramatically effect the performance in ITG-dominated plasma conditions (Staebler et al. Reference Staebler, Candy, Howard and Holland2016). The results of this exercise reveal a 500 MW spread in predicted performance and significant changes in the predicted density profiles as indicated by the nominal $\langle n_e\rangle /n_{GW}$
obtained in the converged profile predictions. Figures 12(b) and 12(c) plot four different simulations of the identical condition. These simulations are initialised with a random seed, leading to slight changes in the predicted results that all satisfy convergence criteria of the integrated modelling. Despite small changes in the profiles, predicted performance in the four plotted profiles varies by nearly 50 MW. Since fusion power predictions are approximately proportional to
$\langle n_e\rangle /n_{GW}$
obtained in the converged profile predictions. Figures 12(b) and 12(c) plot four different simulations of the identical condition. These simulations are initialised with a random seed, leading to slight changes in the predicted results that all satisfy convergence criteria of the integrated modelling. Despite small changes in the profiles, predicted performance in the four plotted profiles varies by nearly 50 MW. Since fusion power predictions are approximately proportional to $n_i^2 \times T_i^2$
, for deuterium–tritium plasmas at fusion-relevant temperatures, predictions of fusion performance are extremely sensitive to predicted profile shapes. This is a feature of the ARC V3A design point that should be anticipated to be present in any realistic tokamak-based FPP design. These results set stringent requirements on modelling to enable accurate performance predictions in tokamak power plants, and also highlight the potential benefits of coupled core–pedestal optimisation.
$n_i^2 \times T_i^2$
, for deuterium–tritium plasmas at fusion-relevant temperatures, predictions of fusion performance are extremely sensitive to predicted profile shapes. This is a feature of the ARC V3A design point that should be anticipated to be present in any realistic tokamak-based FPP design. These results set stringent requirements on modelling to enable accurate performance predictions in tokamak power plants, and also highlight the potential benefits of coupled core–pedestal optimisation.
The sensitivity of the fusion power predictions to choice of TGLF modelling is shown (a). Ion and electron temperature profiles (b) and electron density profiles (c) are shown for different variations of converged profiles from the TRANSP–PORTALS workflow.

5.2. Outlook for SPARC operation
This paper presents a comprehensive investigation into the performance of the ARC V3A design point. A range of models were applied to predict the performance and transport in ARC plasma conditions, with results pointing to potentially new physics regimes on the horizon. More importantly, these results can provide a compass to guide experimental investigation on current and next-generation fusion devices such as SPARC. This work identifies at least five areas of research that should be pursued on SPARC which are needed to improve predictions for ARC:
-
(i) Probe the validity of energy confinement time scalings in SPARC.
-
(ii) Improve understanding and prediction of near-edge and pedestal conditions.
-
(iii) Investigate density peaking in ARC-relevant plasma cores.
-
(iv) Validate core transport models in ITG- and KBM-dominated plasmas.
-
(v) Understand the effects of rotation, impurity transport/peaking and fast ions on performance predictions.
This work and recent burning-plasma-focused publications (Howard et al. Reference Howard, Rodriguez-Fernandez, Holland and Candy2024a
; Muraca et al. Reference Muraca, Rodriguez-Fernandez, Howard, Hall, Fable and Tardini2025) have demonstrated predictions of normalised energy confinement (H factors) well below the empirical scalings. Confinement degradation relative to $\tau _{98,y2}$
and even
$\tau _{98,y2}$
and even $\tau _{89p}$
(Rodriguez-Fernandez et al. Reference Rodriguez-Fernandez, Howard, Saltzman, Shoji, Body, Battaglia, Hughes, Candy, Staebler and Creely2024b
) is believed to result, in part, from the extremely stiff nature of transport in the hot-plasma conditions attained in future devices, which has the effect of pinning profiles to the critical gradient of the unstable turbulence. SPARC can provide valuable insight into this potential breakdown of empirical scalings in more burning-plasma-relevant conditions, i.e. those exhibiting long energy confinement times relative to energy exchange times and significant radiation. Such conditions are difficult to access in current devices. SPARC results will help better understand the appropriate assumptions that should be made in future power plant scoping, probe the limitations of existing empirical scalings, contribute to updating of energy confinement scalings and enable validation and improvement of physics models.
$\tau _{89p}$
(Rodriguez-Fernandez et al. Reference Rodriguez-Fernandez, Howard, Saltzman, Shoji, Body, Battaglia, Hughes, Candy, Staebler and Creely2024b
) is believed to result, in part, from the extremely stiff nature of transport in the hot-plasma conditions attained in future devices, which has the effect of pinning profiles to the critical gradient of the unstable turbulence. SPARC can provide valuable insight into this potential breakdown of empirical scalings in more burning-plasma-relevant conditions, i.e. those exhibiting long energy confinement times relative to energy exchange times and significant radiation. Such conditions are difficult to access in current devices. SPARC results will help better understand the appropriate assumptions that should be made in future power plant scoping, probe the limitations of existing empirical scalings, contribute to updating of energy confinement scalings and enable validation and improvement of physics models.
As demonstrated in §§ 3 and 4 (figures 6 and 9), near-edge and pedestal conditions represent the most important open question for ARC operation, with reasonable assumptions of pedestal properties able to create a variation of a factor of 2 in predicted fusion performance. The strongest lever to reduce uncertainty in ARC predictions, and further optimise ARC performance, will be the pursuit of systematic studies on SPARC to understand and predict attainable pedestal pressures and $T_i/T_e$
at the pedestal top. The further development of empirical and physics-based models that can accurately predict SPARC pedestals should be pursued and coupled with core-integrated modelling workflows to allow for rapid evaluation of core–edge solutions. Due to power handling considerations not discussed in this paper, it is likely that emphasis on small ELM or ELM-free regimes should be pursued.
$T_i/T_e$
at the pedestal top. The further development of empirical and physics-based models that can accurately predict SPARC pedestals should be pursued and coupled with core-integrated modelling workflows to allow for rapid evaluation of core–edge solutions. Due to power handling considerations not discussed in this paper, it is likely that emphasis on small ELM or ELM-free regimes should be pursued.
Second only to the uncertainty in the pedestal performance, the attainable density peaking represents the largest uncertainty on ARC core performance. Deviations from the empirical scalings have been reported in multiple next-generation devices (Fable et al. Reference Fable2019; Howard et al. Reference Howard, Rodriguez-Fernandez, Holland and Candy2024a ) and are related in part to the higher attainable beta and ITG dominance of the plasma conditions. Relevant study of this physics requires both low collisionality and ITG-dominated conditions, making it difficult to access in existing devices. SPARC studies will access the relevant turbulence regimes to either confirm or refute the predictions of gyrokinetics and physics-based models, providing a clearer picture of anticipated peaking in ARC and FPP conditions.
Although both physics-based models and nonlinear gyrokinetic models have been validated on devices worldwide, the conditions present in current devices often exhibit properties dissimilar to those predicted in ARC and projected FPPs. Unlike current devices which often exhibit a variety of modes contributing significantly to turbulent transport (MTM, KBM, ITG, TEM, ETG), predictions from next-step devices consistently demonstrate the presence of strong core ITG turbulence (plus potential deep-core KBM) with little to no externally driven rotation, while simultaneously exhibiting very low collisionality. SPARC’s operation will provide access to conditions by obtaining well-coupled ions and electrons with long energy confinement times, significant radiation losses and intrinsic rotation expected to be dominated by ITG in most parts of operational space (Rodriguez-Fernandez et al. Reference Rodriguez-Fernandez, Howard and Candy2022, Reference Rodriguez-Fernandez, Howard, Saltzman, Shoji, Body, Battaglia, Hughes, Candy, Staebler and Creely2024b
). Low- $q_{95}$
, H-mode conditions in SPARC will represent the best approximation to anticipated ARC conditions. Extensive validation of physics-based models and nonlinear gyrokinetic approaches should be performed on SPARC to more definitely identify both the models and numerical settings (see figure 12) that accurately reproduce SPARC profiles, allowing for reduced uncertainty in projections of ARC and increased confidence in model-based optimisation of performance.
$q_{95}$
, H-mode conditions in SPARC will represent the best approximation to anticipated ARC conditions. Extensive validation of physics-based models and nonlinear gyrokinetic approaches should be performed on SPARC to more definitely identify both the models and numerical settings (see figure 12) that accurately reproduce SPARC profiles, allowing for reduced uncertainty in projections of ARC and increased confidence in model-based optimisation of performance.
Lastly, rotation, a detailed study of impurity transport and peaking and fast ions were neglected this work but will likely play a non-negligible role in setting ARC performance. SPARC will enable first-of-kind investigations of intrinsic rotation at high input power (25 MW) and high performance (burning plasma conditions). The peaking of impurities in burning plasmas, including both near-axis peaking and screening in the pedestal region will be crucial to understand on SPARC for projection to ARC. It is anticipated to be the first tokamak burning plasma and the associated high-Q operation represents an ideal testbed for studying interactions of fast ions with turbulence and the impact of fast-ion-driven modes on alpha redistribution and heating.
The results in this paper are the first in-depth look into conditions projected for a high-field tokamak power plant. This work points towards open avenues of research that should be pursued on SPARC and existing devices to reduce performance projection uncertainties, and clarify avenues for further performance optimisation, to help ensure the success of ARC and future FPPs.
Acknowledgements
The authors would like to thank J. Candy and E. Belli for the development of the CGYRO and NEO codes. This research used resources of the National Energy Research Scientific Computing Center, a DOE Office of Science User Facility supported by the Office of Science of the US Department of Energy under contract no. DE-AC02-05CH11231 using NERSC award FES-ERCAP0032045. This work was funded by Commonwealth Fusion Systems under MIT RPP020. This material is based upon work supported by the US Department of Energy, Office of Science, Fusion Energy Sciences, under the Milestone-Based Fusion Development Program under award number DE-SC0024885.
Editor Troy Carter thanks the referees for their advice in evaluating this article.
Disclaimer
This report was prepared as an account of work sponsored by an agency of the United States Government. Neither the United States Government nor any agency thereof, nor any of their employees, makes any warranty, express or implied, or assumes any legal liability or responsibility for the accuracy, completeness or usefulness of any information, apparatus, product or process disclosed, or represents that its use would not infringe privately owned rights. Reference herein to any specific commercial product, process or service by trade name, trademark, manufacturer or otherwise does not necessarily constitute or imply its endorsement, recommendation or favouring by the United States Government or any agency thereof. The views and opinions of authors expressed herein do not necessarily state or reflect those of the United States Government or any agency thereof.
Declaration of interests
J.C.H., A.C, T.E. and T.B. are employed by Commonwealth Fusion Systems. The authors report no conflict of interest.
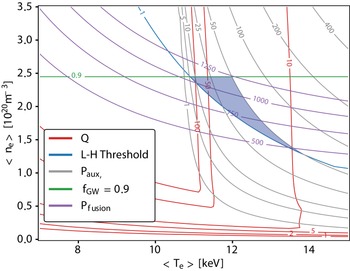
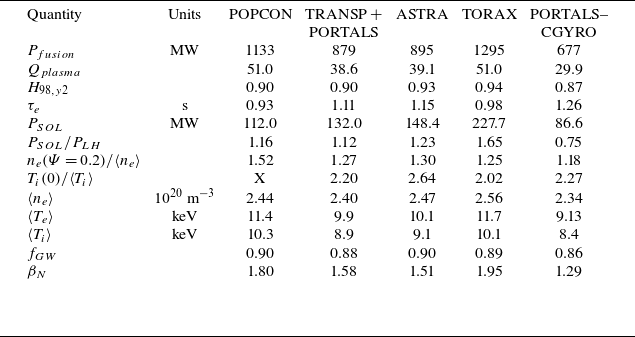

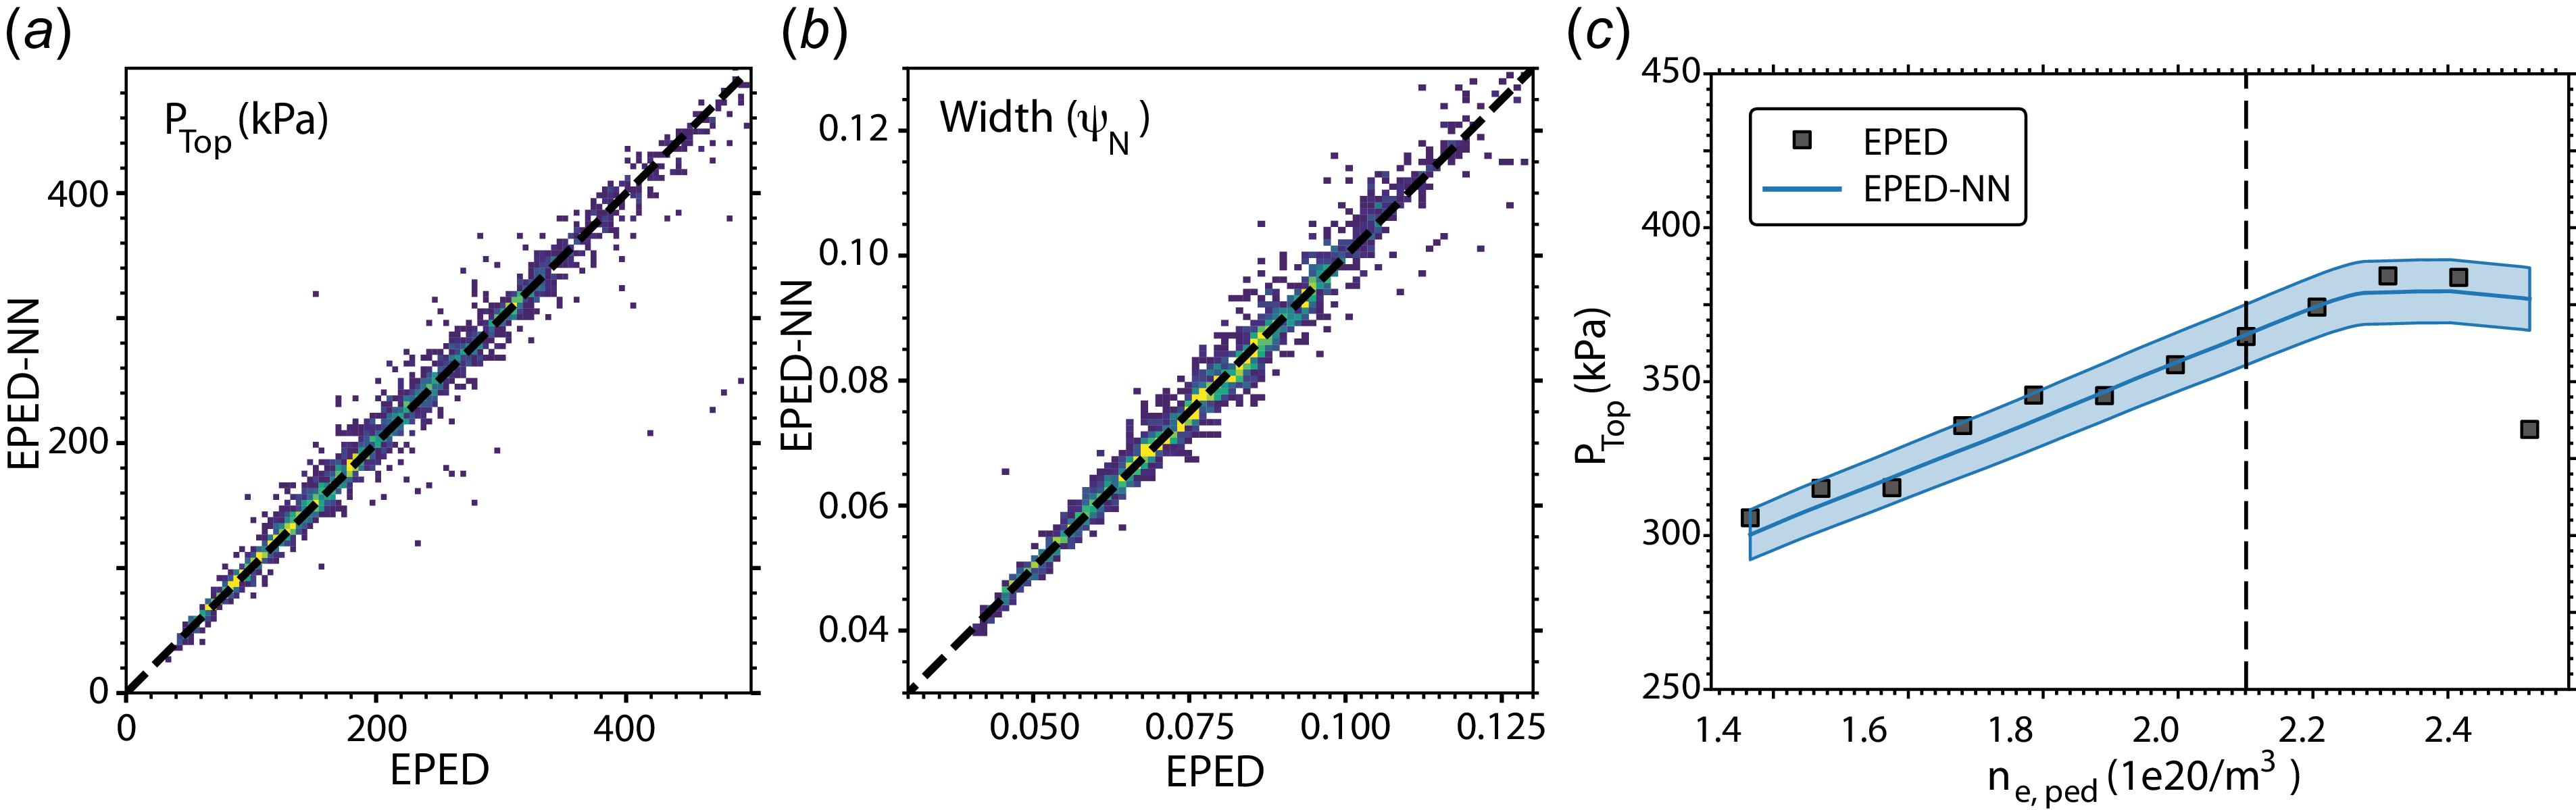
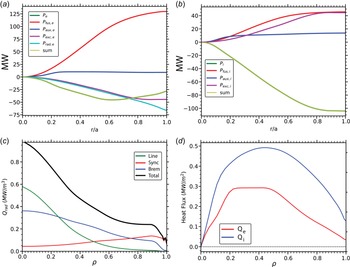
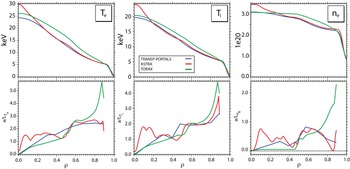


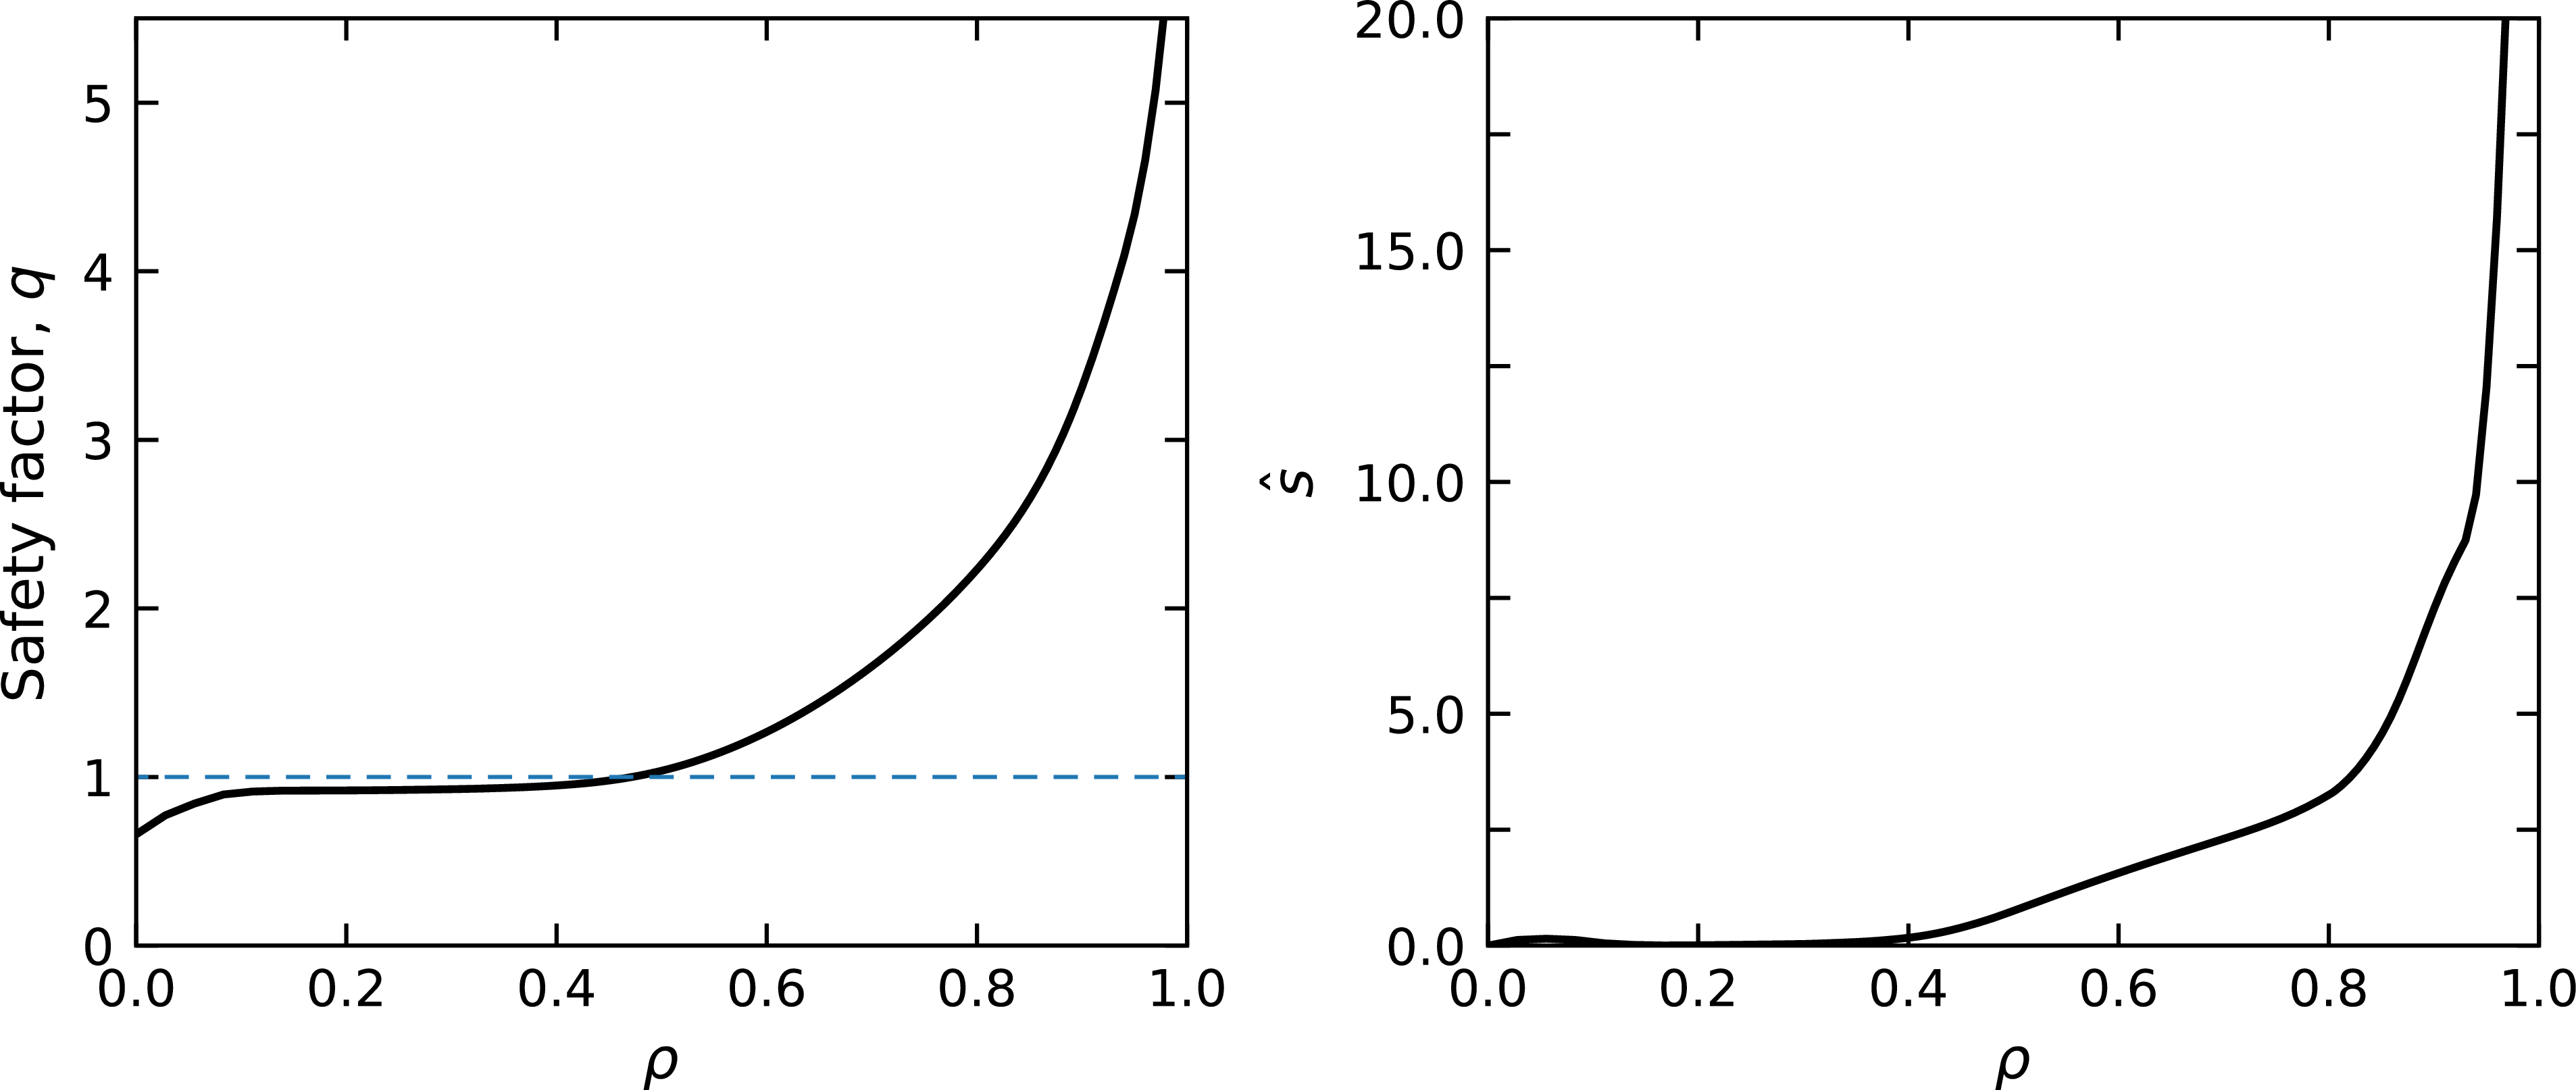

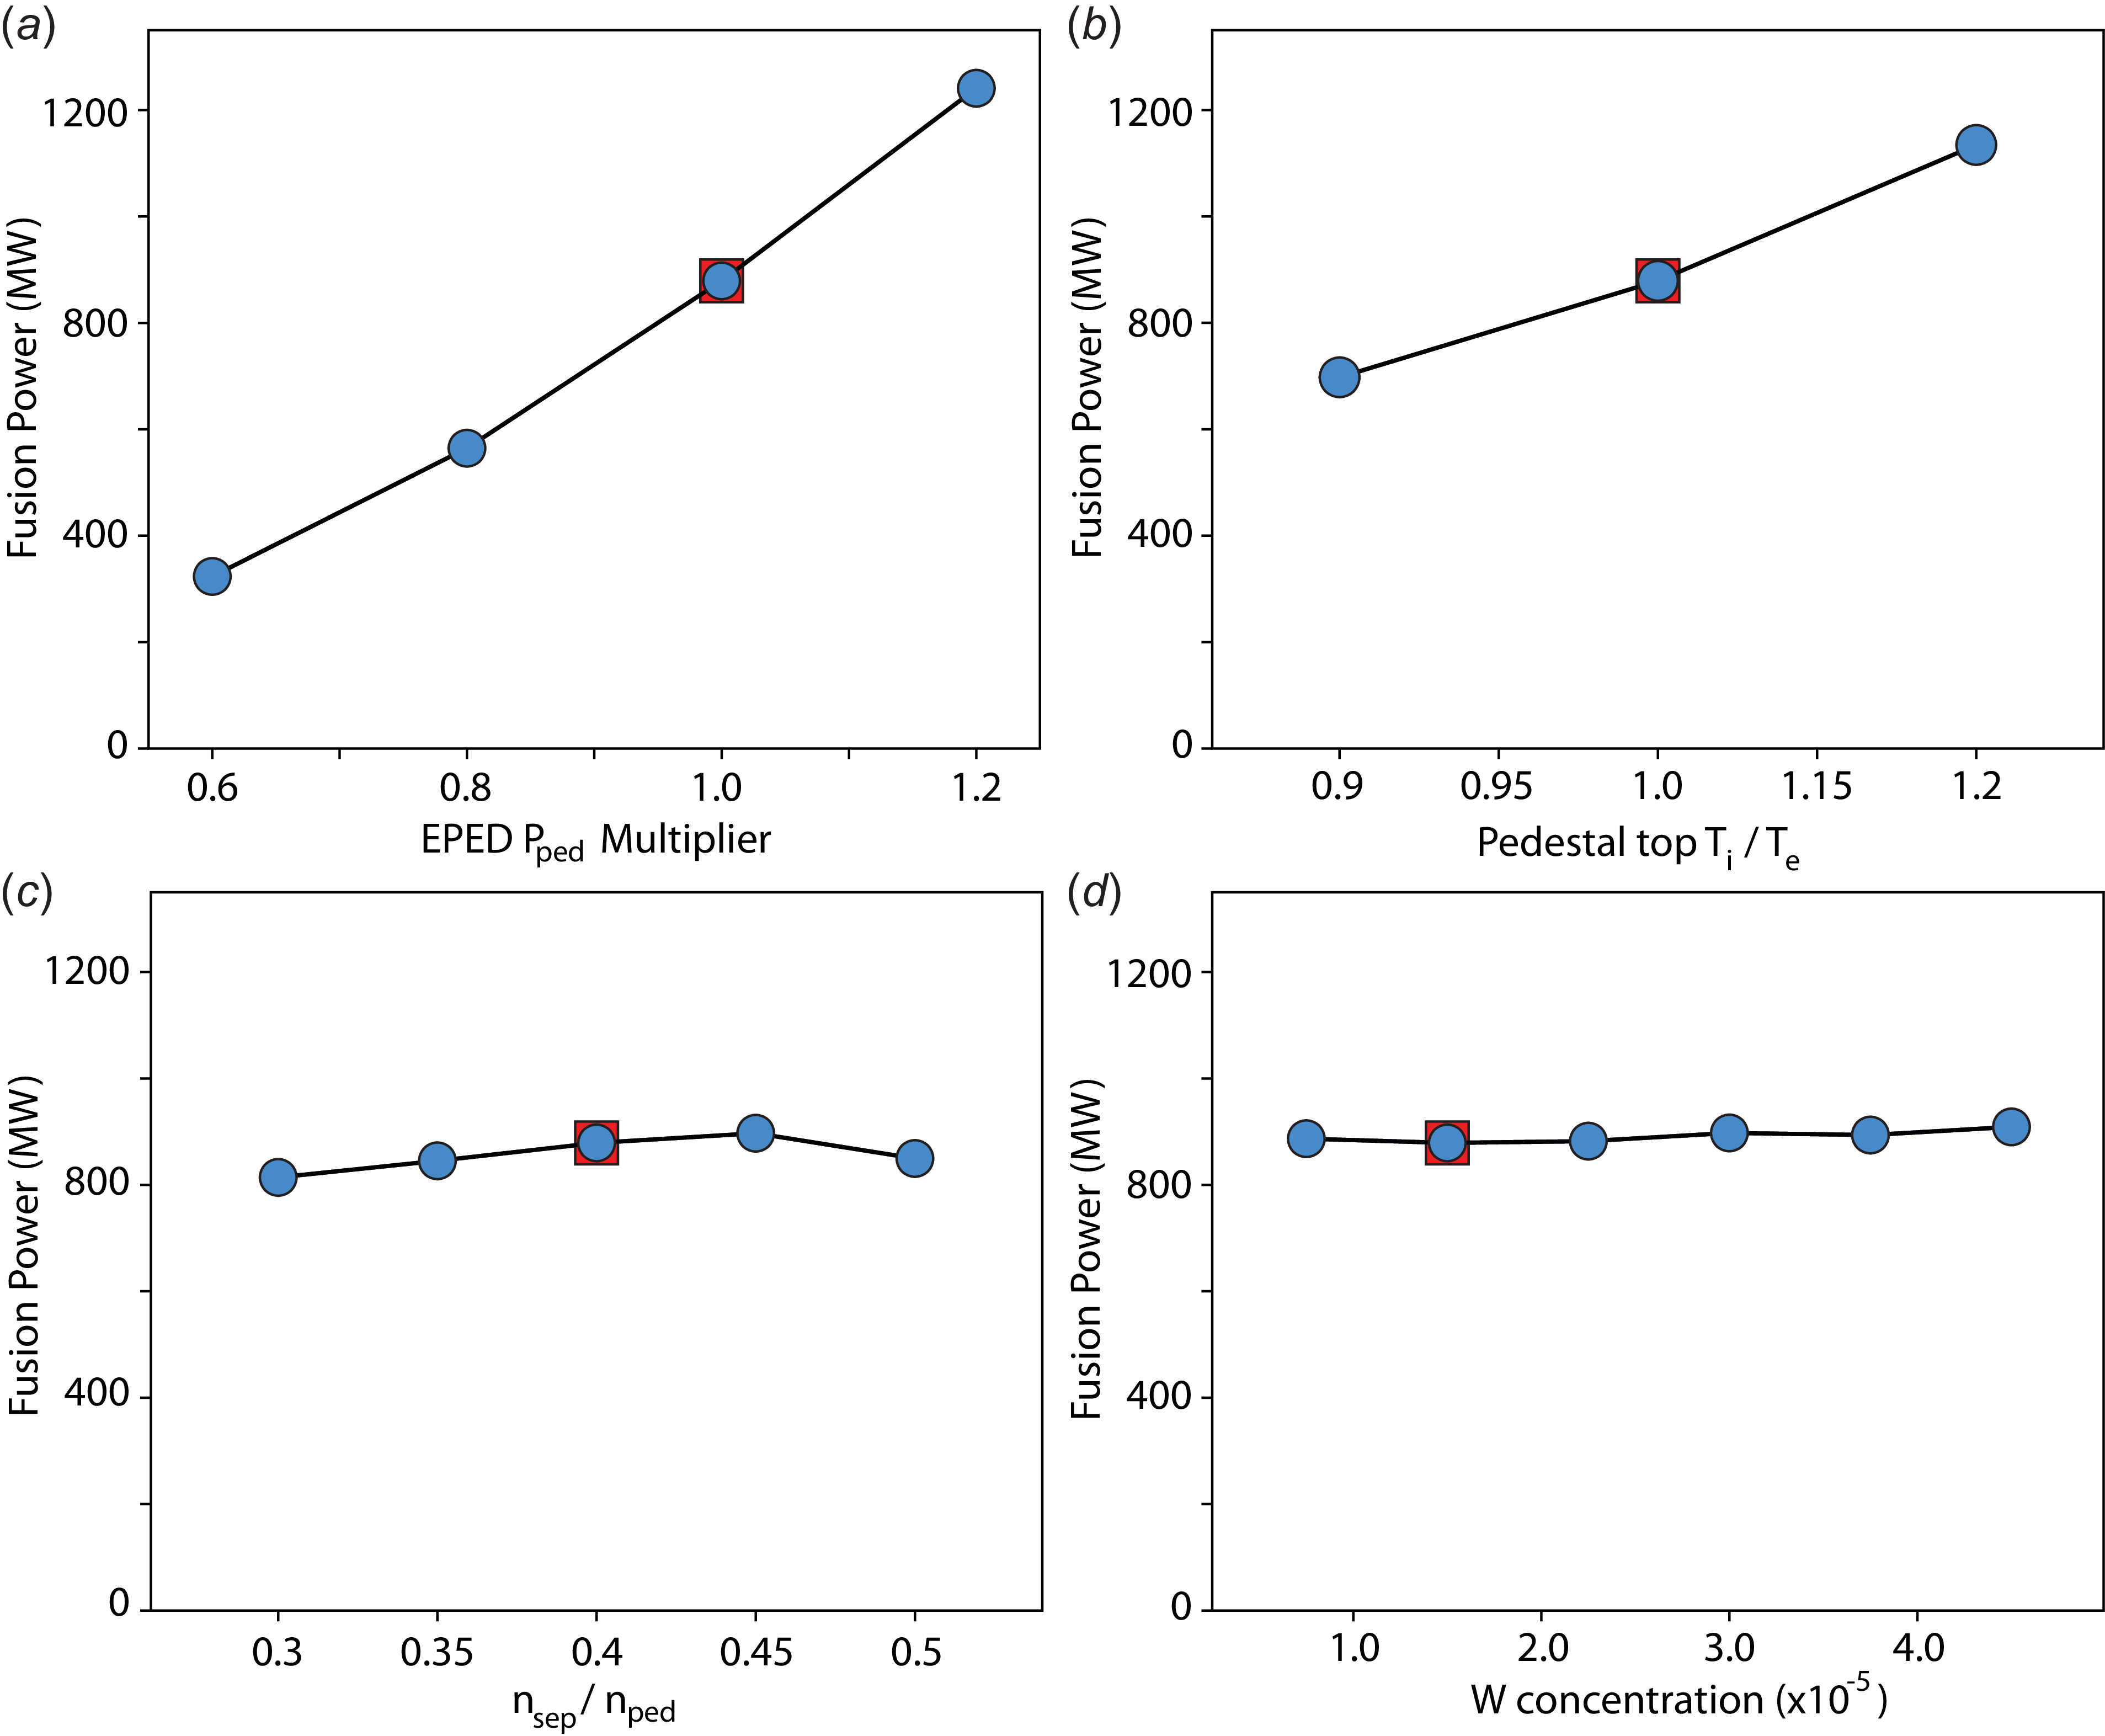
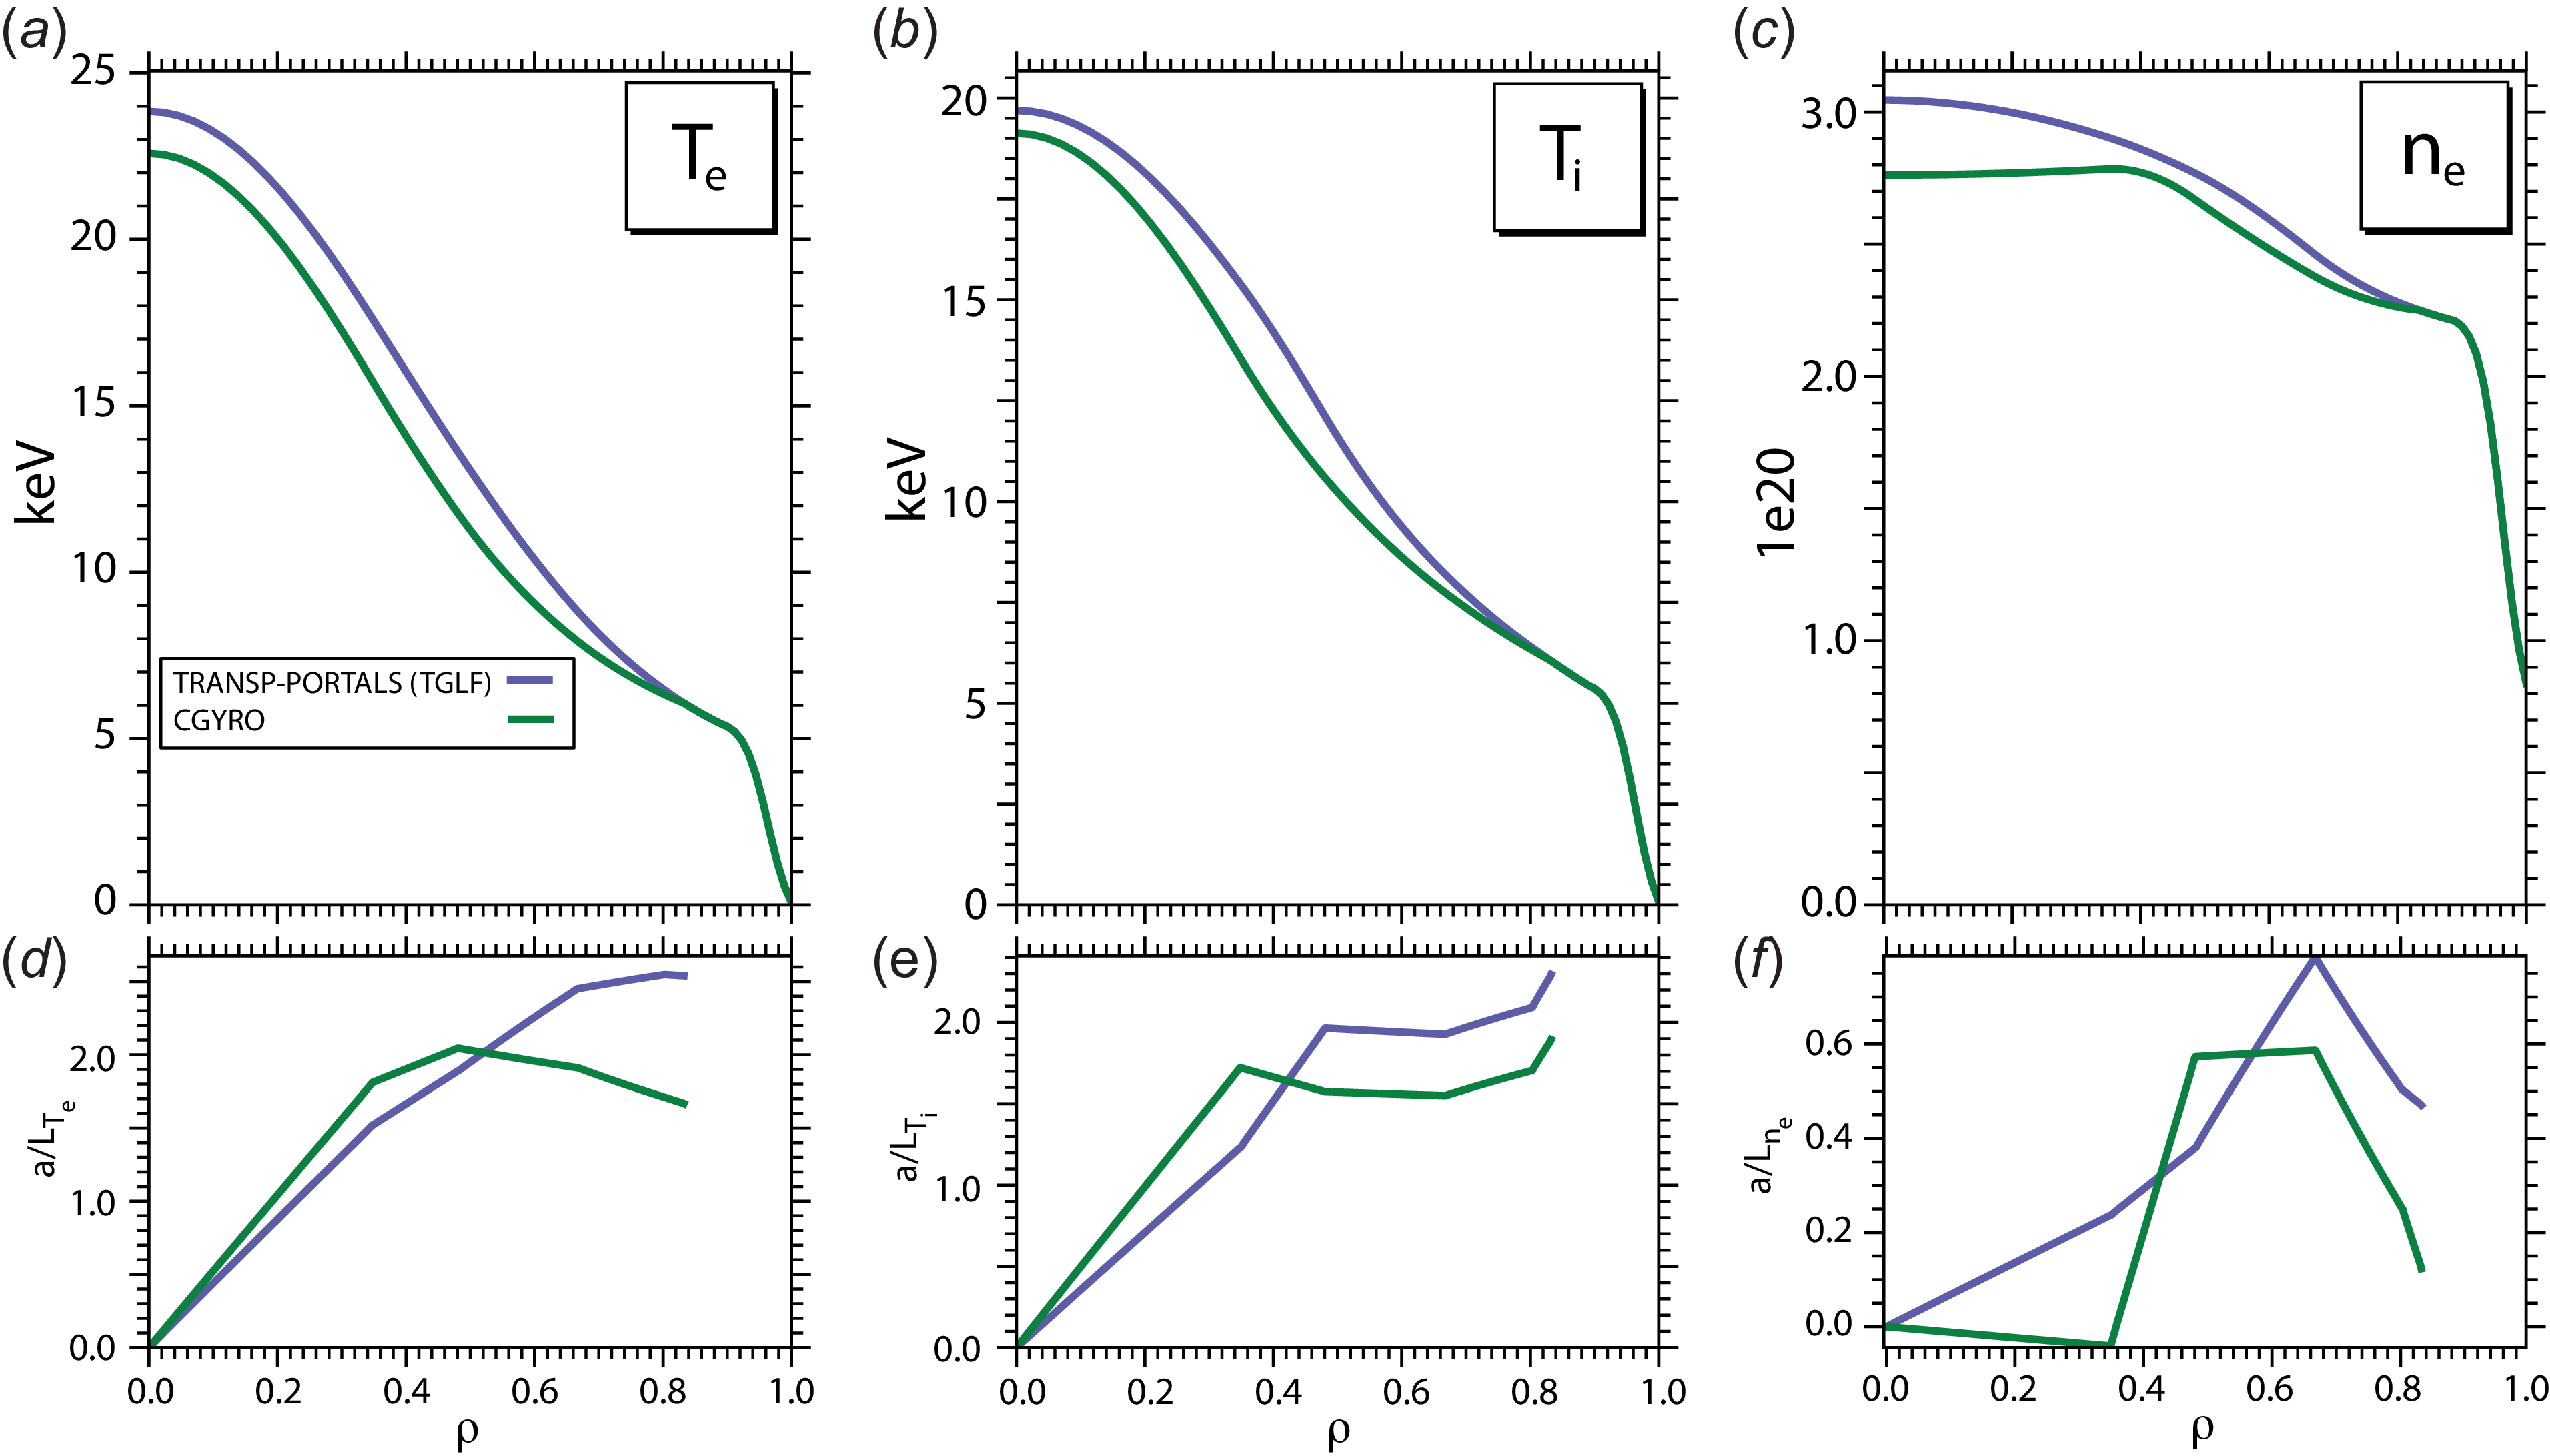


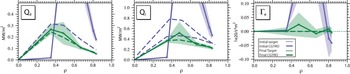

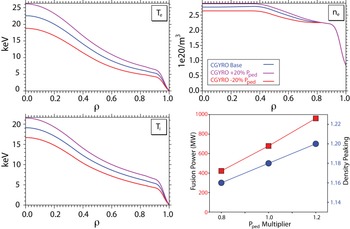


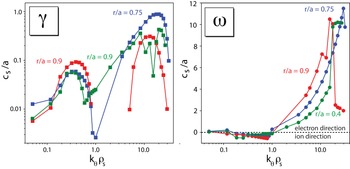


 Open access

