





1. Introduction
The role of suspended particles in modifying the bulk rheology and transport properties of fluids has been a central theme in fluid mechanics since Einstein’s pioneering work on the effective viscosity of dilute suspensions of rigid spheres (Einstein Reference Einstein1906, Reference Einstein1911). His analysis revealed that, in the dilute limit, the effective viscosity increases linearly with particle volume fraction due to the superposition of flow disturbances generated by individual particles (Graham Reference Graham2018). This seminal result has since been extended to analytically account for hydrodynamic interactions at moderate concentrations (Batchelor & Green Reference Batchelor and Green1972), dense-suspension rheology (Stickel & Powell Reference Stickel and Powell2005) and to incorporate additional factors such as inertia (Kulkarni & Morris Reference Kulkarni and Morris2008; Picano et al. Reference Picano, Breugem, Mitra and Brandt2013) and particle migration (Lashgari et al. Reference Lashgari, Picano, Breugem and Brandt2014). Collectively, these studies have established a robust framework for Newtonian particle suspensions (Guazzelli & Morris Reference Guazzelli and Morris2011).
Suspensions in non-Newtonian fluids present additional complexities, as the nonlinear rheology of the carrier fluid strongly couples with particle-induced stresses to modify both local and global flow properties (D’Avino, Greco & Maffettone Reference D’Avino, Greco and Maffettone2017; Einarsson, Yang & Shaqfeh Reference Einarsson, Yang and Shaqfeh2018; Shaqfeh Reference Shaqfeh2019; Rosti & Brandt Reference Rosti and Brandt2020; Habibi Reference Habibi2026). Among the most representative and widely applicable models of complex fluids are elastoviscoplastic (EVP) materials, which combine the viscous behaviour of Newtonian fluids with elasticity and yield stress (Dimitriou, Ewoldt & McKinley Reference Dimitriou, Ewoldt and McKinley2013; Saramito Reference Saramito2016). Elastoviscoplastic suspensions are encountered in diverse contexts ranging from hydraulic fracturing and slurry transport to additive manufacturing and the design of biomaterials for drug delivery. Recent studies have highlighted the unique behaviour of particles in EVP flows (Fraggedakis, Dimakopoulos & Tsamopoulos Reference Fraggedakis, Dimakopoulos and Tsamopoulos2016; Chaparian et al. Reference Chaparian, Ardekani, Brandt and Tammisola2020; Zade et al. Reference Zade, Shamu, Lundell and Brandt2020; Habibi et al. Reference Habibi, Iqbal, Costa and Tammisola2026). For instance, Habibi et al. (Reference Habibi, Iqbal, Ardekani, Chaparian, Brandt and Tammisola2025) showed that, in EVP duct flows, spherical particles collectively migrate towards the duct core, where they become entrapped within the unyielded region. They further revealed that yield stress, in combination with a shear-thinning plastic viscosity, promotes particle accumulation near the duct corners through the amplification of the first normal stress difference.
A relatively unexplored aspect of EVP carrier fluids is the influence of their rheological properties on drag modifications in particle-laden flows. Even in laminar regimes, changes in particle migration patterns or the entrapment of particles within plug regions can alter the drag increase associated with increasing solid volume fractions. In this work, we therefore quantify these effects using interface-resolved direct numerical simulations (DNS) of inertial flows laden with rigid spherical particles suspended in EVP fluids governed by the Saramito model (Saramito Reference Saramito2007). The objective is to determine the wall drag experienced by EVP suspensions and to elucidate the physical mechanisms responsible for the non-intuitive behaviour observed at the different volume fractions. The remainder of this paper is organised as follows: § 2 presents the governing equations and the problem formulation; § 3 discusses the DNS results on drag increase in EVP suspensions; and § 4 summarises the key findings.
2. Methodology
2.1. Mathematical formulation
We consider an incompressible EVP fluid flow, subject to mass and momentum conservation
 \begin{align}\boldsymbol{\nabla }\boldsymbol{\cdot }\boldsymbol{u} = 0,\end{align}
 \begin{align}\frac {\partial \boldsymbol{u}}{\partial t} + (\boldsymbol{u}\boldsymbol{\cdot }\boldsymbol{\nabla } ) \boldsymbol{u} = -\boldsymbol {\nabla }{p} + \frac {\beta _s}{Re}{\nabla} ^2 \boldsymbol{u} + \boldsymbol{\nabla }\boldsymbol{\cdot }\boldsymbol{\tau }^p + \boldsymbol{f}.\end{align}
Here, the governing equations are presented in non-dimensional form, with $\boldsymbol{u}$
and
$\boldsymbol{u}$
and $p$
denoting the velocity and pressure fields,
$p$
denoting the velocity and pressure fields, $\boldsymbol{\tau }^p$
the polymeric stress tensor and
$\boldsymbol{\tau }^p$
the polymeric stress tensor and $Re = \rho U_b H/\mu$
the Reynolds number, where
$Re = \rho U_b H/\mu$
the Reynolds number, where $H$
is the duct half-height,
$H$
is the duct half-height, $U_b$
is the bulk velocity of the duct flow,
$U_b$
is the bulk velocity of the duct flow, $\rho$
is the density of the carrier fluid, and
$\rho$
is the density of the carrier fluid, and $\mu$
is the total viscosity of the carrier fluid. Note that the pressure and the extra stress tensor are scaled by
$\mu$
is the total viscosity of the carrier fluid. Note that the pressure and the extra stress tensor are scaled by $\rho U_b^2$
. The body force
$\rho U_b^2$
. The body force $\boldsymbol{f}$
in the momentum equation represents the immersed boundary force capturing particle–fluid interactions. The total stress is given by
$\boldsymbol{f}$
in the momentum equation represents the immersed boundary force capturing particle–fluid interactions. The total stress is given by $\boldsymbol{\tau } = \boldsymbol{\tau }^s + \boldsymbol{\tau }^p$
, with the solvent contribution
$\boldsymbol{\tau } = \boldsymbol{\tau }^s + \boldsymbol{\tau }^p$
, with the solvent contribution $\boldsymbol{\tau }^s = \beta _s ({ \boldsymbol{\nabla }}{\boldsymbol{u}} + { \boldsymbol{\nabla }}{\boldsymbol{u}}^{{T}})$
, where
$\boldsymbol{\tau }^s = \beta _s ({ \boldsymbol{\nabla }}{\boldsymbol{u}} + { \boldsymbol{\nabla }}{\boldsymbol{u}}^{{T}})$
, where $\beta _s = \mu _s/\mu$
is the viscosity ratio, fixed at 0.1 in all simulations. The EVP behaviour is modelled using the Saramito constitutive equation (Saramito Reference Saramito2007)
$\beta _s = \mu _s/\mu$
is the viscosity ratio, fixed at 0.1 in all simulations. The EVP behaviour is modelled using the Saramito constitutive equation (Saramito Reference Saramito2007)
 \begin{align} Wi\, \overset {\triangledown }{\boldsymbol{\tau }^p} + F \boldsymbol{\tau }^p = \frac {2(1 - \beta _s)}{Re} \boldsymbol{D}, \end{align}
where the function $F = \max (0,( ({|\boldsymbol{\tau }^p_d| - Bi/Re})/{|\boldsymbol{\tau }^p_d|}))$
incorporates yield stress in the Saramito model. The relative importance of the yield stress is quantified by the Bingham number,
$F = \max (0,( ({|\boldsymbol{\tau }^p_d| - Bi/Re})/{|\boldsymbol{\tau }^p_d|}))$
incorporates yield stress in the Saramito model. The relative importance of the yield stress is quantified by the Bingham number, $Bi = \tau _y H/\mu U_b$
, representing the ratio of yield stress to viscous scales. Additionally, fluid elasticity is characterised by the Weissenberg number
$Bi = \tau _y H/\mu U_b$
, representing the ratio of yield stress to viscous scales. Additionally, fluid elasticity is characterised by the Weissenberg number $Wi = \lambda U_b/H$
, with
$Wi = \lambda U_b/H$
, with $\lambda$
the fluid relaxation time. We can alternatively employ an elasticity number defined as
$\lambda$
the fluid relaxation time. We can alternatively employ an elasticity number defined as $El=Wi/Re = \lambda \mu /\rho L^2$
, which depends only on the fluid properties and duct geometry. The deviatoric stress is defined as
$El=Wi/Re = \lambda \mu /\rho L^2$
, which depends only on the fluid properties and duct geometry. The deviatoric stress is defined as $\boldsymbol{\tau }^p_d = \boldsymbol{\tau }^p - (\mathrm{tr}\, \boldsymbol{\tau }^p/\mathrm{tr}\,{\boldsymbol{I}})\boldsymbol{I}$
, with magnitude
$\boldsymbol{\tau }^p_d = \boldsymbol{\tau }^p - (\mathrm{tr}\, \boldsymbol{\tau }^p/\mathrm{tr}\,{\boldsymbol{I}})\boldsymbol{I}$
, with magnitude $|\boldsymbol{\tau }^p_d| = \sqrt {\boldsymbol{\tau }^p_d:\boldsymbol{\tau }^p_d/2}$
, and where
$|\boldsymbol{\tau }^p_d| = \sqrt {\boldsymbol{\tau }^p_d:\boldsymbol{\tau }^p_d/2}$
, and where $\boldsymbol{I}$
is the identity tensor. Finally,
$\boldsymbol{I}$
is the identity tensor. Finally, $\overset {\triangledown }{\boldsymbol{\tau }^p}$
denotes the upper-convected derivative of the polymer stress tensor, defined as (Oldroyd Reference Oldroyd1950)
$\overset {\triangledown }{\boldsymbol{\tau }^p}$
denotes the upper-convected derivative of the polymer stress tensor, defined as (Oldroyd Reference Oldroyd1950)
 \begin{align} \overset {\triangledown }{\boldsymbol{\tau }^p} \equiv \frac {\partial \boldsymbol{\tau }^p}{\partial t} + u\boldsymbol{\cdot }\boldsymbol {\nabla }\boldsymbol{\tau }^p - \boldsymbol{\nabla }\boldsymbol{u}^{{T}}\boldsymbol{\cdot }\boldsymbol{\tau }^p - \boldsymbol{\tau }^p\boldsymbol{\cdot } \boldsymbol{\nabla }\boldsymbol{u}. \end{align}
The translational and rotational motion of each rigid spherical particle is described by the Newton–Euler equations
 \begin{align} \rho _p \, V_p \, \frac {\mathrm{d} \boldsymbol u_p}{\mathrm{d} t} = \oint _{\partial V} \boldsymbol \sigma \boldsymbol{\cdot }\boldsymbol n \,\, \mathrm{d}A + \boldsymbol F_c,\end{align}
 \begin{align} I_p\frac {\mathrm{d} \boldsymbol \omega _p}{\mathrm{d} t} = \oint _{\partial V} \boldsymbol r\times (\boldsymbol \sigma \boldsymbol{\cdot }\boldsymbol n) \,\, \mathrm{d}A + \boldsymbol T_c.\end{align}
Here, $\boldsymbol u_p$
and
$\boldsymbol u_p$
and $\boldsymbol \omega _p$
denote the linear and angular velocities of the particles, while
$\boldsymbol \omega _p$
denote the linear and angular velocities of the particles, while $\rho _p$
,
$\rho _p$
, $V_p$
and
$V_p$
and $\boldsymbol I_p$
are their density, volume and moment of inertia. The particle domain is represented by
$\boldsymbol I_p$
are their density, volume and moment of inertia. The particle domain is represented by $\partial V$
, with
$\partial V$
, with $\boldsymbol{r}$
the position vector relative to its centre. The Cauchy stress tensor is given by
$\boldsymbol{r}$
the position vector relative to its centre. The Cauchy stress tensor is given by $\boldsymbol{\sigma } = -p\boldsymbol{I} + \boldsymbol{\tau }^p + \beta _s(\boldsymbol{\nabla }{\boldsymbol u} + \boldsymbol {\nabla }{\boldsymbol u}^{{T}})$
. Collision forces and torques,
$\boldsymbol{\sigma } = -p\boldsymbol{I} + \boldsymbol{\tau }^p + \beta _s(\boldsymbol{\nabla }{\boldsymbol u} + \boldsymbol {\nabla }{\boldsymbol u}^{{T}})$
. Collision forces and torques, $\boldsymbol{F}_{\!c}$
and
$\boldsymbol{F}_{\!c}$
and $\boldsymbol{T}_{\!c}$
, arise from particle–particle and particle–wall interactions, modelled using a soft-sphere collision framework with a lubrication correction (Costa et al. Reference Costa, Boersma, Westerweel and Breugem2015). Details of the lubrication correction and the collision model are provided in Appendix A.
$\boldsymbol{T}_{\!c}$
, arise from particle–particle and particle–wall interactions, modelled using a soft-sphere collision framework with a lubrication correction (Costa et al. Reference Costa, Boersma, Westerweel and Breugem2015). Details of the lubrication correction and the collision model are provided in Appendix A.
Instantaneous snapshot of the flow with 10 % particle volume fraction. The flow is directed along the y-axis. The $x{-}y$
,
$x{-}y$
, $y{-}z$
and
$y{-}z$
and $x{-}z$
planes display the secondary flows, polymeric shear stress and first normal stress difference, respectively. The blue regions denote unyielded zones surrounding the particles, which trap them in place. The particle colours are for illustration only.
$x{-}z$
planes display the secondary flows, polymeric shear stress and first normal stress difference, respectively. The blue regions denote unyielded zones surrounding the particles, which trap them in place. The particle colours are for illustration only.

2.2. Flow set-up
We consider neutrally buoyant, non-Brownian, rigid particles of diameter $D$
suspended in a pressure-driven EVP flow through a square duct. Simulations are conducted in a Cartesian domain with dimensions
$D$
suspended in a pressure-driven EVP flow through a square duct. Simulations are conducted in a Cartesian domain with dimensions $L_x= 2H$
,
$L_x= 2H$
, $L_y= 6H$
and
$L_y= 6H$
and $L_z= 2H$
, where
$L_z= 2H$
, where $y$
,
$y$
, $z$
and
$z$
and $x$
denote the streamwise, vertical and spanwise directions, respectively (see figure 1). Particles are initially at rest and randomly positioned throughout the domain. The blockage ratio, defined as
$x$
denote the streamwise, vertical and spanwise directions, respectively (see figure 1). Particles are initially at rest and randomly positioned throughout the domain. The blockage ratio, defined as $\kappa = (2H)/D$
, is varied as
$\kappa = (2H)/D$
, is varied as $\kappa = 5, 8$
and
$\kappa = 5, 8$
and $10$
to explore particle size effects. The domain is discretised on a 160
$10$
to explore particle size effects. The domain is discretised on a 160 $\times$
480
$\times$
480 $\times$
160 Eulerian grid, with each particle fully resolved by 32 grid points across its diameter, resulting in a surface discretisation using 3219 uniformly distributed Lagrangian markers. Simulations are performed at constant bulk velocity
$\times$
160 Eulerian grid, with each particle fully resolved by 32 grid points across its diameter, resulting in a surface discretisation using 3219 uniformly distributed Lagrangian markers. Simulations are performed at constant bulk velocity $U_b$
, corresponding to
$U_b$
, corresponding to $Re=20$
in most cases. Periodic boundary conditions are imposed in the streamwise direction, while no-slip and no-penetration conditions apply at the walls. A total of 44 three-dimensional DNS were performed, employing the Saramito model to capture the carrier-fluid rheology and the immersed boundary method (Breugem Reference Breugem2012) to fully resolve particle–fluid interactions. More details of the numerical framework and corresponding validations attesting the accuracy and suitability of the approach to the present problem are provided in Izbassarov et al. (Reference Izbassarov, Rosti, Ardekani, Sarabian, Hormozi, Brandt and Tammisola2018) and Habibi et al. (Reference Habibi, Iqbal, Ardekani, Chaparian, Brandt and Tammisola2025). Due to fine resolution and slow particle migration, simulations are computationally intensive, with some cases requiring up to four weeks on 640 cores to reach steady state.
$Re=20$
in most cases. Periodic boundary conditions are imposed in the streamwise direction, while no-slip and no-penetration conditions apply at the walls. A total of 44 three-dimensional DNS were performed, employing the Saramito model to capture the carrier-fluid rheology and the immersed boundary method (Breugem Reference Breugem2012) to fully resolve particle–fluid interactions. More details of the numerical framework and corresponding validations attesting the accuracy and suitability of the approach to the present problem are provided in Izbassarov et al. (Reference Izbassarov, Rosti, Ardekani, Sarabian, Hormozi, Brandt and Tammisola2018) and Habibi et al. (Reference Habibi, Iqbal, Ardekani, Chaparian, Brandt and Tammisola2025). Due to fine resolution and slow particle migration, simulations are computationally intensive, with some cases requiring up to four weeks on 640 cores to reach steady state.
3. Results
Figure 2 shows the wall-drag increase with particle volume fraction, $\phi$
, in EVP suspensions for Bingham numbers
$\phi$
, in EVP suspensions for Bingham numbers $0 \leqslant Bi \leqslant 2$
, normalised by the corresponding single-phase drag. All simulations are performed at fixed elasticity number
$0 \leqslant Bi \leqslant 2$
, normalised by the corresponding single-phase drag. All simulations are performed at fixed elasticity number $El=0.05$
and blockage ratio
$El=0.05$
and blockage ratio $5$
. For comparison, we also report the drag increase of Newtonian suspensions obtained from our DNS. Note that the total wall shear stress is determined from the pressure gradient required to maintain a constant flow rate.
$5$
. For comparison, we also report the drag increase of Newtonian suspensions obtained from our DNS. Note that the total wall shear stress is determined from the pressure gradient required to maintain a constant flow rate.
The results indicate that the drag increase in EVP suspensions remains below 10 % across all Bingham numbers, markedly lower than in Newtonian suspensions. For example, at $Bi = 2$
, the drag rises by only 2 % as the particle volume fraction increases from 0 % to 10 %. This trend persists across all Bingham numbers, with higher
$Bi = 2$
, the drag rises by only 2 % as the particle volume fraction increases from 0 % to 10 %. This trend persists across all Bingham numbers, with higher $Bi$
associated with progressively smaller drag increments relative to the single-phase baseline. To facilitate a direct comparison between EVP and viscoelastic suspensions (
$Bi$
associated with progressively smaller drag increments relative to the single-phase baseline. To facilitate a direct comparison between EVP and viscoelastic suspensions ( $Bi=0$
), the inset of figure 2 presents the drag variation relative to the single-phase viscoelastic flow. At
$Bi=0$
), the inset of figure 2 presents the drag variation relative to the single-phase viscoelastic flow. At $\phi$
= 0 %, the EVP flow exhibits higher drag than the viscoelastic counterpart due to the presence of a central plug region, as discussed in further detail later in this section. However, as the
$\phi$
= 0 %, the EVP flow exhibits higher drag than the viscoelastic counterpart due to the presence of a central plug region, as discussed in further detail later in this section. However, as the $\phi$
increases, the relative drag enhancement is less pronounced at higher
$\phi$
increases, the relative drag enhancement is less pronounced at higher $Bi$
.
$Bi$
.
The increase in wall shear stress relative to the corresponding single-phase flow versus the particle fraction ( $\phi$
) in EVP suspensions (
$\phi$
) in EVP suspensions ( $Bi = 0$
–2,
$Bi = 0$
–2, $El = 0.05$
,
$El = 0.05$
, $\kappa = 5$
). Here,
$\kappa = 5$
). Here, $\tau _w^0$
is the wall shear stress for the single-phase flow corresponding to each value of
$\tau _w^0$
is the wall shear stress for the single-phase flow corresponding to each value of $Bi$
. The drag increase for Newtonian suspensions is also shown. Inset: drag increase relative to the viscoelastic single-phase baseline. Here,
$Bi$
. The drag increase for Newtonian suspensions is also shown. Inset: drag increase relative to the viscoelastic single-phase baseline. Here, $\tau _w^{VE}$
is the single-phase viscoelastic wall shear stress.
$\tau _w^{VE}$
is the single-phase viscoelastic wall shear stress.

(a) Fanning friction factor ( $f$
) as a function of particle volume fraction (
$f$
) as a function of particle volume fraction ( $\phi$
) for EVP suspensions (
$\phi$
) for EVP suspensions ( $Bi=0$
–2,
$Bi=0$
–2, $El=0.05$
,
$El=0.05$
, $\kappa =5$
). (b) Corresponding drag reduction percentage (
$\kappa =5$
). (b) Corresponding drag reduction percentage ( $DR$
) relative to Newtonian suspensions at the same
$DR$
) relative to Newtonian suspensions at the same $\phi$
.
$\phi$
.

(a) Two-dimensional view of particles trapped within the central plug region (blue) in an EVP suspension with $Bi = 1$
and
$Bi = 1$
and $\phi = 10\,\%$
. (b) Time- and spatially averaged particle concentration,
$\phi = 10\,\%$
. (b) Time- and spatially averaged particle concentration, $\varPhi$
, across the duct section. (c) Averaged yielded (
$\varPhi$
, across the duct section. (c) Averaged yielded ( $YR = 1$
) and unyielded (
$YR = 1$
) and unyielded ( $YR = 0$
) regions across the duct. (d) Statistically steady fluid–particle velocity difference,
$YR = 0$
) regions across the duct. (d) Statistically steady fluid–particle velocity difference, $(V_f - V_p)\,\%$
relative to the bulk velocity.
$(V_f - V_p)\,\%$
relative to the bulk velocity.

To compare the absolute transport cost, figure 3(a) shows the wall shear stress, expressed as the Fanning friction factor $f=\tau _w/(0.5\rho U_b^{2})$
, as a function of
$f=\tau _w/(0.5\rho U_b^{2})$
, as a function of $\phi$
for the same EVP suspensions. The corresponding Newtonian results at the same Reynolds number and blockage ratio, obtained with our DNS solver, are also shown. At low particle concentrations, the wall drag in EVP suspensions exceeds that of Newtonian flows; however, beyond a threshold volume fraction that depends on
$\phi$
for the same EVP suspensions. The corresponding Newtonian results at the same Reynolds number and blockage ratio, obtained with our DNS solver, are also shown. At low particle concentrations, the wall drag in EVP suspensions exceeds that of Newtonian flows; however, beyond a threshold volume fraction that depends on $Bi$
, this trend reverses and EVP suspensions exhibit reduced drag. This transition is illustrated in figure 3(b), where the drag reduction (
$Bi$
, this trend reverses and EVP suspensions exhibit reduced drag. This transition is illustrated in figure 3(b), where the drag reduction ( $DR\,\%$
) relative to Newtonian suspensions at the same solid volume fraction is defined as
$DR\,\%$
) relative to Newtonian suspensions at the same solid volume fraction is defined as $(\tau _{wN} - \tau _{w})/\tau _{wN}$
. For sufficiently large particle concentrations, EVP suspensions achieve drag reduction of up to
$(\tau _{wN} - \tau _{w})/\tau _{wN}$
. For sufficiently large particle concentrations, EVP suspensions achieve drag reduction of up to $27\,\%$
.
$27\,\%$
.
At low particle concentrations, EVP duct flows develop a central unyielded plug which, under constant flow rate, steepens the velocity gradients near the walls and thereby increases wall drag relative to Newtonian flows (Saramito Reference Saramito2016). This mechanism explains the increased drag in EVP suspensions compared with Newtonian ones at very dilute concentrations (e.g. $\phi \lt 5\,\%$
for
$\phi \lt 5\,\%$
for $Bi = 1$
; see figure 3
a). At higher particle loadings, however, the behaviour differs. Newtonian suspensions experience a pronounced amplification of drag, reaching an increase of approximately 30 % at
$Bi = 1$
; see figure 3
a). At higher particle loadings, however, the behaviour differs. Newtonian suspensions experience a pronounced amplification of drag, reaching an increase of approximately 30 % at $\phi = 10\,\%$
, consistent with earlier studies (Stickel & Powell Reference Stickel and Powell2005). By contrast, in EVP suspensions, drag exhibits only a weak dependence on
$\phi = 10\,\%$
, consistent with earlier studies (Stickel & Powell Reference Stickel and Powell2005). By contrast, in EVP suspensions, drag exhibits only a weak dependence on $\phi$
, remaining below 10 % across all Bingham numbers (see figure 2). Consequently, because drag in Newtonian suspensions increases much more strongly with volume fraction, EVP suspensions display substantial drag reduction relative to their Newtonian counterparts once the particle concentration exceeds a threshold
$\phi$
, remaining below 10 % across all Bingham numbers (see figure 2). Consequently, because drag in Newtonian suspensions increases much more strongly with volume fraction, EVP suspensions display substantial drag reduction relative to their Newtonian counterparts once the particle concentration exceeds a threshold $\phi$
that increases with the Bingham number. This threshold for
$\phi$
that increases with the Bingham number. This threshold for $Bi = 1$
is
$Bi = 1$
is $\phi \approx 5\,\%$
. Notably, this drag-reducing effect is also observed in laminar viscoelastic suspensions (
$\phi \approx 5\,\%$
. Notably, this drag-reducing effect is also observed in laminar viscoelastic suspensions ( $Bi = 0$
) and, unexpectedly, persists in yield-stress fluids despite the formation of a central plug, which is typically associated with enhanced drag.
$Bi = 0$
) and, unexpectedly, persists in yield-stress fluids despite the formation of a central plug, which is typically associated with enhanced drag.
This counterintuitive drag reduction in EVP suspensions originates from particle migration and their preferential accumulation. At sufficiently large Weissenberg numbers, elastic stresses drive particles towards the duct core (Chaparian et al. Reference Chaparian, Ardekani, Brandt and Tammisola2020; Habibi et al. Reference Habibi, Iqbal, Ardekani, Chaparian, Brandt and Tammisola2025), where they accumulate and become trapped within the central plug. To illustrate this mechanism, figure 4(a) shows an instantaneous snapshot of the suspension with $\phi = 10\,\%$
after the particles have reached a statistically steady state, with the blue region indicating the plug in which particles are trapped. The yielding criterion is determined by the second invariant of the non-dimensionalised deviatoric stress tensor,
$\phi = 10\,\%$
after the particles have reached a statistically steady state, with the blue region indicating the plug in which particles are trapped. The yielding criterion is determined by the second invariant of the non-dimensionalised deviatoric stress tensor, $|\boldsymbol{\tau }^p_d|$
. For
$|\boldsymbol{\tau }^p_d|$
. For $|\boldsymbol{\tau }^p_d| \leqslant Bi/Re$
, the material is unyielded and behaves as a Kelvin–Voigt viscoelastic solid; for
$|\boldsymbol{\tau }^p_d| \leqslant Bi/Re$
, the material is unyielded and behaves as a Kelvin–Voigt viscoelastic solid; for $|\boldsymbol{\tau }^p_d| \gt Bi/Re$
, the material yields and flows as an Oldroyd-B fluid (see (2.3)). Panel (b) quantifies particle migration by reporting the time- and cross-sectionally averaged particle concentration,
$|\boldsymbol{\tau }^p_d| \gt Bi/Re$
, the material yields and flows as an Oldroyd-B fluid (see (2.3)). Panel (b) quantifies particle migration by reporting the time- and cross-sectionally averaged particle concentration, $\varPhi$
, which reveals a pronounced focusing of particles at the duct centre. Panel (c) depicts the averaged yielded regions (
$\varPhi$
, which reveals a pronounced focusing of particles at the duct centre. Panel (c) depicts the averaged yielded regions ( $YR$
), highlighting the formation of a central plug in which the local shear stresses remain below the yield threshold. Here,
$YR$
), highlighting the formation of a central plug in which the local shear stresses remain below the yield threshold. Here, $YR=0$
corresponds to unyielded material and
$YR=0$
corresponds to unyielded material and $YR=1$
to yielded (fluid-like) behaviour. Particles migrating into this plug become entrained and advected with it, experiencing negligible relative translation or rotation. As shown in panel (d), this results in vanishing velocity gradients between the particles and the surrounding medium, and hence in a weak fluid–particle slip velocity inside the plug. This preferential migration and trapping explain why an increase in particle loading has little influence on wall shear stress in EVP suspensions: particles accumulate at the centre rather than interacting with the walls, and, once incorporated into the plug, they induce no additional stresses on the flow due to their vanishing slip velocity.
$YR=1$
to yielded (fluid-like) behaviour. Particles migrating into this plug become entrained and advected with it, experiencing negligible relative translation or rotation. As shown in panel (d), this results in vanishing velocity gradients between the particles and the surrounding medium, and hence in a weak fluid–particle slip velocity inside the plug. This preferential migration and trapping explain why an increase in particle loading has little influence on wall shear stress in EVP suspensions: particles accumulate at the centre rather than interacting with the walls, and, once incorporated into the plug, they induce no additional stresses on the flow due to their vanishing slip velocity.
(a) Contours of the first normal stress difference, $N_1 = \tau _{yy} - \tau _{zz}$
, within the duct cross-section for an EVP fluid with
$N_1 = \tau _{yy} - \tau _{zz}$
, within the duct cross-section for an EVP fluid with $\phi = 10\,\%$
,
$\phi = 10\,\%$
, $Bi$
= 1 and
$Bi$
= 1 and $El$
= 0.05. (b) Maximum gradient of the first normal stress difference,
$El$
= 0.05. (b) Maximum gradient of the first normal stress difference, $(\boldsymbol{\nabla }{N_1})_{max}$
, as a function of the Bingham number
$(\boldsymbol{\nabla }{N_1})_{max}$
, as a function of the Bingham number $Bi$
for various elasticity numbers
$Bi$
for various elasticity numbers $El$
. The dependence on the solid loading
$El$
. The dependence on the solid loading $\phi \in \{0,1,5,10,15\}\,\%$
is included for the case of
$\phi \in \{0,1,5,10,15\}\,\%$
is included for the case of $El$
= 0.05 and
$El$
= 0.05 and $Bi$
= 1.
$Bi$
= 1.

To clarify the mechanism underlying particle accumulation at the duct core, figure 5(a) illustrates the spatial distribution of the first normal stress difference, $N_1 = \tau _{yy} - \tau _{zz}$
, across the duct section for an EVP suspension with
$N_1 = \tau _{yy} - \tau _{zz}$
, across the duct section for an EVP suspension with $\phi = 10\,\%$
,
$\phi = 10\,\%$
, $Bi$
= 1 and
$Bi$
= 1 and $El$
= 0.05. Here,
$El$
= 0.05. Here, $N_1$
characterises the anisotropy of the normal stresses within the EVP flow. The maxima of
$N_1$
characterises the anisotropy of the normal stresses within the EVP flow. The maxima of $N_1$
are near the walls (
$N_1$
are near the walls ( $N_1 = 2.5$
) with minima at the centre and corners (
$N_1 = 2.5$
) with minima at the centre and corners ( $N_1 = 0$
). This non-uniform distribution creates an asymmetric elastic force that drives particles towards the duct centre, with the force scaling as
$N_1 = 0$
). This non-uniform distribution creates an asymmetric elastic force that drives particles towards the duct centre, with the force scaling as $F_e \propto |\boldsymbol{\nabla } N_1|$
(Ho & Leal Reference Ho and Leal1976; Karimi, Yazdi & Ardekani Reference Karimi, Yazdi and Ardekani2013). Depending on the magnitude of this gradient, the elastic force can dominate over inertial effects, facilitating particle migration towards the centre (Li, McKinley & Ardekani Reference Li, McKinley and Ardekani2015; Tanriverdi et al. Reference Tanriverdi, Cruz, Habibi, Amini, Costa, Lundell, Mårtensson, Brandt, Tammisola and Russom2024, Reference Tanriverdi2025; Habibi et al. Reference Habibi, Iqbal, Ardekani, Chaparian, Brandt and Tammisola2025), as illustrated in figure 4(a). Based on our simulations for
$F_e \propto |\boldsymbol{\nabla } N_1|$
(Ho & Leal Reference Ho and Leal1976; Karimi, Yazdi & Ardekani Reference Karimi, Yazdi and Ardekani2013). Depending on the magnitude of this gradient, the elastic force can dominate over inertial effects, facilitating particle migration towards the centre (Li, McKinley & Ardekani Reference Li, McKinley and Ardekani2015; Tanriverdi et al. Reference Tanriverdi, Cruz, Habibi, Amini, Costa, Lundell, Mårtensson, Brandt, Tammisola and Russom2024, Reference Tanriverdi2025; Habibi et al. Reference Habibi, Iqbal, Ardekani, Chaparian, Brandt and Tammisola2025), as illustrated in figure 4(a). Based on our simulations for $\kappa = 5$
, particles begin to migrate towards the duct centreline for
$\kappa = 5$
, particles begin to migrate towards the duct centreline for $El \geqslant 0.01$
, and achieve complete focusing at the duct core for
$El \geqslant 0.01$
, and achieve complete focusing at the duct core for $El \geqslant 0.05$
. It should be noted that, while the dominant elastic forces are centre directed, the existence of local
$El \geqslant 0.05$
. It should be noted that, while the dominant elastic forces are centre directed, the existence of local $N_1$
minima near the duct corners creates additional, albeit weaker, attraction points for the particles. However, these corner-ward elastic forces are counteracted by the wall-lift (or wall-repulsion) forces (Zeng, Balachandar & Fischer Reference Zeng, Balachandar and Fischer2005) which prevent particles from reaching the boundaries. Consequently, in EVP suspensions modelled by the Saramito constitutive equation, the particles preferentially focus at the duct centreline rather than the corners (Habibi et al. Reference Habibi, Iqbal, Ardekani, Chaparian, Brandt and Tammisola2025, Reference Habibi, Iqbal, Costa and Tammisola2026).
$N_1$
minima near the duct corners creates additional, albeit weaker, attraction points for the particles. However, these corner-ward elastic forces are counteracted by the wall-lift (or wall-repulsion) forces (Zeng, Balachandar & Fischer Reference Zeng, Balachandar and Fischer2005) which prevent particles from reaching the boundaries. Consequently, in EVP suspensions modelled by the Saramito constitutive equation, the particles preferentially focus at the duct centreline rather than the corners (Habibi et al. Reference Habibi, Iqbal, Ardekani, Chaparian, Brandt and Tammisola2025, Reference Habibi, Iqbal, Costa and Tammisola2026).
To quantify the influence of fluid elasticity on particle migration and the subsequent drag reduction, the maximum magnitude of the first normal stress difference gradient, $(\boldsymbol{\nabla }{N_1})_{max}$
, is plotted in figure 5(b) as a function of the Bingham number (
$(\boldsymbol{\nabla }{N_1})_{max}$
, is plotted in figure 5(b) as a function of the Bingham number ( $Bi$
), elasticity number (
$Bi$
), elasticity number ( $El$
) and particle volume fraction (
$El$
) and particle volume fraction ( $\phi$
). It is observed that increasing
$\phi$
). It is observed that increasing $Bi$
from 0 to 1 results in only a marginal increase in the gradient magnitude. In contrast, increasing the elasticity from
$Bi$
from 0 to 1 results in only a marginal increase in the gradient magnitude. In contrast, increasing the elasticity from $El=$
0.005 to 0.05 significantly enhances the gradient. We further examine
$El=$
0.005 to 0.05 significantly enhances the gradient. We further examine $(\boldsymbol{\nabla }{N_1})_{max}$
across a range of volume fractions,
$(\boldsymbol{\nabla }{N_1})_{max}$
across a range of volume fractions, $\phi \in \{0,1,5,10,15\}\,\%$
, for the specific case of
$\phi \in \{0,1,5,10,15\}\,\%$
, for the specific case of $El=0.05$
and
$El=0.05$
and $Bi=1$
. Within this dilute regime, particle loading exerts a negligible effect on the normal stress difference and its associated gradients. Specifically,
$Bi=1$
. Within this dilute regime, particle loading exerts a negligible effect on the normal stress difference and its associated gradients. Specifically, $(\boldsymbol{\nabla }{N_1})_{max}$
remains at 0.97 for
$(\boldsymbol{\nabla }{N_1})_{max}$
remains at 0.97 for $\phi \leqslant 1\,\%$
, increasing only slightly to 1.03 at
$\phi \leqslant 1\,\%$
, increasing only slightly to 1.03 at $\phi =10\,\%$
.
$\phi =10\,\%$
.
(a) Normalised mean wall shear stress for EVP suspensions at varying $Bi$
, showing particle, viscous and polymeric contributions. (b) Velocity profiles for particle suspensions at different Bingham numbers; inset: close-up of the central plug region. (c) Polymeric shear stress,
$Bi$
, showing particle, viscous and polymeric contributions. (b) Velocity profiles for particle suspensions at different Bingham numbers; inset: close-up of the central plug region. (c) Polymeric shear stress, $\tau ^p_{xy}$
, across the duct height for EVP suspensions.
$\tau ^p_{xy}$
, across the duct height for EVP suspensions.

To further investigate the mechanisms of drag reduction, figure 6(a) displays the individual contributions to the wall drag in EVP suspensions at $\phi = 10\,\%$
for varying Bingham numbers. The normalised mean wall shear stress,
$\phi = 10\,\%$
for varying Bingham numbers. The normalised mean wall shear stress, $\tau _w$
, is decomposed into polymeric, viscous and particle components, with
$\tau _w$
, is decomposed into polymeric, viscous and particle components, with $\tau ^{ref}_w$
denoting the corresponding value for the viscoelastic case (
$\tau ^{ref}_w$
denoting the corresponding value for the viscoelastic case ( $Bi=0$
). The results show that both the particle and viscous contributions remain essentially constant as
$Bi=0$
). The results show that both the particle and viscous contributions remain essentially constant as $Bi$
increases, while the polymeric component dominates the slight growth of the total wall shear stress. Panel (b) reports the statistically averaged velocity profiles along the duct centreline for
$Bi$
increases, while the polymeric component dominates the slight growth of the total wall shear stress. Panel (b) reports the statistically averaged velocity profiles along the duct centreline for $Bi=0-$
2. The velocity profiles exhibit negligible variation across Bingham numbers, from the viscoelastic to the EVP cases. Interestingly, unlike single-phase viscoelastic flows – which lack a central plug due to the absence of yield stress – viscoelastic suspensions develop a plug-like region with nearly uniform velocity (see
$Bi=0-$
2. The velocity profiles exhibit negligible variation across Bingham numbers, from the viscoelastic to the EVP cases. Interestingly, unlike single-phase viscoelastic flows – which lack a central plug due to the absence of yield stress – viscoelastic suspensions develop a plug-like region with nearly uniform velocity (see $Bi=0$
in panel b). This arises from particle migration towards the duct core, where particle accumulation produces a blunted velocity profile, leading to the close similarity between the velocity profiles of viscoelastic and EVP suspensions. Since the viscous stress is computed from the solvent viscosity multiplied by the wall shear rate,
$Bi=0$
in panel b). This arises from particle migration towards the duct core, where particle accumulation produces a blunted velocity profile, leading to the close similarity between the velocity profiles of viscoelastic and EVP suspensions. Since the viscous stress is computed from the solvent viscosity multiplied by the wall shear rate, $\boldsymbol{\tau }^s = \mu _s (\boldsymbol{\nabla } \boldsymbol{u} + \boldsymbol{\nabla } \boldsymbol{u}^{T})$
, the invariance of the velocity profiles explains why the viscous stress contribution remains unchanged. To further assess the polymeric contributions, panel (c) presents the statistically averaged polymeric shear stress,
$\boldsymbol{\tau }^s = \mu _s (\boldsymbol{\nabla } \boldsymbol{u} + \boldsymbol{\nabla } \boldsymbol{u}^{T})$
, the invariance of the velocity profiles explains why the viscous stress contribution remains unchanged. To further assess the polymeric contributions, panel (c) presents the statistically averaged polymeric shear stress, $\tau ^p_{xy}$
, across the vertical direction. As expected,
$\tau ^p_{xy}$
, across the vertical direction. As expected, $\tau ^p_{xy}$
attains its maximum near the walls (maximal polymer chain extension) and vanishes at the centre due to symmetry. At larger Bingham numbers, the wall values of
$\tau ^p_{xy}$
attains its maximum near the walls (maximal polymer chain extension) and vanishes at the centre due to symmetry. At larger Bingham numbers, the wall values of $\tau ^p_{xy}$
increase, consistent with the established growth of elastic stresses – including the first normal stress difference and polymeric shear stress – with increasing yield stress (Chaparian et al. Reference Chaparian, Ardekani, Brandt and Tammisola2020; Habibi et al. Reference Habibi, Iqbal, Ardekani, Chaparian, Brandt and Tammisola2025). It is worth mentioning that the local deflection of
$\tau ^p_{xy}$
increase, consistent with the established growth of elastic stresses – including the first normal stress difference and polymeric shear stress – with increasing yield stress (Chaparian et al. Reference Chaparian, Ardekani, Brandt and Tammisola2020; Habibi et al. Reference Habibi, Iqbal, Ardekani, Chaparian, Brandt and Tammisola2025). It is worth mentioning that the local deflection of $\tau ^p_{xy}$
near the duct centre is attributed to particle-induced flow disturbances, which slightly distort the stress distribution.
$\tau ^p_{xy}$
near the duct centre is attributed to particle-induced flow disturbances, which slightly distort the stress distribution.
(a) Drag reduction in EVP suspensions at $Bi = 1$
,
$Bi = 1$
, $El = 0.05$
versus particle volume fraction for different particle sizes
$El = 0.05$
versus particle volume fraction for different particle sizes $\kappa = 5-$ $10$
. (b) Normalised wall shear stress in Oldroyd-B (
$10$
. (b) Normalised wall shear stress in Oldroyd-B ( $Bi = 0$
) and Saramito (
$Bi = 0$
) and Saramito ( $Bi = 1$
) suspensions with
$Bi = 1$
) suspensions with $\phi = 10\,\%$
versus Weissenberg number.
$\phi = 10\,\%$
versus Weissenberg number.

To examine the effect of particle size, figure 7(a) shows the drag reduction percentage in EVP suspensions as a function of particle volume fraction for different particle sizes, characterised by blockage ratios in the range $\kappa = 5-$ $10$
. The drag reduction is calculated relative to the corresponding Newtonian suspension at the same solid volume fraction. All EVP cases are computed at
$10$
. The drag reduction is calculated relative to the corresponding Newtonian suspension at the same solid volume fraction. All EVP cases are computed at $Bi = 1$
,
$Bi = 1$
, $El = 0.05$
and
$El = 0.05$
and $Re = 20$
. Note that inertia is significant at both the bulk level and the particle scale. Specifically, the particle Reynolds number – defined as
$Re = 20$
. Note that inertia is significant at both the bulk level and the particle scale. Specifically, the particle Reynolds number – defined as $Re_p=\rho U_bD/\mu$
– takes the values 8, 5 and 4 for
$Re_p=\rho U_bD/\mu$
– takes the values 8, 5 and 4 for $\kappa$
= 5, 8 and 10. This indicates that particle migration and drag-reducing effects remain relevant under moderate inertial conditions. At low volume fractions, EVP suspensions exhibit an initial drag increase compared with their Newtonian counterparts. Interestingly, a transition from drag increase to drag reduction occurs around
$\kappa$
= 5, 8 and 10. This indicates that particle migration and drag-reducing effects remain relevant under moderate inertial conditions. At low volume fractions, EVP suspensions exhibit an initial drag increase compared with their Newtonian counterparts. Interestingly, a transition from drag increase to drag reduction occurs around $\phi \approx 5\,\%$
, marking the cross-over from the dilute to the semi-dilute regime. Beyond this threshold, drag reduction is observed across all particle sizes. For instance, at
$\phi \approx 5\,\%$
, marking the cross-over from the dilute to the semi-dilute regime. Beyond this threshold, drag reduction is observed across all particle sizes. For instance, at $\phi = 10\,\%$
, EVP suspensions with
$\phi = 10\,\%$
, EVP suspensions with $\kappa = 10$
sustain a drag reduction of approximately
$\kappa = 10$
sustain a drag reduction of approximately $10\,\%$
, which is a considerable effect. As discussed earlier, the underlying mechanism behind this behaviour arises from differences in particle migration patterns between Newtonian and EVP flows. In Newtonian fluids, particles undergo lateral migration towards the walls due to the Segré–Silberberg effect (Segré & Silberberg Reference Segré and Silberberg1961), leading to particle accumulation near the boundaries. This accumulation intensifies local velocity disturbances and steepens the near-wall velocity gradients, thereby enhancing viscous stresses (Kazerooni et al. Reference Kazerooni, Fornari, Hussong and Brandt2017). By contrast, EVP suspensions promote particle aggregation within the unyielded plug region, which mitigates their hydrodynamic influence and preserves an almost uniform velocity profile even at finite particle concentrations (see figure 6). In the cases investigated (
$10\,\%$
, which is a considerable effect. As discussed earlier, the underlying mechanism behind this behaviour arises from differences in particle migration patterns between Newtonian and EVP flows. In Newtonian fluids, particles undergo lateral migration towards the walls due to the Segré–Silberberg effect (Segré & Silberberg Reference Segré and Silberberg1961), leading to particle accumulation near the boundaries. This accumulation intensifies local velocity disturbances and steepens the near-wall velocity gradients, thereby enhancing viscous stresses (Kazerooni et al. Reference Kazerooni, Fornari, Hussong and Brandt2017). By contrast, EVP suspensions promote particle aggregation within the unyielded plug region, which mitigates their hydrodynamic influence and preserves an almost uniform velocity profile even at finite particle concentrations (see figure 6). In the cases investigated ( $Bi = 1, El = 0.05$
) the elastic forces are sufficient to drive particles of various sizes (
$Bi = 1, El = 0.05$
) the elastic forces are sufficient to drive particles of various sizes ( $\kappa =5-$
10) towards the central plug region. It should be noted that the plug region in EVP fluids arises from the intrinsic yield stress of the carrier medium. This is fundamentally distinct from the blunted profiles observed in dense Newtonian suspensions (
$\kappa =5-$
10) towards the central plug region. It should be noted that the plug region in EVP fluids arises from the intrinsic yield stress of the carrier medium. This is fundamentally distinct from the blunted profiles observed in dense Newtonian suspensions ( $\phi \gt 20\,\%$
), where a plug-like flow develops through shear-induced migration (Leighton & Acrivos Reference Leighton and Acrivos1987) in the absence of yield stress.
$\phi \gt 20\,\%$
), where a plug-like flow develops through shear-induced migration (Leighton & Acrivos Reference Leighton and Acrivos1987) in the absence of yield stress.
Complete particle focusing at the duct core of EVP fluids requires sufficiently strong elasticity. Li et al. (Reference Li, McKinley and Ardekani2015) for viscoelastic flows reported that this occurs only for $El \geqslant 0.05$
. To illustrate this, figure 7(b) shows the normalised wall shear stress in Saramito suspensions at
$El \geqslant 0.05$
. To illustrate this, figure 7(b) shows the normalised wall shear stress in Saramito suspensions at $Bi = 0$
and
$Bi = 0$
and $Bi = 1$
for varying Weissenberg numbers. In the Newtonian limit (
$Bi = 1$
for varying Weissenberg numbers. In the Newtonian limit ( $Wi=0$
), the drag is maximal; as
$Wi=0$
), the drag is maximal; as $Wi$
increases, it decreases up to
$Wi$
increases, it decreases up to $Wi \approx 1$
and then remains nearly constant up to
$Wi \approx 1$
and then remains nearly constant up to $Wi=2$
. This behaviour reflects the shear-thinning response of EVP suspensions described by the Saramito model (Saramito Reference Saramito2007). The inset of figure 7(b) further highlights the underlying particle dynamics: at low elasticity (
$Wi=2$
. This behaviour reflects the shear-thinning response of EVP suspensions described by the Saramito model (Saramito Reference Saramito2007). The inset of figure 7(b) further highlights the underlying particle dynamics: at low elasticity ( $Wi=0.1$
), particles preferentially accumulate near the walls, while at stronger elasticity (
$Wi=0.1$
), particles preferentially accumulate near the walls, while at stronger elasticity ( $Wi=1$
), they migrate towards the duct core. A similar trend is observed for
$Wi=1$
), they migrate towards the duct core. A similar trend is observed for $Bi = 1$
(red line in panel b). The reduction in wall shear stress thus originates from these elasticity-induced migration patterns: at sufficiently high
$Bi = 1$
(red line in panel b). The reduction in wall shear stress thus originates from these elasticity-induced migration patterns: at sufficiently high $Wi$
, particles are displaced towards the duct centre, thereby weakening particle–wall interactions. For
$Wi$
, particles are displaced towards the duct centre, thereby weakening particle–wall interactions. For $Wi \gtrsim 0.5$
, the resulting core accumulation preserves an almost unchanged velocity profile, keeping viscous stresses nearly constant. This behaviour contrasts with the shear thickening predicted by perturbation analyses for Oldroyd-B shear flows at low
$Wi \gtrsim 0.5$
, the resulting core accumulation preserves an almost unchanged velocity profile, keeping viscous stresses nearly constant. This behaviour contrasts with the shear thickening predicted by perturbation analyses for Oldroyd-B shear flows at low $Wi$
(Einarsson et al. Reference Einarsson, Yang and Shaqfeh2018), which assume a homogeneous particle distribution and neglect migration effects.
$Wi$
(Einarsson et al. Reference Einarsson, Yang and Shaqfeh2018), which assume a homogeneous particle distribution and neglect migration effects.
(a) Fanning friction factor ( $f$
) as a function of particle volume fraction (
$f$
) as a function of particle volume fraction ( $\phi$
) for Newtonian and EVP suspensions with different shear-thinning values (
$\phi$
) for Newtonian and EVP suspensions with different shear-thinning values ( $\alpha$
);
$\alpha$
); $\alpha = 0.2$
denotes the highest degree of shear thinning. (b) Corresponding drag reduction percentage (
$\alpha = 0.2$
denotes the highest degree of shear thinning. (b) Corresponding drag reduction percentage ( $DR$
) for
$DR$
) for $\alpha = 0.2$
relative to Newtonian suspensions at the same
$\alpha = 0.2$
relative to Newtonian suspensions at the same $\phi$
. (c) Mean particle concentration (
$\phi$
. (c) Mean particle concentration ( $\varPhi$
) across varying
$\varPhi$
) across varying $\alpha$
.
$\alpha$
.

Finally, we examine the influence of the shear thinning on the drag characteristics of EVP particle suspensions. To account for the shear-thinning nature of the plastic viscosity, we employ the Saramito–Giesekus constitutive model (Habibi et al. Reference Habibi, Iqbal, Ardekani, Chaparian, Brandt and Tammisola2025), where the mobility parameter $\alpha$
dictates the degree of thinning. Figure 8(a) presents the Fanning friction factor as a function of the solid volume fraction
$\alpha$
dictates the degree of thinning. Figure 8(a) presents the Fanning friction factor as a function of the solid volume fraction $\phi$
across a range of mobility parameters. The baseline case, previously discussed, corresponds to
$\phi$
across a range of mobility parameters. The baseline case, previously discussed, corresponds to $\alpha =0$
(Saramito model) at
$\alpha =0$
(Saramito model) at $Re=20$
,
$Re=20$
, $\kappa =0.2$
,
$\kappa =0.2$
, $El=0.05$
and
$El=0.05$
and $Bi=1$
. To characterise varying levels of shear thinning, we evaluate cases spanning
$Bi=1$
. To characterise varying levels of shear thinning, we evaluate cases spanning $\alpha$
= 0.001–0.2, the latter representing the extreme shear-thinning limit. For comparison, results for Newtonian suspensions at equivalent Reynolds numbers and blockage ratios are also included.
$\alpha$
= 0.001–0.2, the latter representing the extreme shear-thinning limit. For comparison, results for Newtonian suspensions at equivalent Reynolds numbers and blockage ratios are also included.
The results indicate that in the presence of shear-thinning plastic viscosity, the Fanning friction factor is consistently lower than that of the corresponding Newtonian cases. This reduction is attributed to the localised decrease in viscosity near the duct walls – a mechanism explored extensively in our previous study (Habibi et al. Reference Habibi, Iqbal, Ardekani, Chaparian, Brandt and Tammisola2025). As the shear-thinning effect diminishes (i.e. as $\alpha \to 0$
), the friction factor increases monotonically until it recovers the limit of the non-shear-thinning model. In the absence of shear thinning (
$\alpha \to 0$
), the friction factor increases monotonically until it recovers the limit of the non-shear-thinning model. In the absence of shear thinning ( $\alpha =0$
), the drag initially exceeds the Newtonian baseline due to the formation of a central plug region. However, beyond a critical threshold (here,
$\alpha =0$
), the drag initially exceeds the Newtonian baseline due to the formation of a central plug region. However, beyond a critical threshold (here, $\phi \approx 5\,\%$
), the Newtonian drag surpasses that of the EVP suspension, marking the onset of net drag reduction (see figure 3
b). As shown in figure 8(b), strong shear thinning results in a consistently positive drag reduction percentage. However, this percentage decreases as the solid volume fraction increases. This behaviour contrasts sharply with the non-shear-thinning cases, where drag reduction is only realised beyond a specific solid fraction, when the migration towards the centreline significantly reduces the number of particles in the near-wall layer.
$\phi \approx 5\,\%$
), the Newtonian drag surpasses that of the EVP suspension, marking the onset of net drag reduction (see figure 3
b). As shown in figure 8(b), strong shear thinning results in a consistently positive drag reduction percentage. However, this percentage decreases as the solid volume fraction increases. This behaviour contrasts sharply with the non-shear-thinning cases, where drag reduction is only realised beyond a specific solid fraction, when the migration towards the centreline significantly reduces the number of particles in the near-wall layer.
The relationship between $\alpha$
and the spatial distribution of the finite-size particles, the microstructure in the duct flow, is shown in panel (c). At
$\alpha$
and the spatial distribution of the finite-size particles, the microstructure in the duct flow, is shown in panel (c). At $\alpha = 0$
, the particles migrate towards the centre and focus entirely within the duct core. However, as
$\alpha = 0$
, the particles migrate towards the centre and focus entirely within the duct core. However, as $\alpha$
increases, the particles move away from the core towards the walls and corners; by
$\alpha$
increases, the particles move away from the core towards the walls and corners; by $\alpha$
= 0.2, they accumulate primarily near the corners. Particle focusing at the duct corners in Saramito–Giesekus fluids is attributed to the enhancement of inertial forces by shear-thinning viscosity, alongside the emergence of secondary flows (Habibi et al. Reference Habibi, Iqbal, Ardekani, Chaparian, Brandt and Tammisola2025, Reference Habibi, Iqbal, Costa and Tammisola2026). It is important to note that there is a key shift in the drag reduction mechanism. In non-shear-thinning cases, drag reduction is driven by particles focusing in the centre. In the Saramito–Giesekus cases (
$\alpha$
= 0.2, they accumulate primarily near the corners. Particle focusing at the duct corners in Saramito–Giesekus fluids is attributed to the enhancement of inertial forces by shear-thinning viscosity, alongside the emergence of secondary flows (Habibi et al. Reference Habibi, Iqbal, Ardekani, Chaparian, Brandt and Tammisola2025, Reference Habibi, Iqbal, Costa and Tammisola2026). It is important to note that there is a key shift in the drag reduction mechanism. In non-shear-thinning cases, drag reduction is driven by particles focusing in the centre. In the Saramito–Giesekus cases ( $\alpha \gt 0$
), the shear-thinning viscosity of the carrier fluid becomes the governing mechanism. Consequently, the suspension shows a net drag reduction even when particles focus in the corners, which would normally increase the particle contribution to the wall shear stress (Costa et al. Reference Costa, Picano, Brandt and Breugem2016).
$\alpha \gt 0$
), the shear-thinning viscosity of the carrier fluid becomes the governing mechanism. Consequently, the suspension shows a net drag reduction even when particles focus in the corners, which would normally increase the particle contribution to the wall shear stress (Costa et al. Reference Costa, Picano, Brandt and Breugem2016).
4. Concluding remarks
Using fully resolved DNS, we demonstrated that the drag increase with particle volume fraction is markedly weaker in EVP flows than in their Newtonian counterparts. While Newtonian suspensions exhibit drag increases of up to $28\,\%$
at
$28\,\%$
at $\phi = 10\,\%$
, the corresponding increase in EVP suspensions remains below
$\phi = 10\,\%$
, the corresponding increase in EVP suspensions remains below $10\,\%$
. As a result, at sufficiently high concentrations (e.g.
$10\,\%$
. As a result, at sufficiently high concentrations (e.g. $\phi \gt 5\,\%$
for
$\phi \gt 5\,\%$
for $Bi = 1$
), EVP suspensions achieve a net drag reduction of more than
$Bi = 1$
), EVP suspensions achieve a net drag reduction of more than $10\,\%$
relative to Newtonian suspensions. This reduction originates from particle migration towards the duct core, where particles become trapped in the unyielded plug and their slip velocity vanishes. The ensuing core accumulation preserves a velocity profile that is nearly independent of particle loading: viscous stresses remain essentially unchanged, while polymeric stresses increase only moderately with yield stress. Furthermore, we showed that EVP suspensions simulated by Saramito model exhibit pronounced shear thinning over a broad range of Weissenberg numbers. For
$10\,\%$
relative to Newtonian suspensions. This reduction originates from particle migration towards the duct core, where particles become trapped in the unyielded plug and their slip velocity vanishes. The ensuing core accumulation preserves a velocity profile that is nearly independent of particle loading: viscous stresses remain essentially unchanged, while polymeric stresses increase only moderately with yield stress. Furthermore, we showed that EVP suspensions simulated by Saramito model exhibit pronounced shear thinning over a broad range of Weissenberg numbers. For $Wi \gt 0.5$
, migration towards the core strongly suppresses the particle contribution to drag.
$Wi \gt 0.5$
, migration towards the core strongly suppresses the particle contribution to drag.
Overall, our results demonstrate that particle migration induces strong spatial inhomogeneities in pure viscoelastic ( $Bi = 0$
) and EVP suspensions, fundamentally modifying the wall shear stress. In particular, migration-driven structuring must be incorporated into predictive models for natural and industrial flows involving finite-size particles in elastic and yield-stress fluids.
$Bi = 0$
) and EVP suspensions, fundamentally modifying the wall shear stress. In particular, migration-driven structuring must be incorporated into predictive models for natural and industrial flows involving finite-size particles in elastic and yield-stress fluids.
As future directions, our high-fidelity simulations provide a basis for developing drag correlations weighted by the particle distribution relative to the plug. Additionally, we highlight the need for mixture models with migration closures towards unyielded zones to determine if continuum approaches can capture the complex dynamics of EVP suspensions. The present study focused on the dilute and semi-dilute regimes ( $\phi \leqslant 15\,\%$
) to isolate the interactions between the EVP carrier fluid and the particle phase. At higher concentrations, the prevalence of particle–particle contacts may lead to a non-monotonic friction factor. Investigating the dense-suspension effects remains another promising subject for future research.
$\phi \leqslant 15\,\%$
) to isolate the interactions between the EVP carrier fluid and the particle phase. At higher concentrations, the prevalence of particle–particle contacts may lead to a non-monotonic friction factor. Investigating the dense-suspension effects remains another promising subject for future research.
Acknowledgements
The authors acknowledge the computer time provided by SNIC and NAISS (National Academic Infrastructure for Super-computing in Sweden).
Funding
This project has received funding from the European Union’s Horizon 2020 research and innovation program under the Marie Sklodowska-Curie grant agreement No. 955605 YIELDGAP. We gratefully acknowledge the support of European Research Council through Starting Grant MUCUS (Grant No. ERC-StG-2019-852529).
Declaration of interests
The authors report no conflicts of interest.
Appendix A. Methodology for collision modelling and lubrication correction
This section details the soft-sphere collision model and the associated lubrication corrections utilised in the present study following the work of Costa et al. (Reference Costa, Boersma, Westerweel and Breugem2015).
A.1 Lubrication correction
The immersed boundary method employed in this study is capable of resolving hydrodynamic interactions, including lubrication effects. However, the method fails to capture the full lubrication resistance when the gap width $\epsilon$
becomes smaller than the Eulerian grid spacing
$\epsilon$
becomes smaller than the Eulerian grid spacing $\Delta x$
(Breugem Reference Breugem2010). To compensate for the under-resolved flow field within these narrow gaps, we implement a lubrication correction scheme. This scheme focuses primarily on the normal squeezing force, which exhibits a leading-order singularity of
$\Delta x$
(Breugem Reference Breugem2010). To compensate for the under-resolved flow field within these narrow gaps, we implement a lubrication correction scheme. This scheme focuses primarily on the normal squeezing force, which exhibits a leading-order singularity of $1/\epsilon$
. The tangential and rotational components, which diverge only as
$1/\epsilon$
. The tangential and rotational components, which diverge only as $\ln \epsilon$
, are neglected here as they exert a negligible influence on the contact dynamics (Costa et al. Reference Costa, Boersma, Westerweel and Breugem2015).
$\ln \epsilon$
, are neglected here as they exert a negligible influence on the contact dynamics (Costa et al. Reference Costa, Boersma, Westerweel and Breugem2015).
When the dimensionless gap width $\epsilon$
falls below a prescribed resolution threshold
$\epsilon$
falls below a prescribed resolution threshold $\epsilon \lt \epsilon _{\Delta x}$
, the unresolved hydrodynamic interactions are accounted for by introducing a correction force,
$\epsilon \lt \epsilon _{\Delta x}$
, the unresolved hydrodynamic interactions are accounted for by introducing a correction force, $\boldsymbol{F}_{{lub}}$
. This force is formulated according to the asymptotic theory of Jeffrey (Reference Jeffrey1982)
$\boldsymbol{F}_{{lub}}$
. This force is formulated according to the asymptotic theory of Jeffrey (Reference Jeffrey1982)
 \begin{equation} \boldsymbol{F}_{{lub}} = -6 \pi \mu R_p \boldsymbol{u}_{ij,n} \left ( \lambda (\varepsilon ) - \lambda (\varepsilon _{\Delta x}) \right ), \end{equation}
where $R_p$
is the particle radius and
$R_p$
is the particle radius and $\lambda$
is the Stokes amplification factor which are given as
$\lambda$
is the Stokes amplification factor which are given as
 \begin{align} \lambda _{pp}(\epsilon ) = \frac {1}{2\epsilon } - \frac {9}{20} \ln \epsilon - \frac {3}{56} \epsilon \ln \epsilon + \mathcal{O}(1), \end{align}
 \begin{align} \lambda _{pw}(\epsilon ) = \frac {1}{\epsilon } - \frac {1}{5} \ln \epsilon - \frac {1}{21} \epsilon \ln \epsilon + \mathcal{O}(1), \end{align}
for interactions between two equal spheres ( $\lambda _{pp}$
), and between a sphere and a planar wall (
$\lambda _{pp}$
), and between a sphere and a planar wall ( $\lambda _{pw}$
).
$\lambda _{pw}$
).
To ensure numerical stability and account for surface asperities, the lubrication force is regularised at a roughness length scale of $\varepsilon _\sigma = 0.001$
. Following Costa et al. (Reference Costa, Boersma, Westerweel and Breugem2015), the resistance coefficients are saturated for all gaps below this threshold,
$\varepsilon _\sigma = 0.001$
. Following Costa et al. (Reference Costa, Boersma, Westerweel and Breugem2015), the resistance coefficients are saturated for all gaps below this threshold, $\lambda (\epsilon \lt \epsilon _\sigma ) = \lambda ( \epsilon _\sigma )$
, preventing unphysical divergence as
$\lambda (\epsilon \lt \epsilon _\sigma ) = \lambda ( \epsilon _\sigma )$
, preventing unphysical divergence as $\epsilon \to 0$
. The correction scheme is activated only within the under-resolved region (
$\epsilon \to 0$
. The correction scheme is activated only within the under-resolved region ( $\epsilon \lt \epsilon _{\Delta x}$
), with resolution thresholds calibrated at
$\epsilon \lt \epsilon _{\Delta x}$
), with resolution thresholds calibrated at $\epsilon _{\Delta x} = 0.025$
for particle–particle and
$\epsilon _{\Delta x} = 0.025$
for particle–particle and $\epsilon _{\Delta x} = 0.05$
for particle–wall interactions (Costa et al. Reference Costa, Boersma, Westerweel and Breugem2015).
$\epsilon _{\Delta x} = 0.05$
for particle–wall interactions (Costa et al. Reference Costa, Boersma, Westerweel and Breugem2015).
A.2 Collision model
Solid–solid interactions are modelled using a linear spring–dashpot system integrated with a Coulomb friction law to govern normal and tangential contact forces. The normal force, $\boldsymbol{F}_{ij,n}$
, acting on particle i due to contact with particle j, is aligned with the centre-to-centre unit vector
$\boldsymbol{F}_{ij,n}$
, acting on particle i due to contact with particle j, is aligned with the centre-to-centre unit vector $\boldsymbol{n}_{ij} = (\boldsymbol{x}_j - \boldsymbol{x}_i) / \|\boldsymbol{x}_j - \boldsymbol{x}_i\|$
. This force is a function of the overlap distance
$\boldsymbol{n}_{ij} = (\boldsymbol{x}_j - \boldsymbol{x}_i) / \|\boldsymbol{x}_j - \boldsymbol{x}_i\|$
. This force is a function of the overlap distance $\delta _{ij,n}$
and the relative normal velocity
$\delta _{ij,n}$
and the relative normal velocity $\boldsymbol{u}_{ij,n}$
 \begin{equation} \boldsymbol{F}_{ij,n} = -k_n \delta _{ij,n} - \eta _n \boldsymbol{u}_{ij,n}. \end{equation}
Based on a linear harmonic oscillator framework (Van der Hoef, van Sint Annaland & Kuipers Reference Van der Hoef, van Sint Annaland and Kuipers2004), the stiffness ( $k_n$
) and damping (
$k_n$
) and damping ( $\eta _n$
) coefficients are derived as
$\eta _n$
) coefficients are derived as
 \begin{align} k_n = \frac {m_e(\pi ^2 + \ln ^2 e_{n,d})}{(N\Delta t)^2}, \\[-28pt] \nonumber \end{align}
 \begin{align} \eta _n = -\frac {2m_e \ln e_{n,d}}{N\Delta t}. \\[0pt] \nonumber \end{align}
Here, $m_e = (m_i^{-1} + m_j^{-1})^{-1}$
represents the reduced mass, and
$m_e = (m_i^{-1} + m_j^{-1})^{-1}$
represents the reduced mass, and $e_{n,d}$
is the dry coefficient of restitution, prescribed as 0.97 in this study. To ensure numerical stability and sufficient coupling with the fluid solver,
$e_{n,d}$
is the dry coefficient of restitution, prescribed as 0.97 in this study. To ensure numerical stability and sufficient coupling with the fluid solver, $T_n = N \Delta t$
, with
$T_n = N \Delta t$
, with $N=8$
based on the sensitivity studies in Costa et al. (Reference Costa, Boersma, Westerweel and Breugem2015).
$N=8$
based on the sensitivity studies in Costa et al. (Reference Costa, Boersma, Westerweel and Breugem2015).
Resistance to sliding and rolling is captured via the tangential force $\boldsymbol{F}_{ij,t}$
and torque
$\boldsymbol{F}_{ij,t}$
and torque $\boldsymbol{T}_{ij,t}$
. The tangential force is constrained by the Coulomb friction limit
$\boldsymbol{T}_{ij,t}$
. The tangential force is constrained by the Coulomb friction limit
 \begin{equation} \boldsymbol{F}_{ij,t} = \min \left ( \| -k_t \delta _{ij,t} - \eta _t \boldsymbol{u}_{ij,t} \|, \| -\mu _c \boldsymbol{F}_{ij,n} \| \right ) \boldsymbol{t}_{ij}. \end{equation}
In this formulation, $\mu _c$
represents the friction coefficient and is fixed at 0.15,
$\mu _c$
represents the friction coefficient and is fixed at 0.15, $\delta _{ij,t}$
the tangential displacement and
$\delta _{ij,t}$
the tangential displacement and $\boldsymbol{t}_{ij}$
the tangential unit vector. The stiffness (
$\boldsymbol{t}_{ij}$
the tangential unit vector. The stiffness ( $k_t$
) and damping (
$k_t$
) and damping ( $\eta _t$
) parameters are calculated by matching the tangential collision time (
$\eta _t$
) parameters are calculated by matching the tangential collision time ( $T_t$
) to the normal collision time (
$T_t$
) to the normal collision time ( $T_n$
) within the harmonic oscillator framework (Costa et al. Reference Costa, Boersma, Westerweel and Breugem2015)
$T_n$
) within the harmonic oscillator framework (Costa et al. Reference Costa, Boersma, Westerweel and Breugem2015)
 \begin{equation} k_t = \frac {m_{e,t}(\pi ^2 + \ln ^2 e_{t,d})}{(N\Delta t)^2}, \quad \eta _t = -\frac {2m_{e,t} \ln e_{t,d}}{N\Delta t}. \end{equation}
Here, the dry tangential coefficient of restitution, $e_{t,d}$
, is fixed at 0.1. Furthermore, the rotational inertia of the colliding pair is accounted for by the effective tangential reduced mass,
$e_{t,d}$
, is fixed at 0.1. Furthermore, the rotational inertia of the colliding pair is accounted for by the effective tangential reduced mass, $m_{e,t}$
, as defined in Costa et al. (Reference Costa, Boersma, Westerweel and Breugem2015).
$m_{e,t}$
, as defined in Costa et al. (Reference Costa, Boersma, Westerweel and Breugem2015).
Please note that particle–wall contact is treated as a collision with an infinitely large sphere, where the reduced mass becomes $m_e = m_i$
and the overlap
$m_e = m_i$
and the overlap $\delta _{iw,n}$
is calculated relative to the planar surface of the wall.
$\delta _{iw,n}$
is calculated relative to the planar surface of the wall.
Appendix B. Steady state, averaging and migration rate
The steady state is defined as the point where the cumulative mean of the drag force stabilises within a 1 % tolerance of the final average. To ensure that the reported drag forces represent steady-state values, all hydrodynamic data were sampled exclusively after the identified steady-state time $T_s$
. Furthermore, the collection period extended long after the initial stabilisation to guarantee that the statistics were fully converged and independent of any residual transients. For the case of
$T_s$
. Furthermore, the collection period extended long after the initial stabilisation to guarantee that the statistics were fully converged and independent of any residual transients. For the case of $\phi = 10\,\%$
,
$\phi = 10\,\%$
, $Bi = 1$
and
$Bi = 1$
and $El = 0.05$
, we display the raw drag, cumulative mean, steady time and averaging window in figure 9. Furthermore, in table 1, we report the dimensionless time
$El = 0.05$
, we display the raw drag, cumulative mean, steady time and averaging window in figure 9. Furthermore, in table 1, we report the dimensionless time $T_s$
needed for the simulations to reach their final steady state and the averaging window used in this study for representative cases with different solid volume fraction, Bingham and elasticity numbers. Time is non-dimensionalised by
$T_s$
needed for the simulations to reach their final steady state and the averaging window used in this study for representative cases with different solid volume fraction, Bingham and elasticity numbers. Time is non-dimensionalised by $H/U$
.
$H/U$
.
Summary of convergence parameters. Here, $T_s$
denotes the dimensionless steady-state time, while
$T_s$
denotes the dimensionless steady-state time, while $[t_{start}, t_{end}]$
indicates the statistical averaging window and
$[t_{start}, t_{end}]$
indicates the statistical averaging window and $t_{90}$
represents the focusing time scale required to reach 90 % of core particle occupancy.
$t_{90}$
represents the focusing time scale required to reach 90 % of core particle occupancy.

Temporal evolution of the dimensionless drag force for $\phi = 10\,\%$
,
$\phi = 10\,\%$
, $Bi = 1$
and
$Bi = 1$
and $El = 0.05$
. The plot displays the raw drag signal alongside the cumulative mean, illustrating the decay of the initial transient overshoot (
$El = 0.05$
. The plot displays the raw drag signal alongside the cumulative mean, illustrating the decay of the initial transient overshoot ( $t \lt 100$
). The dashed vertical line indicates the identified steady-state time
$t \lt 100$
). The dashed vertical line indicates the identified steady-state time $T_s$
, beyond which the cumulative mean stabilises within the defined tolerance. The shaded green region highlights the averaging window used for calculating the final statistical steady-state values.
$T_s$
, beyond which the cumulative mean stabilises within the defined tolerance. The shaded green region highlights the averaging window used for calculating the final statistical steady-state values.

To quantify the particle migration rate, we track the temporal evolution of the solid fraction within the duct core. The core region is defined as the central $10\,\% \times 10\,\%$
area of the cross-section (
$10\,\% \times 10\,\%$
area of the cross-section ( $72 \leqslant \{x,z\} \leqslant 88$
on our
$72 \leqslant \{x,z\} \leqslant 88$
on our $160 \times 160$
grid). For each recorded time step, we calculate the mean solid fraction within this region,
$160 \times 160$
grid). For each recorded time step, we calculate the mean solid fraction within this region, $\phi _{core}(t)$
. The focusing time scale,
$\phi _{core}(t)$
. The focusing time scale, $t_{90}$
, is defined as the dimensionless time required for the core concentration to reach
$t_{90}$
, is defined as the dimensionless time required for the core concentration to reach $90\,\%$
of its final steady-state value,
$90\,\%$
of its final steady-state value, $\phi _{ss}$
. This is determined using the relation
$\phi _{ss}$
. This is determined using the relation
 \begin{equation} \phi _{core}(t_{90}) = \phi _{0} + 0.9(\phi _{ss} - \phi _{0}), \end{equation}
where $\phi _{0}$
is the initial core concentration. This metric effectively characterises the duration of the transition from a uniform distribution to the central accumulation. The results for the representative cases are provided in table 1, where the migration rates are quantified using the focusing time scale
$\phi _{0}$
is the initial core concentration. This metric effectively characterises the duration of the transition from a uniform distribution to the central accumulation. The results for the representative cases are provided in table 1, where the migration rates are quantified using the focusing time scale $t_{90}$
. The time to convergence seems to mainly scale with the particle volume fraction, with low volume fractions (1 %) requiring longer times to reach the steady state.
$t_{90}$
. The time to convergence seems to mainly scale with the particle volume fraction, with low volume fractions (1 %) requiring longer times to reach the steady state.


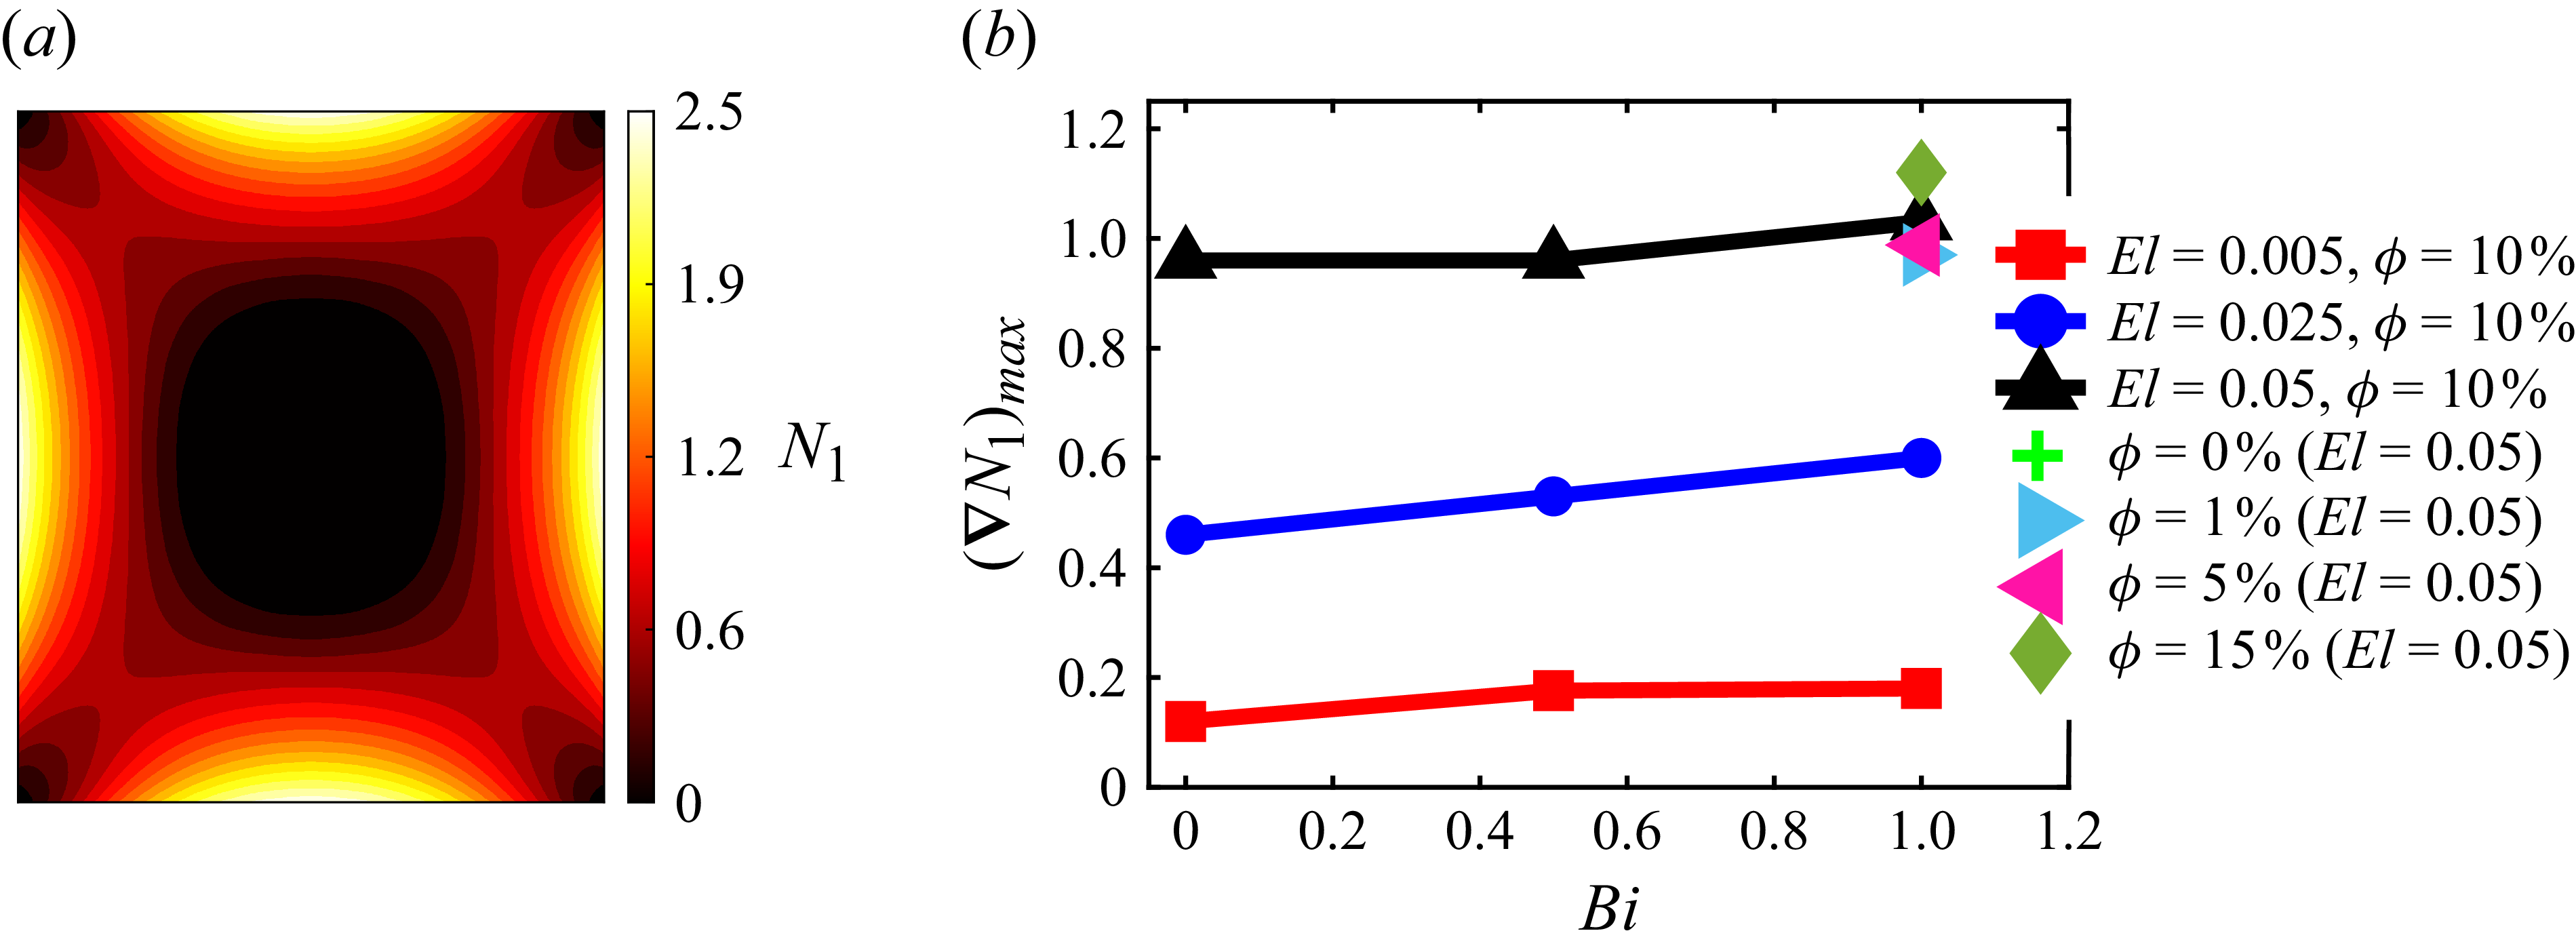


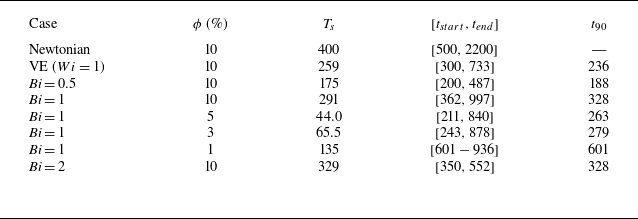


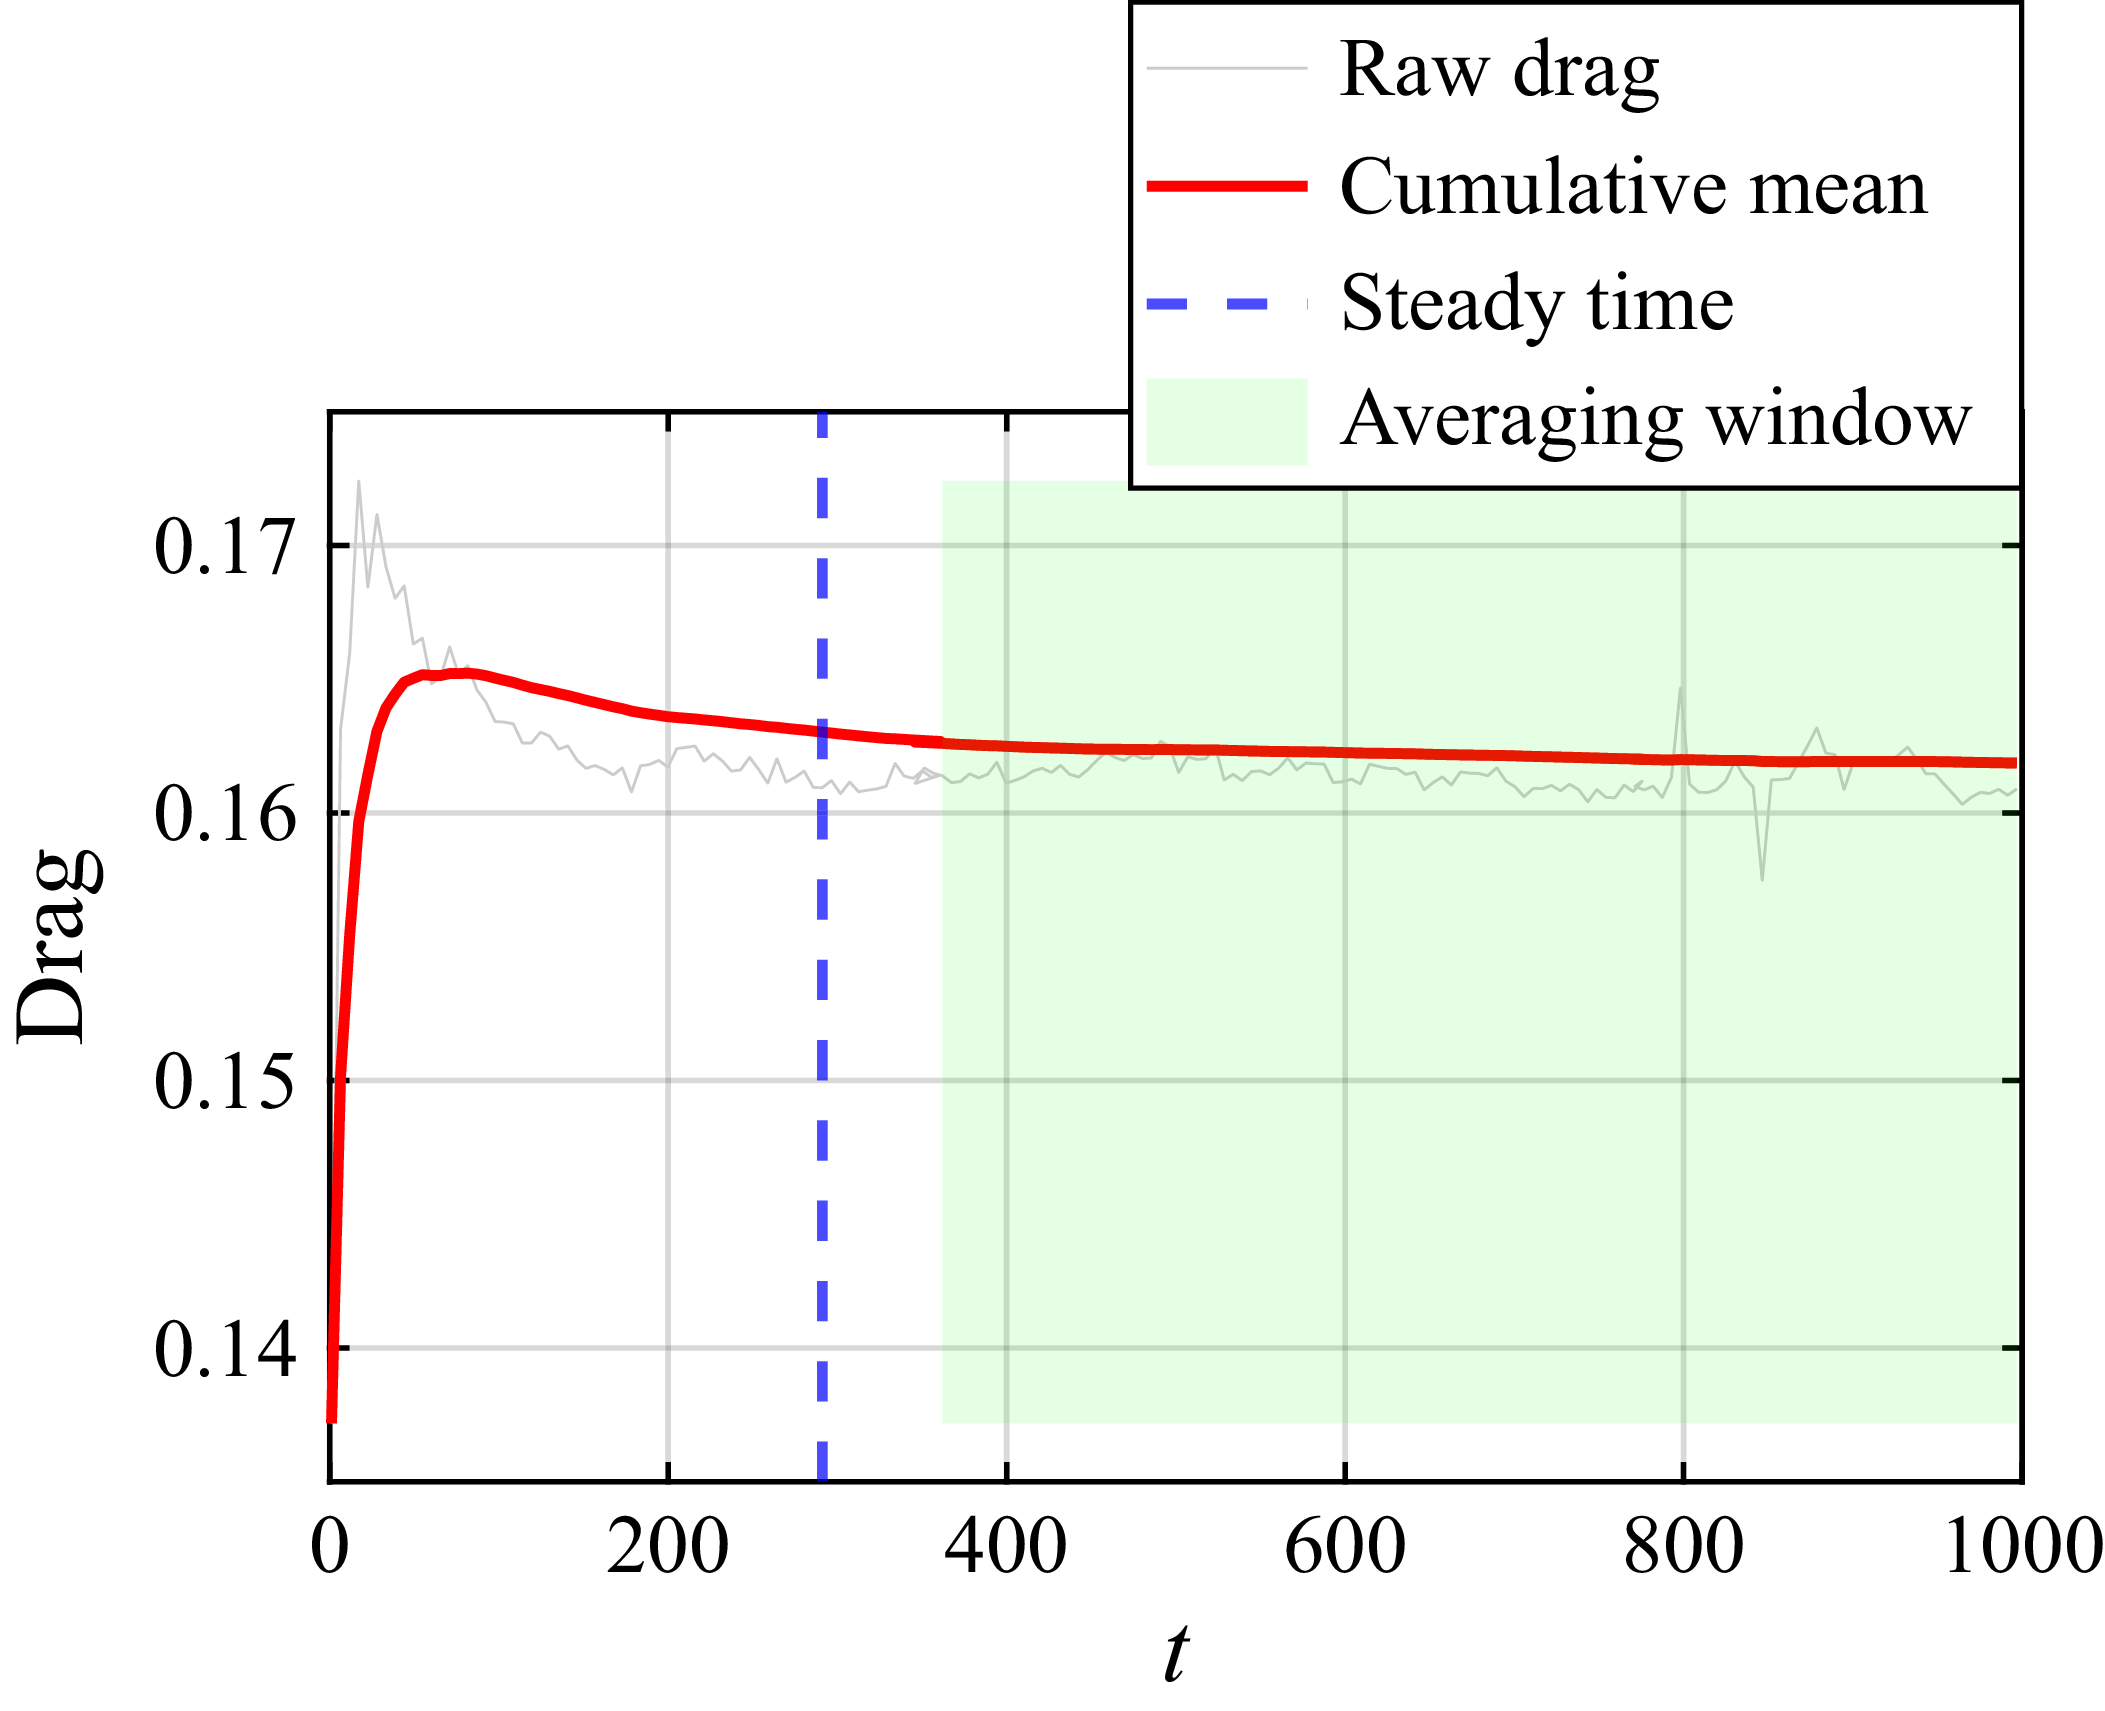


 Open access

