


1. Introduction
Cavitation occurs when the liquid pressure drops below the saturated vapour pressure. Commonly observed in turbomachinery and marine applications, cavitation is often associated with noise, material damage and loss of efficiency of the propulsion systems (Arndt Reference Arndt2002). Vortices shed from the propeller blades and propeller hub usually have a lower core pressure, making them susceptible to cavitation. Tip vortex cavitation (TVC) has been widely studied over the past several years (McCormick Reference McCormick1962; Arndt & Keller Reference Arndt and Keller1992) and the key parameter determining the nature cavitation is the cavitation number ( $\sigma$
) defined as follows:
$\sigma$
) defined as follows:
 \begin{align} \sigma = \frac {p_v - p_\infty }{0.5 \rho _\infty u_\infty ^2}, \end{align}
where $p_v$
,
$p_v$
, $p_\infty$
,
$p_\infty$
, $u_\infty$
and
$u_\infty$
and $\rho _\infty$
denote the saturated vapour pressure, reference pressure, velocity and density, respectively. At lower
$\rho _\infty$
denote the saturated vapour pressure, reference pressure, velocity and density, respectively. At lower $\sigma$
, inception in the tip vortex occurs near the trailing edge (at the location of mean pressure minimum) and the vapour cavity formed sustains a few chordlengths downstream (Arndt, Arakeri & Higuchi Reference Arndt, Arakeri and Higuchi1991).
$\sigma$
, inception in the tip vortex occurs near the trailing edge (at the location of mean pressure minimum) and the vapour cavity formed sustains a few chordlengths downstream (Arndt, Arakeri & Higuchi Reference Arndt, Arakeri and Higuchi1991).
Experiments on ducted propulsor at higher $\sigma$
(Chesnakas & Jessup Reference Chesnakas and Jessup2003; Oweis & Ceccio Reference Oweis and Ceccio2005) revealed that cavitation inception events in the wake were intermittent and occurred at further downstream locations from the mean minimum pressure location of the leakage vortex, where the trailing edge vortices and the leakage vortices appeared to merge. Also, inception occurred in the weaker trailing-edge vortices, although the stronger leakage vortices have a lower mean core pressure. Similar observations were reported in earlier studies on turbulent shear layers (Katz & O’Hern Reference Katz and O’Hern1986; O’Hern Reference O’Hern1990; Belahadji, Franc & Michel Reference Belahadji, Franc and Michel1995) and turbulent jets (Gopalan, Katz & Knio Reference Gopalan, Katz and Knio1999), where inception intermittently occurred in the weaker quasi-streamwise vortices developing between the stronger spanwise eddies. This behaviour was mainly attributed to the stretching of the weaker vortex due to the strain field of the stronger vortex, causing its pressure to drop significantly. Circulation strength measurements (Jimenez Reference Jimenez1983; Bell & Mehta Reference Bell and Mehta1992) of these vortices revealed that the quasi-streamwise vortices are an order of magnitude weaker than the spanwise vortices. O’Hern (Reference O’Hern1990) used micro-bubbles as sensors and reported negative pressure fluctuations of up to
$\sigma$
(Chesnakas & Jessup Reference Chesnakas and Jessup2003; Oweis & Ceccio Reference Oweis and Ceccio2005) revealed that cavitation inception events in the wake were intermittent and occurred at further downstream locations from the mean minimum pressure location of the leakage vortex, where the trailing edge vortices and the leakage vortices appeared to merge. Also, inception occurred in the weaker trailing-edge vortices, although the stronger leakage vortices have a lower mean core pressure. Similar observations were reported in earlier studies on turbulent shear layers (Katz & O’Hern Reference Katz and O’Hern1986; O’Hern Reference O’Hern1990; Belahadji, Franc & Michel Reference Belahadji, Franc and Michel1995) and turbulent jets (Gopalan, Katz & Knio Reference Gopalan, Katz and Knio1999), where inception intermittently occurred in the weaker quasi-streamwise vortices developing between the stronger spanwise eddies. This behaviour was mainly attributed to the stretching of the weaker vortex due to the strain field of the stronger vortex, causing its pressure to drop significantly. Circulation strength measurements (Jimenez Reference Jimenez1983; Bell & Mehta Reference Bell and Mehta1992) of these vortices revealed that the quasi-streamwise vortices are an order of magnitude weaker than the spanwise vortices. O’Hern (Reference O’Hern1990) used micro-bubbles as sensors and reported negative pressure fluctuations of up to $300\,\%$
of the free stream dynamic pressure at
$300\,\%$
of the free stream dynamic pressure at $ \textit{Re}(O(10^6))$
in the quasi-streamwise vortices. Recent experiments on the turbulent shear layer behind a backward-facing step (Agarwal et al. Reference Agarwal, Ram, Lu and Katz2023) provided more insight into cavitation inception in the weaker vortex. Using particle image velocimetry measurements, the authors proposed the dynamic stretching–contraction oscillation cycle in the weaker vortex induced by non-uniform axial strain as the primary mechanism responsible for cavitation inception.
$ \textit{Re}(O(10^6))$
in the quasi-streamwise vortices. Recent experiments on the turbulent shear layer behind a backward-facing step (Agarwal et al. Reference Agarwal, Ram, Lu and Katz2023) provided more insight into cavitation inception in the weaker vortex. Using particle image velocimetry measurements, the authors proposed the dynamic stretching–contraction oscillation cycle in the weaker vortex induced by non-uniform axial strain as the primary mechanism responsible for cavitation inception.
Vortex interactions are often associated with phenomena such as three-dimensional instabilities (Crow Reference Crow1970; Klein, Majda & Damodaran Reference Klein, Majda and Damodaran1995; Spalart Reference Spalart1998; Fabre, Jacquin & Loof Reference Fabre, Jacquin and Loof2002; Kerswell Reference Kerswell2002), core deformation (Moore & Saffman Reference Moore and Saffman1971, Reference Moore and Saffman1975; Brandt & Nomura Reference Brandt and Nomura2010), non-uniform axial stretching (Melander & Hussain Reference Melander and Hussain1994; Verzicco et al. Reference Verzicco, Jiménez and Orlandi1995, Reference Verzicco, Jiménez and Orlandi1999; Pradeep & Hussain Reference Pradeep and Hussain2001) or turbulence (Devenport, Zsoldos & Vogel Reference Devenport, Zsoldos and Vogel1997). Co-rotating vortices are unstable to short wavelength perturbations, and inception in the weaker vortex occurs only after the stronger vortex incepts (Chang et al. Reference Chang, Yakushiji, Dowling and Ceccio2007). However, the weaker vortex alone can undergo cavitation inception for a pair of counter-rotating vortices. A counter-rotating pair is susceptible to long-wavelength perturbations. For an equal strength configuration, Crow (Reference Crow1970) developed a linear stability framework and found the instability wavelength to be much larger than the vortex separation distance. The instability grows due to the combined effect of mutual and self-induction, resulting in the bending of the vortex axis, and the nonlinear interactions result in the classic ‘vortex reconnection’ phenomenon (Kida & Takaoka Reference Kida and Takaoka1994; Yao & Hussain Reference Yao and Hussain2022). Crow’s linear framework was extended to account for vortices of different circulation strengths (Klein et al. Reference Klein, Majda and Damodaran1995; Bristol et al. Reference Bristol, Ortega, Marcus and Savas2004) and the most unstable wavelength decreased as $\varGamma$
decreased (circulation strength ratio of the weaker to stronger vortices). Ortega, Bristol & Savas (Reference Ortega, Bristol and Savas2003) examined counter-rotating vortex pairs generated in the wake of a towed wing at high Reynolds number (
$\varGamma$
decreased (circulation strength ratio of the weaker to stronger vortices). Ortega, Bristol & Savas (Reference Ortega, Bristol and Savas2003) examined counter-rotating vortex pairs generated in the wake of a towed wing at high Reynolds number ( $O(10^5)$
). With the growth of the Crow instability, the weaker vortex wrapped around the stronger vortex due to intense vortex stretching and eventually transitioned into vortex rings that drifted away from the stronger vortex. Marshall, Brancher & Giovannini (Reference Marshall, Brancher and Giovannini2001) conducted a parametric study using direct numerical simulation (DNS) by varying
$O(10^5)$
). With the growth of the Crow instability, the weaker vortex wrapped around the stronger vortex due to intense vortex stretching and eventually transitioned into vortex rings that drifted away from the stronger vortex. Marshall, Brancher & Giovannini (Reference Marshall, Brancher and Giovannini2001) conducted a parametric study using direct numerical simulation (DNS) by varying $\varGamma$
from
$\varGamma$
from $-1$
to
$-1$
to $-0.25$
at
$-0.25$
at $ \textit{Re}_\varGamma = 1500$
. They noted that the stretching intensities in the weaker vortex decreased as
$ \textit{Re}_\varGamma = 1500$
. They noted that the stretching intensities in the weaker vortex decreased as $\varGamma$
is reduced. As the cores approached close to each other, a significant decrease in the circulation strength of each core due to strong cross-diffusion effects was consistent in all cases.
$\varGamma$
is reduced. As the cores approached close to each other, a significant decrease in the circulation strength of each core due to strong cross-diffusion effects was consistent in all cases.
Chang et al. (Reference Chang, Choi, Yakushiji and Ceccio2012), Knister et al. (Reference Knister, Callison, Ganesh and Ceccio2020) and Knister, Ganesh & Ceccio (Reference Knister, Ganesh and Ceccio2024) performed experiments on a counter-rotating vortex pair produced by hydrofoils to examine cavitation inception for various combinations of $\varGamma$
,
$\varGamma$
, $r_w/b$
,
$r_w/b$
, $r_{\kern-1pt s}/b$
and
$r_{\kern-1pt s}/b$
and $ \textit{Re}$
(where
$ \textit{Re}$
(where $r_w$
and
$r_w$
and $r_{\kern-1pt s}$
are the initial core sizes of weaker and stronger vortices, and
$r_{\kern-1pt s}$
are the initial core sizes of weaker and stronger vortices, and $b$
is the unperturbed distance between the vortices). Chang et al. (Reference Chang, Choi, Yakushiji and Ceccio2012) estimated core pressure changes based on core size and circulation measurements, and inferred that vortex stretching alone is insufficient to cause cavitation inception. They hypothesised the presence of an axial jet based on the asymmetric growth of the cavitating bubbles observed visually. However, Knister et al. (Reference Knister, Ganesh and Ceccio2024) performed detailed velocity measurements in the region of three-dimensional interactions and did not observe any significant axial jet in the inception regions. The estimated pressure drop from the velocity field suggested that the axial stretching of the secondary vortex alone was sufficient to cause inception.
$b$
is the unperturbed distance between the vortices). Chang et al. (Reference Chang, Choi, Yakushiji and Ceccio2012) estimated core pressure changes based on core size and circulation measurements, and inferred that vortex stretching alone is insufficient to cause cavitation inception. They hypothesised the presence of an axial jet based on the asymmetric growth of the cavitating bubbles observed visually. However, Knister et al. (Reference Knister, Ganesh and Ceccio2024) performed detailed velocity measurements in the region of three-dimensional interactions and did not observe any significant axial jet in the inception regions. The estimated pressure drop from the velocity field suggested that the axial stretching of the secondary vortex alone was sufficient to cause inception.
The unsteady, complex nature of vortex interactions makes the strain field analysis and its effect on cavitation inception a very challenging task. We perform large-eddy simulation (LES) of the experimental configuration of a hydrofoil pair (Knister et al. Reference Knister, Callison, Ganesh and Ceccio2020) at a chord-based Reynolds number ( $ \textit{Re}$
) of
$ \textit{Re}$
) of $1.7 \times 10^6$
to analyse the inception mechanisms when the unequal strength counter-rotating vortices interact in the wake. Choosing such a canonical configuration offers better control over the vortex properties while allowing for analysis of inception mechanisms. To the best of the authors’ knowledge, no extensive computational studies have been conducted to study cavitation inception during such vortex interactions. The paper is organised as follows. The numerical method is discussed in § 2. The problem set-up and mesh details are presented in § 3. The validation of the LES results is shown in § 4. In § 5, the core properties prior to the onset of Crow instability are examined. The evolution of Crow instability, and the subsequent effect on the weaker vortex axial stretching and core pressure are studied in § 6. The paper concludes with a brief summary in § 7.
$1.7 \times 10^6$
to analyse the inception mechanisms when the unequal strength counter-rotating vortices interact in the wake. Choosing such a canonical configuration offers better control over the vortex properties while allowing for analysis of inception mechanisms. To the best of the authors’ knowledge, no extensive computational studies have been conducted to study cavitation inception during such vortex interactions. The paper is organised as follows. The numerical method is discussed in § 2. The problem set-up and mesh details are presented in § 3. The validation of the LES results is shown in § 4. In § 5, the core properties prior to the onset of Crow instability are examined. The evolution of Crow instability, and the subsequent effect on the weaker vortex axial stretching and core pressure are studied in § 6. The paper concludes with a brief summary in § 7.
2. Numerical method
Vortex stretching can substantially reduce the core size, and resolving the small core as well as the thin hydrofoil boundary layer (due to the high Re) requires a highly refined mesh. Such a fine resolution would require at least $2.5$
billion cells on a single mesh making the current simulations very expensive. Therefore, the overset method is adopted, which provides the flexibility of having multiple sub-domains/patches with varying levels of mesh refinement. This approach reduces the final cell count by almost
$2.5$
billion cells on a single mesh making the current simulations very expensive. Therefore, the overset method is adopted, which provides the flexibility of having multiple sub-domains/patches with varying levels of mesh refinement. This approach reduces the final cell count by almost $50 \,\%$
to
$50 \,\%$
to $1.4$
billion cells. We use the overset methodology developed by Horne & Mahesh (Reference Horne and Mahesh2019a
,Reference Horne and Mahesh
b
), which solves the incompressible Navier–Stokes equations using a finite-volume discretisation approach on unstructured grids. This method uses the algorithm developed by Mahesh, Constantinescu & Moin (Reference Mahesh, Constantinescu and Moin2004), which ensures discrete kinetic energy conservation at high
$1.4$
billion cells. We use the overset methodology developed by Horne & Mahesh (Reference Horne and Mahesh2019a
,Reference Horne and Mahesh
b
), which solves the incompressible Navier–Stokes equations using a finite-volume discretisation approach on unstructured grids. This method uses the algorithm developed by Mahesh, Constantinescu & Moin (Reference Mahesh, Constantinescu and Moin2004), which ensures discrete kinetic energy conservation at high $ \textit{Re}$
without added numerical dissipation. The governing equations are shown as follows:
$ \textit{Re}$
without added numerical dissipation. The governing equations are shown as follows:
 \begin{align} & \frac {\partial \bar {u}_{\kern-1.5pt j}}{\partial x_{\kern-1.5pt j}} = 0 , \nonumber\\& \frac {\partial \bar {u}_i}{\partial t} + \frac {\partial \bar {u}_i \bar {u}_{\kern-1.5pt j}}{\partial x_{\kern-1.5pt j}} = -\frac {\partial \bar {p}}{\partial x_i} + \nu \frac {\partial ^2 \bar {u}_i}{\partial x_{\kern-1.5pt j}^2} + \frac {\partial \tau _{\textit{ij}}}{\partial x_{\kern-1.5pt j}}. \end{align}
Here, $u_i$
,
$u_i$
, $p$
and
$p$
and $\nu$
are the velocity, pressure and kinematic viscosity, respectively. The bar symbol denotes the spatial filter and
$\nu$
are the velocity, pressure and kinematic viscosity, respectively. The bar symbol denotes the spatial filter and $\tau _{\textit{ij}}$
is the sub-grid stress term (
$\tau _{\textit{ij}}$
is the sub-grid stress term ( $\tau _{\textit{ij}} = \overline {u_iu_{\kern-1.5pt j}}{ -} \bar {u}_i\bar {u}_{\kern-1.5pt j}$
). The sub-grid stress term is computed using the dynamic Smagorinsky model (Germano et al. Reference Germano, Piomelli, Moin and Cabot1991). A predictor–corrector approach is used where the velocities are first predicted by solving the momentum equation and then corrected using the pressure Poisson equation to satisfy the continuity equation. The implicit Crank–Nicolson scheme is used for the temporal advancement of the solution. The key challenges of the overset method are its scalability and errors arising from interpolation across the overset meshes, especially with different resolutions. Horne & Mahesh (Reference Horne and Mahesh2019a
) addressed the first challenge by developing a novel parallel communication structure to minimise global communication and storage. This allows the overset method to scale to
$\tau _{\textit{ij}} = \overline {u_iu_{\kern-1.5pt j}}{ -} \bar {u}_i\bar {u}_{\kern-1.5pt j}$
). The sub-grid stress term is computed using the dynamic Smagorinsky model (Germano et al. Reference Germano, Piomelli, Moin and Cabot1991). A predictor–corrector approach is used where the velocities are first predicted by solving the momentum equation and then corrected using the pressure Poisson equation to satisfy the continuity equation. The implicit Crank–Nicolson scheme is used for the temporal advancement of the solution. The key challenges of the overset method are its scalability and errors arising from interpolation across the overset meshes, especially with different resolutions. Horne & Mahesh (Reference Horne and Mahesh2019a
) addressed the first challenge by developing a novel parallel communication structure to minimise global communication and storage. This allows the overset method to scale to $O(10^5)$
meshes and processors. To minimise the interpolation errors, a supercell is created from the control volumes overlapping with the ghost cell (Horne & Mahesh Reference Horne and Mahesh2019b
). Instead of directly interpolating from the boundary control volumes to the ghost cell, flow quantities at the super cell centre are initially computed using a least-squares reconstruction from the member control volumes. These values are then interpolated to the ghost cell. The interpolation is spatially second-order accurate, preserving the overall second-order spatial accuracy of the overset method.
$O(10^5)$
meshes and processors. To minimise the interpolation errors, a supercell is created from the control volumes overlapping with the ghost cell (Horne & Mahesh Reference Horne and Mahesh2019b
). Instead of directly interpolating from the boundary control volumes to the ghost cell, flow quantities at the super cell centre are initially computed using a least-squares reconstruction from the member control volumes. These values are then interpolated to the ghost cell. The interpolation is spatially second-order accurate, preserving the overall second-order spatial accuracy of the overset method.
3. Problem set-up and mesh details
We simulate the experimental condition (case $8$
, table 2) reported by Knister et al. (Reference Knister, Callison, Ganesh and Ceccio2020). Figures 1(
$8$
, table 2) reported by Knister et al. (Reference Knister, Callison, Ganesh and Ceccio2020). Figures 1( $a$
) and 1(
$a$
) and 1( $b$
) show the
$b$
) show the $x$
–
$x$
– $z$
and
$z$
and $y$
–
$y$
– $z$
views of the set-up of the hydrofoil pair generating counter-rotating vortices. The bottom rectangular hydrofoil has a flat tip and an angle of attack of 6
$z$
views of the set-up of the hydrofoil pair generating counter-rotating vortices. The bottom rectangular hydrofoil has a flat tip and an angle of attack of 6 $^\circ$
. The tapered foil at the top has a rounded tip with −1.5
$^\circ$
. The tapered foil at the top has a rounded tip with −1.5 $^\circ$
angle of attack. The rectangular foil generates the stronger vortex and the weaker vortex is generated by the tapered foil. The chord length (
$^\circ$
angle of attack. The rectangular foil generates the stronger vortex and the weaker vortex is generated by the tapered foil. The chord length ( $c$
) is
$c$
) is $169\rm \,mm$
and the distance between the trailing edge of both the foils (
$169\rm \,mm$
and the distance between the trailing edge of both the foils ( $d$
) is
$d$
) is $11\rm\,mm$
. The flow is from right to left with free stream velocity (
$11\rm\,mm$
. The flow is from right to left with free stream velocity ( $U_{\infty }$
) of
$U_{\infty }$
) of $10\,\rm m\,s^{- 1}$
and an ambient pressure (
$10\,\rm m\,s^{- 1}$
and an ambient pressure ( $P_{\infty }$
) of
$P_{\infty }$
) of $1$
atm. The Reynolds number (
$1$
atm. The Reynolds number ( $ \textit{Re}$
) based on chord length and free stream velocity is
$ \textit{Re}$
) based on chord length and free stream velocity is $1.69 \times 10^6$
. The streamwise direction aligns with the
$1.69 \times 10^6$
. The streamwise direction aligns with the $x$
axis, while the
$x$
axis, while the $y$
and
$y$
and $z$
axes denote the wall-normal and spanwise directions, respectively. The origin (
$z$
axes denote the wall-normal and spanwise directions, respectively. The origin ( $x/c = 0$
) is at the trailing edge and the domain dimensions are shown as follows
$x/c = 0$
) is at the trailing edge and the domain dimensions are shown as follows
 \begin{align} -1.5 \lt x/c \lt 4.0; \quad -0.63 \lt y/c \lt 0.63; \quad 0.3 \lt z/c \lt 1.6. \end{align}
Schematic of the set-up: ( $a$
)
$a$
) $x$
–
$x$
– $z$
view and (
$z$
view and ( $b$
)
$b$
) $y$
–
$y$
– $z$
view. (
$z$
view. ( $c$
) Layout of the five overset patches in the wake. (
$c$
) Layout of the five overset patches in the wake. ( $d$
) Mesh resolution contrast between patches
$d$
) Mesh resolution contrast between patches $P_2$
and
$P_2$
and $P_3$
, highlighting local refinement in the inception (
$P_3$
, highlighting local refinement in the inception ( $P_3$
) regions.
$P_3$
) regions.

Figure 1( $c$
) illustrates the layout of the overset meshes in the computational domain. Each hydrofoil has its own mesh and the wake is divided into five regions with different resolutions. The near-wake patch (
$c$
) illustrates the layout of the overset meshes in the computational domain. Each hydrofoil has its own mesh and the wake is divided into five regions with different resolutions. The near-wake patch ( $P_1$
) extends from the trailing edge to approximately one chord length downstream (
$P_1$
) extends from the trailing edge to approximately one chord length downstream ( $x/c \sim 0.904$
), followed by
$x/c \sim 0.904$
), followed by $P_2$
(
$P_2$
( $x/c: 0.896 {-} 1.154$
),
$x/c: 0.896 {-} 1.154$
), $P_3$
(
$P_3$
( $x/c: 1.146 {-} 1.454$
),
$x/c: 1.146 {-} 1.454$
), $P_4$
(
$P_4$
( $x/c: 1.446 {-} 2.004$
) and
$x/c: 1.446 {-} 2.004$
) and $P_5$
(
$P_5$
( $x/c = 1.996$
–close to the outflow boundary). In the wake region, vortex interactions are predominantly two-dimensional up to
$x/c = 1.996$
–close to the outflow boundary). In the wake region, vortex interactions are predominantly two-dimensional up to $x/c \sim 0.9 {-} 1.0$
. The computational cell size in the plane normal to the streamwise direction is
$x/c \sim 0.9 {-} 1.0$
. The computational cell size in the plane normal to the streamwise direction is $h = 0.0007c$
. This resolution was found to be sufficient to capture the vortex properties in the near wake (validation with experimental results discussed in § 4).
$h = 0.0007c$
. This resolution was found to be sufficient to capture the vortex properties in the near wake (validation with experimental results discussed in § 4).
Beyond $x/c = 0.9$
, three-dimensional sinusoidal instabilities develop on the weaker vortex. Subsequent inception events, defined as core pressure falling below vapour pressure, are primarily observed in the range of
$x/c = 0.9$
, three-dimensional sinusoidal instabilities develop on the weaker vortex. Subsequent inception events, defined as core pressure falling below vapour pressure, are primarily observed in the range of $x/c: 1.0 {-} 2.0$
. Hence, a mesh refinement analysis is performed in this region with four different resolutions (denoted
$x/c: 1.0 {-} 2.0$
. Hence, a mesh refinement analysis is performed in this region with four different resolutions (denoted $M_1$
–
$M_1$
– $M_4$
) and the pressure coefficient (
$M_4$
) and the pressure coefficient ( $C_{\kern-1pt p}$
) is used to assess the grid requirement. Here,
$C_{\kern-1pt p}$
) is used to assess the grid requirement. Here, $C_{\kern-1pt p}$
is defined as follows:
$C_{\kern-1pt p}$
is defined as follows:
 \begin{align} C_{\kern-1pt p} = (P - P_{\infty })/\big (0.5\rho _{\infty } U_{\infty }^2\big ), \end{align}
where $\rho _{\infty } = 1000\rm \,kg\,m^{- 3}$
. The saturation vapour pressure at room temperature is approximately
$\rho _{\infty } = 1000\rm \,kg\,m^{- 3}$
. The saturation vapour pressure at room temperature is approximately $2000\,\mathrm{Pa}$
, which yields the non-dimensional saturation pressure of
$2000\,\mathrm{Pa}$
, which yields the non-dimensional saturation pressure of $C_{p_v} \sim -2.0$
. For the coarsest mesh (
$C_{p_v} \sim -2.0$
. For the coarsest mesh ( $M_1$
), the near-wake resolution (
$M_1$
), the near-wake resolution ( $h/c = 0.0007$
) is maintained till the outflow. The weaker core pressure dropped to
$h/c = 0.0007$
) is maintained till the outflow. The weaker core pressure dropped to $C_{\kern-1pt p} \sim -1.1$
before diffusion effects became dominant, possibly due to insufficient resolution. For
$C_{\kern-1pt p} \sim -1.1$
before diffusion effects became dominant, possibly due to insufficient resolution. For $M_2$
, the resolution is uniformly refined to
$M_2$
, the resolution is uniformly refined to $h/1.5$
in the range of
$h/1.5$
in the range of $x/c: 1 {-} 2$
. The weaker core pressure dropped further to
$x/c: 1 {-} 2$
. The weaker core pressure dropped further to $C_{\kern-1pt p} \sim -1.5$
at multiple instances, although still insufficient for cavitation. Since the majority of the
$C_{\kern-1pt p} \sim -1.5$
at multiple instances, although still insufficient for cavitation. Since the majority of the $C_{\kern-1pt p} \sim -1.5$
instances occurred in the range of
$C_{\kern-1pt p} \sim -1.5$
instances occurred in the range of $x/c = 1.15 {-} 1.35$
, this region alone is refined further to
$x/c = 1.15 {-} 1.35$
, this region alone is refined further to $h/2.5$
for
$h/2.5$
for $M_3$
. Multiple instances of weaker core pressure dropping below
$M_3$
. Multiple instances of weaker core pressure dropping below $C_{p_v}$
were observed with pressures reaching as low as
$C_{p_v}$
were observed with pressures reaching as low as $C_{\kern-1pt p} \sim -3.0$
. This region is further refined by
$C_{\kern-1pt p} \sim -3.0$
. This region is further refined by $20\,\%$
in
$20\,\%$
in $M_4$
. The changes in the minimum weaker core pressure were less than
$M_4$
. The changes in the minimum weaker core pressure were less than $3\,\%$
, establishing that
$3\,\%$
, establishing that $C_3$
mesh resolution is adequate. Figure 2 highlights the significant differences in the minimum weaker core pressure attained between the meshes
$C_3$
mesh resolution is adequate. Figure 2 highlights the significant differences in the minimum weaker core pressure attained between the meshes $M_2$
and
$M_2$
and $M_3$
. The final mesh resolution used for the current simulations is summarised in table 1. The entire computational grid consists of approximately
$M_3$
. The final mesh resolution used for the current simulations is summarised in table 1. The entire computational grid consists of approximately $1.4$
billion control volumes partitioned over 16 000 processors. We also performed time-step sensitivity analysis and found that the time step
$1.4$
billion control volumes partitioned over 16 000 processors. We also performed time-step sensitivity analysis and found that the time step $(\Delta tc/U_\infty )$
of
$(\Delta tc/U_\infty )$
of $2.0 \times 10^{-4}$
or smaller is needed to capture the inception events.
$2.0 \times 10^{-4}$
or smaller is needed to capture the inception events.
Computational cell size ( $h$
), core resolution (based on the unperturbed weaker core size) and the cell count in each wake overset mesh shown.
$h$
), core resolution (based on the unperturbed weaker core size) and the cell count in each wake overset mesh shown.

Comparison of instantaneous weaker core pressure ( $C_{\kern-1pt p}$
) at the downstream station (
$C_{\kern-1pt p}$
) at the downstream station ( $x/c = 1.2$
) between the coarse (
$x/c = 1.2$
) between the coarse ( $M_2$
) and fine (
$M_2$
) and fine ( $M_3$
) meshes (the dash-dotted line denotes the saturated vapour pressure,
$M_3$
) meshes (the dash-dotted line denotes the saturated vapour pressure, $C_{p_v} = -2.0$
).
$C_{p_v} = -2.0$
).

4. Validation
We compare the two-dimensional (2-D) core properties (before the onset of Crow instability) with the experimental results of Knister et al. (Reference Knister, Callison, Ganesh and Ceccio2020). Figures 3( $a$
) and 3(
$a$
) and 3( $b$
) show the dimensional mean streamwise vorticity (
$b$
) show the dimensional mean streamwise vorticity ( $\overline \omega _x$
) contour plot at
$\overline \omega _x$
) contour plot at $x/c = 0.67$
from the experiment and LES, respectively. The stronger vortex is in blue (
$x/c = 0.67$
from the experiment and LES, respectively. The stronger vortex is in blue ( $\overline \omega _x \lt 0$
) and the weaker in red (
$\overline \omega _x \lt 0$
) and the weaker in red ( $\overline \omega _x \gt 0$
). Qualitatively, the plots look very similar with regards to the core size, position and vorticity intensity. The vorticity profiles extracted across the core diameter are shown in figures 3(c) and 3(d). For both cores, the error (
$\overline \omega _x \gt 0$
). Qualitatively, the plots look very similar with regards to the core size, position and vorticity intensity. The vorticity profiles extracted across the core diameter are shown in figures 3(c) and 3(d). For both cores, the error ( $L2$
-norm) is less than
$L2$
-norm) is less than $7\,\%$
, indicating a good agreement with the experimental result. We also compute the size of each core and the distance between the core centres (table 2), noticing a good agreement with the experimental values.
$7\,\%$
, indicating a good agreement with the experimental result. We also compute the size of each core and the distance between the core centres (table 2), noticing a good agreement with the experimental values.
Comparison of the distance between the cores ( $b_0$
), stronger core size (
$b_0$
), stronger core size ( $r_{s_0}$
), weaker core size (
$r_{s_0}$
), weaker core size ( $r_{w_0}$
), circulation of the stronger (
$r_{w_0}$
), circulation of the stronger ( $\varGamma _{s_0}$
) and weaker (
$\varGamma _{s_0}$
) and weaker ( $\varGamma _{w_0}$
) vortices between the experiment and LES at
$\varGamma _{w_0}$
) vortices between the experiment and LES at $x/c = 0.67$
.
$x/c = 0.67$
.

Qualitative comparison of the mean streamwise vorticity ( $\overline {\omega }_x$
) contours at
$\overline {\omega }_x$
) contours at $x/c = 0.67$
between the
$x/c = 0.67$
between the $(a)$
experiment and
$(a)$
experiment and $(b)$
LES. The
$(b)$
LES. The $\overline {\omega }_x$
profiles across the core are compared for the
$\overline {\omega }_x$
profiles across the core are compared for the $(c)$
stronger and
$(c)$
stronger and $(d)$
weaker vortices at the same station.
$(d)$
weaker vortices at the same station.

5. Vortex roll-up across the tip and near-wake regime
In this section, we analyse the vortex roll-up across the tip of each hydrofoil and the evolution of vortex pair in the near-wake region prior to the onset of Crow instability. Figure 4 shows the mean streamwise vorticity contours along the tip of the foils. Since the flat tip has two sharp edges, multiple vortices are generated across the tip, which merge to become a single axisymmetric vortex (Francis & Katz Reference Francis and Katz1988; Giuni & Green Reference Giuni and Green2013). Note that since vortices are continuously generated across the flat tip, the axisymmetrisation process occurs slightly downstream of the trailing edge. In contrast, fewer vortices are generated across the round tip; hence, the merging and axisymmetrisation process is completed near the trailing edge.
Mean streamwise vorticity ( $\overline \omega _x c/U_\infty$
) plots shown at successive stations along the chord depicting the vortex roll-up across the tip of each hydrofoil.
$\overline \omega _x c/U_\infty$
) plots shown at successive stations along the chord depicting the vortex roll-up across the tip of each hydrofoil.

Mean streamwise vorticity ( $\overline \omega _x c/U_\infty$
) plots at different stations in the near-wake regime depicting the two-dimensional rotation of vortices due to mutual strain (prior to the onset of Crow instability).
$\overline \omega _x c/U_\infty$
) plots at different stations in the near-wake regime depicting the two-dimensional rotation of vortices due to mutual strain (prior to the onset of Crow instability).

Mean streamwise vorticity ( $\overline \omega _x c/U_\infty$
, red) and mean streamwise velocity (
$\overline \omega _x c/U_\infty$
, red) and mean streamwise velocity ( $\overline u/U_\infty$
, blue) profiles across both cores shown at
$\overline u/U_\infty$
, blue) profiles across both cores shown at $(a)$
$(a)$ $x/c = 0.2$
,
$x/c = 0.2$
, $(b)$
$(b)$ $x/c = 0.45$
,
$x/c = 0.45$
, $(c)$
$(c)$ $x/c = 0.7$
and
$x/c = 0.7$
and $(d)$
$(d)$ $x/c = 1.0$
(the region between the dashed vertical lines is the weaker vortex).
$x/c = 1.0$
(the region between the dashed vertical lines is the weaker vortex).

Minimum mean pressure ( $\overline {C_{\kern-1pt p}}_{\textit{min}}$
) in both vortices at different streamwise locations.
$\overline {C_{\kern-1pt p}}_{\textit{min}}$
) in both vortices at different streamwise locations.

The mean streamwise vorticity contours from the trailing edge to one chord length downstream are shown in figure 5. The axisymmetrisation process for the stronger vortex is completed at $x/c \sim 0.4$
. Mutual induction causes the vortices to undergo a 2-D rotation motion in the near-wake region. Figure 6(a–d) shows the mean axial vorticity and mean axial velocity (
$x/c \sim 0.4$
. Mutual induction causes the vortices to undergo a 2-D rotation motion in the near-wake region. Figure 6(a–d) shows the mean axial vorticity and mean axial velocity ( $\bar {u}$
) profiles across both cores at the streamwise locations indicated in figure 5, where
$\bar {u}$
) profiles across both cores at the streamwise locations indicated in figure 5, where $\eta$
denotes the local axis passing through the core centres with origin at the centre of the stronger core. Here,
$\eta$
denotes the local axis passing through the core centres with origin at the centre of the stronger core. Here, $\bar {u}$
is the largest close to the trailing edge due to the completion of the vortex roll-up and merger process (figure 6
$\bar {u}$
is the largest close to the trailing edge due to the completion of the vortex roll-up and merger process (figure 6 $a$
). As the vortices advect downstream,
$a$
). As the vortices advect downstream, $\bar {u}$
decreases in both vortices. While the stronger vortex maintains a jet-like velocity profile, the weaker vortex undergoes a jet-to-wake-like transition at approximately
$\bar {u}$
decreases in both vortices. While the stronger vortex maintains a jet-like velocity profile, the weaker vortex undergoes a jet-to-wake-like transition at approximately $x/c = 0.5$
. Previous experiments on a single hydrofoil at high Reynolds number observed the jet-to-wake transition occurring
$x/c = 0.5$
. Previous experiments on a single hydrofoil at high Reynolds number observed the jet-to-wake transition occurring $5{-}6$
chord lengths downstream at lower
$5{-}6$
chord lengths downstream at lower $\alpha$
(Lee & Pereira. Reference Lee and Pereira.2010) and the boundary layer shed from the hydrofoil surface was attributed as the primary source for the flow deceleration. Since the trailing edges of the hydrofoils are close to each other in the current simulation, the boundary layers shed from the hydrofoils roll up and merge into a single shear layer. This results in a stronger velocity deficit region between the vortex cores, causing the jet-to-wake transition to occur much earlier in the weaker vortex.
$\alpha$
(Lee & Pereira. Reference Lee and Pereira.2010) and the boundary layer shed from the hydrofoil surface was attributed as the primary source for the flow deceleration. Since the trailing edges of the hydrofoils are close to each other in the current simulation, the boundary layers shed from the hydrofoils roll up and merge into a single shear layer. This results in a stronger velocity deficit region between the vortex cores, causing the jet-to-wake transition to occur much earlier in the weaker vortex.
Figure 7 shows the minimum mean pressure ( $\overline {C_{\kern-1pt p}}_{\textit{min}}$
) in both vortices as a function of the streamwise distance. Note that ‘minimum mean pressure’ here refers to the minimum time-averaged value of pressure in the core. Here,
$\overline {C_{\kern-1pt p}}_{\textit{min}}$
) in both vortices as a function of the streamwise distance. Note that ‘minimum mean pressure’ here refers to the minimum time-averaged value of pressure in the core. Here, $\overline {C_{\kern-1pt p}}_{\textit{min}}$
is lowest near the trailing edge due to the high axial velocities associated with the vortex roll-up process. Further downstream,
$\overline {C_{\kern-1pt p}}_{\textit{min}}$
is lowest near the trailing edge due to the high axial velocities associated with the vortex roll-up process. Further downstream, $\overline {C_{\kern-1pt p}}_{\textit{min}}$
increases in both cores with the reduction in axial velocity, and the weaker core experiences a larger growth in pressure due to the stronger deceleration. Furthermore,
$\overline {C_{\kern-1pt p}}_{\textit{min}}$
increases in both cores with the reduction in axial velocity, and the weaker core experiences a larger growth in pressure due to the stronger deceleration. Furthermore, $x/c \sim 0.7$
is the measurement station reported by Knister et al. (Reference Knister, Callison, Ganesh and Ceccio2020) where the 2-D core properties are computed. These properties serve as a baseline to quantify changes due to Crow instability further downstream. However, it is important to note that there is a substantial increase in
$x/c \sim 0.7$
is the measurement station reported by Knister et al. (Reference Knister, Callison, Ganesh and Ceccio2020) where the 2-D core properties are computed. These properties serve as a baseline to quantify changes due to Crow instability further downstream. However, it is important to note that there is a substantial increase in $\overline {C_{\kern-1pt p}}_{\textit{min}}$
of the weaker core between
$\overline {C_{\kern-1pt p}}_{\textit{min}}$
of the weaker core between $x/c \sim 0.7$
(
$x/c \sim 0.7$
( $\overline {C_{\kern-1pt p}}_{\textit{min}} \sim -0.75$
) and
$\overline {C_{\kern-1pt p}}_{\textit{min}} \sim -0.75$
) and $x/c \sim 1.0$
(
$x/c \sim 1.0$
( $\overline {C_{\kern-1pt p}}_{\textit{min}} \sim -0.55$
), prior to the onset of Crow instability. This suggests that the reported pressure drops due to axial stretching may underestimate the actual magnitude of pressure reduction, as they are computed relative to a baseline that has relatively lower pressure values. The wandering intensities for the weaker and stronger cores are approximately
$\overline {C_{\kern-1pt p}}_{\textit{min}} \sim -0.55$
), prior to the onset of Crow instability. This suggests that the reported pressure drops due to axial stretching may underestimate the actual magnitude of pressure reduction, as they are computed relative to a baseline that has relatively lower pressure values. The wandering intensities for the weaker and stronger cores are approximately $7.5\,\%$
and
$7.5\,\%$
and $6\,\%$
, respectively, indicating relatively smaller wandering motion. In addition, the turbulence intensities in the near-wake region are not significant (figure 8).
$6\,\%$
, respectively, indicating relatively smaller wandering motion. In addition, the turbulence intensities in the near-wake region are not significant (figure 8).
6. Crow region (3-D regime)
Figure 9 shows the different stages of the three-dimensional (3-D) interactions between the vortex pair. Sinusoidal perturbations develop on the weaker vortex at $x/c \sim 0.9 {-} 1.0$
, causing displacement of its axis (figure 9
a). The vortex centreline is extracted along the sinusoidal wave and the autocorrelation of the centre positions yields the wavelength
$x/c \sim 0.9 {-} 1.0$
, causing displacement of its axis (figure 9
a). The vortex centreline is extracted along the sinusoidal wave and the autocorrelation of the centre positions yields the wavelength $\lambda /c \sim 0.3$
. This wavelength is larger than the unperturbed vortex separation distance (
$\lambda /c \sim 0.3$
. This wavelength is larger than the unperturbed vortex separation distance ( $\lambda /b_0 \sim 3$
) and the unperturbed vortex core sizes (
$\lambda /b_0 \sim 3$
) and the unperturbed vortex core sizes ( $\lambda /r_{s_0} \sim 10$
). Table 3 shows the wavelength comparison between the LES, analytical estimate from the linear stability framework for unequal strength counter-rotating vortices (Bristol et al. Reference Bristol, Ortega, Marcus and Savas2004) and the experimental value (Knister et al. Reference Knister, Callison, Ganesh and Ceccio2020). The close agreement indicates that the sinusoidal disturbances represent the long-wavelength Crow instability.
$\lambda /r_{s_0} \sim 10$
). Table 3 shows the wavelength comparison between the LES, analytical estimate from the linear stability framework for unequal strength counter-rotating vortices (Bristol et al. Reference Bristol, Ortega, Marcus and Savas2004) and the experimental value (Knister et al. Reference Knister, Callison, Ganesh and Ceccio2020). The close agreement indicates that the sinusoidal disturbances represent the long-wavelength Crow instability.
As the instability grows, the weaker vortex approaches the stronger vortex and begins to wrap around it (figures 9
b and 9
c). Subsequently, its legs drift apart (figure 9
d), primarily due to self-induction. As the wrapping progresses, the central region of both vortices becomes thinner and weaker (figure 9
e). Unlike the weaker vortex, the stronger vortex does not experience any significant displacement/bending of its axis and its orientation remains almost parallel to the streamwise direction. This entire sequence is hereafter referred to as the Crow cycle and several such cycles are observed in the wake. The average time period of the Crow cycle is found to be $T_{\textit{Cro}w}U_\infty /c \sim 1$
.
$T_{\textit{Cro}w}U_\infty /c \sim 1$
.
Turbulent kinetic energy (TKE) contours at different streamwise locations in the near wake.

Figures 10 $(a)$
and 10
$(a)$
and 10 $(b)$
show the snapshots of iso-contours of
$(b)$
show the snapshots of iso-contours of $C_{\kern-1pt p} = -0.4$
(grey scale) superimposed with
$C_{\kern-1pt p} = -0.4$
(grey scale) superimposed with $C_{\kern-1pt p} \lt -1.6$
and
$C_{\kern-1pt p} \lt -1.6$
and $C_{\kern-1pt p} \lt -2.0$
(coloured), respectively. These low-pressure regions are smaller than the weaker core size, indicative of the nature of inception at a higher cavitation number. Figure 10
$C_{\kern-1pt p} \lt -2.0$
(coloured), respectively. These low-pressure regions are smaller than the weaker core size, indicative of the nature of inception at a higher cavitation number. Figure 10 $(c)$
shows the instantaneous minimum pressure (
$(c)$
shows the instantaneous minimum pressure ( $C_{p_{\textit{min}}}$
) in the weaker vortex over three Crow cycles, with the horizontal arrow representing the time period of the Crow cycle. The pressure drops below the vapour pressure (
$C_{p_{\textit{min}}}$
) in the weaker vortex over three Crow cycles, with the horizontal arrow representing the time period of the Crow cycle. The pressure drops below the vapour pressure ( $C_{p_v}$
, indicated by the dashed line) at multiple instances for a short period of time. The average value of the minimum pressure (
$C_{p_v}$
, indicated by the dashed line) at multiple instances for a short period of time. The average value of the minimum pressure ( $\overline {C}_{p_{\textit{min}}}$
) is approximately
$\overline {C}_{p_{\textit{min}}}$
) is approximately $-1.75$
, corresponding to a 2.5-fold reduction compared with the unperturbed core pressure. While this is insufficient to cause inception, instantaneous pressure reductions reach a factor of
$-1.75$
, corresponding to a 2.5-fold reduction compared with the unperturbed core pressure. While this is insufficient to cause inception, instantaneous pressure reductions reach a factor of $3{-}4$
at certain instances, potentially triggering inception. Figure 10
$3{-}4$
at certain instances, potentially triggering inception. Figure 10 $(d)$
provides a scatter plot of the streamwise locations of
$(d)$
provides a scatter plot of the streamwise locations of $C_{p_{\textit{min}}}$
and
$C_{p_{\textit{min}}}$
and $C_{p_{\textit{min}}} \lt -2.0$
(red). These locations are primarily concentrated in the range of
$C_{p_{\textit{min}}} \lt -2.0$
(red). These locations are primarily concentrated in the range of $x/c = 1.1 {-} 1.7$
, consistent with the inception locations reported by Knister et al. (Reference Knister, Callison, Ganesh and Ceccio2020).
$x/c = 1.1 {-} 1.7$
, consistent with the inception locations reported by Knister et al. (Reference Knister, Callison, Ganesh and Ceccio2020).
Comparison of the sinusoidal wavelength ( $\lambda /c$
) between LES, experiment and linear theory.
$\lambda /c$
) between LES, experiment and linear theory.

Iso-contours of $C_{\kern-1pt p} = -0.5$
(coloured with streamwise vorticity) depicting the growth of Crow instability on the weaker vortex (black window) over one Crow cycle.
$C_{\kern-1pt p} = -0.5$
(coloured with streamwise vorticity) depicting the growth of Crow instability on the weaker vortex (black window) over one Crow cycle. $(a)$
Linear regime,
$(a)$
Linear regime, $(b)$
nonlinear regime,
$(b)$
nonlinear regime, $(c)$
instance of lowest core pressure, and
$(c)$
instance of lowest core pressure, and $(d)$
and
$(d)$
and $(e)$
post-inception evolution. The dashed line denotes the symmetry plane of the Crow wavelength.
$(e)$
post-inception evolution. The dashed line denotes the symmetry plane of the Crow wavelength.

Iso-contours of $C_{\kern-1pt p} = -0.4$
(grey scale) superimposed with (
$C_{\kern-1pt p} = -0.4$
(grey scale) superimposed with ( $a$
)
$a$
) $C_{\kern-1pt p} \lt -1.6$
and (
$C_{\kern-1pt p} \lt -1.6$
and ( $b$
)
$b$
) $C_{\kern-1pt p} \lt -2.0$
, both coloured with streamwise vorticity, illustrating the relatively small size of the low-pressure and inception regions.
$C_{\kern-1pt p} \lt -2.0$
, both coloured with streamwise vorticity, illustrating the relatively small size of the low-pressure and inception regions. $(c)$
Minimum core pressure (
$(c)$
Minimum core pressure ( $C_{p_{\textit{min}}}$
) in the weaker vortex beyond
$C_{p_{\textit{min}}}$
) in the weaker vortex beyond $x/c = 1.0$
.
$x/c = 1.0$
. $(d)$
Corresponding streamwise locations (
$(d)$
Corresponding streamwise locations ( $x/c$
) of
$x/c$
) of $C_{p_{\textit{min}}}$
and
$C_{p_{\textit{min}}}$
and $C_{p_{\textit{min}}} \lt -2.0$
(red). The dashed vertical line indicates the location of the trailing edge (T.E.) of the foils.
$C_{p_{\textit{min}}} \lt -2.0$
(red). The dashed vertical line indicates the location of the trailing edge (T.E.) of the foils.

Instantaneous pressure contours in the symmetry plane ( $\tilde{x}/\lambda \sim 0.5$
) demonstrating the different stages of the interaction between weaker and stronger cores.
$\tilde{x}/\lambda \sim 0.5$
) demonstrating the different stages of the interaction between weaker and stronger cores.

6.1. Instantaneous pressure field and circulation over a Crow cycle
We examine the instantaneous pressure contours in the symmetry plane (dashed lines in figure 9) over one Crow cycle to analyse the changes in the core structure, and the subsequent impact on core pressure and circulation as the instability grows in time. For this temporal analysis, a local temporal coordinate ( $t'$
) is used. Here,
$t'$
) is used. Here, $t' = 0$
denotes the instance where the amplitude of the Crow instability (
$t' = 0$
denotes the instance where the amplitude of the Crow instability ( $A_c$
) is approximately
$A_c$
) is approximately $10\,\%$
of the mean separation distance (
$10\,\%$
of the mean separation distance ( $A_c/b_0 \sim 0.10$
). This value is chosen to ensure that the amplitude of the Crow instability is larger than the wandering intensity of the weaker vortex.
$A_c/b_0 \sim 0.10$
). This value is chosen to ensure that the amplitude of the Crow instability is larger than the wandering intensity of the weaker vortex.
The inviscid stretching of the weaker vortex, driven by the combined effects of mutual and self-induction, dominates the early phase of interactions due to the high Reynolds number. As a result, the vortex stretching intensity increases in the weaker core, bending it further and bringing it closer to the stronger core (figure 11 $a{-}c$
). The weaker core pressure drops below the saturated vapour pressure (
$a{-}c$
). The weaker core pressure drops below the saturated vapour pressure ( $C_{p_{\textit{min}}} \lt -2.0$
) when the cores approach very close to each other (figure 11
$C_{p_{\textit{min}}} \lt -2.0$
) when the cores approach very close to each other (figure 11 $c$
). Subsequently, the mutual induction begins to dominate and figure 11(
$c$
). Subsequently, the mutual induction begins to dominate and figure 11( $d$
–
$d$
– $j$
) shows the corresponding pressure contours during this phase.
$j$
) shows the corresponding pressure contours during this phase.
The strain induced by the weaker core causes elliptical deformation of the stronger core (figure 11 $d$
). A small secondary vortex appears between the two cores having the same circulation sense as the weaker core. Since the strain field is larger in between the vortices, the secondary vortex has a relatively higher velocity, bringing it closer to the weaker vortex (figure 11
$d$
). A small secondary vortex appears between the two cores having the same circulation sense as the weaker core. Since the strain field is larger in between the vortices, the secondary vortex has a relatively higher velocity, bringing it closer to the weaker vortex (figure 11 $e{,}f$
). Meanwhile, the stronger vortex further deforms (figure 11
$e{,}f$
). Meanwhile, the stronger vortex further deforms (figure 11 $e$
) and vorticity is stripped from its upper side (figure 11
$e$
) and vorticity is stripped from its upper side (figure 11 $f$
). Following this stripping, the stronger core relaxes to an elliptical shape (figure 11
$f$
). Following this stripping, the stronger core relaxes to an elliptical shape (figure 11 $g$
) and eventually to a near circular shape (figure 11
$g$
) and eventually to a near circular shape (figure 11 $i{,}j$
). The weaker vortex, however, interacts with the stripped vorticity and the secondary vortex, resulting in a complex interaction (figure 11
$i{,}j$
). The weaker vortex, however, interacts with the stripped vorticity and the secondary vortex, resulting in a complex interaction (figure 11 $g{,}h$
). As this interaction progresses, the weaker vortex appears to reduce in size significantly (figure 11
$g{,}h$
). As this interaction progresses, the weaker vortex appears to reduce in size significantly (figure 11 $i{,}j$
). Previous studies on counter-rotating vortex pair interactions due to the growth of the Crow instability (Yao & Hussain Reference Yao and Hussain2022) have reported a cascading process of core flattening followed by an asymmetric roll-up due to Kelvin–Helmholtz instability, resulting in eventual loss of circulation over time. In contrast, co-rotating vortex pairs are known to merge into a single vortex when they approach very close to each other, predominantly driven by viscous effects (Brandt & Nomura Reference Brandt and Nomura2010). The current interaction of the weaker vortex with the secondary vortex and stripped vorticity appears to be a combination of both vortex merger and vortex roll-up. A thorough investigation of this process requires further mesh and temporal refinements due to the smaller size of the secondary vortices and shorter interaction time scales, which is beyond the scope of the current work.
$i{,}j$
). Previous studies on counter-rotating vortex pair interactions due to the growth of the Crow instability (Yao & Hussain Reference Yao and Hussain2022) have reported a cascading process of core flattening followed by an asymmetric roll-up due to Kelvin–Helmholtz instability, resulting in eventual loss of circulation over time. In contrast, co-rotating vortex pairs are known to merge into a single vortex when they approach very close to each other, predominantly driven by viscous effects (Brandt & Nomura Reference Brandt and Nomura2010). The current interaction of the weaker vortex with the secondary vortex and stripped vorticity appears to be a combination of both vortex merger and vortex roll-up. A thorough investigation of this process requires further mesh and temporal refinements due to the smaller size of the secondary vortices and shorter interaction time scales, which is beyond the scope of the current work.
Circulation ( $\varGamma$
, solid line) and the corresponding core pressure (
$\varGamma$
, solid line) and the corresponding core pressure ( $C_{\kern-1pt p}$
, dashed line) in the
$C_{\kern-1pt p}$
, dashed line) in the $(a)$
weaker and
$(a)$
weaker and $(b)$
stronger vortices in the symmetry plane.
$(b)$
stronger vortices in the symmetry plane.

Figure 12 shows the circulation of both vortices (normalised with the respective unperturbed values) and the corresponding core pressure in the same symmetry plane. Note that the core pressure here refers to the minimum pressure in the core. The weaker vortex circulation remains constant until $t'U_\infty /c \sim 0.6$
(figure 12
$t'U_\infty /c \sim 0.6$
(figure 12 $a$
), while its core pressure drops below the saturated vapour pressure to a minimum of
$a$
), while its core pressure drops below the saturated vapour pressure to a minimum of $-2.4$
before recovering. From the conservation of angular momentum, the core size decreases as the vortex stretching intensity increases. Assuming a Lamb–Oseen profile for the weaker core provides a reasonable estimate of the changes in its core size. The circulation is computed at different radial locations from the core centre, and the location corresponding to
$-2.4$
before recovering. From the conservation of angular momentum, the core size decreases as the vortex stretching intensity increases. Assuming a Lamb–Oseen profile for the weaker core provides a reasonable estimate of the changes in its core size. The circulation is computed at different radial locations from the core centre, and the location corresponding to $\varGamma (r) \sim 0.63 \varGamma _{w_0}$
is chosen as the desired core size. The core size reduces by a factor of
$\varGamma (r) \sim 0.63 \varGamma _{w_0}$
is chosen as the desired core size. The core size reduces by a factor of $1.5$
and since
$1.5$
and since $C_{\kern-1pt p} \propto 1/r^2$
, the core pressure is expected to reduce by a factor of
$C_{\kern-1pt p} \propto 1/r^2$
, the core pressure is expected to reduce by a factor of $2.25$
(
$2.25$
( $C_{\kern-1pt p} \sim -1.7$
) relative to the unperturbed value. However, the minimum instantaneous pressure (
$C_{\kern-1pt p} \sim -1.7$
) relative to the unperturbed value. However, the minimum instantaneous pressure ( $C_{p_{\textit{min}}} \sim -2.4$
) is approximately
$C_{p_{\textit{min}}} \sim -2.4$
) is approximately $40\,\%$
lower than the expected value, indicating stronger fluctuation intensities in the core.
$40\,\%$
lower than the expected value, indicating stronger fluctuation intensities in the core.
The weaker core circulation approximately reduces by $40\,\%$
after
$40\,\%$
after $t'U_\infty /c \sim 0.6$
during its interaction with the stripped vorticity and the secondary vortex. The variations in its core pressure are relatively smaller compared with the inviscid stretching phase and hence insufficient to cause further inception events. For the stronger vortex (figure 12
$t'U_\infty /c \sim 0.6$
during its interaction with the stripped vorticity and the secondary vortex. The variations in its core pressure are relatively smaller compared with the inviscid stretching phase and hence insufficient to cause further inception events. For the stronger vortex (figure 12 $b$
), the circulation reduces by approximately
$b$
), the circulation reduces by approximately $20\,\%$
after
$20\,\%$
after $t'U_\infty /c \sim 0.60$
due to vorticity stripping. Its core pressure shows an oscillatory behaviour, although it remains significantly higher than the saturated vapour pressure throughout the Crow cycle, suggesting that inception would most likely occur in the weaker vortex at such higher ambient pressures. Also, the inception duration (
$t'U_\infty /c \sim 0.60$
due to vorticity stripping. Its core pressure shows an oscillatory behaviour, although it remains significantly higher than the saturated vapour pressure throughout the Crow cycle, suggesting that inception would most likely occur in the weaker vortex at such higher ambient pressures. Also, the inception duration ( $\Delta t_i'U_\infty /c$
, duration of
$\Delta t_i'U_\infty /c$
, duration of $C_{\kern-1pt p} \lt C_{p_v}$
) is significantly smaller than the time period of the Crow cycle (
$C_{\kern-1pt p} \lt C_{p_v}$
) is significantly smaller than the time period of the Crow cycle ( $\Delta t_i'$
/
$\Delta t_i'$
/ $T_{\textit{Cro}w} \sim 0.03$
), highlighting the intermittent nature of inception in the weaker vortex.
$T_{\textit{Cro}w} \sim 0.03$
), highlighting the intermittent nature of inception in the weaker vortex.
We also examine the variation of core pressure along the weaker vortex axis (figure 13). In the linear regime (blue), the pressure variations are relatively small. As the instability grows, the core pressure drops below the vapour pressure near the symmetry plane (red curve). While the minimum pressure recovers during the later stages of the interaction (green), more regions along the axis have lower pressure ( $C_{\kern-1pt p} \lt -1.5$
) compared with earlier instances. This suggests that the axial stretching intensities are localised in the early phases of the instability, eventually spreading along the axis.
$C_{\kern-1pt p} \lt -1.5$
) compared with earlier instances. This suggests that the axial stretching intensities are localised in the early phases of the instability, eventually spreading along the axis.
Core pressure along the wavelength of the weaker vortex shown at $t'U_\infty /c = 0.12$
(blue),
$t'U_\infty /c = 0.12$
(blue), $t'U_\infty /c = 0.48$
(red) and
$t'U_\infty /c = 0.48$
(red) and $t'U_\infty /c = 0.72$
(green).
$t'U_\infty /c = 0.72$
(green).

6.2. Flow statistics
The spatial and temporal characteristics of the low-pressure regions in the weaker vortex are analysed to understand the intermittent cavitation inception. For this purpose, data from four Crow cycles are collected with approximately $35$
–
$35$
– $40$
samples per cycle. The axial stretching (
$40$
samples per cycle. The axial stretching ( $\phi _{\textit{ax}}$
), strain (
$\phi _{\textit{ax}}$
), strain ( $S_{\textit{ax}}$
), vorticity (
$S_{\textit{ax}}$
), vorticity ( $\omega _{\textit{ax}}$
) and velocity (
$\omega _{\textit{ax}}$
) and velocity ( $u_{\textit{ax}}$
) in these low-pressure regions are examined in detail. The axis of the weaker vortex is not aligned with the streamwise direction due to the growth of the Crow instability. Therefore, the axial quantities are computed along the local axis orientation as follows:
$u_{\textit{ax}}$
) in these low-pressure regions are examined in detail. The axis of the weaker vortex is not aligned with the streamwise direction due to the growth of the Crow instability. Therefore, the axial quantities are computed along the local axis orientation as follows: $u_{\textit{ax}} = \boldsymbol{u} \boldsymbol{\cdot }\boldsymbol{n}$
,
$u_{\textit{ax}} = \boldsymbol{u} \boldsymbol{\cdot }\boldsymbol{n}$
, $\omega _{\textit{ax}} = \boldsymbol{\omega } \boldsymbol{\cdot }\boldsymbol{n}$
,
$\omega _{\textit{ax}} = \boldsymbol{\omega } \boldsymbol{\cdot }\boldsymbol{n}$
, $S_{\textit{ax}} = (\boldsymbol{\boldsymbol{n} \boldsymbol{\cdot }S}) \boldsymbol{\cdot }\boldsymbol{n}$
and
$S_{\textit{ax}} = (\boldsymbol{\boldsymbol{n} \boldsymbol{\cdot }S}) \boldsymbol{\cdot }\boldsymbol{n}$
and $\phi _{\textit{ax}} = (\boldsymbol{\omega \boldsymbol{\cdot }S}) \boldsymbol{\cdot }\boldsymbol{n}$
. Here,
$\phi _{\textit{ax}} = (\boldsymbol{\omega \boldsymbol{\cdot }S}) \boldsymbol{\cdot }\boldsymbol{n}$
. Here, $\boldsymbol{u}$
and
$\boldsymbol{u}$
and $\boldsymbol{\omega }$
denote the velocity and vorticity vectors,
$\boldsymbol{\omega }$
denote the velocity and vorticity vectors, $\boldsymbol{S}$
denotes the strain-rate tensor and
$\boldsymbol{S}$
denotes the strain-rate tensor and $\boldsymbol{n}$
is the axis orientation. Additionally,
$\boldsymbol{n}$
is the axis orientation. Additionally, $\boldsymbol{n}$
is computed as the tangent to the curve joining the vortex centres at each cross-section of the Crow wavelength. The vortex centre is computed using the vorticity-weighted centroid approach.
$\boldsymbol{n}$
is computed as the tangent to the curve joining the vortex centres at each cross-section of the Crow wavelength. The vortex centre is computed using the vorticity-weighted centroid approach.
Table 4 shows the comparison between the inception events across four Crow cycles. The first column is the streamwise location of the origin of Crow instability ( $x_0/c$
), defined as the location where the amplitude (
$x_0/c$
), defined as the location where the amplitude ( $A_c$
) of the instability is approximately
$A_c$
) of the instability is approximately $10\,\%$
of the mean separation distance between the cores (
$10\,\%$
of the mean separation distance between the cores ( $A_c/b_0 \sim 0.10$
). The second and fourth columns denote the streamwise location (
$A_c/b_0 \sim 0.10$
). The second and fourth columns denote the streamwise location ( $x_i/c$
) and the time (
$x_i/c$
) and the time ( $t_i'U_\infty /c$
) of the first inception occurrence in the weaker vortex. The third column denotes its relative location with respect to the origin of the instability (
$t_i'U_\infty /c$
) of the first inception occurrence in the weaker vortex. The third column denotes its relative location with respect to the origin of the instability ( $x_i'/c = x_i/c {-} x_0/c$
). The inception duration (
$x_i'/c = x_i/c {-} x_0/c$
). The inception duration ( $\Delta t'U_\infty /c$
) is shown in the final column and the last row reports the mean values for each column. Except for the inception duration, the standard deviation of the remaining quantities is below
$\Delta t'U_\infty /c$
) is shown in the final column and the last row reports the mean values for each column. Except for the inception duration, the standard deviation of the remaining quantities is below $10\,\%$
, indicating that the inception occurrences are consistent across all cycles. However, the variability in the inception duration is higher (
$10\,\%$
, indicating that the inception occurrences are consistent across all cycles. However, the variability in the inception duration is higher ( $ {\gt} 25\,\%$
), suggesting significant variations in pressure reduction intensities between different Crow cycles. For the current simulation, the maximum inception duration is found to be twice the smallest.
$ {\gt} 25\,\%$
), suggesting significant variations in pressure reduction intensities between different Crow cycles. For the current simulation, the maximum inception duration is found to be twice the smallest.
Comparison of spatial location and temporal instances of inception ( $C_{\kern-1pt p} \lt -2.0$
) in the weaker vortex across four Crow cycles.
$C_{\kern-1pt p} \lt -2.0$
) in the weaker vortex across four Crow cycles.

Histogram plots showing the probability distribution of $(a)$
temporal,
$(a)$
temporal, $(b)$
spatial and
$(b)$
spatial and $(c)$
joint temporal–spatial occurrences of low-pressure events conditioned on
$(c)$
joint temporal–spatial occurrences of low-pressure events conditioned on $C_{\kern-1pt p} \lt -1.5$
. The colour bar represents the logarithmic values of the probability distribution.
$C_{\kern-1pt p} \lt -1.5$
. The colour bar represents the logarithmic values of the probability distribution.

Figures 14 $(a)$
and 14
$(a)$
and 14 $(b)$
show the probability distribution of the temporal and spatial occurrences of low-pressure events (defined by
$(b)$
show the probability distribution of the temporal and spatial occurrences of low-pressure events (defined by $C_{\kern-1pt p} \lt -1.5$
), respectively. The width of each temporal bin is
$C_{\kern-1pt p} \lt -1.5$
), respectively. The width of each temporal bin is $\Delta tU_\infty /c = 0.04$
, of the same order as the inception duration. The Crow wavelength is spatially discretised into
$\Delta tU_\infty /c = 0.04$
, of the same order as the inception duration. The Crow wavelength is spatially discretised into $15$
bins, with a bin width of
$15$
bins, with a bin width of $\Delta x/c = \lambda /15c$
, and the size of the pressure bin is
$\Delta x/c = \lambda /15c$
, and the size of the pressure bin is $\Delta C_{\kern-1pt p} = 0.01$
. Inception events occur in the range of
$\Delta C_{\kern-1pt p} = 0.01$
. Inception events occur in the range of $t'U_\infty /c: 0.45 {-} 0.65$
, with the majority of them occurring in the range of
$t'U_\infty /c: 0.45 {-} 0.65$
, with the majority of them occurring in the range of $t'U_\infty /c: 0.46 {-} 0.54$
when the cores approach very close to each other. The pressure distribution is asymmetric with a significant drop in pressure in the range of
$t'U_\infty /c: 0.46 {-} 0.54$
when the cores approach very close to each other. The pressure distribution is asymmetric with a significant drop in pressure in the range of $t'U_\infty /c: 0.3 {-} 0.5$
followed by a gradual increase. However, the increase is non-monotonic as smaller localised pressure reductions occur during the later stages of interaction (
$t'U_\infty /c: 0.3 {-} 0.5$
followed by a gradual increase. However, the increase is non-monotonic as smaller localised pressure reductions occur during the later stages of interaction ( $t'U_\infty /c: 0.7 {-} 0.8$
).
$t'U_\infty /c: 0.7 {-} 0.8$
).
The spatial distribution is more symmetric and broader, indicating that low-pressure events can occur at multiple locations along the wavelength. Most low-pressure events occur in the range of $\tilde {x}/\lambda : 0.4 {-} 0.55$
, close to the symmetry plane, while the remainder occur away from the symmetry plane (
$\tilde {x}/\lambda : 0.4 {-} 0.55$
, close to the symmetry plane, while the remainder occur away from the symmetry plane ( $\tilde {x}/\lambda : 0.25$
and
$\tilde {x}/\lambda : 0.25$
and $0.65$
). A similar pattern is also observed for the inception locations, exhibiting spatial symmetry. This suggests that inception can be triggered at multiple locations along the axis, consistent with previous observations on inception locations in shear-layer experiments (Agarwal et al. Reference Agarwal, Ram, Lu and Katz2023).
$0.65$
). A similar pattern is also observed for the inception locations, exhibiting spatial symmetry. This suggests that inception can be triggered at multiple locations along the axis, consistent with previous observations on inception locations in shear-layer experiments (Agarwal et al. Reference Agarwal, Ram, Lu and Katz2023).
Figure 14 $(c)$
shows the joint probability distribution of the temporal and spatial occurrences of the same low-pressure events. These low-pressure events are confined close to the symmetry plane (vertical dashed line) until
$(c)$
shows the joint probability distribution of the temporal and spatial occurrences of the same low-pressure events. These low-pressure events are confined close to the symmetry plane (vertical dashed line) until $t'U_\infty /c \sim 0.4$
. As the cores approach close to each other (
$t'U_\infty /c \sim 0.4$
. As the cores approach close to each other ( $t'U_\infty /c: 0.4 {-} 0.6$
), multiple regions along the wavelength experience significant pressure reduction, with the frontal portions of the Crow wavelength (farther away from the trailing edge) having more low-pressure regions. The decline in circulation strength beyond
$t'U_\infty /c: 0.4 {-} 0.6$
), multiple regions along the wavelength experience significant pressure reduction, with the frontal portions of the Crow wavelength (farther away from the trailing edge) having more low-pressure regions. The decline in circulation strength beyond $t'U_\infty /c \sim 0.6$
results in increasingly fewer regions with low pressure. In summary, the majority of the low-pressure/inception events occur in the ranges of
$t'U_\infty /c \sim 0.6$
results in increasingly fewer regions with low pressure. In summary, the majority of the low-pressure/inception events occur in the ranges of $t'U_\infty /c: 0.46 {-} 0.54$
and
$t'U_\infty /c: 0.46 {-} 0.54$
and $\tilde {x}/\lambda : 0.4 {-} 0.55$
.
$\tilde {x}/\lambda : 0.4 {-} 0.55$
.
Wavelength-averaging (solid) and local-averaging (dashed) windows.

6.2.1. Mean axial strain and axial stretching
The conventional temporal averaging in each computational cell is an ineffective representation of the mean vortex properties due to the vortex meandering associated with the Crow instability. Therefore, conditional averages of axial stretching and strain are computed and then ensemble-averaged over all the cycles. Two approaches are considered: (I) averaging over the wavelength at each instance (denoted by the subscript ‘wax’), characterising the global nature of strain and stretching; and (II) averaging over a smaller window encompassing the inception regions (denoted by the subscript ‘lax’), representing their local behaviour. Figure 15 shows the regions considered for both approaches. Note that these windows advect with the weaker vortex and hence are not stationary. The ensemble-averaged values are denoted by $\lt \gt$
.
$\lt \gt$
.
Figures 16 $(a)$
and 16
$(a)$
and 16 $(b)$
show the wavelength-averaged axial stretching and strain in the weaker and stronger vortices. For the weaker vortex, both exhibit a similar oscillatory motion with multiple peaks. The initial increase until
$(b)$
show the wavelength-averaged axial stretching and strain in the weaker and stronger vortices. For the weaker vortex, both exhibit a similar oscillatory motion with multiple peaks. The initial increase until $t'U_\infty /c \sim 0.3$
is predominantly due to the nonlinear transition and continued growth of the Crow instability, followed by a slight dip until
$t'U_\infty /c \sim 0.3$
is predominantly due to the nonlinear transition and continued growth of the Crow instability, followed by a slight dip until $t'U_\infty /c \sim 0.4$
. They subsequently increase reaching peak values around
$t'U_\infty /c \sim 0.4$
. They subsequently increase reaching peak values around $t'U_\infty /c \sim 0.6$
, leading to the inception events occurring during this phase (denoted by the orange window). Beyond
$t'U_\infty /c \sim 0.6$
, leading to the inception events occurring during this phase (denoted by the orange window). Beyond $t'U_\infty /c \sim 0.6$
, the circulation decay in both vortices significantly reduces the axial strain and stretching intensities in the weaker vortex. The variability (indicated by the vertical bars) is relatively larger in the range of
$t'U_\infty /c \sim 0.6$
, the circulation decay in both vortices significantly reduces the axial strain and stretching intensities in the weaker vortex. The variability (indicated by the vertical bars) is relatively larger in the range of $t'U_\infty /c: 0.6{-} 0.8$
(indicated by the magnitude of the standard deviation bars), primarily due to the complex interaction between the weaker core and secondary vortices. The stretching and strain intensities in the stronger vortex are an order of magnitude smaller, which explains the relatively smaller changes in its core pressure observed in figure 12(
$t'U_\infty /c: 0.6{-} 0.8$
(indicated by the magnitude of the standard deviation bars), primarily due to the complex interaction between the weaker core and secondary vortices. The stretching and strain intensities in the stronger vortex are an order of magnitude smaller, which explains the relatively smaller changes in its core pressure observed in figure 12( $b$
).
$b$
).
Wavelength-averaged $(a)$
axial stretching and
$(a)$
axial stretching and $(b)$
axial strain in the weaker (red) and stronger (blue) vortices with the vertical bars denoting the standard deviation across the four Crow cycles. Comparison between wavelength-averaged (solid) and local-averaged (dashed)
$(b)$
axial strain in the weaker (red) and stronger (blue) vortices with the vertical bars denoting the standard deviation across the four Crow cycles. Comparison between wavelength-averaged (solid) and local-averaged (dashed) $(c)$
axial stretching and
$(c)$
axial stretching and $(d)$
axial strain in the weaker vortex. The orange region represents the time window of the inception events.
$(d)$
axial strain in the weaker vortex. The orange region represents the time window of the inception events.

Figure 16 $(c{,}d)$
shows the comparison between wavelength averaged (solid line) and local averaged (dashed line) axial stretching and strain, respectively. Unlike the wavelength-averaged stretching/strain that remains positive throughout the cycle, the local stretching/strain exhibits an oscillatory stretching–compression cycle until
$(c{,}d)$
shows the comparison between wavelength averaged (solid line) and local averaged (dashed line) axial stretching and strain, respectively. Unlike the wavelength-averaged stretching/strain that remains positive throughout the cycle, the local stretching/strain exhibits an oscillatory stretching–compression cycle until $t'U_\infty /c \sim 0.4$
. This is followed by a significant increase reaching peak values at
$t'U_\infty /c \sim 0.4$
. This is followed by a significant increase reaching peak values at $t'U_\infty /c \sim 0.6$
, followed by a gradual decay. The peak is almost four times larger than the wavelength-averaged counterparts, explaining the intense localised pressure reductions near the symmetry plane observed in figure 13.
$t'U_\infty /c \sim 0.6$
, followed by a gradual decay. The peak is almost four times larger than the wavelength-averaged counterparts, explaining the intense localised pressure reductions near the symmetry plane observed in figure 13.
6.2.2. Distribution of core properties
In this section, we examine the distribution of core properties in the weaker vortex before ( $t'U_\infty /c \sim 0.30$
), during (
$t'U_\infty /c \sim 0.30$
), during ( $t'U_\infty /c \sim 0.48$
) and after the inception events (
$t'U_\infty /c \sim 0.48$
) and after the inception events ( $t'U_\infty /c \sim 0.58$
and
$t'U_\infty /c \sim 0.58$
and $0.68$
). Figure 17(
$0.68$
). Figure 17( $a$
) shows the probability distribution function (p.d.f.) of pressure conditioned on
$a$
) shows the probability distribution function (p.d.f.) of pressure conditioned on $C_{\kern-1pt p} \lt -1.5$
at these four instances. The distributions are concentrated at higher pressures, with only smaller portions of the core having lower pressure. As the Crow instability grows and the cores approach close to each other, the weaker core pressure drops below the vapour pressure, causing the tail to become longer (red curve). The core pressure begins to increase beyond this instance; therefore, no further inception events are observed. Chang et al. (Reference Chang, Choi, Yakushiji and Ceccio2012) reported a similar observation in their experiments, where continued stretching beyond the first inception event did not result in further cavitation events.
$C_{\kern-1pt p} \lt -1.5$
at these four instances. The distributions are concentrated at higher pressures, with only smaller portions of the core having lower pressure. As the Crow instability grows and the cores approach close to each other, the weaker core pressure drops below the vapour pressure, causing the tail to become longer (red curve). The core pressure begins to increase beyond this instance; therefore, no further inception events are observed. Chang et al. (Reference Chang, Choi, Yakushiji and Ceccio2012) reported a similar observation in their experiments, where continued stretching beyond the first inception event did not result in further cavitation events.
Figure 17( $b$
–
$b$
– $d$
) shows the distribution of axial stretching (
$d$
) shows the distribution of axial stretching ( $\phi _{\textit{ax}}$
), axial strain (
$\phi _{\textit{ax}}$
), axial strain ( $S_{\textit{ax}}$
) and axial velocity (
$S_{\textit{ax}}$
) and axial velocity ( $u_{\textit{ax}}$
) conditioned on
$u_{\textit{ax}}$
) conditioned on $C_{\kern-1pt p} \lt -1.5$
at the same four instances. Positive
$C_{\kern-1pt p} \lt -1.5$
at the same four instances. Positive $\phi$
denotes axial stretching and negative
$\phi$
denotes axial stretching and negative $\phi$
denotes axial compression. The distributions remain near symmetric at all instances, and these low-pressure regions experience both stretching and compression. A similar behaviour was reported in the shear layer cavitation experiments by Agarwal et al. (Reference Agarwal, Ram, Lu and Katz2023), although the underlying inception mechanisms differ. As the instability progresses, the distributions broaden, with peak axial stretching increasing by a factor of five at inception instance (red curve). Post-inception, the curves shorten as loss of circulation in both vortices reduces the stretching intensities. A similar trend is observed with axial strain in terms of symmetry and broadening-shortening behaviour of the distributions.
$\phi$
denotes axial compression. The distributions remain near symmetric at all instances, and these low-pressure regions experience both stretching and compression. A similar behaviour was reported in the shear layer cavitation experiments by Agarwal et al. (Reference Agarwal, Ram, Lu and Katz2023), although the underlying inception mechanisms differ. As the instability progresses, the distributions broaden, with peak axial stretching increasing by a factor of five at inception instance (red curve). Post-inception, the curves shorten as loss of circulation in both vortices reduces the stretching intensities. A similar trend is observed with axial strain in terms of symmetry and broadening-shortening behaviour of the distributions.
The axial velocity distribution (figure 17 $d$
) is broader when compared with stretching and strain. While some portions of the core have velocities higher than
$d$
) is broader when compared with stretching and strain. While some portions of the core have velocities higher than $U_\infty$
, the bulk of the core has lower velocities. Unlike stretching or strain, no significant change in the peak velocities occurs as the Crow instability grows. Also, as the interaction progresses, the velocity in the bulk of the core appears to decrease gradually.
$U_\infty$
, the bulk of the core has lower velocities. Unlike stretching or strain, no significant change in the peak velocities occurs as the Crow instability grows. Also, as the interaction progresses, the velocity in the bulk of the core appears to decrease gradually.
Probability distribution functions (p.d.f.s) of $(a)$
pressure,
$(a)$
pressure, $(b)$
axial stretching,
$(b)$
axial stretching, $(c)$
axial strain and
$(c)$
axial strain and $(d)$
axial velocity in the weaker vortex at four instances conditioned on
$(d)$
axial velocity in the weaker vortex at four instances conditioned on $C_{\kern-1pt p} \lt -1.5$
. Labels on the y axis are the logarithmic values.
$C_{\kern-1pt p} \lt -1.5$
. Labels on the y axis are the logarithmic values.

Joint p.d.f. of pressure ( $C_{\kern-1pt p}$
) with axial vorticity (
$C_{\kern-1pt p}$
) with axial vorticity ( $\omega _{\textit{ax}}$
) and axial stretching (
$\omega _{\textit{ax}}$
) and axial stretching ( $\phi _{\textit{ax}}$
) at: (
$\phi _{\textit{ax}}$
) at: ( $a{,}b$
)
$a{,}b$
) $t'U_{\infty }/c = 0.30$
; (
$t'U_{\infty }/c = 0.30$
; ( $c{,}d$
)
$c{,}d$
) $t'U_{\infty }/c = 0.48$
; (
$t'U_{\infty }/c = 0.48$
; ( $e{,}f$
)
$e{,}f$
) $t'U_{\infty }/c = 0.58$
and (
$t'U_{\infty }/c = 0.58$
and ( $g{,}h$
)
$g{,}h$
) $t'U_{\infty }/c = 0.68$
. The vertical dashed line denotes the saturated vapour pressure.
$t'U_{\infty }/c = 0.68$
. The vertical dashed line denotes the saturated vapour pressure.

Joint p.d.f. of pressure ( $C_{\kern-1pt p}$
) and axial velocity (
$C_{\kern-1pt p}$
) and axial velocity ( $u_{\textit{ax}}$
) at: (
$u_{\textit{ax}}$
) at: ( $a$
)
$a$
) $t'U_{\infty }/c = 0.30$
; (
$t'U_{\infty }/c = 0.30$
; ( $b$
)
$b$
) $t'U_{\infty }/c = 0.48$
; (
$t'U_{\infty }/c = 0.48$
; ( $c$
)
$c$
) $t'U_{\infty }/c = 0.58$
and (
$t'U_{\infty }/c = 0.58$
and ( $d$
)
$d$
) $t'U_{\infty }/c = 0.68$
. The vertical dashed line denotes the saturated vapour pressure.
$t'U_{\infty }/c = 0.68$
. The vertical dashed line denotes the saturated vapour pressure.

While the trends of axial stretching, strain and velocity are clear, their correlation with inception pressures is unclear. Hence, we compute the joint p.d.f.s to examine regions with pressures close to or below the inception pressure. Figure 18 shows the joint p.d.f. of pressure with axial vorticity and axial stretching conditioned on $C_{\kern-1pt p} \lt -1.5$
. For both stretching and vorticity, the distribution becomes narrower as the pressure decreases. While the lowest-pressure regions consistently have the highest vorticity, the corresponding stretching intensities are the smallest. The stronger correlation between low pressure and large vorticity is consistent with the analytical models (Rankine, Lamb–Oseen, Burgers vortex); however, the low axial stretching intensity indicates that the axial strain is non-uniform across the core cross-section, with higher intensities at the core periphery and lower values in the core interior. The joint p.d.f. of pressure and axial velocity (figure 19) does not show a consistent trend like those of stretching or vorticity. Before and after inception, the velocities have a broad distribution. However, the inception regions have a significantly lower velocity and the velocity decreases with decreasing pressure. This concurs with the experimental observations of Knister et al. (Reference Knister, Ganesh and Ceccio2024) where no significant axial jet was observed in the inception locations.
$C_{\kern-1pt p} \lt -1.5$
. For both stretching and vorticity, the distribution becomes narrower as the pressure decreases. While the lowest-pressure regions consistently have the highest vorticity, the corresponding stretching intensities are the smallest. The stronger correlation between low pressure and large vorticity is consistent with the analytical models (Rankine, Lamb–Oseen, Burgers vortex); however, the low axial stretching intensity indicates that the axial strain is non-uniform across the core cross-section, with higher intensities at the core periphery and lower values in the core interior. The joint p.d.f. of pressure and axial velocity (figure 19) does not show a consistent trend like those of stretching or vorticity. Before and after inception, the velocities have a broad distribution. However, the inception regions have a significantly lower velocity and the velocity decreases with decreasing pressure. This concurs with the experimental observations of Knister et al. (Reference Knister, Ganesh and Ceccio2024) where no significant axial jet was observed in the inception locations.
7. Summary
This study investigates cavitation inception mechanisms during the interaction between a pair of unequal-strength counter-rotating vortices in the wake of hydrofoils, using large-eddy simulation (LES) at $ \textit{Re} = 1.7 \times 10^6$
based on the chord length (under the experimental conditions mentioned by Knister et al. (Reference Knister, Callison, Ganesh and Ceccio2020)). An overset methodology is adopted for performing the simulations, allowing locally refined meshes to accurately capture the unsteady vortex interactions. The two-dimensional (2-D) core properties are validated against the experimental data, showing good agreement for the core size and axial vorticity profiles. In the near-wake region, rapid deceleration of the core axial velocity and vorticity occurs in both vortices with the weaker vortex undergoing a jet-to-wake transition. As a result, the core pressure in both vortices increases, contrary to the conditions required for inception.
$ \textit{Re} = 1.7 \times 10^6$
based on the chord length (under the experimental conditions mentioned by Knister et al. (Reference Knister, Callison, Ganesh and Ceccio2020)). An overset methodology is adopted for performing the simulations, allowing locally refined meshes to accurately capture the unsteady vortex interactions. The two-dimensional (2-D) core properties are validated against the experimental data, showing good agreement for the core size and axial vorticity profiles. In the near-wake region, rapid deceleration of the core axial velocity and vorticity occurs in both vortices with the weaker vortex undergoing a jet-to-wake transition. As a result, the core pressure in both vortices increases, contrary to the conditions required for inception.
The Crow instability develops on the weaker vortex beyond $x/c \sim 1.0$
, leading to its stretching and wrapping around the stronger vortex. While the average weaker core pressure reduces by a factor of
$x/c \sim 1.0$
, leading to its stretching and wrapping around the stronger vortex. While the average weaker core pressure reduces by a factor of $2.5$
compared with the unperturbed pressure, instantaneous pressure reduction reaches a factor of
$2.5$
compared with the unperturbed pressure, instantaneous pressure reduction reaches a factor of $3{-}4$
intermittently, sufficient to trigger cavitation. The pressure contours in the symmetry plane have been examined to understand the changes in core structure, circulation and pressure. Inception occurs as the cores approach close to each other, and the inception duration is found to be one to two orders of magnitude smaller than the time period of the Crow cycle. Following inception, the strain field of the weaker vortex deforms the stronger core and strips vorticity from its top, resulting in circulation decay of approximately
$3{-}4$
intermittently, sufficient to trigger cavitation. The pressure contours in the symmetry plane have been examined to understand the changes in core structure, circulation and pressure. Inception occurs as the cores approach close to each other, and the inception duration is found to be one to two orders of magnitude smaller than the time period of the Crow cycle. Following inception, the strain field of the weaker vortex deforms the stronger core and strips vorticity from its top, resulting in circulation decay of approximately $20\,\%$
. The circulation of the weaker core also decreases by
$20\,\%$
. The circulation of the weaker core also decreases by $40\,\%$
during its complex interaction with the secondary vortices.
$40\,\%$
during its complex interaction with the secondary vortices.
Statistical analysis of the weaker vortex properties over multiple Crow cycles reveals that inception occurs once per cycle and is most likely to occur near the central regions of the wavelength. The inception duration varies significantly between cycles ( $ {\gt} 25\,\%$
). Conditional averages show that the mean axial stretching increases significantly in the early phase, reaches a peak after inception and decreases as the circulation strength decays. The stretching intensities in the central portions of the wavelength are found to be four times larger than the wavelength-averaged value, highlighting the impact of the localised stretching on the strong intermittent pressure fluctuations.
$ {\gt} 25\,\%$
). Conditional averages show that the mean axial stretching increases significantly in the early phase, reaches a peak after inception and decreases as the circulation strength decays. The stretching intensities in the central portions of the wavelength are found to be four times larger than the wavelength-averaged value, highlighting the impact of the localised stretching on the strong intermittent pressure fluctuations.
The probability distribution function (p.d.f.) analysis reveals that only a small portion of the weaker vortex has pressure lower than vapour pressure. While the mean axial stretching remained positive throughout the Crow cycle, the distribution showed that some of the inception regions experienced stretching, while the rest experienced compression. The joint p.d.f. analysis shows that the inception regions have high vorticity but relatively lower stretching intensities and velocities compared with the bulk of the core.
Funding
This work is supported by the United States Office of Naval Research under grants ONR N00014-17-1-2676 and ONR N00014-23-1-2678 with Dr Ki-Han Kim and Yin-Lu Young as programme managers. The computing resources were provided by the High-Performance Computing Modernization Program (HPCMP) and the Minnesota Supercomputing Institute (MSI).
Declaration of interests
The authors report no conflict of interest.


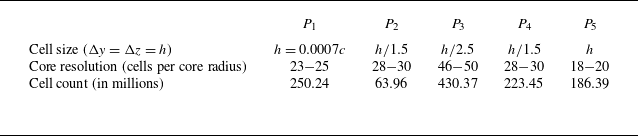

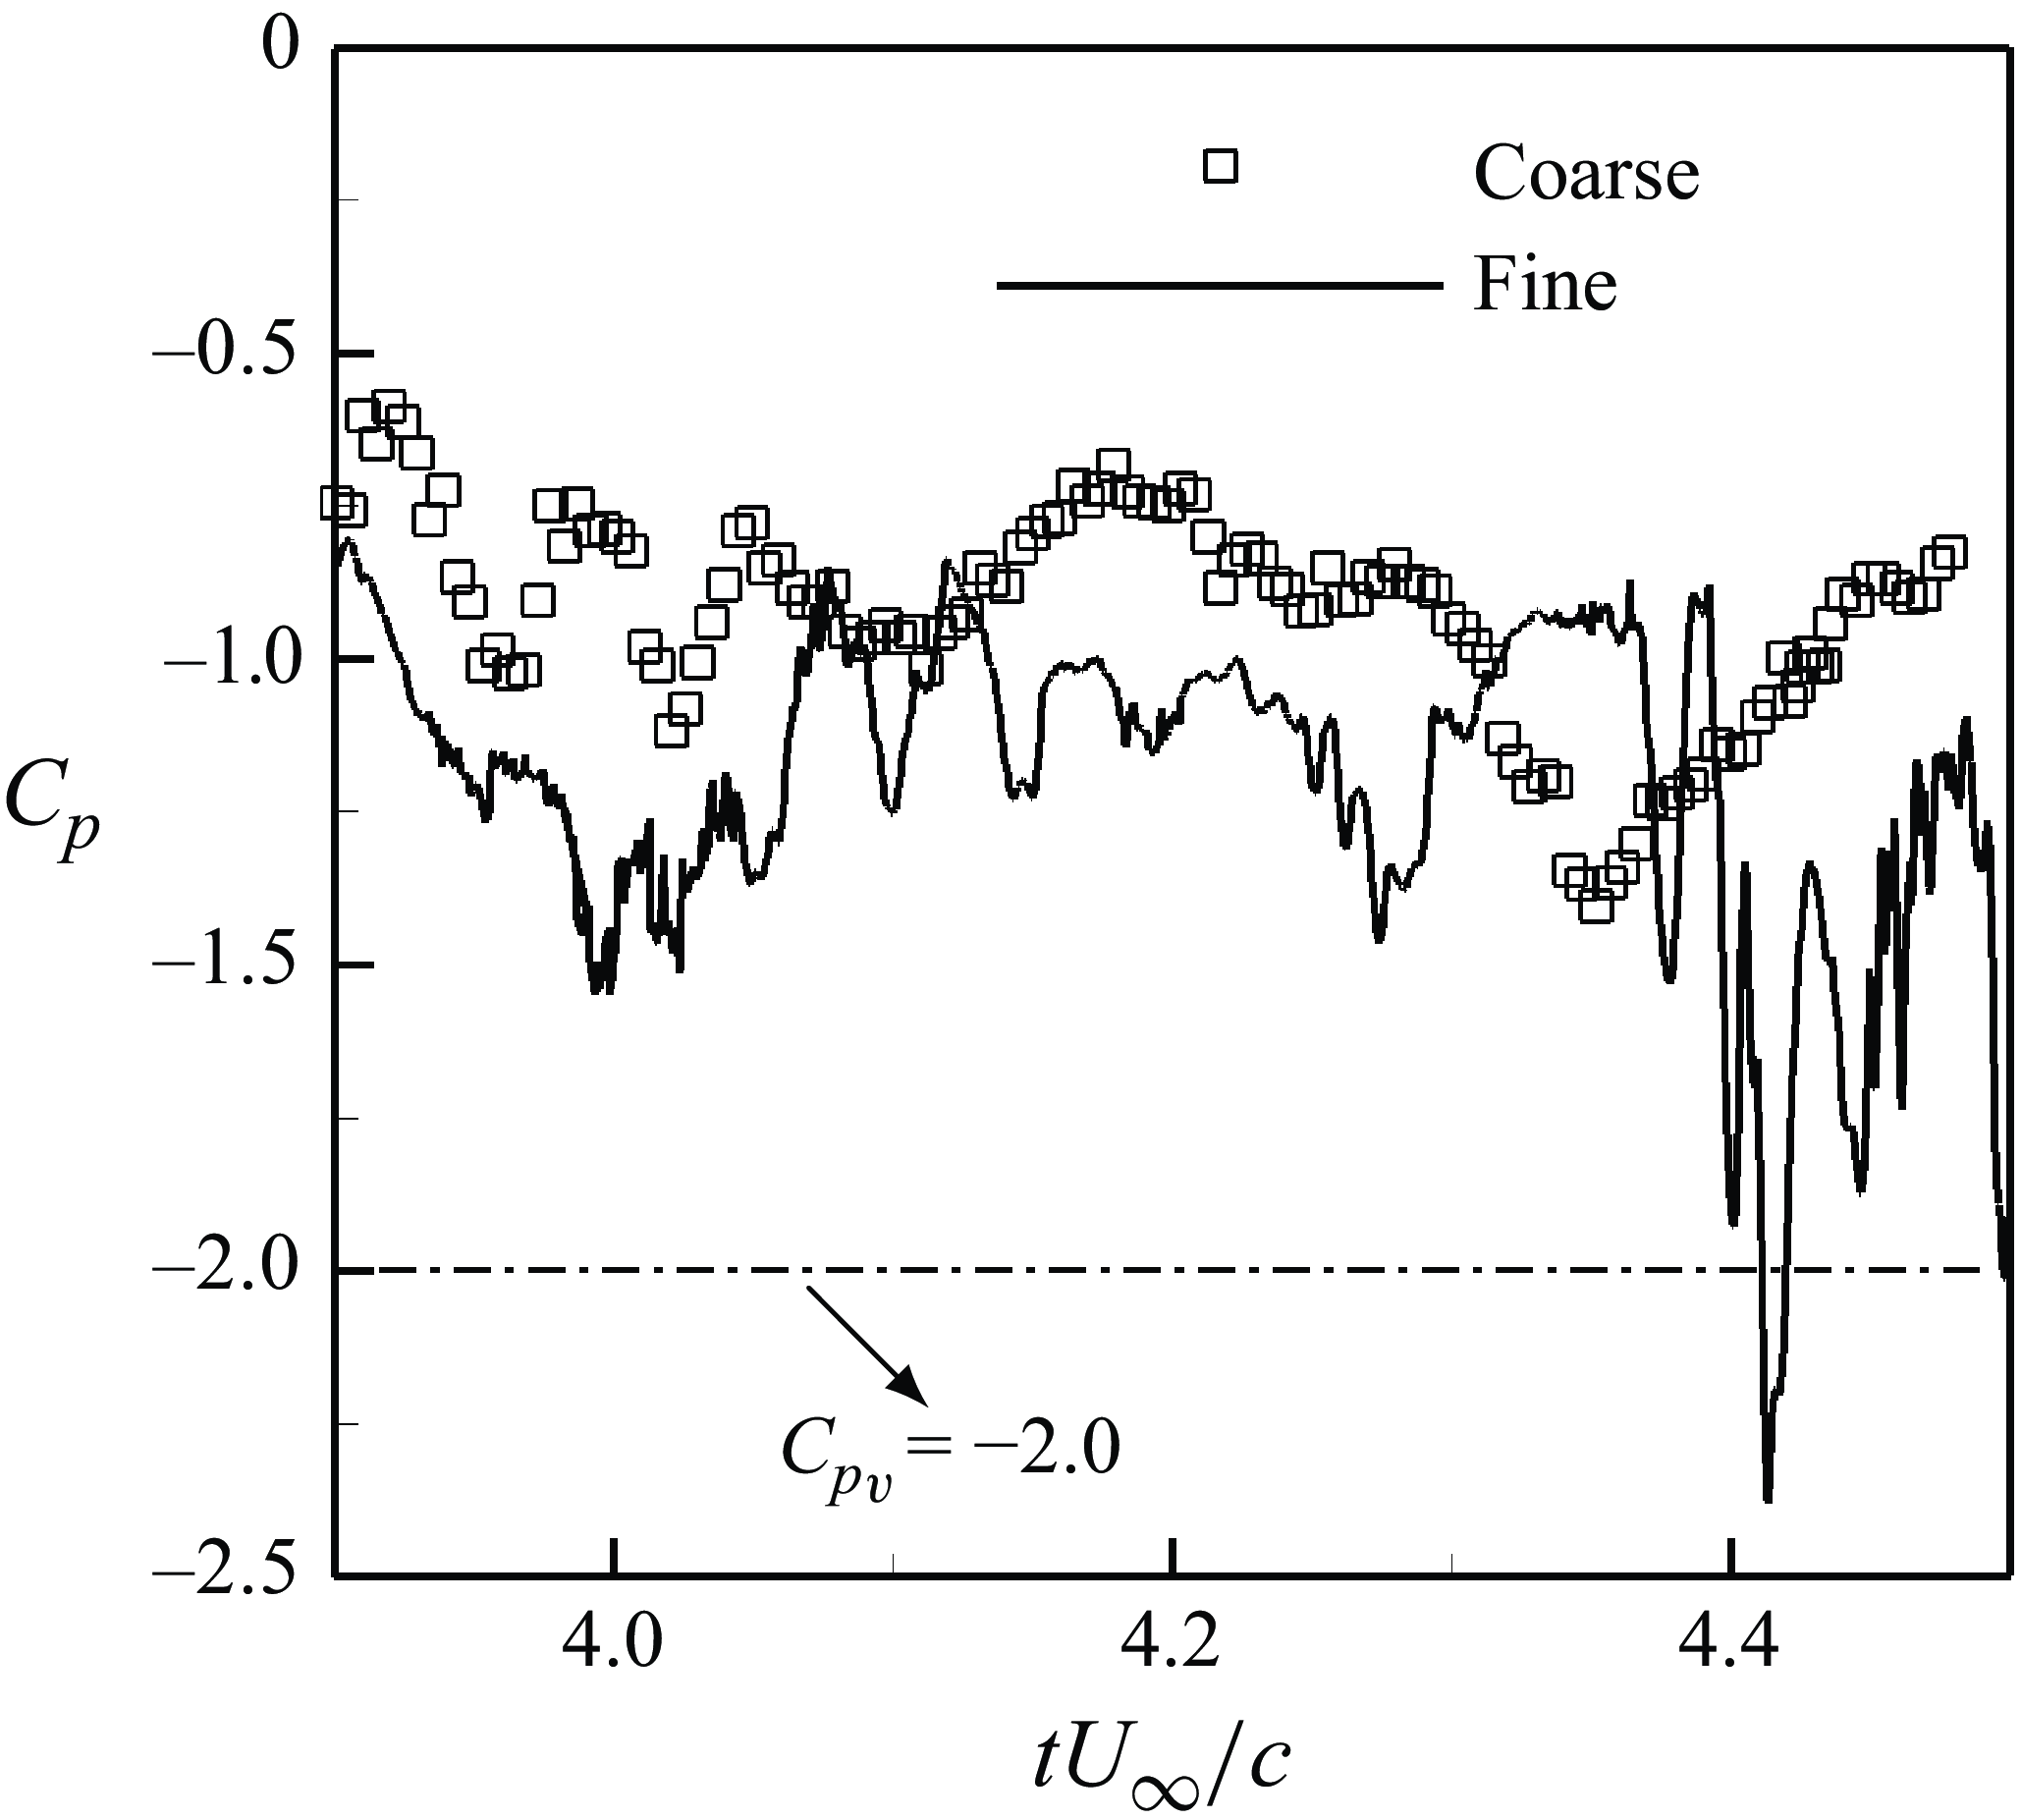


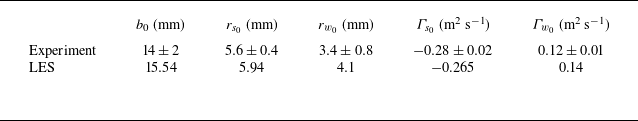


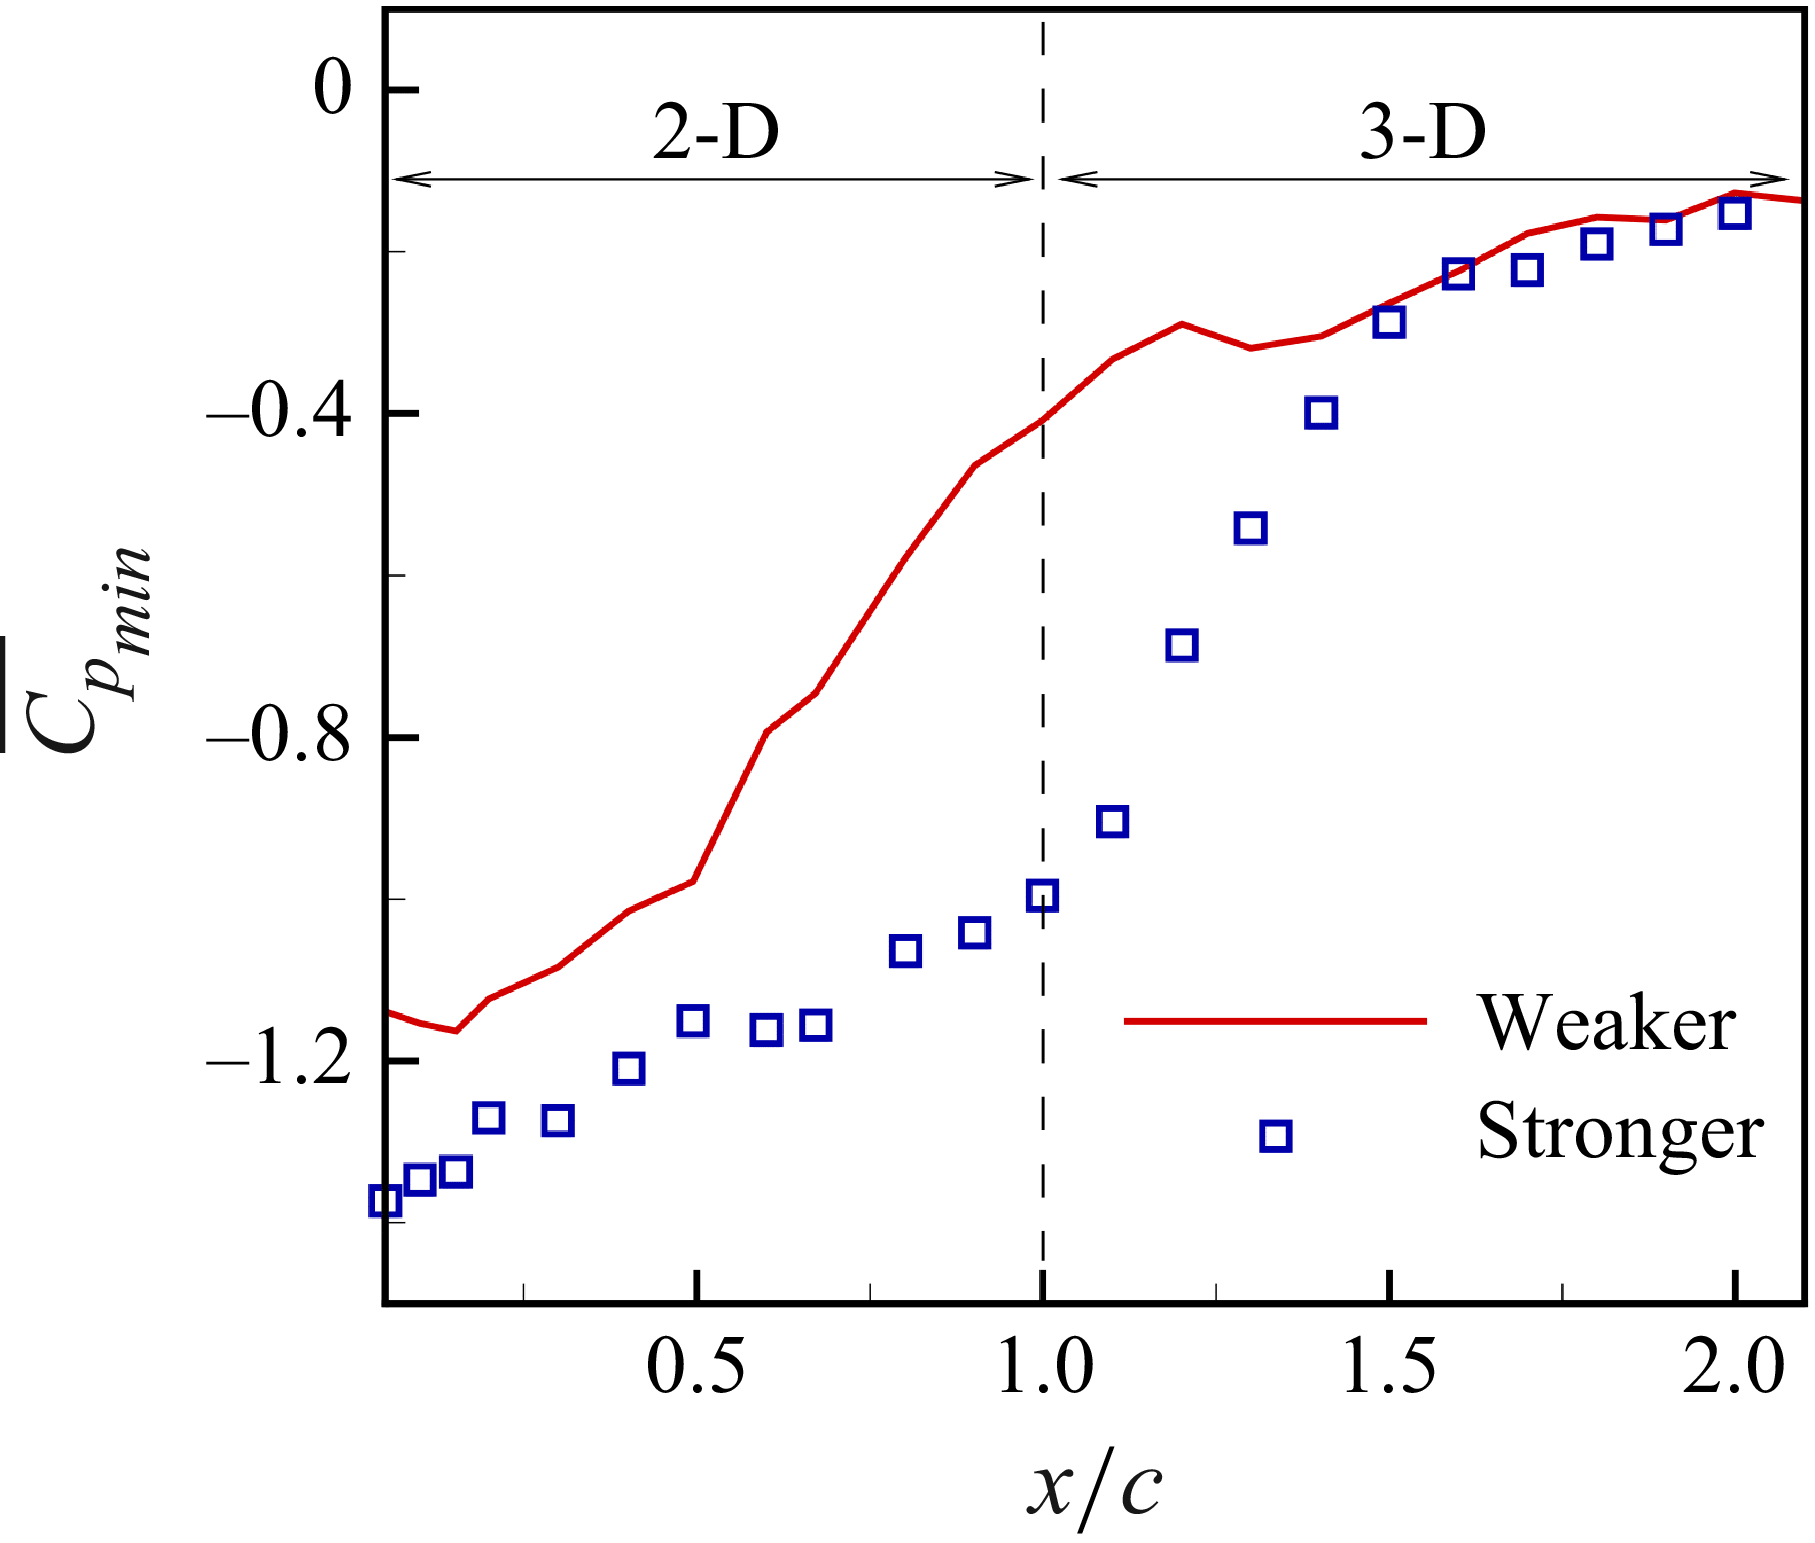


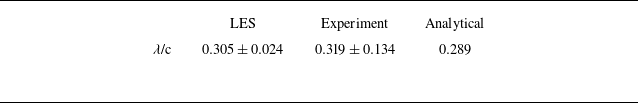


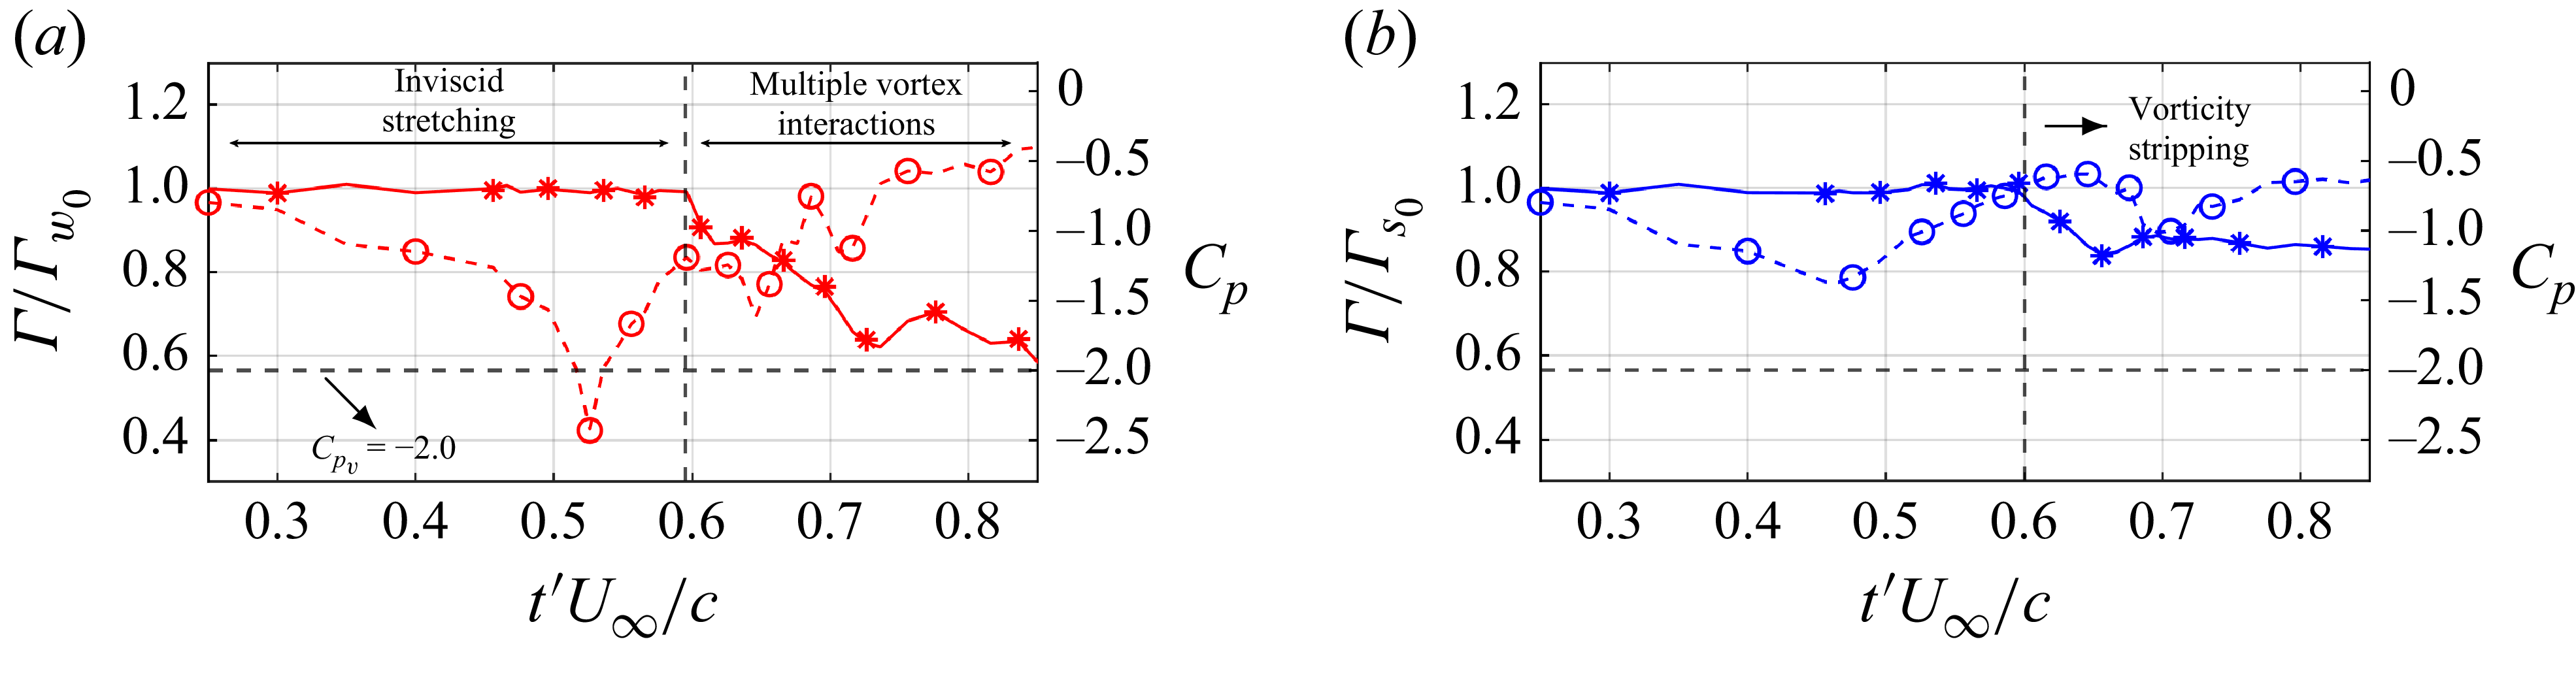


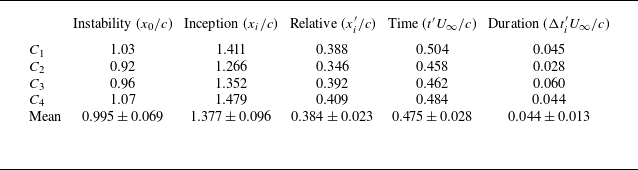

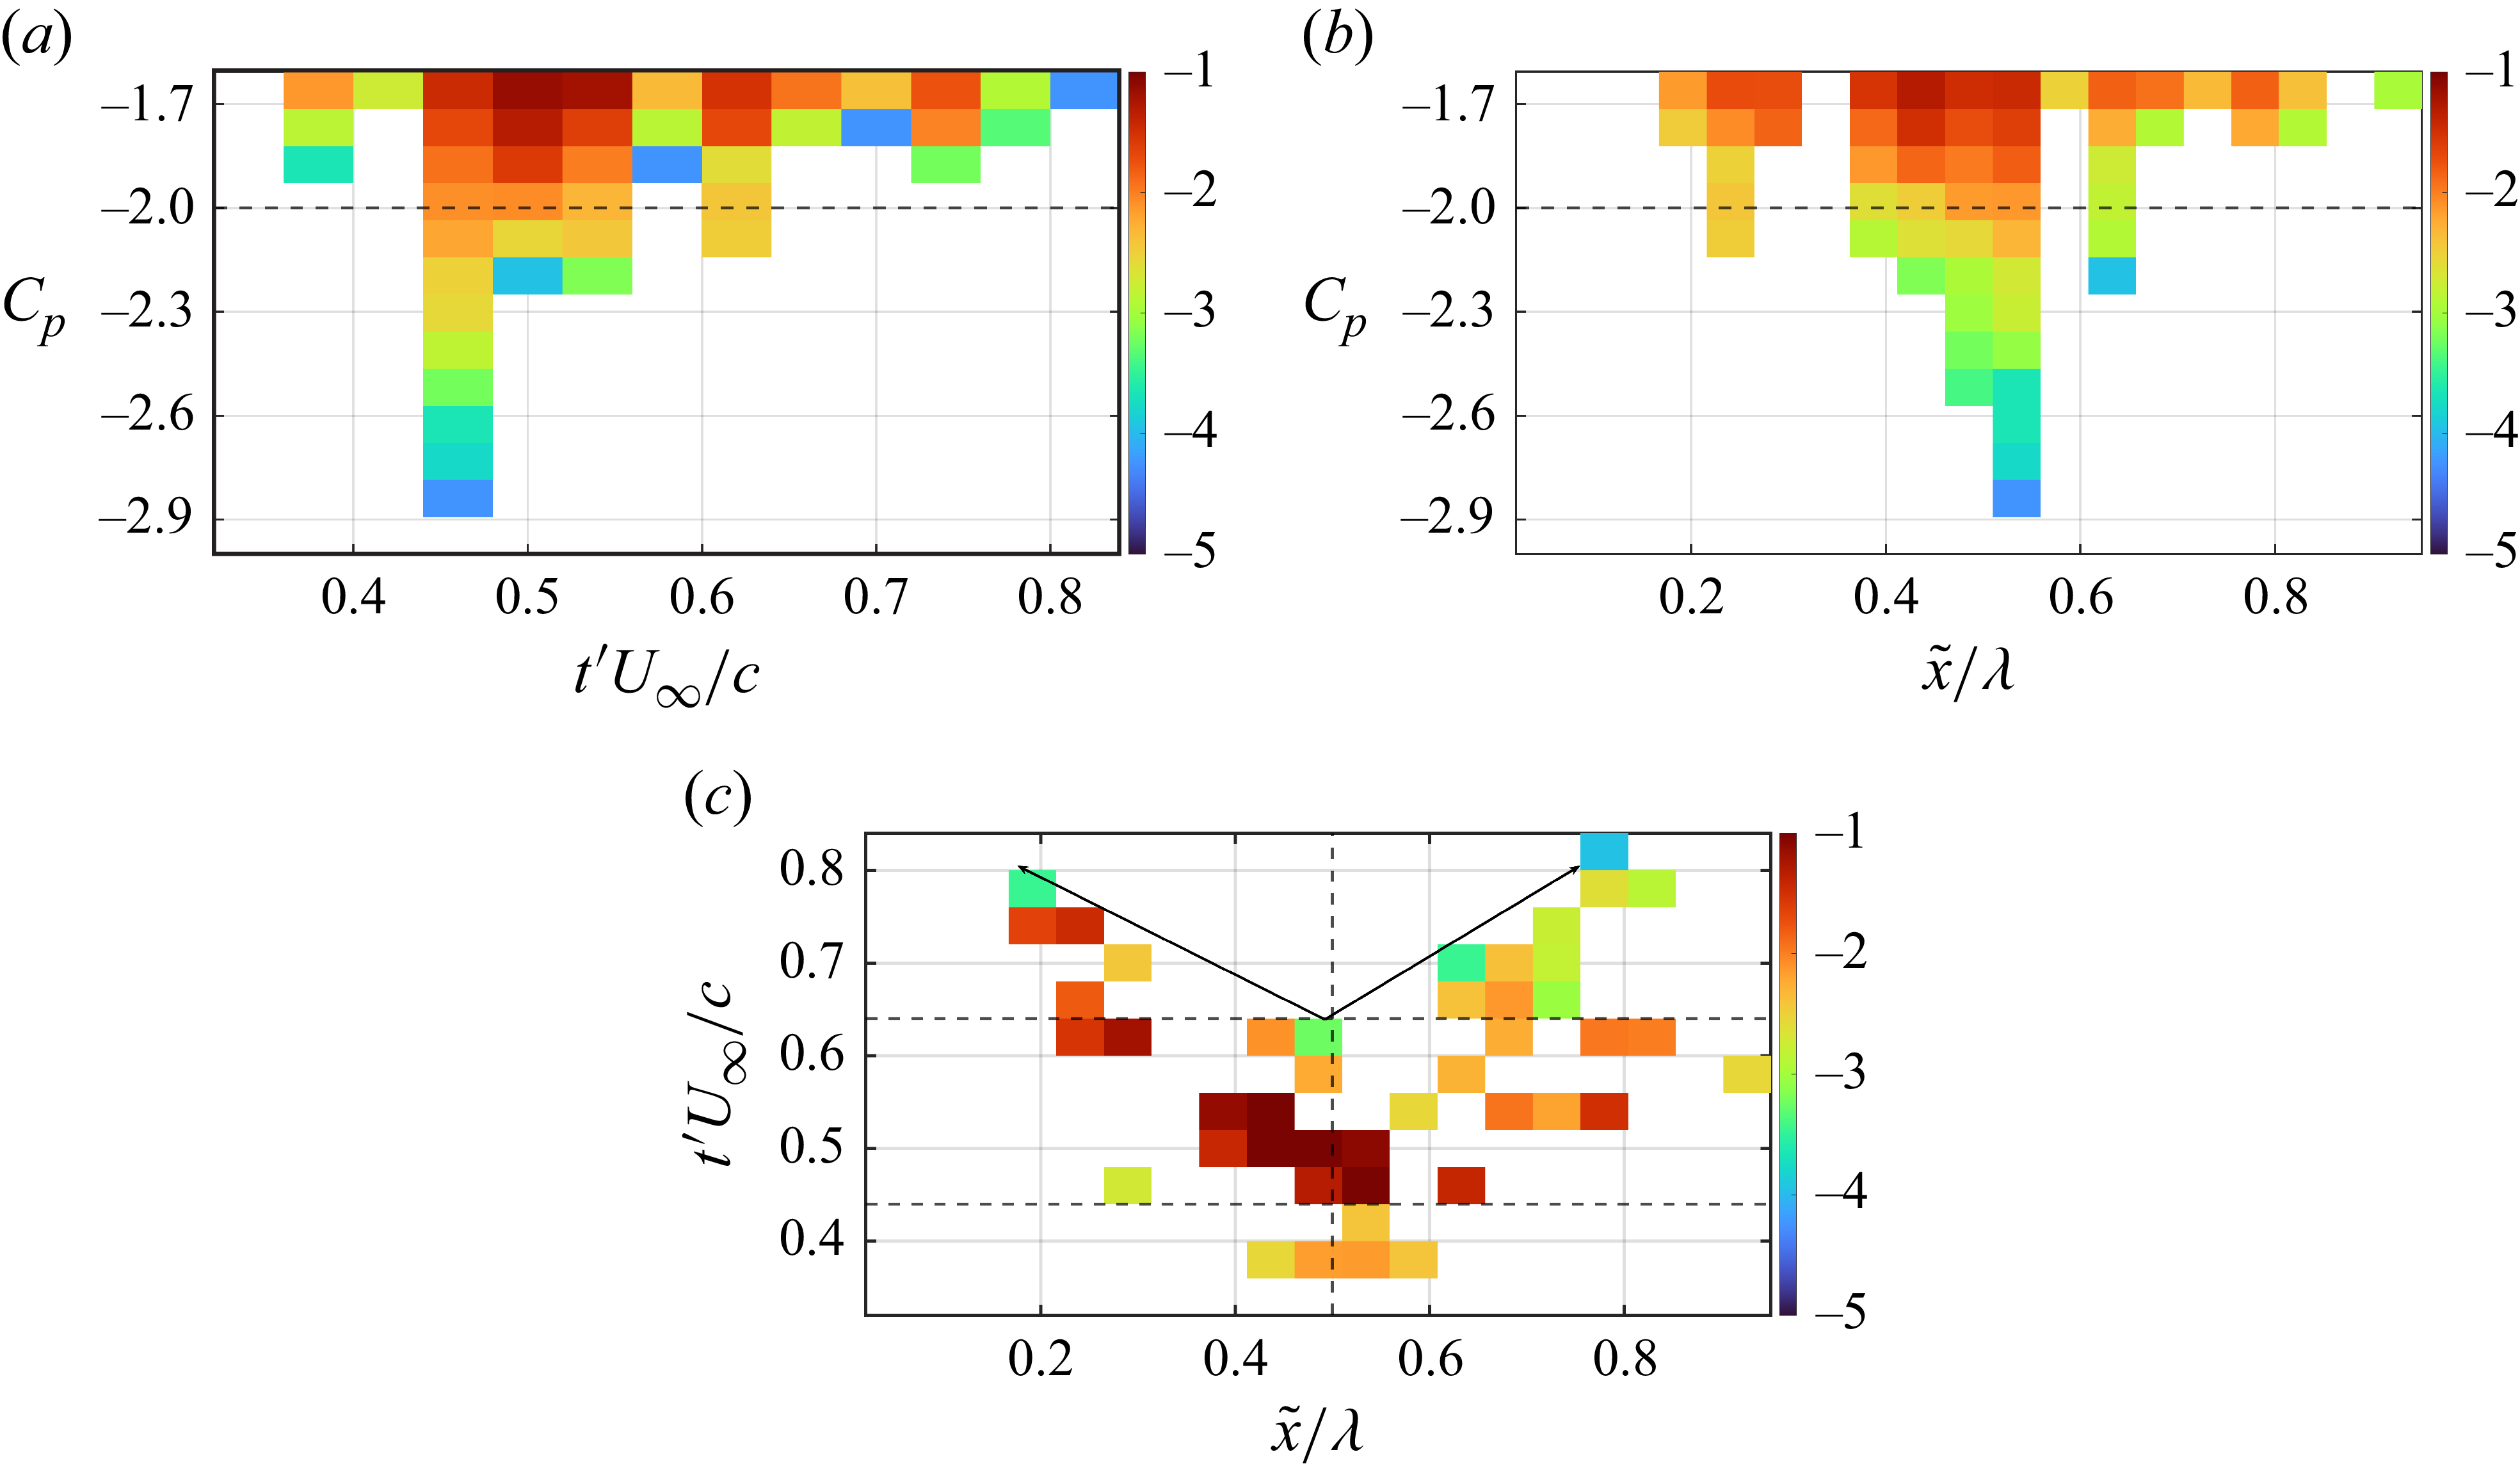


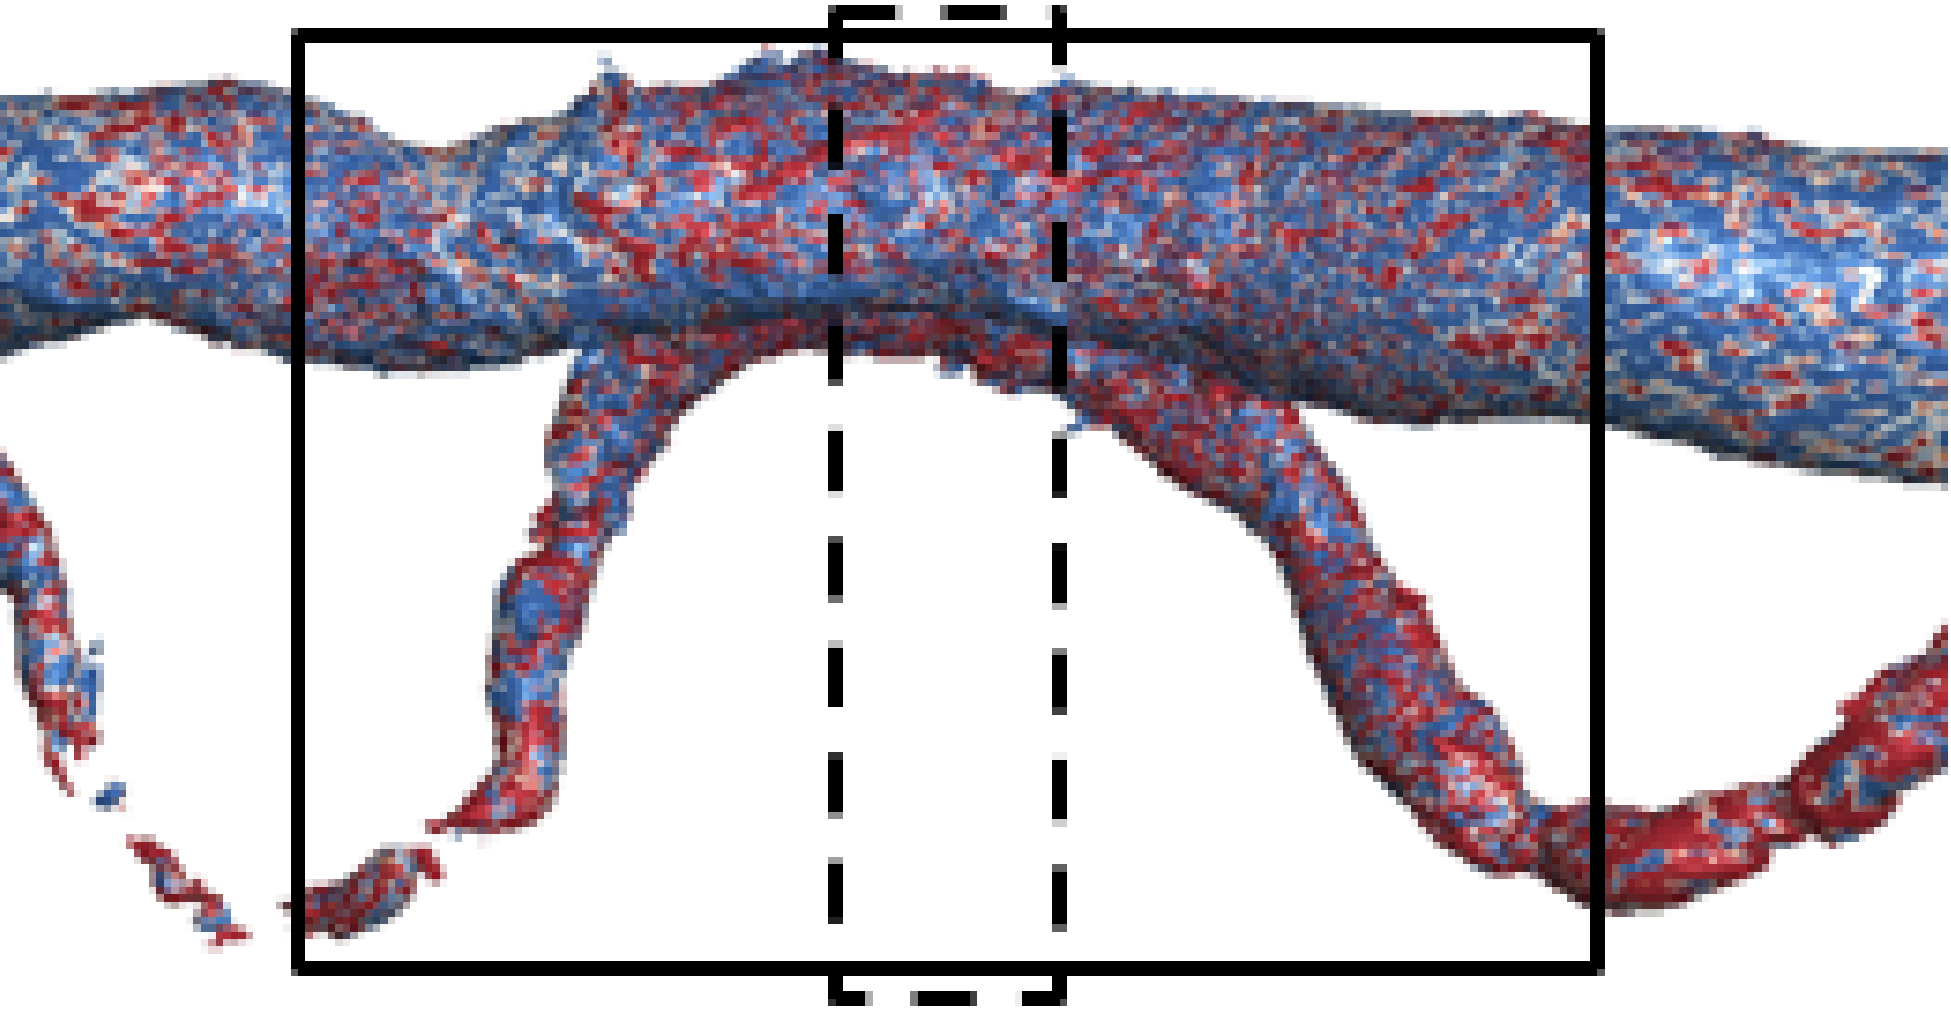


 Open access