


1. Introduction
The dynamics of settling micrometre-sized dust clouds in viscous fluids (air or water) is a fundamental problem in fluid mechanics, with relevance to many natural phenomena and engineering applications. Different from individual particles, long-range hydrodynamic interactions between the particles in a cloud lead to greater settling velocities (Guazzelli, Morris & Pic Reference Guazzelli, Morris and Pic2011; Yang, Li & Marshall Reference Yang, Li and Marshall2015) and give rise to complex behaviours such as the formation of vertical tails, toroidal structures and eventual cloud break-up. While this problem has received considerable attention (Nitsche & Batchelor Reference Nitsche and Batchelor1997; Bosse et al. Reference Bosse, Kleiser, Favre and Meiburg2005a
,
Reference Bosse, Kleiser, Härtel and Meiburgb
; Metzger, Nicolas & Guazzelli Reference Metzger, Nicolas and Guazzelli2007; Subramanian & Koch Reference Subramanian and Koch2008; Pignatel, Nicolas & Guazzelli Reference Pignatel, Nicolas and Guazzelli2011; Chen et al. 2018, 2021), prior studies have primarily focused on continuum-flow regimes where the ratio of the mean free path of fluid molecules to the particle size (i.e. the Knudsen number $Kn$
) is negligibly small. In such cases, hydrodynamic interactions are well described by the Navier–Stokes equations, with the particle Reynolds number
$Kn$
) is negligibly small. In such cases, hydrodynamic interactions are well described by the Navier–Stokes equations, with the particle Reynolds number $Re_p$
serving as the principal control parameter.
$Re_p$
serving as the principal control parameter.
By contrast, this paper is concerned with the dynamics of particle clouds in transition and rarefied flow regimes with $Kn\gt 0.1$
and small (but finite) particle Reynolds number (
$Kn\gt 0.1$
and small (but finite) particle Reynolds number ( $0\lt Re_p \ll 1$
). These conditions arise in a range of practical scenarios, including aerosol transport (or drug delivery) in the deep lungs, particulate contamination in micro/nanoscale devices, and dust motion in vacuum or low-pressure environments. A relevant example of the latter is the sedimentation of small Martian dust clouds within dust devils and sandstorms. With atmospheric pressure on Mars being only approximately 1 % of that on Earth, the local Knudsen number can reach values of the order of
$0\lt Re_p \ll 1$
). These conditions arise in a range of practical scenarios, including aerosol transport (or drug delivery) in the deep lungs, particulate contamination in micro/nanoscale devices, and dust motion in vacuum or low-pressure environments. A relevant example of the latter is the sedimentation of small Martian dust clouds within dust devils and sandstorms. With atmospheric pressure on Mars being only approximately 1 % of that on Earth, the local Knudsen number can reach values of the order of $\textit {O}(1)$
. The dusty phenomena pose major challenges to human Mars exploration: for instance, dust accumulation on solar panels has been the key factor disabling NASA’s Opportunity and China’s Zhurong rovers (Staab et al. Reference Staab, Herman, Reich, Sridhar and Nelson2020; Wang et al. 2023). While dust lifting (Renno & Kok Reference Renno and Kok2008) and dust deposition rates (Johnson, Grundy & Lemmon Reference Johnson, Grundy and Lemmon2003; Drube et al. Reference Drube2010; Kinch et al. Reference Kinch, Bell, Goetz, Johnson, Joseph, Madsen and Sohl‐Dickstein2015; Vicente-Retortillo et al. Reference Vicente-Retortillo, Martínez, Renno, Newman, Ordonez-Etxeberria, Lemmon, Richardson, Hueso and Sánchez-Lavega2018; Lorenz et al. Reference Lorenz2020; Yingst et al. Reference Yingst, Bray, Herkenhoff, Lemmon, Minitti, Schmidt, Edgett, Fey and Kah2020; Zhang et al. Reference Zhang, Liu, Ren, Wang, Guo, Chen, Liu, Chen, Yan and Liu2023) in the Martian atmosphere have been widely studied, the dynamics governing dust sedimentation remain far less well understood. Another related process is dust removal in electrostatic precipitators (ESPs), which are likely to be critical components of in situ resource utilisation systems on Mars for producing fuel and oxygen from atmospheric
$\textit {O}(1)$
. The dusty phenomena pose major challenges to human Mars exploration: for instance, dust accumulation on solar panels has been the key factor disabling NASA’s Opportunity and China’s Zhurong rovers (Staab et al. Reference Staab, Herman, Reich, Sridhar and Nelson2020; Wang et al. 2023). While dust lifting (Renno & Kok Reference Renno and Kok2008) and dust deposition rates (Johnson, Grundy & Lemmon Reference Johnson, Grundy and Lemmon2003; Drube et al. Reference Drube2010; Kinch et al. Reference Kinch, Bell, Goetz, Johnson, Joseph, Madsen and Sohl‐Dickstein2015; Vicente-Retortillo et al. Reference Vicente-Retortillo, Martínez, Renno, Newman, Ordonez-Etxeberria, Lemmon, Richardson, Hueso and Sánchez-Lavega2018; Lorenz et al. Reference Lorenz2020; Yingst et al. Reference Yingst, Bray, Herkenhoff, Lemmon, Minitti, Schmidt, Edgett, Fey and Kah2020; Zhang et al. Reference Zhang, Liu, Ren, Wang, Guo, Chen, Liu, Chen, Yan and Liu2023) in the Martian atmosphere have been widely studied, the dynamics governing dust sedimentation remain far less well understood. Another related process is dust removal in electrostatic precipitators (ESPs), which are likely to be critical components of in situ resource utilisation systems on Mars for producing fuel and oxygen from atmospheric $\textrm {CO}_2$
(Clements et al. Reference Clements, Thompson, Cox, Johansen, Williams, Hogue, Lowder and Calle2013; Starr & Muscatello Reference Starr and Muscatello2020). Understanding the migration of (charged) dust clouds is essential for improving the design and performance of such devices.
$\textrm {CO}_2$
(Clements et al. Reference Clements, Thompson, Cox, Johansen, Williams, Hogue, Lowder and Calle2013; Starr & Muscatello Reference Starr and Muscatello2020). Understanding the migration of (charged) dust clouds is essential for improving the design and performance of such devices.
The appropriate treatment of hydrodynamic interactions between particles depends on the flow regime. In continuum conditions where the Navier–Stokes equations (and their linear approximations) apply, it has been shown that by superposing the disturbance flow of individual particles, the simulation can reasonably reproduce the collective dynamics observed in experiments (Bosse et al. Reference Bosse, Kleiser, Favre and Meiburg2005b ). These dynamics include strong instabilities leading to particle leakage, tail formation, deformation and cloud break-up. Consequently, analytical results in this regime are largely limited to the initial cloud settling velocity (Yang et al. Reference Yang, Li and Marshall2015) and certain self-similar solutions under long-range repulsive interactions (Subramanian & Koch Reference Subramanian and Koch2008). Regarding tail formation, Pignatel et al. (Reference Pignatel, Nicolas and Guazzelli2011) identified a dimensionless inertial length as a potential control parameter for dense clouds, but a quantitative theory remains elusive.
In the transition-flow regime, however, the continuum-flow solutions are not applicable. The flow past a sphere must instead be solved from the kinetic Boltzmann equation (Sharipov Reference Sharipov2015), with some results for the flow field obtained by Takata, Sone & Aoki (Reference Takata, Sone and Aoki1993) and Taguchi (Reference Taguchi2015) for the entire range of $Kn$
. The presence of multiple particles further complicates the problem, primarily due to the immense computational costs. Gopinath & Koch (Reference Gopinath and Koch1999) analysed corrections to the drag force arising from hydrodynamic interactions between two equal spheres. For more particles, the lattice Boltzmann method with slip boundary conditions has been employed to perform particle-resolved simulations (Tao, Guo & Wang Reference Tao, Guo and Wang2017). However, based on the parameters in § 2, fully resolving a 1 cm dust cloud under Martian-like conditions with grid resolution comparable to the particle size would require on the order of
$Kn$
. The presence of multiple particles further complicates the problem, primarily due to the immense computational costs. Gopinath & Koch (Reference Gopinath and Koch1999) analysed corrections to the drag force arising from hydrodynamic interactions between two equal spheres. For more particles, the lattice Boltzmann method with slip boundary conditions has been employed to perform particle-resolved simulations (Tao, Guo & Wang Reference Tao, Guo and Wang2017). However, based on the parameters in § 2, fully resolving a 1 cm dust cloud under Martian-like conditions with grid resolution comparable to the particle size would require on the order of $10^9$
grid points, making direct simulations computationally prohibitive. As a first attempt to characterise the transition-flow hydrodynamic interactions, we consider sparse clouds, in which the mean particle spacing exceeds 100 times the particle size (see details in § 2), and approximate the flow ‘linearly’ by superposing the velocity disturbances induced by individual particles.
$10^9$
grid points, making direct simulations computationally prohibitive. As a first attempt to characterise the transition-flow hydrodynamic interactions, we consider sparse clouds, in which the mean particle spacing exceeds 100 times the particle size (see details in § 2), and approximate the flow ‘linearly’ by superposing the velocity disturbances induced by individual particles.
An additional factor affecting the dynamics of microparticle to ease reading clouds is particle charging, which is likely to occur commonly on many celestial bodies with thin or no atmospheres (Gu et al. Reference Gu2024). On Mars, particles are believed to acquire charge through triboelectrification (‘frictional electrification’) and ultraviolet irradiation from the Sun (Gao, Xie & Zhou Reference Gao, Xie and Zhou2023). As of June 2025, no direct measurements of dust particle charging on Mars have been reported. However, studies on Martian ESPs suggest that classical particle charging theories remain valid under Martian conditions (Clements et al. Reference Clements, Thompson, Cox, Johansen, Williams, Hogue, Lowder and Calle2013; Kawamoto & Kojima Reference Kawamoto and Kojima2019). Chen, Liu & Li (Reference Chen, Liu and Li2018) first investigated particle cloud migration under the combined influence of hydrodynamic and electrostatic interactions in the continuum regime, revealing a transition from hydrodynamic to repulsion-dominated behaviour. Despite these findings, such phenomena remain largely unexplored in the transition-flow regime.
This study aims to address these gaps by numerically simulating the evolution of particle clouds in the transition-flow regime, incorporating both hydrodynamic and electrostatic interactions. The model problem is defined by the set of parameters including the particle radius $a$
, cloud radius
$a$
, cloud radius $R_0$
, number of particles
$R_0$
, number of particles $N$
(or equivalently, number or mass concentration of particles), Knudsen number
$N$
(or equivalently, number or mass concentration of particles), Knudsen number $Kn$
, Mach number
$Kn$
, Mach number $Ma$
, and a dimensionless parameter
$Ma$
, and a dimensionless parameter $\kappa _q$
describing particle charge. Here,
$\kappa _q$
describing particle charge. Here, $Kn$
and
$Kn$
and $Ma$
govern the hydrodynamic interactions. Given computational constraints, we employ a kinematic model and approximate the hydrodynamic interactions by superposing rarefied gas flows past individual particles, as detailed in § 2 and the Appendices. The parameters are taken to be representative of small Martian dust clouds settling in the atmosphere and migrating in ESPs, with a focus on the 10
$Ma$
govern the hydrodynamic interactions. Given computational constraints, we employ a kinematic model and approximate the hydrodynamic interactions by superposing rarefied gas flows past individual particles, as detailed in § 2 and the Appendices. The parameters are taken to be representative of small Martian dust clouds settling in the atmosphere and migrating in ESPs, with a focus on the 10 $\,\unicode{x03BC}$
m diameter fraction (termed ‘settled dust’) of the greatest practical relevance (Landis et al. Reference Landis, Herkenhoff, Greeley, Thompson and Whelley2006). We note that the framework can be readily extended to other scenarios involving rarefied particulate flows, except for adjustments to boundary conditions. Importantly, unlike in continuum flows, clouds in the thin atmosphere are more stable due to weaker hydrodynamic interactions. This facilitates a clearer analysis of trailing dynamics. Simulation results and analysis of key processes (including cloud settling velocity, tail formation, and the interplay between hydrodynamic and electrostatic interactions) are presented in § 3 and § 4, respectively. Conclusions are drawn in § 5.
$\,\unicode{x03BC}$
m diameter fraction (termed ‘settled dust’) of the greatest practical relevance (Landis et al. Reference Landis, Herkenhoff, Greeley, Thompson and Whelley2006). We note that the framework can be readily extended to other scenarios involving rarefied particulate flows, except for adjustments to boundary conditions. Importantly, unlike in continuum flows, clouds in the thin atmosphere are more stable due to weaker hydrodynamic interactions. This facilitates a clearer analysis of trailing dynamics. Simulation results and analysis of key processes (including cloud settling velocity, tail formation, and the interplay between hydrodynamic and electrostatic interactions) are presented in § 3 and § 4, respectively. Conclusions are drawn in § 5.
2. Methods
The model problem considered in this study involves a small spherical cluster composed of monodisperse spherical particles migrating in the transition-flow regime. To assign physically relevant values to the parameters, we assume the ambient environment to be the static Martian atmosphere, where the pressure $p$
ranges from 4 to 8.7 mbar (1 mbar = 100 Pa), and the temperature
$p$
ranges from 4 to 8.7 mbar (1 mbar = 100 Pa), and the temperature $T$
ranges from
$T$
ranges from $-140\,^\circ$
C to
$-140\,^\circ$
C to $30\,^\circ$
C (Calle Reference Calle2017). The atmosphere is primarily composed of
$30\,^\circ$
C (Calle Reference Calle2017). The atmosphere is primarily composed of ${\textrm {CO}}_2$
(95.32 vol %),
${\textrm {CO}}_2$
(95.32 vol %), ${\textrm {N}}_2$
(2.7 vol %), Ar (1.6 vol %) and CO (0.07 vol %) (Franz et al. Reference Franz2017). Thus the properties of pure
${\textrm {N}}_2$
(2.7 vol %), Ar (1.6 vol %) and CO (0.07 vol %) (Franz et al. Reference Franz2017). Thus the properties of pure ${\textrm {CO}}_2$
are used in this model problem. In this context, the particles are taken to represent Martian dust, and we focus specifically on the 10
${\textrm {CO}}_2$
are used in this model problem. In this context, the particles are taken to represent Martian dust, and we focus specifically on the 10 $\,\unicode{x03BC}$
m ‘settled dust’ fraction, which is lifted into the atmosphere by wind and dust devils but eventually settles back to the ground (Landis et al. Reference Landis, Herkenhoff, Greeley, Thompson and Whelley2006). Another reason is that the efficiency of Martian ESPs in capturing 10
$\,\unicode{x03BC}$
m ‘settled dust’ fraction, which is lifted into the atmosphere by wind and dust devils but eventually settles back to the ground (Landis et al. Reference Landis, Herkenhoff, Greeley, Thompson and Whelley2006). Another reason is that the efficiency of Martian ESPs in capturing 10 $\,\unicode{x03BC}$
m particles is significantly diminished due to insufficient charging (Clements et al. Reference Clements, Thompson, Cox, Johansen, Williams, Hogue, Lowder and Calle2013).
$\,\unicode{x03BC}$
m particles is significantly diminished due to insufficient charging (Clements et al. Reference Clements, Thompson, Cox, Johansen, Williams, Hogue, Lowder and Calle2013).
Thus understanding the migration of 10 $\,\unicode{x03BC}$
m dust clouds under Martian conditions is of practical importance. We then model the evolution of dust clouds in two scenarios: atmospheric settling, and migration within the electric field of ESPs.
$\,\unicode{x03BC}$
m dust clouds under Martian conditions is of practical importance. We then model the evolution of dust clouds in two scenarios: atmospheric settling, and migration within the electric field of ESPs.
2.1. Model framework
Consider a spherical cluster with initial radius $R_0$
, containing
$R_0$
, containing $N$
monodispersed spherical particles of radius
$N$
monodispersed spherical particles of radius $a = 5.12\,\unicode{x03BC}\!$
m, corresponding to the size of the settled dust. The governing equations are written as
$a = 5.12\,\unicode{x03BC}\!$
m, corresponding to the size of the settled dust. The governing equations are written as $\begin{align}\frac {{\rm d}\boldsymbol{r}_i}{{\rm d}t} = \boldsymbol{v}_i = \boldsymbol{u}_{f,i} + \boldsymbol{v}_{s,i},\end{align}$ $\boldsymbol{v}_{s,i} = \frac {1}{6\unicode{x03C0} \mu a C_c} ( m_p g \boldsymbol{e}_z + q_i E \boldsymbol{e}_z + \boldsymbol{F}_{c,i}),$
where the time evolutions of the position $\boldsymbol{r}_i \in \mathbb{R}^3$
and velocity
$\boldsymbol{r}_i \in \mathbb{R}^3$
and velocity $\boldsymbol{v}_i \in \mathbb{R}^3$
of particle
$\boldsymbol{v}_i \in \mathbb{R}^3$
of particle $i$
(
$i$
( $i = 1, 2, \ldots , N$
) are computed. Here,
$i = 1, 2, \ldots , N$
) are computed. Here, $\boldsymbol{u}_{f,i}$
represents the fluid velocity at
$\boldsymbol{u}_{f,i}$
represents the fluid velocity at $\boldsymbol{r}_i$
, discussed further in the next subsection. Equation (2.1b
) indicates that this model is velocity-based (a ‘kinematic’ simulation), where the forces acting on each particle are directly related to the particle slip velocity
$\boldsymbol{r}_i$
, discussed further in the next subsection. Equation (2.1b
) indicates that this model is velocity-based (a ‘kinematic’ simulation), where the forces acting on each particle are directly related to the particle slip velocity $\boldsymbol{v}_{s,i}$
through the friction coefficient
$\boldsymbol{v}_{s,i}$
through the friction coefficient $6\unicode{x03C0} \mu a C_c$
. In this equation,
$6\unicode{x03C0} \mu a C_c$
. In this equation, $\mu$
represents the fluid viscosity (Pa s), which is taken as that of
$\mu$
represents the fluid viscosity (Pa s), which is taken as that of ${\textrm {CO}}_2$
at the typical Martian temperature (refer to table 3), and
${\textrm {CO}}_2$
at the typical Martian temperature (refer to table 3), and $C_c$
is the Cunningham correction factor, specified in (2.5).
$C_c$
is the Cunningham correction factor, specified in (2.5).
The forces driving particle motion include the gravitational force $m_p g \boldsymbol{e}_z$
(where
$m_p g \boldsymbol{e}_z$
(where $m_p$
is the particle mass in kg,
$m_p$
is the particle mass in kg, $g = 3.72\,\mathrm{m\, s}^{-2}$
is the Martian gravitational acceleration, and
$g = 3.72\,\mathrm{m\, s}^{-2}$
is the Martian gravitational acceleration, and $\boldsymbol{e}_z$
is the unit vector pointing downwards), the electric field force
$\boldsymbol{e}_z$
is the unit vector pointing downwards), the electric field force $q_i E \boldsymbol{e}_z$
(where
$q_i E \boldsymbol{e}_z$
(where $q_i$
is the charge of particle
$q_i$
is the charge of particle $i$
in C, and
$i$
in C, and $E$
is the electric field intensity in V m−1), and the Coulombic repulsion
$E$
is the electric field intensity in V m−1), and the Coulombic repulsion $\boldsymbol{F}_{c,i}$
exerted on particle
$\boldsymbol{F}_{c,i}$
exerted on particle $i$
by other particles, given by
$i$
by other particles, given by
 \begin{equation} \boldsymbol{F}_{c,i} = \frac {1}{4\unicode{x03C0} \epsilon _0} \sum _{j eq i} \frac {q_i q_j}{r_{ij}^3} \left ( \boldsymbol{r}_i - \boldsymbol{r}_{\!j} \right ), \end{equation}
where $\epsilon _0 = 8.85 \times 10^{-12}\ \mathrm{C}^2\ \mathrm{N}^{-1} \ \mathrm{m}^{-2}$
is the vacuum permittivity, and
$\epsilon _0 = 8.85 \times 10^{-12}\ \mathrm{C}^2\ \mathrm{N}^{-1} \ \mathrm{m}^{-2}$
is the vacuum permittivity, and $r_{ij} = |\boldsymbol{r}_i - \boldsymbol{r}_{\!j}|$
is the distance between particles
$r_{ij} = |\boldsymbol{r}_i - \boldsymbol{r}_{\!j}|$
is the distance between particles $i$
and
$i$
and $j$
. Given that the system is dilute (as specified later), inter-particle collisions and higher-order multipole interactions are neglected.
$j$
. Given that the system is dilute (as specified later), inter-particle collisions and higher-order multipole interactions are neglected.
The velocity-based (2.1b ) neglects particle inertia and is valid only for sufficiently small Stokes numbers (Marshall & Li Reference Marshall and Li2014):
 \begin{equation} St = \frac {2 ho _p a^2 v_{\textit{tm}}}{9 \mu R_0 C_c}, \end{equation}
where $ho _p = 2500\,\mathrm{kg\, m}^{-3}$
is the particle density, as the composition of Martian dust is predominantly silicate and magnetite (Perko, Nelson & Green Reference Perko, Nelson and Green2002). The characteristic velocity
$ho _p = 2500\,\mathrm{kg\, m}^{-3}$
is the particle density, as the composition of Martian dust is predominantly silicate and magnetite (Perko, Nelson & Green Reference Perko, Nelson and Green2002). The characteristic velocity $v_{\textit{tm}}$
in (2.3) is the terminal velocity of a single particle in the gravitational and/or electric field:
$v_{\textit{tm}}$
in (2.3) is the terminal velocity of a single particle in the gravitational and/or electric field:
 \begin{equation} v_{\textit{tm}} = \frac {m_p g + q_i E}{6\unicode{x03C0} \mu a C_c}, \end{equation}
where $C_c$
corrects for the reduced drag in the thin atmosphere. The correction factor
$C_c$
corrects for the reduced drag in the thin atmosphere. The correction factor $C_c$
depends on the Knudsen number
$C_c$
depends on the Knudsen number $Kn=\lambda/(2a)$
as
$Kn=\lambda/(2a)$
as
 \begin{equation} C_{c}=\left(1+3.26 Kn\right)^{-1}, \end{equation}
and $\lambda = {2\mu }/({p \sqrt {8m_{{\textrm {CO}}_2}/(\unicode{x03C0} RT)}})$
is the mean free path of gas molecules (Marshall & Li Reference Marshall and Li2014). Here,
$\lambda = {2\mu }/({p \sqrt {8m_{{\textrm {CO}}_2}/(\unicode{x03C0} RT)}})$
is the mean free path of gas molecules (Marshall & Li Reference Marshall and Li2014). Here, $m_{{m CO}_2} = 0.044\,\mathrm{kg\, mol^{-1}}$
and
$m_{{m CO}_2} = 0.044\,\mathrm{kg\, mol^{-1}}$
and $R = 8.314\ \mathrm{J\ mol^{-1} \ K^{-1}}$
. Under typical Martian conditions,
$R = 8.314\ \mathrm{J\ mol^{-1} \ K^{-1}}$
. Under typical Martian conditions, $Kn \approx 0.56$
,
$Kn \approx 0.56$
, $C_c \approx 0.35$
and
$C_c \approx 0.35$
and $v_{\textit{tm}} \approx 0.01\,\mathrm{m\, s}^{-1}$
(refer to table 3). Consequently, the Stokes number for our cases is of the order of
$v_{\textit{tm}} \approx 0.01\,\mathrm{m\, s}^{-1}$
(refer to table 3). Consequently, the Stokes number for our cases is of the order of $10^{-3}$
(see table 3), validating the model framework under Martian conditions.
$10^{-3}$
(see table 3), validating the model framework under Martian conditions.
2.2. Hydrodynamic interactions
The hydrodynamic interactions between particles arise because each sedimenting particle disturbs the surrounding flow field, thereby influencing the motion of other particles. Consequently, we need to incorporate the fluid velocity $\boldsymbol{u}_{f,i}$
in (2.1a
), even with a stationary far field (otherwise, the particles would fall independently at their respective terminal velocities). In the continuum-flow regime, the fluid velocity
$\boldsymbol{u}_{f,i}$
in (2.1a
), even with a stationary far field (otherwise, the particles would fall independently at their respective terminal velocities). In the continuum-flow regime, the fluid velocity $\boldsymbol{v}_{f,i}$
at
$\boldsymbol{v}_{f,i}$
at $\boldsymbol{r}_i$
is typically approximated as the sum of velocity disturbances caused by all other particles. These disturbances are modelled using linearised Stokes or Oseen equations (Batchelor Reference Batchelor2000). However, in the transition-flow regime with
$\boldsymbol{r}_i$
is typically approximated as the sum of velocity disturbances caused by all other particles. These disturbances are modelled using linearised Stokes or Oseen equations (Batchelor Reference Batchelor2000). However, in the transition-flow regime with $Kn \sim \textit {O}(1)$
, the Navier–Stokes-based solutions become inaccurate due to the failure of the no-slip boundary condition, requiring the flow field to be solved using the kinetic Boltzmann equation, which is valid in rarefied conditions.
$Kn \sim \textit {O}(1)$
, the Navier–Stokes-based solutions become inaccurate due to the failure of the no-slip boundary condition, requiring the flow field to be solved using the kinetic Boltzmann equation, which is valid in rarefied conditions.
Given the significant challenges of full dynamic simulations and the dilute nature of the particle cloud, we approximate the hydrodynamic interactions, namely the velocity disturbances, based on the rarefied gas flow past spherical particles:
 \begin{equation} \boldsymbol{u}_{f,i} = \sum _{j eq i} \boldsymbol{V}_{\textit{Tr}} \left ( \boldsymbol{v}_{s,j}, \boldsymbol{r}_{ij}; a \right ), \end{equation}
where $\boldsymbol{V}_{\textit{Tr}}$
is the disturbed velocity field of a single particle, and
$\boldsymbol{V}_{\textit{Tr}}$
is the disturbed velocity field of a single particle, and $\boldsymbol{r}_{ij} = \boldsymbol{r}_i - \boldsymbol{r}_{\!j}$
. As shown in figure 1(c), the velocity disturbance at
$\boldsymbol{r}_{ij} = \boldsymbol{r}_i - \boldsymbol{r}_{\!j}$
. As shown in figure 1(c), the velocity disturbance at $\boldsymbol{r}_i$
caused by
$\boldsymbol{r}_i$
caused by $\boldsymbol{v}_{s,j}$
from particle
$\boldsymbol{v}_{s,j}$
from particle $j$
is expressed as
$j$
is expressed as $u_{r,i} \boldsymbol{e}_r + u_{\theta ,i} \boldsymbol{e}_\theta$
, where
$u_{r,i} \boldsymbol{e}_r + u_{\theta ,i} \boldsymbol{e}_\theta$
, where ${\boldsymbol{e}}_r = \boldsymbol{r}_{ij} / r_{ij}$
and
${\boldsymbol{e}}_r = \boldsymbol{r}_{ij} / r_{ij}$
and $\boldsymbol{e}_\theta \perp \boldsymbol{e}_r$
. The scalar functions
$\boldsymbol{e}_\theta \perp \boldsymbol{e}_r$
. The scalar functions $u_{r,i}$
and
$u_{r,i}$
and $u_{\theta ,i}$
remain to be specified.
$u_{\theta ,i}$
remain to be specified.
In this work, we apply the steady-state velocity field given by Takata et al. (Reference Takata, Sone and Aoki1993), derived from the linearised Boltzmann equation. Before presenting the detailed expressions, we need to justify the assumptions made therein as applicable to our case mimicking Martian dust sedimentation. First, the assumption of uniform gas molecule size is reasonable, as the Martian atmosphere is predominantly composed of ${\textrm {CO}}_2$
. Second, the Mach number of the flow,
${\textrm {CO}}_2$
. Second, the Mach number of the flow,
 \begin{equation} Ma = \frac {v_{\textit{tm}}}{\sqrt {\dfrac {1.3RT}{m_{{m CO}_2}}}}, \end{equation}
must be sufficiently small to validate the linearisation of the Boltzmann equation. This has been verified in figure 1(a), which shows that $Ma \sim \textit {O}(10^{-5}) \ll 1$
across a broad range of typical Martian temperatures
$Ma \sim \textit {O}(10^{-5}) \ll 1$
across a broad range of typical Martian temperatures $T$
and pressures
$T$
and pressures $p$
. Thus we conclude that the flow field derived in (Takata et al. Reference Takata, Sone and Aoki1993) is a suitable approximation for
$p$
. Thus we conclude that the flow field derived in (Takata et al. Reference Takata, Sone and Aoki1993) is a suitable approximation for $\boldsymbol{V}_{\textit{Tr}}$
in our case.
$\boldsymbol{V}_{\textit{Tr}}$
in our case.
Flow field characteristics. (a) The Mach numbers of the flow past a 10 $\,\unicode{x03BC}$
m settling particle. (b) Terminal velocities under different values of Martian temperatures and pressures (
$\,\unicode{x03BC}$
m settling particle. (b) Terminal velocities under different values of Martian temperatures and pressures ( $E = 0$
,
$E = 0$
, $N_q = 0$
). (c) Schematic of hydrodynamic interactions between falling particles. (d) Linear fitting of
$N_q = 0$
). (c) Schematic of hydrodynamic interactions between falling particles. (d) Linear fitting of $1/(1{-}b)$
and
$1/(1{-}b)$
and $1/(1{-}c)$
versus
$1/(1{-}c)$
versus $r$
for
$r$
for $r / a \gt 25$
based on the data in table 1. (e,f) Profiles of disturbed velocities: (ei)
$r / a \gt 25$
based on the data in table 1. (e,f) Profiles of disturbed velocities: (ei) $\hat {u}_r(\hat {r})$
, (eii)
$\hat {u}_r(\hat {r})$
, (eii) $\hat {u}_r(\theta )$
, ( f
i)
$\hat {u}_r(\theta )$
, ( f
i) $\hat {u}_\theta (\hat {r})$
, ( fii)
$\hat {u}_\theta (\hat {r})$
, ( fii) $\hat {u}_\theta (\theta )$
. Results are shown for Martian atmospheric settlement (cases
$\hat {u}_\theta (\theta )$
. Results are shown for Martian atmospheric settlement (cases $N_q = 0$
in Groups I and II). Plots (ei) and ( fi) also include the Oseen solution for the case
$N_q = 0$
in Groups I and II). Plots (ei) and ( fi) also include the Oseen solution for the case $N_q = 0$
in Group VI (with
$N_q = 0$
in Group VI (with $Re_p = 5.50 \times 10^{-5}$
). (g–j) Velocity vectors of dust particles at
$Re_p = 5.50 \times 10^{-5}$
). (g–j) Velocity vectors of dust particles at $t = 0$
in the cloud reference frame for Group II: (g)
$t = 0$
in the cloud reference frame for Group II: (g) $N_q = 0$
, (h)
$N_q = 0$
, (h) $N_q = 1000$
, (i)
$N_q = 1000$
, (i) $N_q = 10^4$
, ( j)
$N_q = 10^4$
, ( j) $N_q = 10^5$
. For clarity, only particles with
$N_q = 10^5$
. For clarity, only particles with $\hat {y} \in [-0.3, 0.3]$
are drawn for each case. Velocity vectors represent the projection of three-dimensional velocities onto the
$\hat {y} \in [-0.3, 0.3]$
are drawn for each case. Velocity vectors represent the projection of three-dimensional velocities onto the $\hat {x}$
–
$\hat {x}$
– $\hat {z}$
plane. In (g), particles that will eventually leak from the cloud are indicated as: triangular symbols for leakage time
$\hat {z}$
plane. In (g), particles that will eventually leak from the cloud are indicated as: triangular symbols for leakage time ${\lt } 100$
, circular symbols for
${\lt } 100$
, circular symbols for $100{-}200$
, and hexagonal symbols for
$100{-}200$
, and hexagonal symbols for ${\gt } 200$
.
${\gt } 200$
.

In the geometric configuration of figure 1(c), the radial and tangential velocity components at $\boldsymbol{r}_i$
are determined as follows (subscripts
$\boldsymbol{r}_i$
are determined as follows (subscripts $i$
and
$i$
and $j$
denoting particles are omitted for clarity):
$j$
denoting particles are omitted for clarity):
 \begin{equation} u_r = v_s \, (1 - b) \cos {\theta }, \quad u_\theta = -v_s \, (1 - c) \sin {\theta }, \end{equation}
where $v_s = |\boldsymbol{v}_s|$
is the magnitude of the slip velocity, and
$v_s = |\boldsymbol{v}_s|$
is the magnitude of the slip velocity, and $b = b(r)$
and
$b = b(r)$
and $c = c(r)$
are functions of the radial distance
$c = c(r)$
are functions of the radial distance $r = r_{ij}$
. The expressions for
$r = r_{ij}$
. The expressions for $b(r)$
and
$b(r)$
and $c(r)$
are specified in table 1, which adapts tables I and II of (Takata et al. Reference Takata, Sone and Aoki1993) for
$c(r)$
are specified in table 1, which adapts tables I and II of (Takata et al. Reference Takata, Sone and Aoki1993) for $k_\infty = \sqrt {\unicode{x03C0} }\,Kn = 1$
. In our simulations,
$k_\infty = \sqrt {\unicode{x03C0} }\,Kn = 1$
. In our simulations, $b(r)$
and
$b(r)$
and $c(r)$
are interpolated using piecewise linear functions for
$c(r)$
are interpolated using piecewise linear functions for $r/a \leqslant 25$
, and fitted as
$r/a \leqslant 25$
, and fitted as
 \begin{align} 1 - b = \frac {1}{1.5433\, {r}/{a}}, \quad 1 - c = \frac {1}{2.8775 \, {r}/{a}}, \end{align}
for $r/a \gt 25$
(see figure 1
d). Further discussion of the properties of the flow field will be presented in § 3.1.
$r/a \gt 25$
(see figure 1
d). Further discussion of the properties of the flow field will be presented in § 3.1.
Values of $b$
and
$b$
and $c$
as functions of
$c$
as functions of $r/a$
in (2.8). The data are adapted from tables I and II of Takata et al. (Reference Takata, Sone and Aoki1993) for
$r/a$
in (2.8). The data are adapted from tables I and II of Takata et al. (Reference Takata, Sone and Aoki1993) for $k_\infty =\sqrt {\unicode{x03C0}}\, Kn=1$
, which correspond to
$k_\infty =\sqrt {\unicode{x03C0}}\, Kn=1$
, which correspond to $Kn = 0.5642$
and
$Kn = 0.5642$
and $a = 5.12\, \unicode{x03BC} \mathrm{m}$
under Martian conditions.
$a = 5.12\, \unicode{x03BC} \mathrm{m}$
under Martian conditions.

For comparison with the continuum-flow field, at both the single-particle and whole-cluster levels, the Oseen solution of the linearised Navier–Stokes equation (Batchelor Reference Batchelor2000) is provided in Appendix A for the reader’s reference.
2.3. Particle charging
We examine the evolution of charged dust clouds under Martian atmospheric conditions, and investigate the influence of particle charge $q_i$
in the model described by (2.1). Experiments suggest that under Martian conditions, as the atmospheric voltage approaches the breakdown limit, the net charge of particles can reach
$q_i$
in the model described by (2.1). Experiments suggest that under Martian conditions, as the atmospheric voltage approaches the breakdown limit, the net charge of particles can reach $10^4e$
to
$10^4e$
to $10^5 e$
(where
$10^5 e$
(where $e = 1.6 \times 10^{-19}\,\mathrm{C}$
is the elementary charge) (Merrison et al. Reference Merrison, Jensen, Kinch, Mugford and Nørnberg2004). On the other hand, Martian ESPs rely primarily on field and diffusion charging mechanisms (Friedlander Reference Friedlander2000; Calle et al. Reference Calle2011). Well-established particle charging theories estimate that under an external electric field
$e = 1.6 \times 10^{-19}\,\mathrm{C}$
is the elementary charge) (Merrison et al. Reference Merrison, Jensen, Kinch, Mugford and Nørnberg2004). On the other hand, Martian ESPs rely primarily on field and diffusion charging mechanisms (Friedlander Reference Friedlander2000; Calle et al. Reference Calle2011). Well-established particle charging theories estimate that under an external electric field $E = 0.23\,\mathrm{kV\, cm^{-1}}$
(a promising value for Martian ESP designs), the saturated field charge and diffusion charge after hours of exposure are both of the order of
$E = 0.23\,\mathrm{kV\, cm^{-1}}$
(a promising value for Martian ESP designs), the saturated field charge and diffusion charge after hours of exposure are both of the order of $10^3 e$
for a 10
$10^3 e$
for a 10 $\,\unicode{x03BC}$
m particle (Calle et al. Reference Calle2011). The diffusion charge increases at a rate of
$\,\unicode{x03BC}$
m particle (Calle et al. Reference Calle2011). The diffusion charge increases at a rate of $\textit {O}\!(\log {t})$
, resulting in extremely slow growth beyond
$\textit {O}\!(\log {t})$
, resulting in extremely slow growth beyond $10^3 e$
. For these reasons, we assume a constant and uniform particle charge
$10^3 e$
. For these reasons, we assume a constant and uniform particle charge $q_i = q$
in each simulation. The influence of particle charging on cloud dynamics is explored by varying
$q_i = q$
in each simulation. The influence of particle charging on cloud dynamics is explored by varying $q$
from
$q$
from $0$
to
$0$
to $10^5 e$
across different cases (see table 2).
$10^5 e$
across different cases (see table 2).
Simulated conditions.

2.4. Simulated conditions and parameters
Our simulations involve spherical dust clouds containing $N$
(charged) particles sedimenting in open space without boundary conditions. The initial positions
$N$
(charged) particles sedimenting in open space without boundary conditions. The initial positions $\boldsymbol{r}_i(0)$
are randomly and uniformly sampled from within the sphere. Table 2 summarises the conditions for the simulation cases, characterised by the parameters
$\boldsymbol{r}_i(0)$
are randomly and uniformly sampled from within the sphere. Table 2 summarises the conditions for the simulation cases, characterised by the parameters $N, R_0, E, N_q$
, where
$N, R_0, E, N_q$
, where $N_q = q/e$
is the number of elementary charges. In most cases, we set
$N_q = q/e$
is the number of elementary charges. In most cases, we set $N = 256$
, with
$N = 256$
, with $R_0$
determined from the physically relevant dust mass fraction
$R_0$
determined from the physically relevant dust mass fraction $\alpha = N ho _p (a/R_0)^3$
(units
$\alpha = N ho _p (a/R_0)^3$
(units $\mathrm{kg\, m^{-3}}$
). It has been reported that in the absence of dust storms, the dust concentration in the Martian atmosphere ranges from 5 to 24 particles per
$\mathrm{kg\, m^{-3}}$
). It has been reported that in the absence of dust storms, the dust concentration in the Martian atmosphere ranges from 5 to 24 particles per $\mathrm{cm}^3$
(Calle Reference Calle2017), corresponding to mass fraction
$\mathrm{cm}^3$
(Calle Reference Calle2017), corresponding to mass fraction $10^{-6}{-}10^{-5}\,\mathrm{kg\, m^{-3}}$
for the settled dust fraction. Accordingly, we set
$10^{-6}{-}10^{-5}\,\mathrm{kg\, m^{-3}}$
for the settled dust fraction. Accordingly, we set $R_0 = 0.016\,\mathrm{m}$
, yielding dust concentration 14 particles per
$R_0 = 0.016\,\mathrm{m}$
, yielding dust concentration 14 particles per $\mathrm{cm}^3$
, and mass fraction
$\mathrm{cm}^3$
, and mass fraction $\alpha = 2.1 \times 10^{-5}\,\mathrm{kg\, m^{-3}}$
. The cases with varying
$\alpha = 2.1 \times 10^{-5}\,\mathrm{kg\, m^{-3}}$
. The cases with varying $N_q$
form Group I (atmospheric sedimentation without dust storms).
$N_q$
form Group I (atmospheric sedimentation without dust storms).
Within dust devils and/or dust storms, the particle concentration can exceed 100 particles per $\mathrm{cm}^3$
(corresponding to mass fraction
$\mathrm{cm}^3$
(corresponding to mass fraction $\alpha \gt 10^{-5}\,\mathrm{kg\, m^{-3}}$
) (Barth, Farrell & Rafkin Reference Barth, Farrell and Rafkin2016; Calle Reference Calle2017; Sheel, Uttam & Mishra Reference Sheel, Uttam and Mishra2021). To account for this, we define Group II (larger particle concentrations) with
$\alpha \gt 10^{-5}\,\mathrm{kg\, m^{-3}}$
) (Barth, Farrell & Rafkin Reference Barth, Farrell and Rafkin2016; Calle Reference Calle2017; Sheel, Uttam & Mishra Reference Sheel, Uttam and Mishra2021). To account for this, we define Group II (larger particle concentrations) with $N = 256$
and
$N = 256$
and $R_0 = 0.008\,\mathrm{m}$
, corresponding to 119 particles per
$R_0 = 0.008\,\mathrm{m}$
, corresponding to 119 particles per $\mathrm{cm}^3$
, and mass fraction
$\mathrm{cm}^3$
, and mass fraction $\alpha = 1.68 \times 10^{-4}\,\mathrm{kg\, m^{-3}}$
. This same set of parameters is also used for Group III, which considers particle migration in an electric field
$\alpha = 1.68 \times 10^{-4}\,\mathrm{kg\, m^{-3}}$
. This same set of parameters is also used for Group III, which considers particle migration in an electric field $E = 0.23\,\mathrm{kV\, cm^{-1}}$
, representative of Martian ESPs. Gravity is neglected (
$E = 0.23\,\mathrm{kV\, cm^{-1}}$
, representative of Martian ESPs. Gravity is neglected ( $g = 0$
) in this group.
$g = 0$
) in this group.
We stress again that Groups II and III are concerned only with the dynamics of small particle clusters within dust devils or storms. Moreover, even assuming the presence of dust devils/storms, the dimensionless mean particle spacing in the cloud is $\bar {r}/a \sim ( R_0 / a ) N^{-1/3} = 246$
. This large value supports the validity of (2.6), which approximates the hydrodynamic interactions by superimposing the disturbance fields of individual particles.
$\bar {r}/a \sim ( R_0 / a ) N^{-1/3} = 246$
. This large value supports the validity of (2.6), which approximates the hydrodynamic interactions by superimposing the disturbance fields of individual particles.
Parameters of dust clouds under Martian and Earth conditions.

* The Martian conditions are taken for $T = 273\,\text{K}$
and
$T = 273\,\text{K}$
and $p = 675\,\text{Pa}$
.
$p = 675\,\text{Pa}$
.
** The parameters of Earth’s atmosphere are taken for $T = 298\,\text{K}$
and
$T = 298\,\text{K}$
and $p = 1\,01\,325\,\text{Pa}$
.
$p = 1\,01\,325\,\text{Pa}$
.
Additional cases are explored to support the analysis. Group IV investigates the effect of cloud size, maintaining a constant dust mass fraction $\alpha$
as in Group II. This allows us to assess whether the influences of surrounding particles on larger dust clouds significantly change the cloud’s evolution dynamics. Group V examines the influence of the mass fraction
$\alpha$
as in Group II. This allows us to assess whether the influences of surrounding particles on larger dust clouds significantly change the cloud’s evolution dynamics. Group V examines the influence of the mass fraction $\alpha$
(or equivalently,
$\alpha$
(or equivalently, $N$
), while Group VI compares Oseen flow interactions (see Appendix A) with Martian atmospheric parameters. Finally, Group VII simulates particle cloud sedimentation in Earth’s atmosphere (continuum regime) for comparison.
$N$
), while Group VI compares Oseen flow interactions (see Appendix A) with Martian atmospheric parameters. Finally, Group VII simulates particle cloud sedimentation in Earth’s atmosphere (continuum regime) for comparison.
To handle the various cases, we non-dimensionalise the governing equations using
 \begin{align} \hat {\boldsymbol{r}} = \boldsymbol{r} / R_0, \quad \hat {t} = t / ( R_0 / v_{\textit{tm}} ), \quad \hat {\boldsymbol{v}} = \boldsymbol{v} / v_{\textit{tm}}, \end{align}
yielding $\begin{align}\frac {{\rm d}\hat {\boldsymbol{r}}_i}{{\rm d}\hat {t}} &= \hat {\boldsymbol{v}}_i = \hat {\boldsymbol{u}}_{f,i} + \hat {\boldsymbol{v}}_{s,i},\end{align}$ $\begin{align}\hat {\boldsymbol{u}}_{f,i} &= \sum _{j \unicode{x2260} i} \hat {\boldsymbol{V}}_{\textit{Tr}} ( \hat {\boldsymbol{v}}_{s,j}, \hat {r}_{ij}; a),\end{align}$
 $\begin{align}\boldsymbol{v}_{s,i} &= \boldsymbol{e}_z + \kappa _q \boldsymbol{\Phi }_i.\end{align}
Here, $\boldsymbol{\Phi }_i = ({1}/{N}) \sum _{j eq i} ( \hat {\boldsymbol{r}}_{ij} / \hat {r}_{ij}^3 )$
, and
$\boldsymbol{\Phi }_i = ({1}/{N}) \sum _{j eq i} ( \hat {\boldsymbol{r}}_{ij} / \hat {r}_{ij}^3 )$
, and
 \begin{equation} \kappa _q = \frac {q^2 N}{4 \unicode{x03C0} \epsilon _0 R_0^2 (qE + m_pg)} \end{equation}
is the dimensionless charge parameter (Chen et al. Reference Chen, Liu and Li2018). Throughout the text, all hatted variables represent non-dimensionalised quantities as defined above. Table 3 lists the key parameters used in the simulations. The physical properties under Martian conditions are based on values at $273\,\mathrm{K}$
and
$273\,\mathrm{K}$
and $675\,\mathrm{Pa}$
. Sensitivity analyses in figures 1(a) and 1(b) show that variations in atmospheric pressure and temperature have only slight effects on both the Mach number of the flow and the terminal velocity of falling particles. Thus the cluster evolution behaviours obtained at
$675\,\mathrm{Pa}$
. Sensitivity analyses in figures 1(a) and 1(b) show that variations in atmospheric pressure and temperature have only slight effects on both the Mach number of the flow and the terminal velocity of falling particles. Thus the cluster evolution behaviours obtained at $273\,\mathrm{K}$
and
$273\,\mathrm{K}$
and $675\,\mathrm{Pa}$
are considered representative of typical Martian conditions.
$675\,\mathrm{Pa}$
are considered representative of typical Martian conditions.
In contrast, dust clouds under Earth’s conditions fall within the continuum regime ( $Kn \ll 1$
) and require Oseen hydrodynamic interactions, as discussed further in Appendix B.
$Kn \ll 1$
) and require Oseen hydrodynamic interactions, as discussed further in Appendix B.
The governing (2.11), reformulated concisely as $\boldsymbol{y}'(t) = f(t, \boldsymbol{y}(t))$
, is numerically solved using the two-step Adams–Bashforth method
$\boldsymbol{y}'(t) = f(t, \boldsymbol{y}(t))$
, is numerically solved using the two-step Adams–Bashforth method $\boldsymbol{y}_{n+1} = \boldsymbol{y}_n + 1.5 h\, f(t_n, \boldsymbol{y}_n) - 0.5 h\, f(t_{n-1}, \boldsymbol{y}_{n-1})$
, where
$\boldsymbol{y}_{n+1} = \boldsymbol{y}_n + 1.5 h\, f(t_n, \boldsymbol{y}_n) - 0.5 h\, f(t_{n-1}, \boldsymbol{y}_{n-1})$
, where $\boldsymbol{y}_n := \boldsymbol{y}(t_n)$
, and
$\boldsymbol{y}_n := \boldsymbol{y}(t_n)$
, and $h \leqslant 0.1$
is the (dimensionless) time step. The end time is
$h \leqslant 0.1$
is the (dimensionless) time step. The end time is $600$
for most cases, corresponding to
$600$
for most cases, corresponding to $7$
–
$7$
– $14$
minutes of physical settling time. For certain cases, three runs with different realisations of the initial particle positions were performed, all yielding similar results.
$14$
minutes of physical settling time. For certain cases, three runs with different realisations of the initial particle positions were performed, all yielding similar results.
3. Results
3.1. Flow field properties
Using (2.8) and the geometry shown in figure 1(c), we illustrate the disturbed flow velocities at $\boldsymbol{r}_i$
induced by the slip velocity of particle
$\boldsymbol{r}_i$
induced by the slip velocity of particle $j$
in figures 1(e) and 1( f) as functions of
$j$
in figures 1(e) and 1( f) as functions of $r$
and
$r$
and $\theta$
. For comparison, the Oseen solutions are also plotted for the hypothetical case
$\theta$
. For comparison, the Oseen solutions are also plotted for the hypothetical case $N_q = 0$
from Group VI, with the same
$N_q = 0$
from Group VI, with the same $Re_p = 5.50 \times 10^{-5}$
. Three key observations can be made. First, as a direct consequence of (2.8), the flow field exhibits symmetry around
$Re_p = 5.50 \times 10^{-5}$
. Three key observations can be made. First, as a direct consequence of (2.8), the flow field exhibits symmetry around $\theta = \unicode{x03C0} /2$
, with
$\theta = \unicode{x03C0} /2$
, with $u_r \gt 0$
(pushing) for
$u_r \gt 0$
(pushing) for $\theta \lt \unicode{x03C0} /2$
, and
$\theta \lt \unicode{x03C0} /2$
, and $u_r \lt 0$
(pulling) for
$u_r \lt 0$
(pulling) for $\theta \gt \unicode{x03C0} /2$
. In contrast, the Oseen solution is non-symmetric, with
$\theta \gt \unicode{x03C0} /2$
. In contrast, the Oseen solution is non-symmetric, with $u_r \gt 0$
even at
$u_r \gt 0$
even at $\theta = \unicode{x03C0} /2$
(see figure 1
ei). Second, there is slip on the particle surface, as indicated by
$\theta = \unicode{x03C0} /2$
(see figure 1
ei). Second, there is slip on the particle surface, as indicated by $|\hat {u}_\theta (\hat {r} = 1, \theta = \unicode{x03C0} /2)| \lt 1$
(see figure 1
eii,fii). Third, the magnitude of the flow velocities is smaller than that of the continuum Oseen solution, highlighting the necessity of using the transition flow (2.8) to capture the weaker hydrodynamic interactions under Martian conditions.
$|\hat {u}_\theta (\hat {r} = 1, \theta = \unicode{x03C0} /2)| \lt 1$
(see figure 1
eii,fii). Third, the magnitude of the flow velocities is smaller than that of the continuum Oseen solution, highlighting the necessity of using the transition flow (2.8) to capture the weaker hydrodynamic interactions under Martian conditions.
With the superposition of all disturbed flow velocities, figure 1(g–j) show the dust velocities at $t = 0$
in the cloud reference frame (i.e. the velocity of each particle relative to the cloud’s centre of mass) for the cases of Group II. For the case
$t = 0$
in the cloud reference frame (i.e. the velocity of each particle relative to the cloud’s centre of mass) for the cases of Group II. For the case $N_q = 0$
(figure 1
g), a distinct inner circulation resembling a ‘toroidal vortex’ is observed. As the particle charge increases, the inner circulation shrinks (figure 1
h) and eventually disappears (figure 1
i,j). At high charge levels, as shown in figure 1( j), Coulomb repulsion dominates, and the particle velocities become almost entirely radial. We note that similar patterns have been reported previously for clouds settling in continuum flows (Chen et al. Reference Chen, Liu and Li2018).
$N_q = 0$
(figure 1
g), a distinct inner circulation resembling a ‘toroidal vortex’ is observed. As the particle charge increases, the inner circulation shrinks (figure 1
h) and eventually disappears (figure 1
i,j). At high charge levels, as shown in figure 1( j), Coulomb repulsion dominates, and the particle velocities become almost entirely radial. We note that similar patterns have been reported previously for clouds settling in continuum flows (Chen et al. Reference Chen, Liu and Li2018).
Evolution of the clouds. (a,c) Time evolution of the clouds with $N_q = 0$
in (a) Group I and (c) Group II. Both here and in the subsequent panels, the particles are plotted in the cloud reference frame, with the cloud’s centre of mass located at
$N_q = 0$
in (a) Group I and (c) Group II. Both here and in the subsequent panels, the particles are plotted in the cloud reference frame, with the cloud’s centre of mass located at $\hat {x} = \hat {y} = \hat {z} = 0$
. Note that the scales in the
$\hat {x} = \hat {y} = \hat {z} = 0$
. Note that the scales in the $\hat {z}$
-direction may differ from those in the
$\hat {z}$
-direction may differ from those in the $\hat {x}$
- and
$\hat {x}$
- and $\hat {y}$
-directions to display all particles that leak away from the clouds. Also exhibited are the flow fields computed at
$\hat {y}$
-directions to display all particles that leak away from the clouds. Also exhibited are the flow fields computed at $\hat {t} = 600$
in the vertical plane through the vertical axis of symmetry. (b,d–f) Dispersion of particles at
$\hat {t} = 600$
in the vertical plane through the vertical axis of symmetry. (b,d–f) Dispersion of particles at $\hat {t} = 600$
for the cases in (b) Group I, (d) Group II, (e) Group III and (f) Group VI. The cases with
$\hat {t} = 600$
for the cases in (b) Group I, (d) Group II, (e) Group III and (f) Group VI. The cases with $N_q = 1000{-}5000$
are scaled separately from those with
$N_q = 1000{-}5000$
are scaled separately from those with $N_q = 10^4{-}10^5$
. In all cluster morphology illustrations, the depicted particle sizes are significantly exaggerated for clarity.
$N_q = 10^4{-}10^5$
. In all cluster morphology illustrations, the depicted particle sizes are significantly exaggerated for clarity.

(a,b) Time evolution of the percentage $1-N^\ast$
of particles contained in the tails for the cases in (a) Group I and (b) Group II. A particle is considered to have leaked away from the cluster if its distance to the lowest particle of the cluster exceeds 2.3 times the half-height of the cluster. The half-height of a cluster is defined as the distance from the lowest particle of the cluster to the particle located at the median position in the
$1-N^\ast$
of particles contained in the tails for the cases in (a) Group I and (b) Group II. A particle is considered to have leaked away from the cluster if its distance to the lowest particle of the cluster exceeds 2.3 times the half-height of the cluster. The half-height of a cluster is defined as the distance from the lowest particle of the cluster to the particle located at the median position in the $z$
-direction. The dashed lines in the plots represent the approximation by (3.2) for the cases with
$z$
-direction. The dashed lines in the plots represent the approximation by (3.2) for the cases with $N_q = 0$
. The parameters used in (a) are
$N_q = 0$
. The parameters used in (a) are $A = 1$
,
$A = 1$
, $\mathcal{E} = 680$
,
$\mathcal{E} = 680$
, $\gamma = 1.16$
,
$\gamma = 1.16$
, $\beta = 0.028$
, while in (b) they are
$\beta = 0.028$
, while in (b) they are $A = 1.5$
,
$A = 1.5$
, $\mathcal{E} = 75$
,
$\mathcal{E} = 75$
, $\gamma = 0.77$
,
$\gamma = 0.77$
, $\beta = 0.042$
. (c,d) Time evolution of (c) the cloud radii and (d) the aspect ratios of the cases in Group II. The cloud radius is taken as the maximum radial coordinate
$\beta = 0.042$
. (c,d) Time evolution of (c) the cloud radii and (d) the aspect ratios of the cases in Group II. The cloud radius is taken as the maximum radial coordinate $\sqrt {\hat {x}^2+\hat {y}^2}$
(in the
$\sqrt {\hat {x}^2+\hat {y}^2}$
(in the $\hat {x}$
–
$\hat {x}$
– $\hat {y}$
plane) among all particles, and the aspect ratio of the cloud is the ratio of the cloud radius to its half-height.
$\hat {y}$
plane) among all particles, and the aspect ratio of the cloud is the ratio of the cloud radius to its half-height.

3.2. Evolution of chargeless clouds
Figures 2(a) and 2(c) show the evolution of the chargeless cases in Groups I and II during atmospheric sedimentation (see also supplementary movies 1 and 2). Notably, the clouds remain intact, while significant numbers of particles leak from the bulk clusters, forming tails much longer than the scale of the clouds. Quantitatively, the percentage of particles in the tails, $1 - N^\ast = 1 - N(\hat {t}) / N(0)$
, is plotted in figures 3(a) and 3(b) as a function of time
$1 - N^\ast = 1 - N(\hat {t}) / N(0)$
, is plotted in figures 3(a) and 3(b) as a function of time $\hat {t}$
. A clear ‘delay time’ before the onset of particle leakage can be observed, resembling the well-known ‘ignition delay’ in combustion. Particle leakage primarily occurs due to random departures from the ‘closed’ circulatory flow caused by hydrodynamic interactions (Pignatel et al. Reference Pignatel, Nicolas and Guazzelli2011). Figure 1(g) further supports this observation, showing that all particles that eventually leak were initially located at the edge of the inner circulation. Based on this physical picture, the delay can be interpreted as a barrier that particles must overcome before leaking from the cloud. Once a particle falls behind, it cannot catch up with the faster bulk cluster, forming the ‘tail’.
$\hat {t}$
. A clear ‘delay time’ before the onset of particle leakage can be observed, resembling the well-known ‘ignition delay’ in combustion. Particle leakage primarily occurs due to random departures from the ‘closed’ circulatory flow caused by hydrodynamic interactions (Pignatel et al. Reference Pignatel, Nicolas and Guazzelli2011). Figure 1(g) further supports this observation, showing that all particles that eventually leak were initially located at the edge of the inner circulation. Based on this physical picture, the delay can be interpreted as a barrier that particles must overcome before leaking from the cloud. Once a particle falls behind, it cannot catch up with the faster bulk cluster, forming the ‘tail’.
In Group II (larger particle concentrations), the denser cloud results in more particle leakage, with $1 - N^\ast \sim 0.22$
at
$1 - N^\ast \sim 0.22$
at $\hat {t} = 600$
, compared to Group I (without sandstorm), which yields
$\hat {t} = 600$
, compared to Group I (without sandstorm), which yields $1 - N^\ast \sim 0.15$
at
$1 - N^\ast \sim 0.15$
at $\hat {t} = 600$
. Particle leakage is also commonly observed in cloud evolution under continuum-flow conditions, but the correlations presented in previous studies (e.g.
$\hat {t} = 600$
. Particle leakage is also commonly observed in cloud evolution under continuum-flow conditions, but the correlations presented in previous studies (e.g. $N(0)^{2/3}(1 - N^\ast )$
as a function of
$N(0)^{2/3}(1 - N^\ast )$
as a function of $\hat {t}$
; Metzger et al. Reference Metzger, Nicolas and Guazzelli2007; Pignatel et al. Reference Pignatel, Nicolas and Guazzelli2011) do not apply to our results. Here, we propose a ‘global’ expression for the particle leakage rate by drawing an analogy to chemical reaction rates:
$\hat {t}$
; Metzger et al. Reference Metzger, Nicolas and Guazzelli2007; Pignatel et al. Reference Pignatel, Nicolas and Guazzelli2011) do not apply to our results. Here, we propose a ‘global’ expression for the particle leakage rate by drawing an analogy to chemical reaction rates:
 \begin{equation} \frac {{\rm d}(1 - N^\ast )}{{\rm d}\hat {t}} = \beta A \exp \left (-\frac {\mathcal{E}}{{\hat {t}}^\gamma }\right ) \times \left (N^\ast \right )^{1 + {1}/{\beta }}, \quad \text{with } N^\ast (0) = 1, \end{equation}
which integrates to give
 \begin{equation} 1 - N^\ast = 1 - \left [ 1 + A \int _{0}^{\hat {t}} \exp \left (-\frac {\mathcal{E}}{s^\gamma }\right ) {\rm d}s \right ]^{-\beta }. \end{equation}
Here, $\gamma$
is the exponent, while
$\gamma$
is the exponent, while $\mathcal{E}$
,
$\mathcal{E}$
, $A$
and
$A$
and $\beta$
mimic the activation energy, pre-exponential factor, and order of ‘reaction’, respectively. As shown by the dotted lines in figures 3(a) and 3(b), (3.2) reproduces the observed delay and is generally consistent with the simulation results.
$\beta$
mimic the activation energy, pre-exponential factor, and order of ‘reaction’, respectively. As shown by the dotted lines in figures 3(a) and 3(b), (3.2) reproduces the observed delay and is generally consistent with the simulation results.
Regarding the remaining bulk cluster, it is expected to stay intact for a long time without breaking apart. For example, the lateral radius satisfies $\hat {R} \lt 1.2$
at
$\hat {R} \lt 1.2$
at $\hat {t} = 600$
in the chargeless case of Group II (see figure 3
c). Two pieces of evidence further support this. First, figure 3(d) reveals that the cluster’s horizontal-to-vertical aspect ratio mostly remains within the range 0.5–1.5, while a critically large aspect ratio is considered a signal of cluster breakage (Pignatel et al. Reference Pignatel, Nicolas and Guazzelli2011). Second, figures 2(a) and 2(c) present the streamlines near the particle clouds at
$\hat {t} = 600$
in the chargeless case of Group II (see figure 3
c). Two pieces of evidence further support this. First, figure 3(d) reveals that the cluster’s horizontal-to-vertical aspect ratio mostly remains within the range 0.5–1.5, while a critically large aspect ratio is considered a signal of cluster breakage (Pignatel et al. Reference Pignatel, Nicolas and Guazzelli2011). Second, figures 2(a) and 2(c) present the streamlines near the particle clouds at $\hat {t} = 600$
. Despite continuous particle leakage at the rear, the internal circulation within the particle cloud remains closed, and the front-incoming streamlines do not penetrate the cloud, suggesting that the cluster remains intact. We note that the same dynamics persists as the simulation progresses to
$\hat {t} = 600$
. Despite continuous particle leakage at the rear, the internal circulation within the particle cloud remains closed, and the front-incoming streamlines do not penetrate the cloud, suggesting that the cluster remains intact. We note that the same dynamics persists as the simulation progresses to $\hat {t} = 1200$
(not shown).
$\hat {t} = 1200$
(not shown).
When hydrodynamic interactions are modelled using the Oseen solution (Group VI cases), the resulting cloud dynamics is qualitatively similar, as shown in figure 2( f) and supplementary movie 6, though quantitative differences exist (see figure 1 and § 4.1). This qualitative agreement suggests that the superposition method for simulating hydrodynamic interactions in Mars’ thin atmosphere is reasonable. The cases of cloud sedimentation in Earth’s atmosphere (Group VII) are discussed in Appendix B, where the Oseen solution must be applied to model the hydrodynamic interactions.
3.3. Evolution of charged clouds
As particle charge $N_q$
increases (see figures 2(b) and 2(d) for snapshots at
$N_q$
increases (see figures 2(b) and 2(d) for snapshots at $\hat {t} = 600$
), both the number of particles leaking and the tail length decrease, while the clouds expand further. Figures 3(a) and 3(b) show a monotonic decrease in the percentage of particles leaking as charge
$\hat {t} = 600$
), both the number of particles leaking and the tail length decrease, while the clouds expand further. Figures 3(a) and 3(b) show a monotonic decrease in the percentage of particles leaking as charge $N_q$
increases. Notably, in Groups I and II, high levels of charge (
$N_q$
increases. Notably, in Groups I and II, high levels of charge ( $N_q = 10^4$
–
$N_q = 10^4$
– $10^5$
) can completely prevent particles from leaking out of the spherically expanding clouds. In this Coulomb-dominated regime, the cluster radius expands as
$10^5$
) can completely prevent particles from leaking out of the spherically expanding clouds. In this Coulomb-dominated regime, the cluster radius expands as $\hat {t}^{1/3}$
(Subramanian & Koch Reference Subramanian and Koch2008; Chen et al. Reference Chen, Liu and Li2018), consistent with our data in figure 3(c). Figure 3(d) shows that as particle charge increases, the variation in the cloud’s aspect ratio decreases, indicating that the cloud maintains a more spherical shape.
$\hat {t}^{1/3}$
(Subramanian & Koch Reference Subramanian and Koch2008; Chen et al. Reference Chen, Liu and Li2018), consistent with our data in figure 3(c). Figure 3(d) shows that as particle charge increases, the variation in the cloud’s aspect ratio decreases, indicating that the cloud maintains a more spherical shape.
Figure 2(e) presents snapshots of Group III cases (charged clouds migrating under an applied electric field) at $\hat {t} = 600$
; see also supplementary movie 3. Compared to Group II under gravity, Group III cases with the same particle charge
$\hat {t} = 600$
; see also supplementary movie 3. Compared to Group II under gravity, Group III cases with the same particle charge $N_q$
have identical
$N_q$
have identical $N$
and
$N$
and $R_0$
, but different dimensionless charge parameters
$R_0$
, but different dimensionless charge parameters $\kappa _q$
, as defined by (2.12). Therefore,
$\kappa _q$
, as defined by (2.12). Therefore, $\kappa _q$
, rather than the absolute charge
$\kappa _q$
, rather than the absolute charge $N_q$
, better reflects the relative effect of charging. For
$N_q$
, better reflects the relative effect of charging. For $N_q = 1000$
,
$N_q = 1000$
, $3000$
and
$3000$
and $5000$
, the
$5000$
, the $\kappa _q$
values in Group II are
$\kappa _q$
values in Group II are $1.76 \times 10^{-4}$
,
$1.76 \times 10^{-4}$
, $1.58 \times 10^{-3}$
and
$1.58 \times 10^{-3}$
and $4.40 \times 10^{-3}$
, respectively, while in Group III, they are
$4.40 \times 10^{-3}$
, respectively, while in Group III, they are $2.50 \times 10^{-4}$
,
$2.50 \times 10^{-4}$
, $7.51 \times 10^{-4}$
and
$7.51 \times 10^{-4}$
and $1.25 \times 10^{-3}$
. Since tail formation is negatively correlated with electrostatic repulsion, the case with
$1.25 \times 10^{-3}$
. Since tail formation is negatively correlated with electrostatic repulsion, the case with $N_q = 5000$
in Group III shows more tailing than
$N_q = 5000$
in Group III shows more tailing than $N_q = 3000$
in Group II, but less than
$N_q = 3000$
in Group II, but less than $N_q = 1000$
, which aligns with figure 2(e).
$N_q = 1000$
, which aligns with figure 2(e).
Cloud size and dust concentration effects. (a) Dispersion of particles in the cloud reference frame at $\hat {t} = 300$
for the cases in Groups IV and V, where the initial dust concentration and cloud size are varied based on the cases in Group II. (b) The percentages
$\hat {t} = 300$
for the cases in Groups IV and V, where the initial dust concentration and cloud size are varied based on the cases in Group II. (b) The percentages $1-N^\ast$
of particles contained in the tails, and (c) the aspect ratios of the clouds for the cases in Group V (constant initial radius, corresponding to (ai), (aii) and (aiii)). (d) The percentages
$1-N^\ast$
of particles contained in the tails, and (c) the aspect ratios of the clouds for the cases in Group V (constant initial radius, corresponding to (ai), (aii) and (aiii)). (d) The percentages $1-N^\ast$
of particles contained in the tails, and (e) the aspect ratios of the clouds in (d) for the cases in Group IV (constant initial dust concentration, corresponding to (aiii), (aiv) and (av)). Only the results for
$1-N^\ast$
of particles contained in the tails, and (e) the aspect ratios of the clouds in (d) for the cases in Group IV (constant initial dust concentration, corresponding to (aiii), (aiv) and (av)). Only the results for $N_q = 0$
are presented in (b)–(e).
$N_q = 0$
are presented in (b)–(e).

3.4. Influences of dust concentration and cluster size
Figure 4(a) illustrates the cloud morphology at $\hat {t} = 300$
for the cases in Groups IV and V, highlighting the effects of dust concentration
$\hat {t} = 300$
for the cases in Groups IV and V, highlighting the effects of dust concentration $\alpha$
and cluster size
$\alpha$
and cluster size $R_0$
(see also supplementary movies 4 and 5). All cases exhibit similar dynamics: when hydrodynamic interactions dominate due to small particle charges, the cluster remains roughly spherical, resulting in significant particle leakage. As the charge increases, the cluster transitions to a spherically symmetric expansion, leading to reduced leakage.
$R_0$
(see also supplementary movies 4 and 5). All cases exhibit similar dynamics: when hydrodynamic interactions dominate due to small particle charges, the cluster remains roughly spherical, resulting in significant particle leakage. As the charge increases, the cluster transitions to a spherically symmetric expansion, leading to reduced leakage.
In both groups, an increase in $N$
strengthens the hydrodynamic interactions. In Group V, figure 4(b) shows that denser clouds yield more escaping particles, especially in the early stage, with shorter delays. A similar reduction in delay time is observed in figure 4(d) for Group IV as
$N$
strengthens the hydrodynamic interactions. In Group V, figure 4(b) shows that denser clouds yield more escaping particles, especially in the early stage, with shorter delays. A similar reduction in delay time is observed in figure 4(d) for Group IV as $N$
increases, although the percentage of particles leaking does not change significantly compared to
$N$
increases, although the percentage of particles leaking does not change significantly compared to $N = 256$
during the simulated period. Additionally, the aspect ratios remain within the range 0.5–1.5 (figures 4
c,e), suggesting that actual Martian dust clouds, which may be much larger and influenced by surrounding particles, are likely to follow similar dynamics revealed here.
$N = 256$
during the simulated period. Additionally, the aspect ratios remain within the range 0.5–1.5 (figures 4
c,e), suggesting that actual Martian dust clouds, which may be much larger and influenced by surrounding particles, are likely to follow similar dynamics revealed here.
For particle cloud evolution in the transition-flow regime, the largely unchanged bulk cluster facilitates a more detailed analysis of the trailing behaviour, which is difficult under continuum-flow conditions due to the unstable cloud morphology. However, it is still unclear whether actual Martian dust clouds truly form tails during sedimentation. These issues will be addressed in the next section.
4. Discussion
In § 4.1 and § 4.2, we present analytical results on the trailing behaviour of chargeless clouds by superimposing the disturbed velocities from (2.8). Section 4.3 explores the relative importance between hydrodynamic and electrostatic interactions.
(a) Schematic diagram of the cloud and the uppermost particle in the tail. (b) Analytical (left-hand columns) and simulated (right-hand columns) cloud settling velocities at $\hat {t}=0$
for different cases. From left to right:
$\hat {t}=0$
for different cases. From left to right: $N_q = 0$
in Group I (
$N_q = 0$
in Group I ( $\hat {a} = 3123^{-1}$
);
$\hat {a} = 3123^{-1}$
); $N_q = 0$
in Group II (
$N_q = 0$
in Group II ( $\hat {a} = 1561^{-1}$
);
$\hat {a} = 1561^{-1}$
); $N_q = 0$
and
$N_q = 0$
and $N = 512$
in Group V (
$N = 512$
in Group V ( $\hat {a} = 1561^{-1}$
);
$\hat {a} = 1561^{-1}$
); $N_q = 0$
and
$N_q = 0$
and $N = 1024$
in Group V (
$N = 1024$
in Group V ( $\hat {a} = 1561^{-1}$
);
$\hat {a} = 1561^{-1}$
); $N_q = 0$
in Group VI (Oseen solution for
$N_q = 0$
in Group VI (Oseen solution for $N = 256$
). (c,d) Dimensionless velocity differences between the rearmost particle and the cluster, as a function of
$N = 256$
). (c,d) Dimensionless velocity differences between the rearmost particle and the cluster, as a function of $\hat {L}_{{tail}} = \hat {a}s$
, for the cases in (c) Group IV and (d) Group V. The analytical results (dashed lines) are based on (4.8), and the simulation results (solid lines) are computed based on the varying numbers of particles
$\hat {L}_{{tail}} = \hat {a}s$
, for the cases in (c) Group IV and (d) Group V. The analytical results (dashed lines) are based on (4.8), and the simulation results (solid lines) are computed based on the varying numbers of particles $N(t)$
in the bulk cluster. (e,f) Dimensionless tail lengths of the cases in (e) Group IV and (f) Group V. For the simulation (solid lines), the tail length is defined as the distance from the uppermost particle to the cloud’s centre of mass, denoted as
$N(t)$
in the bulk cluster. (e,f) Dimensionless tail lengths of the cases in (e) Group IV and (f) Group V. For the simulation (solid lines), the tail length is defined as the distance from the uppermost particle to the cloud’s centre of mass, denoted as $D$
in (a), and
$D$
in (a), and $\hat {L}_{{tail}} = D / R$
. The semi-analytical results are obtained based on (4.11). The starting times are
$\hat {L}_{{tail}} = D / R$
. The semi-analytical results are obtained based on (4.11). The starting times are $\hat {t}_1 = 12$
for
$\hat {t}_1 = 12$
for $N = 256$
,
$N = 256$
, $\hat {t}_1 = 14$
for
$\hat {t}_1 = 14$
for $N = 512$
, and
$N = 512$
, and $\hat {t}_1 = 6$
for
$\hat {t}_1 = 6$
for $N = 1024$
in (e), whereas
$N = 1024$
in (e), whereas $\hat {t}_1 = 24$
for
$\hat {t}_1 = 24$
for $N = 512$
, and
$N = 512$
, and $\hat {t}_1 = 4$
for
$\hat {t}_1 = 4$
for $N = 1024$
, in (f). (g) The percentages of particles
$N = 1024$
, in (f). (g) The percentages of particles $1-N^\ast$
leaking from the clouds (left-hand axis) and the reciprocal of
$1-N^\ast$
leaking from the clouds (left-hand axis) and the reciprocal of $\psi$
in (4.13) (right-hand axis) as functions of the charge
$\psi$
in (4.13) (right-hand axis) as functions of the charge $N_q$
. (h) The
$N_q$
. (h) The $R_0$
–
$R_0$
– $\alpha$
diagram of the dust cloud, in which the chargeless cases from Groups I and II are marked. The shaded region suggests the potential range of actual Martian dust clouds, which may be significantly larger in size.
$\alpha$
diagram of the dust cloud, in which the chargeless cases from Groups I and II are marked. The shaded region suggests the potential range of actual Martian dust clouds, which may be significantly larger in size.

4.1. Cloud settling velocity
Here, we derive the analytical settling velocity $v_{cl}$
of a uniform cloud at
$v_{cl}$
of a uniform cloud at $t = 0$
in the transition-flow regime, corresponding to the settling velocity of the cloud’s centre of mass. Due to hydrodynamic interactions, the cloud settles faster than the terminal velocity of a single particle,
$t = 0$
in the transition-flow regime, corresponding to the settling velocity of the cloud’s centre of mass. Due to hydrodynamic interactions, the cloud settles faster than the terminal velocity of a single particle, $v_{\textit{tm}}$
. For the continuum Oseen flow (see Appendix A), it is known that (Yang et al. Reference Yang, Li and Marshall2015)
$v_{\textit{tm}}$
. For the continuum Oseen flow (see Appendix A), it is known that (Yang et al. Reference Yang, Li and Marshall2015)
 \begin{equation} \frac {v_{cl}}{v_{\textit{tm}}} = 1 + 1.2N\hat {a}\,\frac {3}{3 + Re_{cl}}, \end{equation}
where $\hat {a} = a / R$
, and the cluster Reynolds number is
$\hat {a} = a / R$
, and the cluster Reynolds number is $Re_{cl} = v_s R / u$
.
$Re_{cl} = v_s R / u$
.
For the transition flow on Mars, similar to the Oseen case (Yang et al. Reference Yang, Li and Marshall2015), the ‘north pole’ of the cloud (i.e. $D = R$
in figure 5
a) is stationary in the cloud reference frame, as seen in figure 1(g). This implies that
$D = R$
in figure 5
a) is stationary in the cloud reference frame, as seen in figure 1(g). This implies that
 \begin{align} v_{cl} = v_{\textit{tm}} + u_{f,np}, \end{align}
where $u_{f,np}$
is the velocity disturbance at the north pole caused by all particles in the cloud. Superposing the flow field gives
$u_{f,np}$
is the velocity disturbance at the north pole caused by all particles in the cloud. Superposing the flow field gives

where $n = 3N / (4\unicode{x03C0} R^3 )$
is the particle number density. The second line is derived using (2.8) and substituting
$n = 3N / (4\unicode{x03C0} R^3 )$
is the particle number density. The second line is derived using (2.8) and substituting $l = r / a$
. With
$l = r / a$
. With $b(l)$
and
$b(l)$
and $c(l)$
fitted as in § 2.2 (see table 1 and figure 1
d), the above integral has an analytical solution, which yields
$c(l)$
fitted as in § 2.2 (see table 1 and figure 1
d), the above integral has an analytical solution, which yields
 \begin{equation} \frac {v_{cl}}{v_{\textit{tm}}} = 1 + N\hat {a} \left (0.5275 - 19.78\hat {a}^2 + 176.3\hat {a}^3 - 439.1\hat {a}^5\right ), \quad \hat {a} \lt \frac {1}{25}. \end{equation}
As shown in figure 5(b), (4.4) agrees well with the numerical results. Note that the cloud settling velocity in the transition-flow regime (column II of figure 5
b) is smaller than that predicted by the Oseen solution (column VI), further illustrating the quantitative differences between the two flow fields. Since (4.4) is positively correlated with $N$
, the cases in Group V (
$N$
, the cases in Group V ( $N = 512, 1024$
) exhibit greater
$N = 512, 1024$
) exhibit greater $v_{cl}$
compared to the Group II case (
$v_{cl}$
compared to the Group II case ( $N = 256$
). Moreover,
$N = 256$
). Moreover, $v_{cl}$
decreases over time due to particle depletion caused by leakage.
$v_{cl}$
decreases over time due to particle depletion caused by leakage.
4.2. Tail formation and growth
The preceding technique can be extended to derive analytical expressions for the velocity difference between the uppermost particle in the tail and the bulk cluster, leveraging the largely unchanged cloud shape during evolution. Referring to figure 5(a), we calculate the velocity disturbance $u_{f,l}$
at the location of a particle in the tail, positioned a distance
$u_{f,l}$
at the location of a particle in the tail, positioned a distance $D$
above the cloud’s centre of mass. Neglecting the velocity disturbance from other particles in the tail, we have
$D$
above the cloud’s centre of mass. Neglecting the velocity disturbance from other particles in the tail, we have $\left .u_{f,l}\right |_{D=R} = u_{f,np}$
, where
$\left .u_{f,l}\right |_{D=R} = u_{f,np}$
, where $u_{f,np}$
was introduced in the previous subsection. Superposing the flow field yields
$u_{f,np}$
was introduced in the previous subsection. Superposing the flow field yields
 \begin{align} u_{f,l} = \int _{0}^{2\unicode{x03C0} } \int _{D-R}^{D+R} \int _{\cos ^{-1}\left (-\frac {r^2 + D^2 - R^2}{2Dr}\right )}^{\unicode{x03C0} } n \left (u_r \cos {\theta } - u_\theta \sin {\theta }\right ) r^2 \sin {\theta } \, {\rm d}\theta \, {\rm d}r \, {\rm d}\phi . \end{align}
Letting $l = r / a$
,
$l = r / a$
, $s = D / a$
, and using (2.8), we obtain
$s = D / a$
, and using (2.8), we obtain
 \begin{align} u_{f,l}(s; \hat {a}) = \frac {3}{2} N v_{\textit{tm}} \hat {a}^3 \int _{s-{1}/{\hat a}}^{s+{1}/{\hat {a}}} \left [ \begin{aligned} &\left (1 - b(l)\right ) \frac {l^2}{3} \left (1 - \mathcal T^3\right ) \\ &{}+ \left (1 - c(l)\right ) l^2 \left (\frac {2}{3} - \mathcal T + \frac {1}{3} \mathcal T^3\right ) \end{aligned} \right ] {\rm d}l, \quad s \geqslant \frac {1}{\hat {a}} = \frac {R}{a}, \end{align}
where
 \begin{align} \mathcal T = \mathcal T(l;s,\hat a) = \frac {l^2+s^2-\hat {a}^{-2}}{2sl}. \end{align}
The velocity difference between particles in the tail and the bulk cluster is then
 \begin{equation} v_{rel}(s; \hat {a}) = u_{f,np}(\hat {a}) - u_{f,l}(s; \hat {a}) = N v_{\textit{tm}} \big (A_0 - A_1 s^{-1} + A_2 s^{-3}\big ). \end{equation}
Here, the coefficients $A_i$
(
$A_i$
( $i = 0, 1, 2$
) depend on
$i = 0, 1, 2$
) depend on $\hat {a}$
, with their typical values listed in table 4. Clearly,
$\hat {a}$
, with their typical values listed in table 4. Clearly, $v_{rel} = 0$
when
$v_{rel} = 0$
when $s = \hat {a}^{-1}$
(or equivalently,
$s = \hat {a}^{-1}$
(or equivalently, $D = R$
).
$D = R$
).
Parameters in (4.8).

The prediction of $v_{rel} / (N v_{\textit{tm}} )$
by (4.8), in the form
$v_{rel} / (N v_{\textit{tm}} )$
by (4.8), in the form $A_0 - A_1 s^{-1} + A_2 s^{-3}$
, is compared with simulation results in figures 5(c) and 5(b), showing satisfactory agreement for all cases in Groups IV and V. Here, we define the dimensionless tail length as
$A_0 - A_1 s^{-1} + A_2 s^{-3}$
, is compared with simulation results in figures 5(c) and 5(b), showing satisfactory agreement for all cases in Groups IV and V. Here, we define the dimensionless tail length as $\hat {L}_{{tail}} = D / R = \hat {a}s \geqslant 1$
, where
$\hat {L}_{{tail}} = D / R = \hat {a}s \geqslant 1$
, where $D$
is the distance to the uppermost particle in the tail. In all cases,
$D$
is the distance to the uppermost particle in the tail. In all cases, $v_{rel} / (N v_{\textit{tm}} )$
increases with
$v_{rel} / (N v_{\textit{tm}} )$
increases with $\hat {L}_{{tail}}$
, and approaches a constant (equal to
$\hat {L}_{{tail}}$
, and approaches a constant (equal to $A_0$
) as
$A_0$
) as $\hat {L}_{{tail}} \gg 1$
, indicating that particles in the tail always fall slower than the cluster, causing the tail to elongate at an asymptotically steady rate. For Group V,
$\hat {L}_{{tail}} \gg 1$
, indicating that particles in the tail always fall slower than the cluster, causing the tail to elongate at an asymptotically steady rate. For Group V, $v_{rel} / (N v_{\textit{tm}} )$
collapses for different
$v_{rel} / (N v_{\textit{tm}} )$
collapses for different $N$
with the same
$N$
with the same $\hat {a}=1561^{-1}$
, while for Group IV with varied
$\hat {a}=1561^{-1}$
, while for Group IV with varied $\hat {a}$
, it decreases with
$\hat {a}$
, it decreases with $N$
. Predictions by (4.8) tend to slightly over-estimate the velocity difference, likely due to neglecting the influence of particles in the tail on the rearmost particle.
$N$
. Predictions by (4.8) tend to slightly over-estimate the velocity difference, likely due to neglecting the influence of particles in the tail on the rearmost particle.
However, (4.8) does not hold for $s \ll \hat {a}^{-1}$
(or
$s \ll \hat {a}^{-1}$
(or $\hat {L}_{{tail}} \ll 1$
). To see this, we start from
$\hat {L}_{{tail}} \ll 1$
). To see this, we start from
 \begin{align} \hat {a} \frac {{\rm d}s}{{\rm d}\hat {t}} = \frac {{\rm d}\hat {L}_{{tail}}}{{\rm d}\hat {t}} = \frac {v_{rel}}{v_{\textit{tm}}}, \end{align}
which, through (4.8), leads to the integral for the tail length:
 \begin{align} \int _{0}^{\hat {t}} N(w)\, {\rm d}w = \hat {a} \int _{\hat {a}^{-1}}^{s} \frac {{\rm d}s}{A_0 - A_1 s^{-1} + A_2 s^{-3}}. \end{align}
Unfortunately, the improper integral on the right-hand side is divergent, indicating that non-uniform particle concentration in the cloud’s early leakage stage is crucial for determining the velocity of escaped particles. Consequently, the tail length can only be solved for $\hat {t} \gt \hat {t}_1 \gt 0$
as
$\hat {t} \gt \hat {t}_1 \gt 0$
as
 \begin{equation} \int _{\hat {t}_1}^{\hat {t}} N(w)\, {\rm d}w = \hat {a} \int _{s_1}^{s} \frac {{\rm d}s}{A_0 - A_1 s^{-1} + A_2 s^{-3}}, \end{equation}
where $s_1 = s_1(\hat {t}_1)$
is the tail length at
$s_1 = s_1(\hat {t}_1)$
is the tail length at $\hat {t}_1$
. By taking
$\hat {t}_1$
. By taking $\hat {t}_1$
,
$\hat {t}_1$
, $s_1$
and
$s_1$
and $N(\hat {t})$
from simulation data, the evolution of the tail length
$N(\hat {t})$
from simulation data, the evolution of the tail length $\hat {L}_{{tail}}(\hat {t}) = \hat {a}\,s(\hat {t})$
is obtained for
$\hat {L}_{{tail}}(\hat {t}) = \hat {a}\,s(\hat {t})$
is obtained for $\hat {t} \gt \hat {t}_1$
. Figures 5(e) and 5(f) demonstrate good agreement between semi-analytical predictions and simulated
$\hat {t} \gt \hat {t}_1$
. Figures 5(e) and 5(f) demonstrate good agreement between semi-analytical predictions and simulated $\hat {L}_{{tail}}$
for all cases in Groups IV and V. It is observed that
$\hat {L}_{{tail}}$
for all cases in Groups IV and V. It is observed that $\hat {L}_{{tail}}$
initially grows superlinearly, followed by an asymptotic linear increase. Increasing
$\hat {L}_{{tail}}$
initially grows superlinearly, followed by an asymptotic linear increase. Increasing $N$
in either group amplifies
$N$
in either group amplifies $\hat {L}_{{tail}}$
, as stronger hydrodynamic interactions lengthen the tails, with Group V cases (higher dust concentrations) showing longer tails. The choice of
$\hat {L}_{{tail}}$
, as stronger hydrodynamic interactions lengthen the tails, with Group V cases (higher dust concentrations) showing longer tails. The choice of $\hat {t}_1$
(which determines
$\hat {t}_1$
(which determines $s_1$
) is specified in the caption of figure 5. Notably,
$s_1$
) is specified in the caption of figure 5. Notably, $\hat {t}_1$
can be taken much earlier than the onset of asymptotic linear growth for effective prediction of
$\hat {t}_1$
can be taken much earlier than the onset of asymptotic linear growth for effective prediction of $\hat {L}_{{tail}}$
at
$\hat {L}_{{tail}}$
at $\hat {t} \gt \hat {t}_1$
.
$\hat {t} \gt \hat {t}_1$
.
4.3. Electrostatic versus hydrodynamic interactions
When particles are charged in the clouds, the dynamics are governed by the competition between hydrodynamic and Coulomb interactions. Coulomb forces reduce the tendency for tail formation, as illustrated in figures 2–4 and 5(g). In particular, the ‘critical’ charge $N_q$
for eliminating particle leakage is approximately
$N_q$
for eliminating particle leakage is approximately $10^4$
for both Groups I and II. The relative strength of hydrodynamic versus electrostatic interactions can be characterised by a dimensionless parameter (Chen et al. Reference Chen, Liu and Li2018):
$10^4$
for both Groups I and II. The relative strength of hydrodynamic versus electrostatic interactions can be characterised by a dimensionless parameter (Chen et al. Reference Chen, Liu and Li2018):
 \begin{align} \psi = \frac {\left |\sum _{j eq i} \hat {\boldsymbol{V}}_{\textit{Tr}}(\hat {\boldsymbol{v}}_{s,j}, \hat {\boldsymbol{r}}_{ij}; a)\right |}{\left | ({\kappa _q}/{N}) \sum _{j eq i} \left ({\hat {\boldsymbol{r}}_{ij}}/{\hat {r}_{ij}^3}\right )\right |} \approx \left (\kappa _q^{-1} + 1\right ) N \hat {a} \frac {R({\textit a})}{R_0}. \end{align}
The second expression arises from a scaling analysis of the Oseen interaction by Chen et al. (Reference Chen, Liu and Li2018), and the same reasoning applies to the transition-flow interaction given in (2.8). Substituting (2.12) for $\kappa _q$
at the initial state
$\kappa _q$
at the initial state $R(t) = R_0$
, we obtain
$R(t) = R_0$
, we obtain
 \begin{equation} \psi = \left (\frac {4 \unicode{x03C0} \epsilon _0 R_0^2 m_p g}{q^2} + N\right ) \hat {a}. \end{equation}
Figure 5(g) plots $\psi ^{-1}$
as a function of
$\psi ^{-1}$
as a function of $N_q$
for Groups I and II. Remarkably, when
$N_q$
for Groups I and II. Remarkably, when $N_q \lt 10^4$
,
$N_q \lt 10^4$
, $\psi ^{-1} \ll 1$
, but it sharply increases for
$\psi ^{-1} \ll 1$
, but it sharply increases for $N_q \gt 10^4$
. The coincidence of this ‘critical value’ (
$N_q \gt 10^4$
. The coincidence of this ‘critical value’ ( $N_q \sim 10^4$
) for both
$N_q \sim 10^4$
) for both $\psi ^{-1}$
and the percentage of particle leakage suggests that the charge levels
$\psi ^{-1}$
and the percentage of particle leakage suggests that the charge levels $N_q \gt 10^4$
correspond to the Coulomb-dominated regime under these conditions.
$N_q \gt 10^4$
correspond to the Coulomb-dominated regime under these conditions.
To understand the relative importance of electrostatic and hydrodynamic interactions in actual Martian dust clouds, which may be much larger than those simulated in Groups I and II, we analyse the effects of dust concentration $\alpha$
and cluster size
$\alpha$
and cluster size $R_0$
using the parameter
$R_0$
using the parameter $\psi$
from (4.13). Assuming a fixed charge
$\psi$
from (4.13). Assuming a fixed charge $q$
, increasing
$q$
, increasing $\alpha$
while keeping
$\alpha$
while keeping $R_0$
constant (Group V cases) increases
$R_0$
constant (Group V cases) increases $N$
, which reduces
$N$
, which reduces $\psi ^{-1}$
as the other terms in (4.13) remain unchanged. On the other hand, for Group IV cases,
$\psi ^{-1}$
as the other terms in (4.13) remain unchanged. On the other hand, for Group IV cases, $N \sim R_0^3$
due to fixed
$N \sim R_0^3$
due to fixed $\alpha$
. Since
$\alpha$
. Since $\hat {a} = a / R_0$
, (4.13) gives
$\hat {a} = a / R_0$
, (4.13) gives
 \begin{align} \psi = C_1 R_0 + C_2 R_0^2, \end{align}
where $C_1$
and
$C_1$
and $C_2$
are constants dependent on
$C_2$
are constants dependent on $q$
,
$q$
, $a$
and
$a$
and $\alpha$
(but independent of
$\alpha$
(but independent of $R_0$
), indicating that
$R_0$
), indicating that $\psi ^{-1}$
decreases with
$\psi ^{-1}$
decreases with $R_0$
. Therefore, the ‘critical charge’ for a transition to the Coulomb-dominated regime increases with both
$R_0$
. Therefore, the ‘critical charge’ for a transition to the Coulomb-dominated regime increases with both $\alpha$
and
$\alpha$
and $R_0$
, as confirmed by figure 4(a): with
$R_0$
, as confirmed by figure 4(a): with $N_q = 10^4$
, cases (ai) and (av) exhibit more pronounced trailing than case (aiii).
$N_q = 10^4$
, cases (ai) and (av) exhibit more pronounced trailing than case (aiii).
Based on this analysis, we conclude that under Martian conditions, if the settling dust cloud is much larger than those simulated here, while the concentration $\alpha$
remains comparable to our cases (as sketched in figure 5
h), the critical charge for the transition to Coulomb dominance would be much higher than
$\alpha$
remains comparable to our cases (as sketched in figure 5
h), the critical charge for the transition to Coulomb dominance would be much higher than $10^4 e$
and likely exceed the actual charge of dust particles. Consequently, the sedimentation dynamics of Martian dust clouds would quantitatively follow the trends revealed in our results: significant particle leakage forming tails, while the bulk clusters remain intact over extended periods. The results have implications for Martian ESPs as well: under the charge levels achievable in ESPs,
$10^4 e$
and likely exceed the actual charge of dust particles. Consequently, the sedimentation dynamics of Martian dust clouds would quantitatively follow the trends revealed in our results: significant particle leakage forming tails, while the bulk clusters remain intact over extended periods. The results have implications for Martian ESPs as well: under the charge levels achievable in ESPs, $N_q=\textit {O}(10^3)$
, tail formation persists, highlighting the need to account for hydrodynamic interactions in the design of Martian ESPs to optimise dust collection.
$N_q=\textit {O}(10^3)$
, tail formation persists, highlighting the need to account for hydrodynamic interactions in the design of Martian ESPs to optimise dust collection.
5. Conclusions
In this paper, we develop a numerical method to simulate the migration and evolution of microparticle clouds under transition flow conditions, with an emphasis on both the hydrodynamic interactions and the electrostatic interactions between particles. As an application to small dust cloud sedimentation on Mars, we focus on the dynamics of the 10 $\,\unicode{x03BC}$
m fraction of ‘settled dust’. The main findings of the study are as follows.
$\,\unicode{x03BC}$
m fraction of ‘settled dust’. The main findings of the study are as follows.
-
(i) Evolution dynamics and particle leakage. Our results reveal that Martian dust clouds evolve to form long tails without breaking apart, a behaviour that contrasts significantly with the dynamics observed under Earth’s continuum-flow conditions, where hydrodynamic interactions are much stronger. Specifically, the percentage of particles leaking out of the cloud can reach 25 % after approximately 10 minutes of evolution. Although the results show quantitative differences from those based on the Oseen approximation, they are qualitatively similar, validating the reliability of our approximation method for the Martian transition-flow regime.
-
(ii) Scalability to larger dust clouds. While the size of the simulated dust clouds is relatively small due to computational constraints, analyses and simulation results suggest that larger Martian dust clouds are likely to exhibit the same qualitative dynamic evolution. Notably, these larger clouds would require particle charges much greater than $10^4 e$
to eliminate particle leakage, which may exceed the actual charge levels of Martian dust particles.
$10^4 e$
to eliminate particle leakage, which may exceed the actual charge levels of Martian dust particles. -
(iii) Insights with analytical expressions. We provide quantitative predictions for the settling velocity of dust clouds in the transition-flow regime. Additionally, we derive analytical expressions for the evolution of tail length and the velocity difference between particles in the tail and the bulk cloud, offering a theoretical basis for future studies on Martian dust dynamics.

Supplementary movies
Supplementary movies are available at https://doi.org/10.1017/jfm.2025.10401.
Funding
This study was supported by the National Key Research and Development Programme of China (no. 2020YFC2201103).
Declaration of interests
The authors report no conflict of interest.
Data availability statement
The data that support the findings of this study are openly available at https://github.com/linlin137/Marsdust.
Author contributions
Q.H. and S.Q.L. conceived the initial research idea. Q.H. and H.L. developed numerical models, performed simulations and derived analytical results. All three authors contributed to writing the paper.
Appendix A. Oseen solution in the continuum regime
In the continuum regime, where $Kn \ll 1$
, the steady-state flow field around a particle is governed by the Navier–Stokes equation. At low Reynolds numbers, the equation can be linearised, yielding the Oseen equation (Batchelor Reference Batchelor2000):
$Kn \ll 1$
, the steady-state flow field around a particle is governed by the Navier–Stokes equation. At low Reynolds numbers, the equation can be linearised, yielding the Oseen equation (Batchelor Reference Batchelor2000):
 \begin{align} \boldsymbol{v}_s \boldsymbol{\cdot} \boldsymbol{\nabla} \boldsymbol{u} = -\frac {\boldsymbol{\nabla} p}{ho } + v\, \Delta \boldsymbol{u}, \quad \boldsymbol{\nabla} \boldsymbol{\cdot} \boldsymbol{u} = 0. \end{align}
Under the geometric configuration shown in figure 1(c), the solution for the flow around a falling spherical particle is (Batchelor Reference Batchelor2000)
 \begin{align} \begin{aligned} u_r &= v_s \left ( -\frac {a^3 \cos {\theta }}{2r^3} + \frac {3a^2}{2\, Re_p\, r^2} \left ( 1 - E \right ) - \frac {3a \left ( 1 - \cos {\theta } \right )}{4r} E \right ), \\ u_\theta &= -v_s \sin {\theta } \left ( \frac {a^3}{4r^3} + \frac {3aE}{4r} \right ), \end{aligned} \end{align}
where
 \begin{align} E = \exp {\left [ - \frac {r\, Re_p \left ( 1 + \cos {\theta } \right )}{2a} \right ]}. \end{align}
Typical profiles of $u_r$
and
$u_r$
and $u_\theta$
are shown in figures 1(e,f) for comparison. It is known that this flow is non-symmetric, with a narrower ‘wake inflow region’ (where
$u_\theta$
are shown in figures 1(e,f) for comparison. It is known that this flow is non-symmetric, with a narrower ‘wake inflow region’ (where $u_r \lt 0$
) located behind the sphere (Batchelor Reference Batchelor2000; Subramanian & Koch Reference Subramanian and Koch2008).
$u_r \lt 0$
) located behind the sphere (Batchelor Reference Batchelor2000; Subramanian & Koch Reference Subramanian and Koch2008).
Sedimentation under Earth conditions (Group VII). (a) Velocity vectors of dust particles at $t = 0$
. (b) Evolution of the cloud with
$t = 0$
. (b) Evolution of the cloud with $N_q = 0$
in the cloud reference frame. (c) Dispersion of particles in the cloud reference frame at
$N_q = 0$
in the cloud reference frame. (c) Dispersion of particles in the cloud reference frame at $\hat {t} = 600$
for the cases in Group VII. (d) The
$\hat {t} = 600$
for the cases in Group VII. (d) The $\hat {x}$
–
$\hat {x}$
– $\hat {y}$
plots of particles with different values of
$\hat {y}$
plots of particles with different values of $\hat {z}$
at
$\hat {z}$
at $\hat {t} = 600$
for the case
$\hat {t} = 600$
for the case $N_q = 10^4$
in Group VII. From left to right:
$N_q = 10^4$
in Group VII. From left to right: $\hat {z} \lt -0.934$
,
$\hat {z} \lt -0.934$
, $-0.934 \lt \hat {z} \lt -0.220$
,
$-0.934 \lt \hat {z} \lt -0.220$
, $-0.220 \lt \hat {z} \lt 0.494$
,
$-0.220 \lt \hat {z} \lt 0.494$
, $0.494 \lt \hat {z} \lt 1.208$
and
$0.494 \lt \hat {z} \lt 1.208$
and $\hat {z} \gt 1.208$
.
$\hat {z} \gt 1.208$
.

Appendix B. Sedimentation under Earth’s conditions
This appendix presents results from Group VII for particle clouds settling in Earth’s atmosphere, where the Oseen solution is used to describe velocity disturbances with $Re_p \sim 10^{-3}$
(see table 3). As shown in figure 6(b), the particle cloud disperses in all directions, with no apparent particle leakage or cluster fragmentation observed. Increasing the particle charge further expands the cluster, as displayed in figure 6(c). See also supplementary movie 7 for the dynamics. The cloud morphology is consistent with a case from Chen et al. (Reference Chen, Liu and Li2018) with comparable values of
$Re_p \sim 10^{-3}$
(see table 3). As shown in figure 6(b), the particle cloud disperses in all directions, with no apparent particle leakage or cluster fragmentation observed. Increasing the particle charge further expands the cluster, as displayed in figure 6(c). See also supplementary movie 7 for the dynamics. The cloud morphology is consistent with a case from Chen et al. (Reference Chen, Liu and Li2018) with comparable values of $\alpha$
(particle concentration) and
$\alpha$
(particle concentration) and $Re_p$
.
$Re_p$
.
The absence of particle leakage can be attributed to the strengthened inflow at the rear of the cloud due to the greater $Re_p \sim 10^{-3}$
(Pignatel et al. Reference Pignatel, Nicolas and Guazzelli2011). Notably, the inner circulation vanishes (see figure 6
a), in contrast to the case with
$Re_p \sim 10^{-3}$
(Pignatel et al. Reference Pignatel, Nicolas and Guazzelli2011). Notably, the inner circulation vanishes (see figure 6
a), in contrast to the case with $Re_p \sim 10^{-5}$
in figure 1(g). Instead, the flow in figure 6(a) pushes the edge particles outward almost horizontally, creating ‘rings’ of particles. Meanwhile, the bulk cluster near the central axis settles at a higher speed. As a result, the clusters adopt a ‘bowl’-shaped structure with an upward-facing opening. This is clearly demonstrated in figure 6(d), which shows the projections of particle positions onto the
$Re_p \sim 10^{-5}$
in figure 1(g). Instead, the flow in figure 6(a) pushes the edge particles outward almost horizontally, creating ‘rings’ of particles. Meanwhile, the bulk cluster near the central axis settles at a higher speed. As a result, the clusters adopt a ‘bowl’-shaped structure with an upward-facing opening. This is clearly demonstrated in figure 6(d), which shows the projections of particle positions onto the $\hat {x}$
–
$\hat {x}$
– $\hat {y}$
plane for different ranges of height (in the
$\hat {y}$
plane for different ranges of height (in the $\hat {z}$
-coordinate) for the case
$\hat {z}$
-coordinate) for the case $N_q = 10^4$
in Group VII.
$N_q = 10^4$
in Group VII.


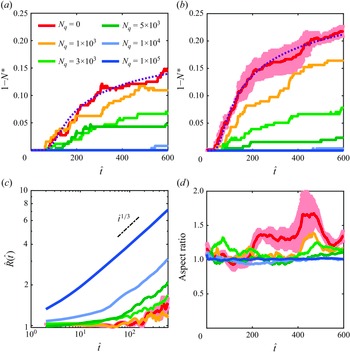


 Open access