

1. Introduction
Associations between sounds and meanings have been studied independently by linguists, psychologists, and cognitive scientists through a range of different methodologies. Yet, the results and conclusions drawn from this research show considerable overlap and a shared desire to further investigate underlying cognitive processes which cause these associations. Aiming to bridge the gap between the cognitive and linguistic levels of analysis, we focused on one particular domain – color – and investigated both perceptual cross-modal associations and sound symbolism in color words. Building upon previous psychological research, the experimental part of this project provided an insight into the cognitive mechanisms responsible for sound–color associations on a perceptual level, as reported elsewhere (Anikin & Johansson, Reference Anikin and Johansson2019). This experimental work enabled us to formulate concrete hypotheses regarding the expected patterns of sound symbolism in color words. In the present study we report the results of testing these hypotheses using linguistic evidence from a large corpus of basic vocabulary (Johansson, Anikin, Carling, & Holmer, Reference Johansson, Anikin, Carling and Holmerin press). We begin by introducing sound symbolism and sound–meaning associations in general, followed by a discussion of the domain of color and its cross-modal and sound symbolic associations across and within languages. We then investigate the link between perceived loudness (sonority) and brightness of phonemes with their relative frequencies in color word data from natural languages.
1.1. sound–meaning associations
Languages include different sounds in their phonologies, and these sounds can be combined into an almost endless number of strings that make up words. The words, in turn, also change over time and are frequently replaced by other words due to areal contact. It has therefore been commonly held that the connection between what a word means and how it is pronounced is on the whole arbitrary (Saussure, Reference Saussure1916). However, an increasing number of studies have demonstrated that a motivated association between sound and meaning, known as iconicity in general and sound symbolism in regard to spoken words, is far from being a fringe phenomenon and plays a crucial role for our ability to understand human language. In particular, the growing availability of written language description has made it possible to conduct large-scale cross-linguistic comparisons, which have revealed numerous over-representations of sounds, primarily in what is considered basic vocabulary (Blasi, Wichmann, Hammarström, Stadler, & Christiansen, Reference Blasi, Wichmann, Hammarström, Stadler and Christiansen2016; Johansson et al., Reference Johansson, Anikin, Carling and Holmerin press; Wichmann, Holman, & Brown, Reference Wichmann, Holman and Brown2010). Furthermore, for almost a century sound symbolism has been investigated experimentally in a range of semantic fields, which have often included semantically oppositional adjectival pairs (e.g., Diffloth, Reference Diffloth, Hinton, Nichols and Ohala1994; Newman, Reference Newman1933; Sapir, Reference Sapir1929). Among the most notable studies, Köhler (Reference Köhler1929), as well as a range of follow-up studies (e.g., Ramachandran & Hubbard, Reference Ramachandran and Hubbard2001), found that an overwhelming majority of participants prefer to pair words with voiced sonorants and rounded vowels (e.g., bouba) to rounded shapes, and words with unvoiced obstruents and unrounded vowels (e.g., kiki) to pointy shapes.
It has been suggested that iconicity may be associated with several functional and communicative benefits. Iconic forms, including nonsense words, may increase learnability, especially for children (Imai, Kita, Nagumo, & Okada, Reference Imai, Kita, Nagumo and Okada2008; Imai & Kita, Reference Imai and Kita2014; Lupyan & Casasanto, Reference Lupyan and Casasanto2015; Massaro & Perlman, Reference Massaro and Perlman2017; Walker et al., Reference Walker, Bremner, Mason, Spring, Mattock, Slater and Johnson2010). In addition, iconicity may emerge from arbitrary word forms and environmental sounds through transmission and interaction between language users (Edmiston, Perlman, & Lupyan, Reference Edmiston, Perlman and Lupyan2018; Jones et al., Reference Jones, Vinson, Clostre, Zhu, Santiago and Vigliocco2014; Tamariz et al., Reference Tamariz, Roberts, Martínez and Santiago2018). As a result, iconicity seems to play a functionally scaffolding role in language learning, and the cultural evolution of language helps to explain the biases that cause people’s intuitive expectations about specific artificial language material such as bouba and kiki. However, these patterns generally seem to be much less consistent in natural languages (Nielsen & Rendall, 2012: 116–117), at least regarding whole-word iconic forms, which suggests that iconicity operates on a deeper, feature level rather than on a phoneme level. At the same time, linguistic evidence of sound symbolism is seldom sufficiently related to psychological research which could trace the phenomenon back to cognitive mechanisms (Dingemanse, Blasi, Lupyan, Christiansen, & Monaghan, Reference Dingemanse, Blasi, Lupyan, Christiansen and Monaghan2015, p. 611).
1.2. color as the interface between cross-modality and sound symbolism
The domain of color, which belongs to basic vocabulary, is estimated to have a relatively high frequency of use both currently and prehistorically (Haspelmath & Tadmor, Reference Haspelmath and Tadmor2009; Swadesh, Reference Swadesh and Sherzer1971). It is also perceptually salient and confirmed to be sound symbolically affected (Blasi et al., Reference Blasi, Wichmann, Hammarström, Stadler and Christiansen2016; Johansson et al., Reference Johansson, Anikin, Carling and Holmerin press; Wichmann et al., Reference Wichmann, Holman and Brown2010), which makes it a good candidate for bridging the gulf between cross-modal associations on a perceptual level and sound symbolism in natural languages. A considerable amount of psychological research has focused on color synesthesia – a type of cross-modal sensory integration in which stimuli in one sensory modality involuntarily and automatically cause experiences in another sensory modality (Ramachandran & Hubbard, Reference Ramachandran and Hubbard2001). For example, for some synesthetes, sequential concepts such as graphemes, days of the week, or numbers can appear to have specific colors. However, associating sounds with colors also seems to be widespread among non-synesthetes.
Color can be broken down into three main properties. Lightness or luminance is a measure of a color’s reflection of light, saturation corresponds to a color’s colorfulness, and hue corresponds to a color’s dominant reflected wavelengths, which in CIELAB color space can be further divided into the green-to-red a* axis and the blue-to-yellow b* axis. Cross-modally, several acoustic parameters have reliably been associated with visual luminance. Specifically, high auditory loudness and pitch have been shown to map onto luminance, and possibly also to saturation, using a range of methodological set-ups (Hubbard, Reference Hubbard1996; Marks, Reference Marks1974, Reference Marks1987; Mok, Li, Li, Ng, & Cheung, Reference Mok, Li, Li, Ng and Cheung2019; Mondloch & Maurer, Reference Mondloch and Maurer2004; Ward, Huckstep, & Tsakanikos, Reference Ward, Huckstep and Tsakanikos2006). High pitch has also been reported to be linked to specific hues such as yellow (Orlandatou, Reference Orlandatou, Cambouropoulos, Tsougras, Mavromatis and Pastiadis2012), although this could be explained by the fact that yellow is the brightest color (Hamilton-Fletcher, Witzel, Reby, & Ward, Reference Hamilton-Fletcher, Witzel, Reby and Ward2017). Likewise, both synesthetes and non-synesthetes have been reported to associate specific vowels and vowel formant ratios with specific hues (Kim, Nam, & Kim, Reference Kim, Nam and Kim2017; Marks, Reference Marks1975; Miyahara, Koda, Sekiguchi, & Amemiya, Reference Miyahara, Koda, Sekiguchi and Amemiya2012; Moos, Smith, Miller, & Simmons, Reference Moos, Smith, Miller and Simmons2014; Wrembel, Reference Wrembel2009). Arguably, many of these associations stem from a more fundamental tendency to match bright-sounding vowels like [i] with bright colors, and dark-sounding vowels like [u] with dark colors (Mok et al., Reference Mok, Li, Li, Ng and Cheung2019). However, Cuskley, Dingemanse, Kirby, & van Leeuwen (Reference Cuskley, Dingemanse, Kirby and van Leeuwen2019) found that, while acoustic features of vowels predict sound–color mappings in Dutch-speaking synesthetes and non-synesthetes, phoneme categories (Dutch monophthongs) and grapheme categories (orthographical representations of Dutch vowels) were even more consistently associated with particular colors. This could suggest that categorical perception can shape how cross-modal associations are structured.
To clarify which acoustic parameters are associated with which visual parameters, we performed a series of Implicit Associations Test experiments (Anikin & Johansson, Reference Anikin and Johansson2019) sampling colors from the CIELAB space to create contrasts on only a single visual dimension (luminance, saturation, or hue) and generating natural-sounding speech sounds with a formant synthesizer. The strongest perceptual associations were as follows: (1) high auditory salience (loudness, markedness) with high visual salience (contrast or saturation), and (2) high auditory frequency with visual lightness. In other words, color–sound associations appear to be dominated by quantitative (prothetic) cross-modal associations between sensory properties that vary along a single dimension with a natural low-to-high direction, such as loudness and luminance (Spence Reference Spence2011). In contrast, we found less evidence of qualitative (metathetic) associations between qualitatively different or dichotomous aspects of color and sound. In particular, no associations were found between acoustic characteristics and hue when luminance and saturation were held constant.
Translating these findings and other psychological evidence (reviewed in Anikin & Johansson, Reference Anikin and Johansson2019) into properties relevant for natural phonemes, we hypothesized that sound symbolism in color words would be manifested in the tendency for sonorant and high-frequency phonemes to be over-represented in the words for bright and saturated colors. Previous data on the occurrence of color sound symbolism in natural languages comes from a few large cross-linguistic studies. Despite the fact that these studies combined have investigated hundreds of lexical items in thousands of languages, color words have not been featured to any large extent. In an attempt to link the Eurasian language families genetically, Pagel, Atkinson, Calude, and Meade (Reference Pagel, Atkinson, Calude and Meade2013) investigated basic vocabulary and estimated their lexical replacement rate and sound similarity based on their frequency in everyday speech. They found that, among the investigated colors terms, words for black had similar phonetic forms across the featured families. Wichmann et al. (Reference Wichmann, Holman and Brown2010) also found that words for night were phonetically similar when comparing 40 basic vocabulary items in almost half of the world’s languages. More recently, by comparing the sound patterns of larger samples of basic vocabulary across the majority of the world’s language families, Blasi et al. (Reference Blasi, Wichmann, Hammarström, Stadler and Christiansen2016) found over-representations of rhotics in words for red.
Color words also show similarities with the sound symbolic class of words referred to as ideophones, i.e., language-specific words which evoke and describe sounds, shapes, actions, movements, and other perception concepts. Ideophones are rather scarce, at least in Indo-European languages, but having a least some words for colors is considered to be a linguistic universal (Berlin & Kay, Reference Berlin and Kay1969; Kay & Maffi, Reference Kay and Maffi1999). Interestingly, in Korean there does not seem to be a clear functional boundary between ideophones and colors since they follow the same set of sound symbolic rules as described by Rhee (Reference Rhee, Raffaelli, Katunar and Kerovec2019). Firstly, the visual dimensions of the Korean color words can be systematically manipulated by phonotactic processes and by changing phonological features. Furthermore, Korean color sound symbolism is highly productive since the processes can create new color-related words through derivation and coinage. This means that the five base color words, hayah- (하얗) ‘be white’, kkamah- (까맣) ‘be black’, ppalkah- (빨갛) ‘be red’, phalah- (파랗) ‘be grue’, and nolah- (노랗) ‘be yellow’, can be expanded to hundreds of color words through alterations between vowel harmony, consonant tensing, and morphological processes. Luminance can be altered by replacing a so-called positive/yang vowel with a negative/yin vowel. For example, ppalkah- (빨갛) means ‘be red’ but ppelkeh- (뻘겋) means ‘be dark red’. Likewise, saturation can be reduced by replacing a tensed consonant (spelled with a double consonant) with a de-tensed version such as in ppalkah- (빨갛) ‘be red’ and palkah- (발갛) ‘be reddish’. Reduplication or extension of a color word via suffixation does not change visual dimensions of colors as such but alter the distribution of the color over a surface. For example, the reduplicated from of pwulk- (붉) ‘be red’, pwulkuspwulkus (불긋불긋), changes meaning to ‘be reddish here and there’ or ‘spotty red’. These examples illustrate just how elaborately sound–color mappings can operate within a linguistic system. Not only are several visual parameters and overall coverage coded but, crucially, they are mapped separately through vowel quality, consonant tensing or morphological processes. Albeit less explicit than the Korean structures, Semai also utilizes modifiable templates for ideophones that relate to the sensory experiences of color, odor, and sound (Tufvesson, Reference Tufvesson2011). By changing the vowel of Semai color words their luminance level is altered, e.g., blʔik ‘gray’ vs. blʔak ‘black’. In addition, the replacement of a vowel can also change the meaning of color words to lighter–darker version of specific hues, e.g., blʔεk ‘rust-brown’ vs. blʔɨk ‘darker rust-brown’, and blʔuk ‘dark purple’ vs. blʔɔk ‘darker purple’. Furthermore, Westermann (Reference Westermann and Boas1927) showed that several West African languages also display contrasts between ‘light’ and ‘dark’, by altering vowels (unrounded front vs. rounded back) and tone (high vs. low). A similar tonal distinction between ‘black’, ‘green’, and ‘blue’ (high tone) vs. ‘red’, ‘yellow’, and ‘brown’ (low tone) is also found in Bini (Wescott, Reference Wescott1975).
Based on these cross-linguistic and language-internal findings, degrees of lightness and saturation do not only produce cross-modal associations in experimental set-ups but may also be sound symbolically charged in natural languages. It is also possible that specific hues, such as red and green, produce independent sound symbolic associations. The findings from Korean also suggest that color sound symbolism might be carried by both vowels and consonants, although vowels seem to be primarily tied to luminance and consonants to saturation. It is less clear, however, whether particular phonemes or vowel formants and dimensions such as spectral energy and manner and place of articulation of consonants are driving these effects. Based on the observed cross-modal correspondences of color luminance and saturation with acoustic loudness and frequency (Anikin & Johansson, Reference Anikin and Johansson2019), we hypothesized that sound symbolism in color words would be manifested in a tendency to find sonorous and bright phonemes in the words for bright and saturated colors. To test this hypothesis, we obtained color words from a large sample of unrelated languages, which represented a large portion of the world’s language families (Johansson et al., Reference Johansson, Anikin, Carling and Holmerin press), and analyzed the sonority and brightness of phonemes in these words. We obtained sonority ranks from an earlier study (Parker, Reference Parker2002) and investigated the acoustic correlates of perceived phonemic brightness in a pilot study. Having these measures of the perceived sonority and brightness of individual phonemes, we then proceeded to test whether these acoustic properties varied systematically in the words for different colors as a function of their luminance and saturation.
2. Method
2.1. perceived brightness and loudness of phonemes
The acoustic properties that seem to have the greatest effect in sound–color correspondences are loudness and frequency (Anikin & Johansson, Reference Anikin and Johansson2019). However, while loudness is often used pragmatically throughout languages, it is not used phonemically, i.e., there are no minimal pairs which are distinguished only by their level of loudness. Thus, we needed to find a suitable proxy for loudness which is also generally utilized by most languages.
Sonority, or perceived loudness, is among the most salient properties of phonemes cross-linguistically. One way of estimating subjective loudness is provided by the relative sonority ranks of different phonemes. Physically, sonority relates to sound intensity, which in turn depends on obstruction in the vocal tract. For example, the open vowel [a] is among the most sonorous sounds since it creates the least obstruction for the air to pass through the vocal tract. Stops, on the other hand, produce a great amount of obstruction and are thus found at the bottom of the sonority hierarchy. Phonologically, the sonority hierarchically determines the syllable structure in languages: the most sonorous sounds are placed in the nucleus and the less sonorous sounds at the end of the syllables. There are various suggestions for relative sonority ranks, but Parker (Reference Parker2002) provides one of the most thoroughly investigated classifications. Parker’s sonority hierarchy is based on universal sonority patterns, language-specific effects, and acoustic, aerodynamic, and psycholinguistic factors. By measuring several acoustic and aerodynamic correlates of sonority in English and Spanish, Parker found a strong correlation between intensity and sonority indices which confirmed the physical reality of the sonority hierarchy. He then performed a psycholinguistic experiment which involved hundreds of native speakers evaluating 99 constructed rhyming pairs, e.g., roshy–toshy. The results showed that pairs which obeyed the sonority hierarchy were generally preferred by the participants and thus, despite minor phonological variations, confirmed the importance of sonority in language processing. The 16 sonority levels can be treated as equidistant since more precise indices are too variable for practical use (Figure 1).
Adapted version of Parker’s (Reference Parker2002) sonority hierarchy.
Similarly to perceived loudness, we were also interested in testing the hypothesis that words for more luminant colors would contain phonemes that are perceived to be relatively ‘brighter’ since luminance and brightness have been shown to have a number of cross-modal correspondences (Ludwig & Simner, Reference Ludwig and Simner2013; Walker, Reference Walker2012; Walker et al., Reference Walker, Bremner, Mason, Spring, Mattock, Slater and Johnson2010). However, this task faces a methodological difficulty: it is not obvious which acoustic measure could serve as a proxy for the perceived ‘brightness’. A related concept in psycho-acoustics is ‘sharpness’, which is calculated as a weighted centroid of the cochleogram – that is, the spectrogram transformed into physiologically appropriate frequency and amplitude scales – followed by one of several empirically derived adjustments (Fastl & Zwicker, Reference Fastl and Zwicker2006). There is also some evidence that the ordinary, unadjusted spectral centroid is a reasonable predictor of the perceived brightness of the timber of musical instruments (Schubert, Wolfe, & Tarnopolsky, Reference Schubert, Wolfe, Tarnopolsky, Lipscomb, Ashley, Gjerdingen and Webster2004), but it is not clear whether this is also the case for phonemes, including both vowels and consonants. While most measures of spectral central tendency are positively correlated, they are not identical, and the choice of one or the other may have a major effect on how phonemes will be ranked by relative brightness. Given this uncertainty about the most appropriate spectral descriptors that would capture the perceived brightness of individual phonemes, we performed a separate pilot study to check which acoustic features would best predict human ratings of brightness. Recordings of isolated phonemes – vowels, synthetic vowels, and consonants – were rated on brightness in three small experiments, after which the audio files were analyzed acoustically, and various spectral measures were correlated with the empirically obtained brightness ratings.
2.1.1. Pilot: materials and methods
We obtained audio recordings of 99 IPA phonemes from Seeing Speech (Lawson et al., Reference Lawson, Stuart-Smith, Scobbie, Nakai, Beavan, Edmonds, Edmonds, Turk, Timmins, Beck, Esling, Leplatre, Cowen, Barras and Durham2015), a database which provides accurate recordings of a range of IPA symbols by an adult female speaker along with the movements of vocal organs visualized through ultrasound, Magnetic Resonance Imaging, and animation. The recordings were truncated to individual phonemes (e.g., by removing the extra vowels after plosives), normalized for peak amplitude in Audacity (https://www.audacityteam.org/), and analyzed acoustically. In particular, several measures of spectral shape were calculated on a linear or Mel-transformed scale: spectral centroid, or the spectral center of gravity; spectral median, or the 50th percentile of spectral energy distribution; and peak frequency, or the frequency of maximum power. For vowels, formants F1–F6 were estimated manually from a spectrogram.
Three samples of 19–22 phonemes were then rated on brightness in three perceptual tests: (1) 22 vowels; (2) 22 synthetic versions of the same vowels, which were created with the formant synthesizer soundgen (Anikin, Reference Anikin2019) using frequencies of formants F1–F6 manually measured in the original recordings, and standard values of other acoustic parameters, to remove unwanted accidental variation in the voice quality of recorded vowels (duration, intonation contour, amplitude envelope, the strength of harmonics, etc.); and (3) 19 consonants chosen as representative of the overall variety of consonants in the IPA system. Participants were shown badges with IPA symbols in a scrambled order and had to arrange them along a horizontal Visual Analogue Scale (VAS). The instructions were to arrange the sounds “from ‘low’ to ‘high’ – darkest-sounding on the left, brightest-sounding on the right”. The sounds could be heard repeatedly by clicking the badges, which were dragged and dropped onto the scale and could be rearranged until the participant was satisfied. The experiment was written in HTML/JavaScript and could be performed in any modern web browser. Participants were predominantly native speakers of Swedish recruited via personal contacts; most completed all three tasks. Each experiment resulted in relative brightness ratings of the tested phonemes. These ratings were normalized to range from 0 to 100 for each participant, and then the average brightness of each phoneme was calculated as the median value across all participants. In a few cases individual brightness ratings correlated poorly with the median values (Pearson’s r < .2), resulting in the exclusion of four out of 37 submissions and leaving 11 submissions for vowels, 11 for synthetic vowels, and 12 for consonants.
2.1.2. Pilot: results
There was moderate agreement between raters about the relative brightness of phonemes: intra-class correlation coefficient (ICC) was .55 for vowels, .66 for synthetic vowels, and .41 for consonants. Most common measures summarizing the shape of spectrum positively correlated with median brightness ratings (Table 1), but the highest overall correlation across all three groups of phonemes was achieved by the spectral centroid calculated on a linear frequency scale: r = .76 for vowels, .90 for synthetic vowels, and .92 for consonants (Figure 2). Converting the spectrum to a physiologically more appropriate Mel frequency scale did not noticeably improve the correlation with brightness. Spectral medians performed considerably worse than spectral centroids. Interestingly, peak frequency was associated with perceived brightness in consonants, but not in vowels, presumably because in voiced sounds peak frequency traced the fundamental or one of the lower harmonics to the exclusion of the perceptually relevant higher parts of the spectrum.
Pearson’s correlation of median brightness ratings with various measures of spectral shape and sonority, from highest to lowest
notes: * All acoustic predictors except sonority were log-transformed prior to correlating them with brightness ratings. Spectral centroid refers to the center of gravity of spectrum, while spectral median refers to the 50th percentile of the distribution of spectral energy. Formants were measured manually; all other descriptors were extracted with the soundgen R package (Anikin, Reference Anikin2019) per frame and summarized by their median value over the entire sound; ** the mean of three correlations: for vowels, synthetic vowels, and consonants.
Perceived brightness of isolated vowels (A), synthetic vowels (B), and consonants (C) as a function of their spectral centroid. Medians of the observed ratings are plotted as IPA symbols. The solid line and shaded area show fitted values from beta-regression with 95% CI.
Considering that vowels are distinguished above all by the frequencies of the first two formants, it was important to check the effect of formant frequencies on perceived brightness. Formants F1–F4, and particularly F2–F3, strongly correlated with brightness ratings of both real and synthetic vowels (Table 1). F1–F3, but not F4, were also positive predictors of the perceived brightness of vowels in multiple regression (Figure 3), suggesting that each of the first few formants makes an independent contribution towards making the sound ‘bright’. As a result, both open vowels (high F1) and front vowels (high F2) were on average rated as brighter than closed and back vowels (Figure 3A, 3B). Interestingly, although F3 varied within a narrower range than F1 and F2, it had a disproportionately large effect on perceived brightness, probably because F3 is located in the range of frequencies to which humans are particularly sensitive (for this speaker, F3 varied from 2.5 to 4 kHz).
The observed brightness ratings from highest (marked with yellow) to lowest (marked with blue) of real (A) and synthetic (B) vowels in F1–F2 space and the predicted effect of varying the frequency of one formant on the perceived brightness of real (C) and synthetic (D) vowels while keeping other formants constant at their average values. Fitted values from a beta regression model and 95% CI.
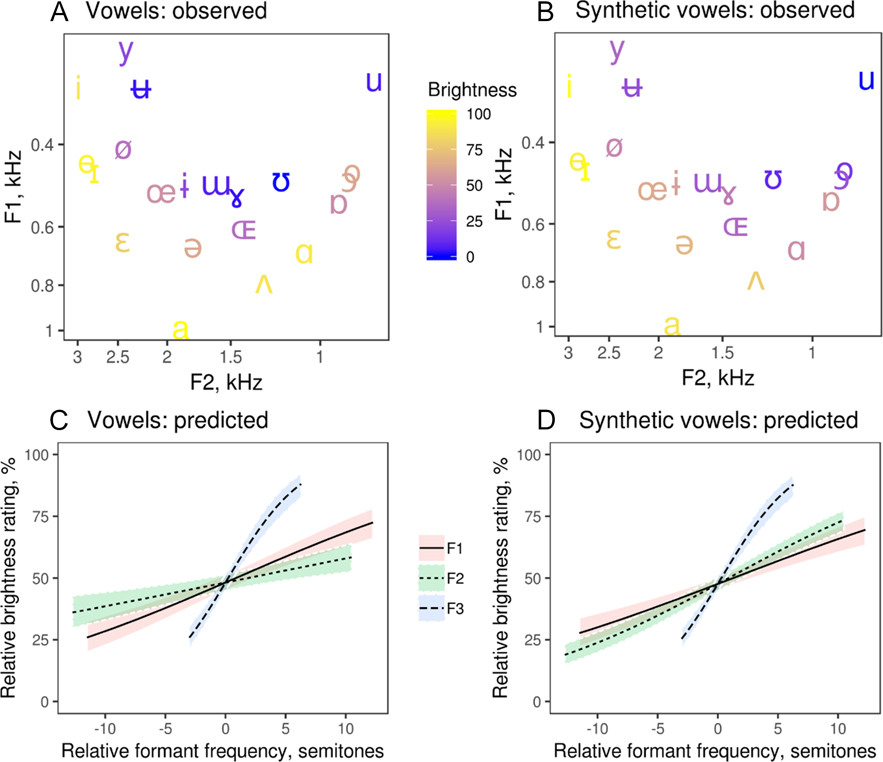
An even stronger association between formants and brightness was observed for synthetic vowels (Table 1, Figure 3), which differed only in formant frequencies and were free from other phonetic confounds such as variation in amplitude envelope, pitch, and vocal effort. An upward shift in formants, with no other changes in pitch or voice quality, is thus sufficient to make a vowel sound brighter. Higher formants (F4–F6) did not contribute much to perceived brightness, presumably because harmonics above F3 were relatively weak. For sounds produced at higher intensity, there would be more energy in high frequencies, possibly making formants above F3 more salient and giving them a greater role in determining the perceived brightness. But in any case, spectral centroid appears to be a more robust measure than the frequencies of individual formants, and it is equally applicable to both vowel and consonant sounds.
To summarize, the pilot study demonstrated that perceived brightness is, for vowels, dependent on upward shifts of the first three vowel formants, and that spectral centroid seems to be the best proxy of perceived brightness that can be used for both vowels and consonants. Consequently, we predicted that perceived sonority and brightness (operationalized as the actual ratings from the pilot study or acoustic proxies like spectral centroid) of phonemes in color names would correlate with color luminance, and possibly also with saturation. Furthermore, we also wanted to know if these effects were tied specifically to vowels or consonants or both.
2.2. data sources
The language data in text form was gathered from the corpus compiled by Johansson et al. (Reference Johansson, Anikin, Carling and Holmerin press) for a cross-linguistic examination of 344 basic vocabulary items in 245 language families. Description concepts, including color words, constituted a large proportion of the items and appeared to be among the domains most affected by sound symbolism. Studies on the semantic typology of color words have generally only considered mono-lexemic words, as in Berlin and Kay’s (Reference Berlin and Kay1969) famous study. However, since many mono-lexemic terms can be traced back to natural referents, e.g., green from ‘to grow’ or ‘leaf’, the color concepts selection was based on color opponency and included red–green, yellow–blue and black–white, as well as the combination of the most basic colors, gray. These concepts were also used for the present study, along with four other oppositional concepts that are semantically related to light, namely night–day and dark–light.
The language sampling for the investigated concepts was very restrictive. Firstly, the language family database Glottolog (Hammarström, Forkel, & Haspelmath, Reference Hammarström, Forkel and Haspelmath2017) was used due to its cautious approach to grouping languages into families. Secondly, only a single language per language family was selected in order to exclude any possible genetic bias. The sample included approximately 58.5% of the world’s documented living and extinct language families without considering artificial, sign, unattested, and unclassifiable languages, as well as creoles, mixed languages, pidgins, and speech registers. The data was collected from various sources, such as databases, dictionaries, grammar descriptions, and grammar sketches. Since several language families consist only of poorly documented languages, the collection process was also influenced by data availability. Detected loans from culturally influential languages, such as Arabic, English, French, Malay, Mandarin Chinese, Portuguese, and Spanish, were removed, but using such a large dataset from a large number of typologically distinct languages also tends to impose issues with semantic boundaries. However, among all the extracted color words, there were only seven cases with alternative or dialectal forms, which mostly only involved small vowel differences, and therefore the form first cited in the source was selected for the present study.
The gathered data was transcribed into the International Phonetic Alphabet (IPA) with some differences. Oral and nasal vowels, pulmonic, co-articulated, and non-pulmonic consonants, as well as nasalized consonants, breathy (murmured) vowels, and creaky voiced sounds were coded as separate phonemes. This also applied to plain, voiced, nasalized, and voiceless nasalized clicks. Diphthongs, triphthongs, and affricates were divided into their components and counted as separate phonemes, e.g., [ ] resulted in [t] and [s]. Likewise, consonantal release types, aspiration, and co-articulations were also split and followed their respective place of articulation. Tones and stress were not recorded, but phonetic length was coded as a double occurrence of the same phoneme, e.g. [a:] resulted in [aa]. For more details on the collection and coding of textual data, refer to Johansson et al. (Reference Johansson, Anikin, Carling and Holmerin press).
In order to make the data in text form comparable with acoustic measurements, such as spectral centroid and sonority, we utilized the same recordings of individual phonemes as in the pilot study, namely Seeing Speech (Lawson et al., Reference Lawson, Stuart-Smith, Scobbie, Nakai, Beavan, Edmonds, Edmonds, Turk, Timmins, Beck, Esling, Leplatre, Cowen, Barras and Durham2015). As recordings of all possible speech sounds with all possible articulation types were not available, several sounds were grouped with their phonetically closest recorded proxy. This did not, however, have any large effects on the data as a whole since the available recordings covered the most typologically common and frequently occurring phonemes. Nasal, breathy, and creaky phonemes were assigned to their plain counterparts. True mid vowels [e̞, o̞] were replaced with open-mid vowels [ɛ, ɔ], near-close [ɪ̈, ʊ̈, ʏ] except [ɪ] with close vowels [ɨ, ʉ, y], most central vowels with [ə], [æ, ä, ɐ] with [a], and [ɒ̈, ɞ̞] with [ɶ]. Lacking dentals, labiodentals, and palato-alveolars were assigned to alveolars, linguolabials to labials, uvulars to velars, pharyngeal trills to uvular trills, and pharyngeal plosives to glottal plosives. Lacking approximants were assigned to the corresponding fricatives, ejectives to their closest plain analogue, and missing taps/flaps were replaced with corresponding trills. Voiceless versions of nasal, laterals, clicks, and vibrants were replaced with voiced analogs. Recordings of the speech sounds in isolation were used, and in the few cases when this was not available (plosives [p, b, t, d, ʈ, ɖ, c, ɟ, k, g, q, ɢ, ʔ], taps/flaps [ⱱ, ɾ, ɽ], and implosives [ɓ, ɗ, ʄ, ɠ, ʛ]), recordings of the sounds in medial position between two neutral vowels (to prevent labialization, palatalization, velarization, pharyngealization, etc.) were used instead, with vowel segments deleted. Audio files and other supplementary materials can be downloaded from <https://osf.io/cu3bk/download>.
2.3. analysis
When analyzing the frequency of phonemes in different color words as a function of their spectral characteristics, it is preferable to treat vowels and consonants separately. Vowel quality is primarily determined by the frequency of the first two or three formants, which is not a meaningful acoustic feature for many consonants. Furthermore, based on the accounts of sound–color associations in Korean ideophones, it is plausible to assume that vowels and consonants could produce different sound symbolic mappings and strength of effects. In addition, vowels generally have less high-frequency energy than most consonants, particularly voiceless consonants like sibilants or clicks. [≠] While acoustically the most effective way to achieve a ‘dark’ sound would be to dispense with consonants altogether, words like ouou are seldom phonotactically tolerated because lexemes are phonotactically constrained to contain a mixture of vowels and consonants in most natural languages. We therefore analyzed the relation between color properties and the spectral characteristics of phonemes within the words for these colors separately for vowels and consonants. In both cases the models we built attempted to predict the brightness ratings (as obtained in the pilot study) or acoustic characteristics of a phoneme based on a particular feature of color (luminance or saturation) designated by the word in which this phoneme occurred.
The acoustic analysis of the IPA recordings is described in the pilot study. Luminance and saturation of the color words were calculated based on previously published CIELAB coordinates of collected cross-linguistic color-naming data from multiple speakers of 110 languages in the World Color Survey (Regier, Kay, & Cook, Reference Regier, Kay and Cook2005). The speakers selected the chip(s) that represented the best example of each color in their respective language from an array of 330 color chips. The best-example choices for each color were then pooled to form cross-linguistic focal-color coordinates. In other words, because the World Color Survey did not include most of the languages in our sample, we made a crucial simplifying assumption that the CIELAB coordinates (and therefore also luminance and saturation) of the 11 sampled colors were roughly the same in all languages. We arbitrarily assigned a luminance of 25 to the words dark and night and 75 to the words light and day. Saturation was calculated as the distance from the achromatic central axis in CIELAB color space. The concept of saturation is arguably not applicable to the words dark, night, day, and light, so we dropped them from all analyses involving saturation.
We did not consider possible effects of hue as such for the following reasons: (1) its contribution would be impossible to distinguish from that of luminance and saturation with only four chromatic colors (red, blue, yellow, and green), and (2) psychological research on cross-modal associations between color and sound has produced much stronger evidence for cross-modal associations between sound and luminance or saturation than between sound and hue. Instead, to account for possible idiosyncratic sound symbolic patterns for each individual color, we analyzed its residual from the regression line. For a summary of the color concepts’ visual parameter values, see Table 2.
The eleven investigated color concepts
notes: 1 World Color Survey chip corresponding to focal color (Regier et al., Reference Regier, Kay and Cook2005); 2 saturation was calculated as Euclidean distance from the achromatic central spindle of the CIELAB space: √(a2 + b2).
Statistical analyses were performed on the unaggregated dataset using Bayesian mixed models, in which the unit of analysis was a single phoneme from the word for a particular color in one of the sampled languages. The task was to predict the acoustic characteristics of each phoneme (e.g., its sonority or formant frequencies) from the luminance or saturation of the color. Model selection with information criteria indicated that predictive power improved after including a random intercept per color and a random slope of the visual predictor (luminance or saturation) per language. In other words, for each acoustic characteristic, we estimated the trend driven by a visual predictor like luminance, while allowing individual colors to be associated with various acoustic properties and allowing the effect of the visual predictor to be language-specific. The random intercept per color provided an inferential measure of how much each color deviated from the main pattern (its ‘residual’). All frequency measures (formant frequencies, spectral centroid) were log-transformed prior to modeling. Mixed models were fit in the Stan computational framework (http://mc-stan.org/) accessed from R using the brms package (Bürkner, Reference Bürkner2017).[≠Refs] We specified mildly informative regularizing priors on regression coefficients so as to reduce overfitting and improve convergence.
3. Results
3.1. vowels
We discovered a significant association between the luminance of a color and the sonority of vowels in the word for this color (Figure 4A). The average sonority of vowels was predicted to be 0.4 points (95% CI [0.2, 0.6]) higher on a scale of 12 to 16 in words for white (luminance = 100) than in words for black (luminance = 0). Luminance also predicted the subjective brightness of vowels in a color’s name (Figure 4B): the average brightness rating of vowels in words for white was predicted to be 12% (95% CI [4, 20]) higher than in words for black. The association between spectral centroid and luminance was not statistically significant, but it was in the predicted direction (83 Hz, 95% CI [–34, 199]). In addition, luminance predicted an increase in the frequency of F1, but not F2 or F3 (Figure 4D, 4E, 4F). It is worth pointing out that all these vowel characteristics tend to be positively correlated. For example, according to the acoustic analysis of IPA recordings in the pilot study, F1 correlates with both vowel sonority (r = .41) and vowel brightness (r = .47), and sonority is also positively associated with brightness (r = .37). In other words, the large picture is that there is a tendency for both bright and sonorous vowels (which are largely the same) to occur in the words for light colors, while dark and less sonorous vowels are more common in the words for darker colors.
Vowels: univariate associations between acoustic characteristics of vowels found in different color words and the luminance of the designated color. Brightness ratings are taken from the pilot study (recorded rather than synthetic vowels). The line and shaded area show fitted values from linear mixed models as the median of posterior distribution and 95% CI. Text labels mark the means of observed values. The deltas show the predicted difference between white (L = 100) and black (L = 0).
In order to ascertain that the observed association between color luminance and the ‘brightness’ of phonemes in the corresponding words is not caused by another color characteristic, it would be desirable to perform multiple regression controlling for saturation and hue. Unfortunately, this is not possible with only a few color words. Looking at univariate effects of saturation, we failed to detect any association with measures of vowel sonority or brightness (Figure 5). On the other hand, a few outliers in Figure 4 hint that other processes might be involved. For sonority and luminance (Figure 4A), all colors lie close to the regression line except dark with a lower-than-expected sonority of vowels for its luminance. More formally, the 95% CI for the random intercept overlaps with zero for all colors except dark, for which the sonority of vowels was slightly lower (–0.1 [–0.21, –0.01]) than expected for its luminance. On the other hand, the luminance of dark was arbitrarily set to 25, so this result should not be over-interpreted. More tellingly, the brightness ratings, spectral centroid, and F2 of vowels were all unexpectedly high in green and low in gray (random intercepts exclude or nearly exclude zero; details not shown). red also had vowels with marginally higher-than-expected brightness and spectral centroid and a significantly elevated F2. Some other aspects of these colors, apart from their luminance and saturation, may thus be affecting the brightness of vowels in their names. Overall, however, luminance remains the most relevant color property that is mapped onto the acoustic characteristics of vowels.
Vowels: univariate associations between acoustic characteristics of vowels found in different color words and the saturation of the designated color. See Figure 4 for detailed explanations.
3.2. consonants
Moving on to consonants, we could not analyze the association between luminance and formants or subjective brightness because (1) formants are not meaningful for many of the consonants and (2) in the pilot study we only obtained ratings of subjective brightness for a subset of 19 out of 78 consonants. The analysis in consonants was therefore limited to the sonority and spectral centroid. We found no relation between the spectral centroid of consonants and color luminance (Figure 6B) or saturation (Figure 6D), suggesting that the ‘brightness’ of consonants in color words does not depend on the perceptual characteristics of the designated color. In contrast, there was some evidence that sonorous consonants were over-represented in words for both luminant and saturated colors. For luminance, there was a marginal positive effect: the sonority of consonants was predicted to be 0.43 (95% CI [–0.07, 0.93]) higher in white vs. black (Figure 6A). For saturation, the positive effect of sonority was slightly stronger: 0.51, 95% CI [0.02, 0.84] (Figure 6C). In both cases, the effect size was comparable to that found in vowels (Figure 4A), corresponding to a difference of about 0.5 points in sonority rank.
Consonants: univariate associations of acoustic characteristics of consonants with the luminance and saturation of the designated color. See Figure 4 for detailed explanations.
To summarize, the evidence for consonants was less consistent than for vowels. We found no indication that the distribution of spectral energy in consonants in color words was aligned with visual characteristics of the designated color. However, there appears to be a tendency for sonorous consonants to appear more often in words for more luminant and saturated colors.
4. General discussion
We investigated associations between sound and color in color words from 245 areally spread language families by testing specific predictions regarding phoneme distributions based on experimental evidence from psychological research on sound–color cross-modal correspondences. In particular, we looked at two visual parameters, luminance and saturation, which were derived from typological data of color coordinates, and a series of acoustic parameters: the sonority and spectral centroid of vowels and consonants, the perceived brightness of vowels, and the first three vowel formants. We first confirmed that spectral centroid can be used as a convenient proxy for perceived brightness of both vowels and consonants when direct brightness ratings are not available. As expected, based on previous descriptions of sound symbolism and experimental evidence, the main analysis then demonstrated that brighter and more sonorous vowels, as well as vowels with high F1, are more common in the words for more luminant colors (cf. Parise & Pavani, Reference Parise and Pavani2011). More sonorous consonants, on the other hand, are common in the words for colors with high saturation, and possibly high luminance as well.
Among the investigated acoustic and visual dimensions, the strongest and most consistent associations were found between acoustic characteristics of vowels and color luminance. The sound symbolic strength of vowels could be explained by the fact that different vowels are more gradient than consonants. All that is needed to change the acoustic signal of a vowel is to modify the tongue’s height or backness. Lip-rounding also plays a part, but it is generally confined to back vowels. While the place of articulation of consonants is somewhat comparable to how vowels are produced, their manner of articulation is qualitatively different since it involves both active and passive articulators, which allows for greater variance in speech sound quality. Consequently, it could be easier to map continuous or gradient dimensions, such as color luminance or saturation, to vowels than to consonants (Tufvesson, Reference Tufvesson2011). It is still possible to create similar mappings using consonants, but it might be less obvious how to arrange the distinct combinations of features that result from both place and manner of articulation.
4.1. sound symbolism as a basis for lexicalization patterns
The results also revealed similarities with lexicalization patterns (the process of adding lexemes to the lexicon) of color words globally. The study of typological color word semantics has its origins in Berlin and Kay (Reference Berlin and Kay1969), who proposed that, cross-linguistically, color words are added in a particular order: black and white > red > green and yellow > blue > brown > purple, pink, orange, and gray. Kay and Maffi (Reference Kay and Maffi1999) developed and nuanced the hierarchy by investigating six basic colors (red, green, yellow, blue, white, black) in 110 unwritten languages of non-industrialized societies in order to approximate the use of colors throughout human history. They showed that all languages seem to make at least one color distinction that cuts right through the three CIELAB color space parameters by separating light/warm colors (white, yellow, red) from dark/cool colors (black, blue, green). Languages that distinguish between at least three color words also seemed to keep the dark/cool colors coded as a single color word, but separate the light color white from the warm colors, yellow and red.
The results of the present paper showed that luminance produced the strongest sound symbolic results, and it is also the most fundamental parameter for distinguishing colors based on lexicalization patterns. The second split (white from red and yellow) separates the most luminant color from the warm colors, which can also be perceived as the most saturated colors (Witzel & Franklin, Reference Witzel and Franklin2014). Although uncertain, we did find a tendency for vowels and consonants to have different sound symbolic functions, which also seems to correlate with Korean color sound symbolism, in which color luminance can be manipulated by changing vowel height, which correlates with F1, and saturation by changing consonant tensing (Rhee, Reference Rhee, Raffaelli, Katunar and Kerovec2019). If this possible relationship holds, it suggests that primary acoustic and articulatory affordances provide an efficient vehicle for communicating perceptual contrasts and could therefore influence lexicalization processes.
A common pattern found across languages is that color words that are lexicalized late are derived from referents that are located in the surrounding world. In many languages, the word meaning ‘orange’ is derived from the fruit Citrus sinensis, the word meaning ‘pink’ is derived from roses, salmon, or peaches, and the word meaning ‘gray’ is often derived from the word for ashes. Likewise, it is quite possible that monolexemic color terms are historically derived from concrete referents as well, but the etymological distance could be too great or the historical development of a language too poorly understood to link the referents to the color word. For example, many basic color words in Indo-European (perhaps the most historically well-documented language family in the world) and several other language families can be traced back to concrete referents, such as the meaning ‘red’ from rust or worms and the meaning ‘green’ from plants (Derksen, Reference Derksen2008, Reference Derksen2010; Kroonen, Reference Kroonen2010; Matisoff, Reference Matisoff2011; Metsmägi, Sedrik, & Soosaar, Reference Metsmägi, Sedrik and Soosaar2012). Thus, color terms generally regarded as monolexemic can still carry phonetic similarities to their original referents.
Interestingly, our findings showed that the color gray seemed to behave somewhat differently from other colors of comparable luminance as it contained vowels with rather low spectral centroid, F2 and F3. These features are typical for close back rounded vowels, such as [u], and might also be sound symbolically motivated. Similarly, ashes has been confirmed to be rather strongly sound symbolic (Blasi et al., Reference Blasi, Wichmann, Hammarström, Stadler and Christiansen2016; Johansson et al., Reference Johansson, Anikin, Carling and Holmerin press). Ashes, along with other concepts that relate to air and airflow, such as blow, breathe, wing, etc., tend to contain rounded vowels (which are generally back vowels) and voiceless labial and fricative consonants. The most plausible explanation for these associations is that sounds that involve air leaving the body, which is further intensified by the extra friction created by lip rounding, onomatopoeically evoke a general meaning of air moving or something moving through air. This means that, cross-linguistically, gray rests on a sound symbolic foundation as well, but not on the same foundation as the six basic colors, making it an apparent outlier in terms of color sound symbolism.
We also found that green had phonemes with more high-frequency energy than expected for a color of this luminance. A possible reason is that these words are, just like gray, also derived from a natural referent iconically associated with high-frequency energy. However, as opposed to gray, previous cross-linguistic studies have not found any good candidates for such an association. Nevertheless, since words meaning ‘green’ are often derived from words relating to ‘growth’ and ‘movement’, it is possible that this also gives this color an ‘energetic’ connotation. If so, it could easily be mapped to high energy sounds similar to the cross-modal effects found for green when in contrast with red or darker colors (Cuskley et al., Reference Cuskley, Dingemanse, Kirby and van Leeuwen2019; Kim et al., Reference Kim, Nam and Kim2017; Marks, Reference Marks1975; Miyahara et al., Reference Miyahara, Koda, Sekiguchi and Amemiya2012; Moos et al., Reference Moos, Smith, Miller and Simmons2014; Wrembel, Reference Wrembel2009). Alternatively, hue as such – that is, red–green and yellow–blue oppositions as distinct from the effects of luminance and saturation – could be contributing to sound symbolism in color words. Unfortunately, we could not test this intriguing possibility directly in the present study since the effects of luminance, saturation, and hue could not be separated based on only four chromatic colors.
Another important limitation of the present study is the assumed universality of focal colors (Regier et al., Reference Regier, Kay and Cook2005): for example, we assumed that green has the same CIELAB coordinates in all sampled languages, whereas in fact it represents somewhat different foci and regions of the color space in different languages. A more stringent analysis can become possible in future, when color concepts have been mapped in a sufficient number of minimally related languages. As another direction for future research, the names of less fundamental colors, such as brown, orange, pink, and purple, could potentially also be affected by sound symbolism and can therefore also be investigated, providing a more nuanced picture and helping to disambiguate sound symbolic effects of luminance, saturation, and hue.
A potential limitation of analyzing additional colors is that their names are generally derived from natural referents in the surrounding world, diluting sound symbolic effects of color per se, as we saw in this study with gray. Going beyond color words, auditory frequency has been mapped onto several modalities (Walker, Reference Walker2012; Westermann, Reference Westermann and Boas1927); for example, higher pitch is associated with both brightness and angular shapes, while lower pitch is associated with darkness and smoother shapes (Walker et al, Reference Walker, Walker and Francis2012). Because of this, just as luminance and saturation affect phoneme sonority and brightness in color words, similar sound symbolic effects could potentially be discovered in a range of semantically related fundamental descriptive concepts which denote shape, size, weight, height, density, etc.
4.2. the origins of sound–color associations
Aside from lexicalization patterns, there is strong evidence that associations between luminance and phonetic dimensions, such as pitch, are among the most fundamental types of cross-modal mappings. Various types of experiments have shown that both synesthetic and non-synesthetic people (Moos et al., Reference Moos, Smith, Miller and Simmons2014; Ward et al., Reference Ward, Huckstep and Tsakanikos2006), toddlers (Mondloch & Maurer, Reference Mondloch and Maurer2004), and chimpanzees (Ludwig, Adachi, & Matsuzawa, Reference Ludwig, Adachi and Matsuzawa2011) map white/bright to high-pitched sounds and black/dark to low-pitched sounds. This suggests that these cross-modal correspondences are present early in human ontogenesis and must have evolved before the human and our closest living relatives’ lineages split apart. Furthermore, Bankieris and Simner (Reference Bankieris and Simner2015) argue that synesthesia and cross-modal correspondences are qualitatively the same phenomenon and link them to the origin of sound symbolism. This linkage, along with other possible underlying mechanisms of sound symbolism, is discussed in detail by Sidhu and Pexman (Reference Sidhu and Pexman2018).
Although the sound symbolic effects related to saturation were more uncertain than those for luminance, the perceptual saliency of saturation makes it likely that these sound symbolic effects are credible. Evidence from prelinguistic infants suggests that color categorization is not purely shaped by communication and culture, but also by underlying biological mechanisms (Skelton, Catchpole, Abbott, Bosten, & Franklin, Reference Skelton, Catchpole, Abbott, Bosten and Franklin2017). Furthermore, one of the primary color distinctions found in infants aged three months or younger is a distinction between long wavelength colors and short wavelength colors (Adams, Reference Adams1987), which, in turn, correspond to colors that are perceived as more saturated, such as red and yellow, and less saturated, such as green and blue (Witzel & Franklin, Reference Witzel and Franklin2014). Likewise, evidence from spatial clustering of neurons in the macaque primary visual cortex indicates that contrasts between the L and M cone cell type could form a biological foundation for this distinction between high and low saturation (Xiao, Kavanau, Bertin, & Kaplan, Reference Xiao, Kavanau, Bertin and Kaplan2011). Furthermore, Sugita (Reference Sugita2004) showed that exposing infant female Japanese macaques to only monochromatic lighting for one month impoverished their ability to distinguish colors compared to monkeys who had had access to the full spectrum of colors.
Both luminant and saturated colors seem to play particularly important roles in color perception as well as in the surrounding lifeworld which we experience and interact with (Gibson, Reference Gibson, Shaw and Bransford1977), since they contrast sharply with the green–brown backdrop that nature generally provides. For example, the yellow-to-red colors of ripe fruits attract fruit-eating animals which, in exchange for food, distribute the plants’ seeds, and insects use bright colors or patterns to prevent predators from eating them (Valenta et al., Reference Valenta, Kalbitzer, Razafimandimby, Omeja, Ayasse, Chapman and Nevo2018). These marked colors also translate into cultural color associations, such as the connection between red and blood, life, death, danger, excitement, etc., which means that, conceptually, color is one of the most salient descriptive features available for humans. Unsurprisingly, dimensions of color are not only distinguished in language, but the most central dimensions seem to follow the same pattern of lexicalization. In contrast to most of our sensory perception, language has to be learned, and important distinctions between features of objects have to be acquired quickly and easily. In color words, sound–color mappings offer a bridge between language and sensory experiences, which enables language users to efficiently organize sensory features (Tufvesson, Reference Tufvesson2011).
Consequently, luminance and saturation serve as stepping-stones for carving up the gradient color spectrum into a number of manageable segments. These can then be used for description and tend to be iconically named as a result of increased learnability. Indeed, several studies have shown that iconicity makes words easier to learn (Imai & Kita, Reference Imai and Kita2014; Massaro & Perlman, Reference Massaro and Perlman2017; Nygaard, Cook, & Namy, Reference Newman2009) and has a number of functional and communicative benefits (Tamariz, Roberts, Martínez, & Santiago, Reference Tamariz, Roberts, Martínez and Santiago2018). It is therefore reasonable to assume that the prevalence of sound symbolism in color words across languages has been perpetuated because it aids lexical acquisition, leading to a cultural transmission bias. In addition, iconic patterns, just like cross-linguistic lexicalization patterns of color words, seem to be universal tendencies with some exceptions rather than absolute universals (Levinson, Reference Levinson2000). However, while these malleable patterns are not necessarily present in the same words, in all languages, and at the same time, they seem to decay and reform within languages over time (Flaksman, Reference Flaksman, Bauer, Zirker, Fischer and Ljungberg2017; Johansson & Carling, Reference Johansson and Carling2015).
5. Concluding remarks
This study aimed to ground color sound symbolism in natural languages in low-level perceptual processes such as cross-modal associations. We investigated a range of acoustic measurements (the first three vowel formants, spectral centroid, sonority, and brightness ratings obtained in a perceptual experiment) in eleven words for basic colors or semantically related concepts from 245 language families. The results showed that luminance was associated with the sonority, brightness, and the first formant of vowels, while saturation and possibly luminance were less robustly associated with the sonority of consonants. An important implication is that sound–meaning associations might have great significance for our understanding of how linguistic categories have developed, since high luminance and high saturation are the two visual traits that guide the lexicalization of color words across languages. These associations can be linked to the increased learnability provided by iconicity, and they can be considered from both ontogenetic and phylogenetic perspectives, considering that cross-modal mappings between pitch and luminance can be traced back at least to our last common ancestor with chimpanzees. In sum, color sound symbolism seems to be grounded in evolutionary, environmental, biological, and developmental constraints. However, in order to thoroughly understand how these sound symbolic associations are formed, it is necessary to map more fully the roles that vowels, consonants, and other, more fine-grained phonetic distinctions play within these associations.


 Open access