

With the increasing cost and limited supply of fishmeal in aquaculture, the utilisation of non-protein energy is becoming increasingly important(Reference Hardy1). Carbohydrates are one of the most abundant and cost-effective energy sources(Reference Maas, Verdegem and Wiegertjes2). It is commonly accepted that appropriate levels of carbohydrates incorporated into fish diets will decrease the catabolism of protein and lipids to allow for protein-sparing effects(Reference Krogdahl, Hemre and Mommsen3). However, teleost fish are generally considered to be glucose intolerant(Reference Kamalam, Medale and Panserat4). An excess proportion of carbohydrates in their diet causes metabolic disturbance, including decreased growth performance(Reference Li, Xu and Wang5), persistent hyperglycaemia(Reference Kostyniuk, Marandel and Jubouri6) and excess lipid deposition(Reference Prisingkorn, Prathomya and Jakovlić7,Reference Viegas, Jarak and Rito8) . The glucose regulation mechanism in fish has been discussed in numerous studies; however, until now, most metabolic genes related to carbohydrate/glucose utilisation have been found to be conserved in vertebrates(Reference Zhang, Qin and Yang9). These studies suggested that in research on the carbohydrate metabolism characteristics in fish, we need to consider the function of the gut microbiota, which is closely related to host nutrition and metabolism and is referred as the ‘second genome’(Reference Jia, Li and Zhao10).
The intestinal microbiota harbours multiple enzymes for the degradation and fermentation of dietary carbohydrates. Two Bacteroides strains, Bacteroides intestinalis and Bacteroides ovatus, are particularly enriched in genes encoding enzymes for the digestion of carbohydrates(Reference Zhang, Chekan and Dodd11). Ruminococcus bromii possesses a superior degradative ability with respect to resistant starch, and the released products from resistant starch can be utilised by other gut bacteria to produce SCFA, which have wide-ranging impacts on host physiology, including serving as an energy source for host cells or stimulating the production of gut hormones(Reference Baxter, Schmidt and Venkataraman12,Reference Ze, Duncan and Louis13) . A high-carbohydrate diet (HCD) altered the faecal microbiome by increasing the carbohydrate degradation members and SCFA excretion in humans(Reference Fava, Gitau and Griffin14). However, a study in the grass carp (Ctenopharyngodon idellus) showed that SCFA level was lower in the hindgut when they were fed with a high-fibre/low-protein diet compared with those fed with a high-protein/low-fibre diet(Reference Hao, Wu and Jakovlić15), indicating that the gut microbiota in the grass carp, which is a predominantly herbivorous fish, does not tend to ferment fibre to SCFA. These results suggested that the limited utilisation efficiency of carbohydrates by the intestinal microbiota might account for the glucose intolerance of fish.
The intestinal microbiota shows a great potential for maintaining glucose homoeostasis; however, the response to regulation by the intestinal microbiota in the context of glucose homoeostasis is strongly linked with the baseline microbiota composition. Research on humans with prediabetes showed that exercise-induced changes in the gut microbiota correlated with improved glucose metabolism and insulin sensitivity(Reference Liu, Wang and Ni16). The microbiome of responders exhibited an enhanced capacity to produce SCFA and catabolise branched-chain amino acids, suggesting that the gut microbiota is a key determinant for the variability of glycaemic control(Reference Liu, Wang and Ni16). A similar observation was made in a cohort of healthy individuals exposed to barley kernel-based bread, which suggested that humans harbouring a higher Prevotella:Bacteroides ratio exhibited improved glucose metabolism following 3-d consumption of barley kernel-based bread(Reference Kovatcheva-Datchary, Nilsson and Akrami17). Fish harbour a Proteobacteria-dominated microbiota, which is different from the dominant microbiota in human or mice(Reference Wang, Ran and Ringø18,Reference Bäckhed, Ley and Sonnenburg19) . Whether regulation of the intestinal microbiota could increase the carbohydrate utilisation efficiency and alleviate the adverse effects caused by HCD in fish remains unknown.
Nile tilapia (Oreochromis niloticus) is an economically important fish species and is an ideal fish model for nutritional and metabolic studies because of its fast growth, high resistance to disease and available genomic information(Reference de Verdal, Vandeputte and Mekkawy20). In the present study, we isolated a strain that could degrade starch in vitro from the intestine of Nile tilapia. 16S rRNA gene sequencing showed that the strain was affiliated to Bacillus amyloliquefaciens (designated as B. amy SS1). Three diet treatments, including control diet (CON), HCD and HCD supplemented with B. amy SS1 (HCB), were used to feed Nile tilapia for 10 weeks. The host physiology and metabolic characteristics were identified in these three groups, and the possible mechanism by which B. amy SS1 regulates carbohydrate utilisation was investigated.
Methods
Animal ethics
All experiments were conducted under the Guidance of the Care and Use of Laboratory Animals in China. This study was approved by the Committee on the Ethics of Animal Experiments of East China Normal University (F20190101).
Bacteria isolation
Healthy Nile tilapia were anaesthetised using MS-222. The fresh intestinal content was aseptically collected, then plated on a starch agar medium after gradient dilution and cultured at 28°C overnight. The colonies with a larger transparent zone after dropping with Lugol’s iodine solution on the plates were picked and inoculated into the LB broth medium. The genomic DNA of the strain was extracted using a bacterial genome DNA extraction kit (Tiangen, DP302) according to the manufacturer’s protocol. 16S rRNA was then amplified using primers 27F (5′-AGAGTTTGATCCTGGCTCAG-3′) and 1492R (5′-GGTTACCTTGTTACGACTT-3′). The PCR was performed using the following programme: 94°C for 5 min; 35 cycles at 94°C for 30 s, 55°C for 30 s and 72°C for 90 s; and 72°C for 10 min. The 16S rRNA gene was sequenced by Majorbio Bio-Pharm Technology Co. Ltd. 16S rRNA sequences were blast in GenBank (http://blast.ncbi.nlm.nih.gov/Blast.cgi). A phylogenetic tree was constructed using the neighbour-joining method in MEGA 7.0. The 16S rRNA gene sequence was submitted to GenBank (NCBI) with the accession number MT226660.
Detection of amylase activities
The amylase activity of the bacterium was detected as described previously(Reference Bernfeld21). In brief, a 1·0-ml LB broth culture, as a crude enzyme source, was reacted with 4·0 ml of substrate solution (1 % starch solution) at 45°C for 30 min. The enzyme reaction was interrupted by the addition of 1 ml 3,5-dinitrosalicylic acid reagent (Leagene, TC0030). The reaction solution was heated for 5 min in boiling water and then cooled in running tap water. The solution was constant volume to 10 ml, and then the OD540 was detected.
Preparation of high-carbohydrate diet supplemented with Bacillus amyloliquefaciens diet
B. amy SS1 was cultured in LB broth at 28°C at 220 rpm for 18 h. The cells were collected by centrifugation (12 000 g for 15 min) and resuspended in sterile water. The bacterial quantity was detected by serial dilution and counting on LB agar plates. B. amy SS1 was mixed with the diet powder to make the pellets, and the final concentration of B. amy SS1 was 107 CFU/g diet. The diet was made every 3 d and kept at 4°C.
Measurement of SCFA
SCFA concentrations were determined using GC. First, 200 μl bacteria solution was mixed with 0·1 ml of 50 % sulphuric acid and vortexed for 30 s. For intestinal SCFA measurement, 0·1 g of intestinal content was homogenised with 0·2 ml of water for 2 min. Then, 0·4 ml of pre-cooled ether was added to the mixture and vortexed for 30 s. The mixture was centrifuged at 12 000 g for 10 min at 4°C. The ether phase was detected in a GC under the following conditions: An initial column temperature of 100°C, held for 2 min, increased at a rate of 5°C/min to 180°C, and then held for 2 min; the flow rate was kept at 1 ml/min; the inlet temperature was set to 220°C and the sample amount was 1 μl with nitrogen as the carrier gas.
Animal experiments
Expt 1
Nile tilapia juveniles were obtained from Shanghai Ocean University (Shanghai, China). All fish were acclimated at 28 (sem 1) °C and fed with a commercial diet (Tongwei, China) twice per day for 2 weeks. After acclimation, 225 uniformly sized fish (1·63 (sem 0·05) g) were randomly distributed into three groups (three replicates for each group, twenty-five fish per replicate), including a control diet (CON), a HCD and a HCB. All fish were fed twice daily (08.30 and 20.30 hours) at a feeding rate of 4 % body weight. The formulation of the diets is listed in Table 1. The total weight of fish in each tank was recorded every 2 weeks.
Formulations of the diets in Expt 1*
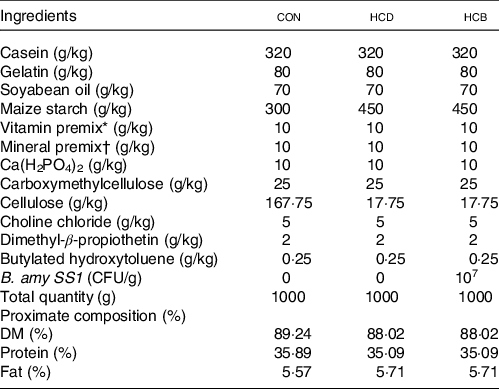
* Mixed vitamin (mg or IU/kg): 500 000 IU, vitamin A, 50 000 IU, vitamin D3, 2500 mg vitamin E, 1000 mg vitamin K3, 5000 mg vitamin B1, 5000 mg vitamin B2, 5000 mg vitamin B6, 5000 mg vitamin B12, 25 000 mg Inositol, 10 000 mg Pantothenic acid, 100 000 mg Cholin, 25 000 mg Niacin, 1000 mg folic acid, 250 mg biotin, 10 000 mg vitamin C.
† Mixed minerals (g/kg): 147.4 g MgSO4•7H2O; 49.8 g NaCl; 10.9 g Fe (II) gluconate; 3.12 g MnSO4•H2O; ZnSO4·7H2O; 0.62 g CuSO4•5H2O; 0.16 g KI; 0.08 g CoCl2·6H2O; 0.06 g NH4 molybdate; 0.02 g NaSeO3.
Expt 2
Four treatments were set up in the second trial: HCD; HCD with a low dose of sodium acetate (900 mg/kg) (HLA); HCD with a medium dose of sodium acetate (1800 mg/kg) (HMA) and HCD with high dose of sodium acetate (3600 mg/kg) (HHA). Three replicates were set for each treatment, and each replicate contained twenty-five fish. The formulations of the diets are listed in online Supplementary Table S1.
Biochemical analysis
Glycogen, hexokinase, phosphofructokinase, pyruvate kinase, glycogen, TAG, NEFA, total cholesterol and LDL were detected using biochemical assay kits (Nanjing Jiancheng Bioengineering Institute) according to the manufacturer’s instructions. Glucagon-like peptide-1 (GLP-1) was analysed by using an ELISA kit (Hengyuan Biotechnology).
Glucose tolerance test
The glucose tolerance test was performed after 24 h of fasting, followed by an intraperitoneal injection of d-glucose (500 mg/kg BW, 20 % in 0·85 % NaCl) (Sigma). The blood glucose levels at time 0, 0·5, 1·5 and 3 h after intraperitoneal injection were detected using an OneTouch glucometer (Bayer). The concentrations of fasting insulin in serum were analysed using an ELISA kit (Hengyuan Biotechnology).
Histological analysis
Liver and adipose tissues were fixed in 4 % paraformaldehyde, followed by gradient ethanol dehydration and xylene transparency procedure, then the tissues were embedded in paraffin and sliced into 5-µm sections for haematoxylin–eosin staining. For oil red O staining, liver tissue was embedded in optimum cutting temperature compound (Sakura) and immediately frozen at −80°C. Approximately 5–10 µm sections were gently flushed with 60 % isopropanol for a few seconds. Frozen liver sections were stained with oil red O and counterstained with haematoxylin to visualise the lipid droplets. The histological features were observed and captured under a light microscope (Nikon). Quantification and statistical analysis were conducted by using Image J.
16S rRNA amplicon sequencing
Genomic DNA extraction from intestinal contents was performed using an E.Z.N.A.® Soil DNA Kit (OMEGA) according to the manufacturer’s instructions. DNA quantity and quality were measured using a NanoDrop 2000 Spectrophotometer (Thermo). The V3–V4 region of the bacteria 16S rRNA gene was amplified by PCR using primers 338F (5′-ACTCCTACGGGAGGCAGCA-3′) and 806R (5′-GGACTACHVGGGTWTCTAAT-3′). Unique eight-base barcodes were added to each primer to distinguish the different PCR products. The PCR were performed in a 20 ml mixture containing 4 ml of 5 × Fast Pfu Buffer, 2 ml of 2·5 mm dNTP, 0·8 ml of each primer (5 mm), 0·4 ml of FastPfu Polymerase (TransGen) and 10 ng of template DNA. The PCR conditions were as follows: 95°C for 3 min; followed by 95°C for 30 s, 55°C for 30 s and 72°C for 45 s for 29 cycles; and extension at 72°C for 10 min. Purified PCR products were subjected to Illumina-based high-throughput sequencing (carried out by Majorbio Bio-Pharm Technology, Co. Ltd). The raw pair-end reads were subjected to quality-control procedures using Quantitative Insights Into Microbial Ecology (version 1.17). The qualified reads were clustered to generate operational taxonomic units (OTU) at the 97 % similarity level using UPARSE (version 7.1). Chimeric sequences were identified and removed using UCHIME (version 4.1). Taxonomic richness and diversity estimators were determined using the Mothur software. Principal coordinates analysis and heat-map analysis were performed in a MATLAB R2016a environment. Forty-six OTU were selected for heat-map analysis based on: (1) the abundances of these OTU were higher than 0·01% in each sample and (2) the abundance of these OTU was significantly different among groups as assessed using the one-way ANOVA with Tukey’s adjustment analysis. The high-throughput sequencing data of intestinal microbiota are available in the NCBI short read archive (https://www.ncbi.nlm.nih. gov/sra) with the BioProject accession number PRJNA615286.
Quantitative real-time PCR analysis
The total RNA was isolated from tissues by using the TRIzol Reagent. The total RNA concentration was measured using a NanoDrop 2000C spectrophotometer. RNA with an absorbance ratio OD 260/280 between 1·9 and 2·2 and an OD 260/230 >2·0 was used for subsequent analysis. As the template, 800 ng of total RNA was used to synthesise cDNA using a PrimeScript™ RT Reagent Kit (Takara) in a S1000TM Thermal Cycler (Bio-Rad). The primers for quantitative real-time PCR (qPCR) analysis were designed at NCBI, and the sequences are shown in online Supplementary Table S2. β-actin and ef1α were used as the reference genes. The qPCR volume was 25 μl containing 2·0 μl of cDNA template, 12·5 μl of 2 × SYBR qPCR Mixture (Aidlab), 2·0 μl of PCR primers (5 μm) and 6·5 μl of nuclease-free water and was performed in a CFX96 Connect Real-Time System (Bio-Rad). The qPCR conditions consisted of one cycle at 95°C for 30 s, followed by 40 cycles at 95°C for 5 s and an annealing step at 60°C for 20 s. Melting curves of the amplified products were generated to ensure the specificity of the assays at the end of each qPCR run. The relative gene expression values were calculated by using the 2−ΔΔCT method(Reference Livak and Schmittgen22).
Western blot analysis
Radio immunoprecipitation assay (Beyotime Biotechnology) containing 1 mm PMSF (Beyotime Biotechnology) was used to extract proteins from liver tissues. Protein concentrations were measured using a BCA Protein Assay Kit (Beyotime Biotechnology). Forty micrograms of protein was subjected to SDS-PAGE, and the separated proteins were transferred to a nitrocellulose membrane. The membrane was blocked with 5 % BSA. Proteins on the membrane were reacted with the indicated antibodies in online Supplementary Table S3. Then, the membranes were further incubated with the anti-Rabbit IgG (Catalogue no. 926-32211; LI-COR Biosciences Corporate). GAPDH was used as a reference. The detection was achieved by using the Odyssey CLx Imager (Li-cor). The target proteins were quantified by using ImageJ software (National Institutes of Health).
Statistical analysis
Statistical analysis of all data was performed using SPSS software version 19 (IBM SPSS). The results are presented as mean values and standard errors of the mean. Data sets were assessed using one-way ANOVA with Tukey’s adjustment. In the figures: *P < 0·05; **P < 0·01; ***P < 0·001.
Results
A strain isolated from the intestine of Nile tilapia improved the growth performance of fish
16S rRNA gene sequencing showed that a strain with the ability to degrade starch was affiliated to Bacillus amyloliquefaciens ATCC 39320 (Fig. 1(a)). The selected strain was named B. amy SS1 in the present study. B. amy SS1 has a higher amylase activity in vitro (Fig. 1(b)) and could ferment maize starch to mainly produce acetate and butyrate (Fig. 1(c)).
Characteristics of Bacillus amyloliquefaciens isolated from intestine of Nile tilapia in vitro and in vivo. (a) Phylogenetic tree of B. amy SS1. (b) Amylase activity of B. amy SS1 in vitro. (c) SCFA production ability of B. amy SS1 in vitro. (d) Average weight, average weight (g) = total body weight/total tails. (e) Weight gain, weight gain (%) = 100 × (final fish weight − initial fish weight)/initial fish weight. (f) Feed efficiency, feed efficiency (%) = 100 × (final fish weight − initial fish weight)/feed intake. Data are expressed as mean values with their standard errors (n 3 groups). One-way ANOVA with Tukey’s adjustment was used for data analysis. ![]() CON;
CON; ![]() high-carbohydrate diet (HCD);
high-carbohydrate diet (HCD); ![]() high-carbohydrate diet supplemented with Bacillus amyloliquefaciens (HCB).
high-carbohydrate diet supplemented with Bacillus amyloliquefaciens (HCB).

To detect whether the addition of B. amy SS1 could influence the growth performance of fish, three treatments, including CON, HCD and HCB, were used to feed fish for 10 weeks. The results showed that body weight was significantly higher in the HCD group than in the CON group; moreover, the average weight was further increased in the HCB group (Fig. 1(d)). Addition of B. amy SS1 to the HCD resulted in the highest weight gain among the three groups (Fig. 1(e)), and the feed efficiency was higher in the HCB group compared with that in the HCD group (Fig. 1(f)).
The addition of Bacillus amyloliquefaciens to high-carbohydrate diet maintained the glucose homoeostasis
One of the metabolic phenotypes caused by HCD is the persistent hyperglycaemia in fish(Reference Kostyniuk, Marandel and Jubouri6,Reference Conde-Sieira, Salas-Leiton and Duarte23). To address whether the addition of B. amy SS1 to HCD had a metabolic protective effect, the fasting glucose levels were detected. The results showed that the addition of B. amy SS1 reduced the fasting glucose level caused by HCD (Fig. 2(a)). The glucose tolerance test showed that the addition of B. amy SS1 markedly reduced the persistently higher blood glucose level caused by the HCD (Fig. 2(b) and (c)), that is, B. amy SS1 improved glucose tolerance. Considering the important role of insulin in glucose homoeostasis, the fasting insulin level was detected; however, no significant difference was found among the groups (Fig. 2(d)), suggesting that the addition of B. amy SS1 to the HCD might elevate insulin sensitivity rather than its amount. Glucose homoeostasis induced by B. amy SS1 was further supported by significantly decreased liver glycogen levels (Fig. 2(e)). To investigate whether the insulin signalling pathway was activated by the addition of B. amy SS1, the expression levels of crucial proteins in the liver, including phosphatidylinositol 3-kinase (PI3K) and protein kinase B (AKT), were detected using Western blotting. The total levels of PI3K and AKT were similar among the groups; however, the levels of phosphorylated PI3K and AKT were significantly increased by B. amy SS1 administration (Fig. 2(f) and (g)), suggesting that the addition of B. amy SS1 to the HCD activated the PI3K/AKT insulin signalling pathway.
Bacillus amyloliquefaciens improved glucose tolerance of Nile tilapia. (a) Fasting blood glucose concentration. (b) glucose tolerance test (GTT), glucose levels at 0 h, 0·5 h, 1·5 h and 3 h. (c) AUC of GTT, #: CON v. high-carbohydrate diet (HCD), #P < 0·05, ##P < 0·01; *HCD v. high-carbohydrate diet supplemented with Bacillus amyloliquefaciens (HCB): *P < 0·05. (d) Fasting insulin concentration. (e) Glycogen content in the liver. (f) Western blotting analysis of the levels of phosphorylated phosphatidylinositol 3-kinase (p-PI3K) and phosphorylated AKT (p-AKT) in the liver. (g) Quantitation of the levels of p-PI3K and p-AKT normalised to that of GAPDH. Glycolytic enzyme activities of hexokinase (HK) (h), phosphofructokinase (PFK) (i) and pyruvate kinase (PK) (j) in the liver. (k) Relative mRNA expression levels of gck, pk, pfk, and ir in the liver. Data are expressed as mean with their standard errors (n 6 fish). One-way ANOVA with Tukey’s adjustment was used for data analysis. ![]() CON;
CON; ![]() HCD;
HCD; ![]() HCB.
HCB.

Enhanced glycolysis might improve glucose homoeostasis; therefore, three key enzymes of glycolysis, hexokinase, phosphofructokinase and pyruvate kinase, were analysed. The glycolytic enzyme activities in the liver were all increased in B. amy SS1-treated fish (Fig. 2(h)–(j)). The mRNA expression of glycolysis targeted genes, including gck, pfk, pk and ir in the liver, was down-regulated in the HCD group, but up-regulated by the addition of B. amy SS1 (Fig. 2(k)). These data strongly suggested that the addition of B. amy SS1 to the HCD enhanced glycolysis by activating the key enzymes related to glycolysis in the liver.
The addition of Bacillus amyloliquefaciens to high-carbohydrate diet reduced lipid deposition
HCD causes excess lipid accumulation in fish, which further aggravates the metabolic imbalance(Reference Xie, Yang and Yu24). The HSI was mostly increased in the HCD group compared with that in the CON group, and the HCB group showed a decreased trend in HSI, although no significant difference was detected (Fig. 3(a)). The hepatic lipid content was significantly increased in the HCD group compared with that in the CON group, but it was decreased by the addition of B. amy SS1 (Fig. 3(b)). The addition of B. amy SS1 to the HCD also exhibited protective effects against HCD-induced liver damage, including lower content of TAG, NEFA and total cholesterol in the liver (Fig. 3(c)–(e)). Furthermore, haematoxylin–eosin and oil red O staining also indicated that the addition of B. amy SS1 to the HCD markedly reduced lipid accumulation (Fig. 3(f)–(i)). The mRNA levels of genes related to lipid synthesis, including fas, accα, dgat2 and pparγ, showed no significant difference in the liver among the groups (Fig. 3(j)). However, compared with that in the HCD group, the HCB group showed substantial up-regulation of genes targeted to lipolysis, including atgl, cpt1, hsl and pparα in the liver (Fig. 3(k)).
Bacillus amyloliquefaciens SS1 reduced lipid deposition of Nile tilapia. (a) HSI, HSI (%) = 100 × (Liver weight/body weight). (b) Hepatic lipid content. Content of TAG (c), NEFA (d) and total cholesterol (T-CHO) (e) in the liver. Histological analysis of liver (n 3 slides), liver tissue stained with haematoxylin–eosin (H&E) (f) and statistical analysis of lipid area percentage (g), liver tissue stained with oil red O (h) and statistical analysis of lipid area percentage (i), scale bar = 100 μm. Relative mRNA expression of genes related to lipid synthesis: fas, accα, dgat2 and pparγ in the liver (j) and lipolysis: atgl, cpt1, hsl, fatp and pparα in the liver (k). (l) Western blotting analysis of the levels of phosphorylation of acetyl CoA carboxylase (p-ACC) and phosphorylated adenosine 5’-monophosphate activated protein kinase α (p-AMPK) in the liver. (m) Quantitation of the levels of p-ACC and p-AMPK normalised to that of GAPDH. (n) Total lipid content in the whole body of Nile tilapia at the end of the feeding trial. (o) MFI, MFI (%) = 100 × (Mesenteric fat weight/body weight). Histological analysis of fat tissue (n 3 slides), fat tissue stained with H&E (p) and relative size of adipocyte (q), scale bar = 100 μm. r-v Content of TAG (r), NEFA (s), T-CHO (t), LDL (u), and HDL (v) in serum. Data are expressed as mean with their standard errors (n 6 fish). One-way ANOVA with Tukey’s adjustment was used for data analysis. ![]() CON;
CON; ![]() high-carbohydrate diet (HCD);
high-carbohydrate diet (HCD); ![]() high-carbohydrate diet supplemented with Bacillus amyloliquefaciens (HCB).
high-carbohydrate diet supplemented with Bacillus amyloliquefaciens (HCB).

To address whether activated lipolysis was associated with energy homoeostasis, the levels of key proteins involved in this process were detected using Western blotting. The phosphorylation of acetyl CoA carboxylase, a rate-limiting enzyme of fatty acid synthesis, showed no significant difference among groups in the liver (Fig. 3(l) and (m)). However, the level of phosphorylated adenosine 5’-monophosphate activated protein kinase α, a key molecule in the regulation of biological energy metabolism, was markedly increased in B. amy SS1-treated fish (Fig. 3(l) and (m)). Taken together, these results demonstrated that HCD supplemented with B. amy SS1 reduced lipid deposition via AMPK/ACC signalling pathway, which was likely to increase energy expenditure.
Besides lipid accumulation in the liver, we also detected the content of total lipid in the body. Notably, a decrease in the total lipid content was observed in the B. amy SS1-treated fish (Fig. 3(n)). Moreover, MFI was lower in HCB group compared with that in the HCD group (Fig. 3(o)). B. amy SS1 administration also reduced the cell size of adipocytes (Fig. 3(p) and (q)). Meanwhile, the serum TAG, NEFA, total cholesterol and LDL levels were reduced by the addition of B. amy SS1 to the HCD, whereas HDL levels increased markedly in the B. amy SS1-treated fish (Fig. 3(r)–(v)). Taken together, these results further demonstrated that the addition of B. amy SS1 to the HCD reduced lipid deposition in the fish.
The addition of Bacillus amyloliquefaciens to the high-carbohydrate diet activated the mechanistic target of rapamycin/S6 signalling pathway and increased the protein accumulation
We further assessed the impact of B. amy SS1 on body protein accumulation. The results showed that the addition of B. amy SS1 to the HCD increased the carcass index and carcass protein content significantly (Fig. 4(a) and (b)). The mRNA expression of mtor and s6, which are related to protein synthesis, was detected. The results indicated that mtor was significantly up-regulated by B. amy SS1 administration, but no significant difference was observed for s6 among the groups (Fig. 4(c)). Western blotting analysis demonstrated that the levels of phosphorylated mechanistic target of rapamycin (p-mTOR) and S6 ribosomal protein increased significantly after the addition of B. amy SS1 to the HCD; however, no significant difference was found in the total levels of these proteins (Fig. 4(d) and (e)). Overall, these data implied that the HCD supplemented with B. amy SS1 activated the mTOR/S6 signalling pathway and induced protein accumulation.
Bacillus amyloliquefaciens increased protein accumulation of Nile tilapia. (a) Carcass index, Carcass index (%) = 100 × (Carcass weight/body weight). (b) Carcass protein content. (c) Relative mRNA expression of mtor and s6 in the liver. (d) Western blotting analysis of the levels of phosphorylated mechanistic target of rapamycin (p-mTOR) and S6 ribosomal protein (p-S6) in the liver. (e) Quantitation of the levels of p-mTOR and p-S6 were normalised to that of GAPDH. Data are expressed as mean with their standard errors (n 6 fish). One-way ANOVA with Tukey’s adjustment was used for data analysis. ![]() CON; high-carbohydrate diet
CON; high-carbohydrate diet ![]() (HCD);
(HCD); ![]() high-carbohydrate diet supplemented with Bacillus amyloliquefaciens (HCB).
high-carbohydrate diet supplemented with Bacillus amyloliquefaciens (HCB).

The addition of Bacillus amyloliquefaciens to the high-carbohydrate diet altered the intestinal microbial community composition of Nile tilapia
The gut microbiota has critical roles in host nutrition and metabolic processes. High-throughput sequencing was used to investigate the effects of B. amy SS1 on the intestinal microbiota composition. Decreased Chao1, Ace, Sobs and Shannon-indexes in the HCD group were notably increased by B. amy SS1 treatment (Table 2), suggesting that supplementation with B. amy SS1 in the HCD restored the richness and diversity of the intestinal microbial community. To assess the overall composition of the bacterial community in the different groups, we analysed the microbiota composition at the phylum level. The intestinal microbiota was dominated by Firmicutes, Proteobacteria, Bacteroidetes, Actinobacteria and Fusobacteria in Nile tilapia (Fig. 5(a)). Compared with that in the CON group, the HCD group displayed a significant increase in the abundance of Firmicutes, while the addition of B. amy SS1 to the HCD decreased the proportion of Firmicutes (Fig. 5(b)).
Bacillus amyloliquefaciens changed the intestinal microbial community abundance and diversity of Nile tilapia. Richness and diversity of the intestinal microbiota in three groups
(Mean values with their standard errors)*

CON, control diet; HCD, high-carbohydrate diet; HCB, high-carbohydrate diet supplemented with Bacillus amyloliquefaciens.
* One-way ANOVA with Tukey’s adjustment was used to detect the significant differences between groups. Different letters represent significant difference at P < 0·05.
† Represents the significant difference between CON and HCD.
‡ Represents the significant difference between HCD and HCB.
Bacillus amyloliquefaciens altered the intestinal microbial community composition and microbial metabolites of Nile tilapia. (a) Percentage of community abundance at the phylum level. (b) Histogram of community abundance at the phylum level. (c) Principal coordinates analysis (PCoA) of the intestinal bacterial community. (d) Heat-map of the bacterial abundance in the intestine. (e) Acetate content in the intestine. (f) Relative mRNA expression of ffar2 in the liver. Content of glucagon-like peptide-1 (GLP-1) in intestine (g) and serum (h). (i) Western blotting analysis of the levels of phosphorylated p38 mitogen-activated protein kinases (p-p38 MAPK) in the liver. (j) Quantitation of the levels of p-p38 MAPK normalised to that of GAPDH. Data are expressed as mean with their standard errors (n 6 fish). One-way ANOVA with Tukey’s adjustment was used for data analysis. Firmicutes’ Proteobacteria; Bacteroidetes; Actinobacteria; Fusobacteria; Others; ![]() CON;
CON; ![]() high-carbohydrate diet (HCD);
high-carbohydrate diet (HCD); ![]() high-carbohydrate diet supplemented with Bacillus amyloliquefaciens (HCB); –2; –1; 0.
high-carbohydrate diet supplemented with Bacillus amyloliquefaciens (HCB); –2; –1; 0.

OTU-based principal coordinates analysis revealed that the HCD changed the intestinal microbiota compared with that of the CON group, while the addition of B. amy SS1 modulated the microbiota composition, resulting in a composition similar to that of the CON group (Fig. 5(c)). The abundances of forty-six OTU in the HCD group showed significant differences among groups (Fig. 5(d)). Among these OTU, twelve were increased and thirty-four were decreased in the HCD group, while these OTU showed the opposite trend in the HCB group. OTU4496, OTU782 (Streptococcus), and OTU4496 (Lactococcus) were induced by the HCD, but were markedly reduced by the addition of B. amy SS1. Moreover, the HCD decreased the abundances of OTU209 (Weisselia); OTU6174 (Romboutsia); OTU938 (Faecalibacterium); OTU6929 and OTU2196 (Ruminococcus); OTU3573 (Blautia); OTU4850 and OTU4857 (Prevotellaceae); OTU5921, OTU4958 and OTU3077 (Bacteroides); and OTU6083 (Bifidobacterium), while the addition of B. amy SS1 increased the abundances of these OTU. We noticed that these bacteria were commonly associated with SCFA production(Reference Cherbuy, Bellet and Robert25,Reference Sturino26). Collectively, these results indicated that compared with that in the HCD group, the addition of B. amy SS1 to the HCD restored the abundance of SCFA production bacteria in Nile tilapia.
The addition of Bacillus amyloliquefaciens to the high-carbohydrate diet promoted the secretion of glucagon-like peptide-1
The results of the previous section showed that the abundance of SCFA-producing bacteria was restored by B. amy SS1 treatment; therefore, the concentration of SCFA in the intestines was determined. The result suggested that the reduced concentration of acetate in the HCD group was dramatically elevated by the addition of B. amy SS1 (Fig. 5(e)). The propionate content was below the detection limit, and the content of butyrate showed marked intra-group difference (data not shown). The mRNA expression of ffar2, which encodes free fatty acid receptor 2 (the receptor of SCFA in fish), was notably up-regulated in the liver after the addition of B. amy SS1 to the HCD (Fig. 5(f)).
Considering GLP-1 is the main target of FFAR2, the amounts of GLP-1 in the intestine and serum were detected. The results suggested that intestinal and serum GLP-1 levels increased significantly after the addition of B. amy SS1 to the HCD (Fig. 5(g) and (h)). To determine how the signal is transduced, p38 mitogen-activated protein kinases (p38 MAPK), which regulates the production of GLP-1(Reference Zhang, Sun and Zhao27), was detected. The results showed that the level of phosphorylated p38 MAPK was evidently increased by B. amy SS1 administration, although no significant difference of total p38 MAPK was observed among groups (Fig. 5(i) and (j)). These data demonstrated that the increased production of acetate induced by the addition of B. amy SS1 to the HCD might account for the increased secretion of GLP-1.
Addition of sodium acetate mimicked the effects of Bacillus amyloliquefaciens supplementation of the high-carbohydrate diet
To further verify the function of microbial metabolites, different concentrations of sodium acetate (HLA, 900 mg/kg; HMA, 1800 mg/kg and HHA, 3600 mg/kg) were added to the HCD to feed Nile tilapia for 8 weeks. The fasting glucose test and glucose tolerance test showed that blood glucose levels were obviously reduced in the HMA and HHA groups compared with those in the HCD group (Fig. 6(a)–(c)), suggesting that the addition of certain concentrations of sodium acetate to the HCD could improve glucose homoeostasis of fish. Additionally, the HSI was noticeably decreased in the HMA and HHA groups (Fig. 6(d)). In parallel, liver TAG levels were reduced in the HMA and HHA groups (Fig. 6(e) and (f)). Accordingly, liver histology via haematoxylin–eosin staining showed that the percentage of the lipid area exhibited was reduced substantially in the HMA and HHA groups compared with that in the HCD group (Fig. 6(g) and (h)). Importantly, we also found that GLP-1 levels were elevated in the serum from the HMA and HHA groups (Fig. 6(i)). Western blotting analysis revealed that levels of phosphorylated AKT and phosphorylated adenosine 5’-monophosphate activated protein kinase α increased significantly in the three sodium acetate supplementation groups, while the level of p-mTOR was only increased in the HMA and HHA groups (Fig. 6(j) and (k)), and these effects are dose-dependent. In brief, the addition of acetate could mimic the metabolic effects caused by addition of B. amy SS1 to the HCD.
Sodium acetate mirrored the metabolic benefits of Bacillus amyloliquefaciens. (a) Fasting blood glucose concentration. (b) glucose tolerance test (GTT), glucose levels at 0 h, 0·5 h, 1·5 h and 3 h. (c) AUC of GTT. (d) Serum glucagon-like peptide-1 (GLP-1). (e) HSI. Histological analysis of the livers (n 3 slides): liver tissues stained with H&E (f) and statistical analysis of lipid area percentage (g), scale bar = 100 μm. Content of TAG in the liver (h) and serum (i). (j) Western blotting analysis of the levels of phosphorylated p-AKT, p-AMPK and p-mTOR in the liver. (k) Quantitation of the levels of p-AKT, p-AMPK and p-mTOR was normalised to that of GAPDH. Data are expressed as mean with their standard errors (n 6 fish). One-way ANOVA with Tukey’s adjustment was used for data analysis. high-carbohydrate diet ![]() (HCD);
(HCD); ![]() HLA;
HLA; ![]() HMA;
HMA; ![]() HHA.
HHA.

Discussion
Increasing research in humans and other vertebrates has shown that the intestinal microbiota plays an important role in carbohydrate degradation and fermentation(Reference He, Wu and Hayashi28,Reference Spring, Premathilake and DeSilva29) . In aquaculture, how to increase the carbohydrate utilisation efficiency and alleviate the metabolic phenotypes caused by HCD is vitally important. In the past, administration of benfotiamine and bile acids showed the potential to increase the carbohydrate utilisation efficiency in fish(Reference Xu, Liu and Dai30,Reference Yu, Zhang and Chen31 ); however, the influence of the intestinal microbiota on host carbohydrate metabolism is unknown. In the present study, B. amy SS1 isolated from the intestine of Nile tilapia showed an ability to alleviate metabolic phenotypes caused by HCD by restoration of acetate-producing bacteria in the intestines, suggesting that modulation of the intestinal microbiota has the great potential to regulate the host metabolism of fish.
The intestinal microbiota produces key enzymes for carbohydrate degradation and fermentation to produced SCFA, which are considered to be beneficial to the host(Reference Zhang, Chekan and Dodd11,Reference Macfarlane and Macfarlane32) . Consistent with previous research(Reference Hao, Wu and Jakovlić15), we also found that the abundance of bacterial members closely related to SCFA production was decreased under HCD, suggesting that the HCD diminished the numbers of functional bacteria, which might be related to the metabolic phenotypes caused by the HCD in fish. The addition of B. amy SS1 to the HCD restored the bacteria that are believed to be involved in the degradation of carbohydrates or production of SCFA. OTU209 is affiliated to Weisells, which is commonly expanded in a carbohydrate-rich setting and has the ability to ferment polysaccharides to produce SCFA(Reference Sturino26,Reference Lynch, Lucid and Arendt33) . OTU938 is affiliated to Faecalibacterium, which is one of the dominant bacteria in the hindgut with higher levels of SCFA in Hermosilla azurea (Reference Fidopiastis, Bezdek and Horn34). An expansion of Faecalibacterium and significantly greater SCFA concentrations were found in the colon of pigs fed with a high-resistant starch diet(Reference Haenen, Zhang and da Silva35). The abundance of OTU6929 and OTU2196, belonging to Ruminococcus, was increased by the addition of B. amy SS1 to the HCD. It has been reported that Ruminococcus could ferment resistant starch into SCFA(12,36). OTU4850 and OTU4857 are affiliated to Prevotellaceae, which were increased in both humans and rats fed with higher dietary starch and are related to the increased SCFA production(Reference Cherbuy, Bellet and Robert25). We also found that abundance of OTU6083, belonging to Bifidobacterium, was lower in the HCD group but enriched in the HCB group. The abundance of Bifidobacteria was increased in the human gut by supplementing the diet with resistant starch from potatoes(Reference Baxter, Schmidt and Venkataraman12).
The metabolic syndrome induced by HCD is hyperglycaemia and hepatic steatosis in mammals(Reference Agius37). To determine the mechanism by which B. amy SS1 alleviated these metabolic phenotypes in fish, we detected the key signalling pathways related to glucose and lipid metabolism. We found that acetate production increased in the intestines of Nile tilapia in HCB group compared with HCD group. Increased levels of SCFA stimulate GLP-1 production via the p38 MAPK signalling pathway(Reference Zhang, Sun and Zhao27), and in line with the previous research, our results showed higher level of p38 MAPK and GLP-1 in the HCB group. The important roles of GLP-1 in glucose homoeostasis and lipid metabolism have been well documented(Reference Badman and Flier38,Reference Murphy and Bloom39) . In mammals, GLP-1 decreases glucose levels via stimulation of insulin release and inhibition of nutrient absorption in the gastrointestinal tract. Meanwhile, in rainbow trout, it was reported that GLP-1 increased glucose levels via activation of glycogenolysis and gluconeogenesis in the liver(Reference Mojsov40). Our results showed that GLP-1 improved glucose homoeostasis, which is consistent with findings in mice(Reference Wang, Dilidaxi and Wu41). Although there was no difference in the insulin content among groups, the PI3K/AKT insulin signalling pathway was activated in the HCB group, which may relate to the improved glucose tolerance. Besides glucose homoeostasis, GLP1 also regulates lipid metabolism. GLP-1 suppresses hepatic lipogenesis via activation of the AMPK pathway in chicken and rats(Reference Zhang, Sun and Zhao27,Reference Ben-Shlomo, Zvibel and Shnell42) . However, to date, there has been no study on the regulation of lipid metabolism by GLP-1 in fish. The results of the present study showed that GLP1 modulated the reduction of lipid deposition, which may be due to the increased lipid catabolism. Furthermore, the AMPK/ACC signalling pathway was activated in the HCB group, which is related to the energy expenditure(Reference Krieger, Langhans and Lee43). Taken together, our results demonstrated that the addition of B. amy SS1 to the HCD stimulated the GLP-1 signalling pathway, which is responsible for the alleviation of metabolic phenotypes in fish, suggesting a conserved function of GLP-1 in glucose homoeostasis and lipid metabolism between fish and other vertebrates.
It is important for fish to produce more body protein in aquaculture(Reference Stone44,Reference Hemre, Mommsen and Krogdahl45). Many attempts have been made to increase body protein levels in fish. It was reported that dietary methionine increased protein synthesis by improving amino acid metabolism in turbot (Scophthalmus maximus L.)(Reference Gao, Wang and Tan46). In the same fish species, replacement of fishmeal by soyabean meal reduced protein synthesis via nutrient-sensing(Reference Xu, He and Mai47). In the present study, our results showed that the addition of B. amy SS1 to the HCD increased the carcass protein proportion in fish. Increased protein synthesis is commonly associated with activation of mTOR(Reference Wang, He and Mai48,Reference Han, Wang and Li49). Our results showed that the mTOR/S6 signalling pathway was activated in the HCB group. To our knowledge, this is the first study to show a relationship between the intestinal microbiota and protein accumulation in fish, suggesting that the intestinal microbiota might be a new target for protein synthesis in fish.
The benefits of sodium acetate have been reported extensively in animals, including improving growth performance, suppressing intestinal inflammation and maintaining energy homoeostasis(Reference Zhang, Ding and Wang50,Reference Li, Hu and Qiao51). Previously, our laboratory found that the addition of sodium acetate could increase the acetate concentration in the intestine of Nile tilapia(Reference Li, Hu and Qiao51). In the present study, the addition of sodium acetate to the HCD mirrored the beneficial metabolic effects of B. amy SS1 supplementation. The addition of a certain concentration of sodium acetate to the HCD could induce the production of GLP-1. It should be noted that phosphorylated mTOR levels were increased in the HMA and HHA groups, but no significant difference in the carcass protein content was found among treatments (data not shown). The possible reasons are that the increased protein accumulation might be induced by other microbial metabolites instead of acetate, or the feeding period should be prolonged.
Because juvenile tilapia was used in the present study, the potential effect of the growth stage on the intestinal microbiota and host metabolic characteristics has not been studied. In the present study, OTU6677 (Eubacterium_xylanophilum_group), OTU5865 (Ruminococcus_gnavus_group), OTU6381 (Clostridiaceae_sensu_stricto) and OTU1100 (Enterobacter) were decreased in HCD group compared with CON group, which may be related to the decreased content of cellulose in HCD. However, addition of B. amy SS1 increased their abundance and alleviated the metabolic phenotypes caused by HCD, suggesting the important role of B. amy SS1 in altering gut microbiota and regulating fish metabolism. It should be noted that the differences in diet components between CON and HCD included the increased maize starch and the decreased cellulose, and the potential influence of cellulose on intestinal microbiota and host metabolism still needed further investigation.
In summary, our study demonstrated that the addition of B. amy SS1, a bacterium affiliated to Bacillus amyloliquefaciens, in HCD could promote growth performance, improve glucose tolerance, reduce lipid deposition and increase protein accumulation in Nile tilapia. The addition of B. amy SS1 to HCD rebuilt the microbiota composition, and especially, increased the abundance of acetate-producing bacteria in the intestines of fish. The addition of sodium acetate to the HCD mirrored the beneficial effects of B. amy SS1 supplementation in ameliorating metabolic phenotypes. Collectively, this study enhanced our understanding of methods to alleviate metabolic phenotypes caused by HCD in fish by adding functional bacteria, which might represent a novel strategy to regulate fish metabolism.
Acknowledgements
This work was supported by the National Key R&D programme (grant number 2019YFD0900200 & 2018YFD0900400) and the National Natural Science Foundation of China (grant number 31972798).
All authors contributed experimental assistance and intellectual input to this study. M.-L. Z. and Z.-Y. D. conceived the original concept. M.-L. Z., Z.-Y. D. and L.-Q. C. designed the experimental strategies and sampling plans. R. X. and M. L. performed the feeding experiments. R. X., T. W. and C.-J. S. contributed to the collection of samples. R. X. and Y.-W. Z. performed the molecular and biochemistry detections. R. X. performed the bioinformatic analysis of the intestinal samples for microbial composition and the statistical analyses. M.-L. Z., Z.-Y. D., F. Q. and L.-Q. C. provided essential materials and technical supports. M.-L. Z., R. X. and W.-B. Z. drafted and revised the manuscript. All authors read and approved the final manuscript.
The authors declare that there are no conflicts of interest.
Supplementary material
For supplementary material referred to in this article, please visit https://doi.org/10.1017/S0007114521001318


