


1. Introduction
Fusion pilot plants (FPPs) using deuterium–tritium (DT) plasmas as fuel rely on achieving good fusion-born alpha-particle confinement for providing plasma heating to maintain plasma burning conditions (Warmer et al. Reference Warmer, Beidler, Dinklage and Wolf2016; Alonso et al. Reference Alonso, Calvo, Carralero, Velasco, García-Regaña, Palermo and Rapisarda2022; Prost & Volpe Reference Prost and Volpe2023) and to avoid damage to plasma-facing components due to constant bombardment by these very energetic ions (Mau et al. Reference Mau, Kaiser, Grossman, Raffray, Wang, Lyon, Maingi, Ku and Zarnstorff2008; El-Guebaly Reference El-Guebaly2018). Energetic ion confinement is a central driver in optimised stellator design due to the challenge of finding three-dimensional magnetic fields that provide robust confinement of these particles. However, considerable progress has been made in this area in recent years with the advent of new theoretical tools to address alpha particle orbits in three-dimensional (3-D) configurations as well as new methods to improve energetic ion confinement in optimisation (Nemov et al. Reference Nemov, Kasilov, Kernbichler and Leitold2008; Bader et al. Reference Bader, Drevlak, Anderson, Faber, Hegna, Likin, Schmitt and Talmadge2019; Velasco et al. Reference Velasco, Calvo, Mulas, Sánchez, Parra and Cappa2021; Paul et al. Reference Paul, Bhattacharjee, Landreman, Alex, Velasco and Nies2022). The primary goal of this study is to demonstrate that modern optimisation techniques can be used to produce stellarator FPP designs that meet the requirements needed from energetic ion confinement as embodied in the Infinity Two baseline plasma physics design (Hegna et al. Reference Hegna2025). Infinity Two is a four-field period, aspect ratio $A = 10$
, quasi-isodynamic configuration with improved confinement appealing to three-dimensional shape optimisation, elevated plasma density and high magnetic field (
$A = 10$
, quasi-isodynamic configuration with improved confinement appealing to three-dimensional shape optimisation, elevated plasma density and high magnetic field ( $B = 9 T$
). Excellent energetic ion confinement is an explicit goal of the Infinity Two design.
$B = 9 T$
). Excellent energetic ion confinement is an explicit goal of the Infinity Two design.
Alpha-particle confinement will be the emphasis of the present study. Other densities of fusion-born ions, and their corresponding plasma heating, produced in primary fusion reactions in DT plasmas, such as 1.01 MeV tritium, 3.02 MeV protons and 0.82 MeV He $^3$
, are expected to be much lower than fusion-born 3.5 MeV alpha particles (Lazerson et al. Reference Lazerson, Leviness and Lion2021b
); therefore, we only focus on the latter in this work.
$^3$
, are expected to be much lower than fusion-born 3.5 MeV alpha particles (Lazerson et al. Reference Lazerson, Leviness and Lion2021b
); therefore, we only focus on the latter in this work.
Most current tokamaks and stellarators/heliotrons can study the dynamics of fast ions through the introduction of auxiliary heating systems such as radio frequency (RF) heating and neutral beam injection (NBI). Current experiments studying fast-ion dynamics can provide valuable insights into the loss mechanisms of alpha particles in future fusion reactors. In the stellarator W7-X, the dynamics of fast ions produced by RF and NBI have been analysed via interpretative modelling using guiding-centre (GC) and full-orbit (FO) Monte Carlo codes such as BEAMS3D, ASCOT5 and VENUS-LEVIS. These simulations have been compared with experimental measurements of wall loads of fast ions (Äkäslompolo et al. Reference Äkäslompolo, Drevlak, Turkin, Bozhenkov, Jesche, Kontula, Kurki-Suonio and Wolf2018; Lazerson et al. Reference Lazerson2021a , Reference Lazersonc , Reference Lazerson, Kulla, Hartmann, McNeely and Rust2023, Reference Lazerson2024). In these studies, it is consistently found that trapped fast ions dominate prompt losses. Prompt losses are fast ions that quickly leave the plasma before they slow down and, therefore, provide minimal heating of the plasma while causing damage to machine components. When comparing guiding-centre estimates of fast-ion losses against full-orbit estimates, it is found that the latter are always higher (Lazerson et al. Reference Lazerson2024). Additionally, a study of fast-ion losses in the presence of magnetic islands at the core of W7-X has been done, showing degradation of fast-ion confinement with increasing size of core magnetic islands (Lazerson et al. Reference Lazerson2024).
Similarly, in large helical device (LHD) plasmas, fast-ions are routinely produced by RF and NBI, and simulated using GC and FO Monte Carlo codes (Krasilnikov et al. Reference Krasilnikov2002; Ogawa et al. Reference Ogawa, Isobe, Toi, Shimizu, Spong, Osakabe and Yamamoto2013, Reference Ogawa, Isobe, Sangaroon, Liao, Zhong, Seki, Nuga and Osakabe2024). As in W7-X plasmas, it is found that trapped fast ions are more likely to get lost. Of particular interest are the studies of fast-ion dynamics in LHD showing robust fast-ion confinement in the presence of sawtooth-like activity (Moseev et al. Reference Moseev2024) and degradation of fast-ion confinement in the presence of toroidal Alfvén eigenmodes (TAE) with increasing TAE amplitudes (Ogawa et al. Reference Ogawa, Isobe, Toi, Shimizu, Spong, Osakabe and Yamamoto2013).
Alfvén eigenmodes (AEs) are plasma waves supported by the thermal plasma that can be destabilised by fusion-born ions in fusion reactors and subsequently provide enhanced fusion-born ion losses. AEs have been extensively studied in the past (Heidbrink Reference Heidbrink2008). Experimental confirmation of fusion-born alpha-particles destabilisation of toroidal Alfvén eigenmodes (TAE) in the latest JET DT plasmas was obtained (Fitzgerald et al. Reference Fitzgerald2023). Detailed analysis of TAE activity in LHD has been performed (Ogawa et al. Reference Ogawa, Isobe, Toi, Watanabe, Spong, Shimizu, Osakabe, Ohdachi and Sakakibara2010; Spong, D’Azevedo & Todo Reference Spong, D’Azevedo and Todo2010), showing a more complex structure of modes than that of tokamaks due to the more complex magnetic field structure of helical devices. For these analyses, stability codes including the 3-D structure of stellarator plasmas such as AE3D (Spong et al. Reference Spong, Sanchez and Weller2003), STELLGAP (Spong et al. Reference Spong, D’Azevedo and Todo2010) and FAR3d (Varela et al. Reference Varela, Spong, Garcia, Ghai and Ortiz2024d ) have been used.
Fast ions created by RF and neutral beams are relatively low energy (tens to few hundreds of keV) with respect to fusion-born 3.5 MeV alpha particles, and mainly interact with the background ions via collisions. In contrast, fusion-born alpha particles interact more strongly with background electrons. Fast ions from RF and NBI mainly heat background ions while fusion-born alpha particles mainly heat electrons. Also, fast ions in the tens of keV range might be more strongly influenced by electric fields in the plasma, while for alpha particles, these effects are much less relevant. Only in DT plasmas of the tokamak experiments TFTR and JET has it been possible to directly study fusion-born alpha-particle dynamics, and evidence of alpha heating of electrons has been observed (Hawryluk et al. Reference Hawryluk1994; Kiptily et al. Reference Kiptily2023).
Recent advancements in methods for designing and optimising stellarator power plants (Landreman Buller & Drevlak Reference Landreman, Buller and Drevlak2022; Sánchez et al. Reference Sánchez, Velasco, Calvo and Mulas2023; Goodman et al. Reference Goodman, Xanthopoulos, Plunk, Smith, Nührenberg, Beidler, Henneberg, Roberg-Clark, Drevlak and Helander2024) make it possible to achieve attractive confinement of fusion-born alpha particles along with all other desired properties for a stellarator FPP. In previous studies (Bader et al. Reference Bader, Anderson, Drevlak, Faber, Hegna, Henneberg, Landreman, Schmitt, Suzuki and Ware2021; Velasco et al. Reference Velasco, Calvo, Mulas, Sánchez, Parra and Cappa2021; Paul et al. Reference Paul, Bhattacharjee, Landreman, Alex, Velasco and Nies2022, Reference Paul, Mynick and Bhattacharjee2023; Sánchez et al. Reference Sánchez, Velasco, Calvo and Mulas2023), the authors have performed a detailed analysis of alpha-particle confinement in optimised reactor-scale stellarators. It is found that, in agreement with experimental measurements and interpretative simulations of fast ions in existing devices, trapped alpha particles dominate prompt losses in the studied devices. However, techniques have been developed in the stellarator optimisation community to overcome these losses.
In this work, we present a detailed analysis of fusion-born alpha-particle dynamics in the Type One Energy optimised stellarator, Infinity Two Fusion Pilot Plant baseline plasma design (Hegna et al. Reference Hegna2025). Energetic ion confinement was one of the major objectives in the optimisation strategy used to generate favourable configurations. The baseline Infinity Two design is a quasi-isodynamic (QI) stellarator whose good confinement is sought by seeking the alignment of the second adiabatic invariant $J = \int mv_{||} {\rm d}l$
with the flux surfaces. Additionally, Infinity Two was optimised by attempting to align both
$J = \int mv_{||} {\rm d}l$
with the flux surfaces. Additionally, Infinity Two was optimised by attempting to align both $B_{min}$
and
$B_{min}$
and $B_{max}$
values along the field line. That is,
$B_{max}$
values along the field line. That is, $B_{min}\ (B_{max})$
has a common value of the local minima (maxima) of
$B_{min}\ (B_{max})$
has a common value of the local minima (maxima) of $B$
along the field line. Alignment of local extrema (especially local minima) tends to be important for energetic particle confinement as well. Using a set of state-of-the-art codes, we show that good alpha-particle confinement and manageable wall loads can both be achieved in this device.
$B$
along the field line. Alignment of local extrema (especially local minima) tends to be important for energetic particle confinement as well. Using a set of state-of-the-art codes, we show that good alpha-particle confinement and manageable wall loads can both be achieved in this device.
We use the SIMPLE, ASCOT5 and KORC-T Monte Carlo codes to simulate collisionless and collisional GC and FO simulations of fusion-born ions in Infinity Two. We use the SIMPLE code (Albert, Kasilov & Kernbichler Reference Albert, Kasilov and Kernbichler2020) to perform collisionless GC simulations of alpha particles in a free-boundary VMEC equilibrium (Hirshman van Rij & Merkel Reference Hirshman, van Rij and Merkel1986) of Infinity Two. The ASCOT5 code is a validated Monte Carlo code that has been extensively used in interpretative and predictive modelling of fast-ion dynamics in tokamaks (Heikkinen et al. Reference Heikkinen, Kiviniemi, Peeters, Kurki-Suonio, Sipilä, Herrmann, Suttrop and Zohm1998, Reference Heikkinen, Kiviniemi, Kurki-Suonio, Peeters and Sipilä2001; Kurki-Suonio et al. Reference Kurki-Suonio, Kiviniemi, Sipilä, Heikkinen, Fundamenski, Matthews and Riccardo2002; Hynönen et al. Reference Hynönen, Kurki-Suonio, Suttrop, Dux and Sugiyama2007; Kurki-Suonio et al. Reference Kurki-Suonio2009; Snicker, Sipilä & Kurki-Suonio Reference Snicker, Sipilä and Kurki-Suonio2012) and stellarators (Äkäslompolo et al. Reference Äkäslompolo, Drevlak, Turkin, Bozhenkov, Jesche, Kontula, Kurki-Suonio and Wolf2018). KORC-T is an open-source code that has been used to study the relativistic dynamics of runaway electrons in tokamaks (Carbajal et al. Reference Carbajal, del Castillo-Negrete, Spong, Seal and Baylor2017; Carbajal & Del-Castillo-Negrete Reference Carbajal and Del-Castillo-Negrete2017; Del-Castillo-Negrete et al. Reference Del-Castillo-Negrete, Carbajal, Spong and Izzo2018; Paz-Soldan et al. Reference Paz-Soldan2019) and, more recently, the fast-ion dynamics in the presence of magnetic islands in toroidal plasmas (Martinell & Carbajal Reference Martinell and Carbajal2022). We perform a benchmark between SIMPLE and ASCOT5 codes to compare estimates of collisionless alpha-particle losses and to identify the dominant loss mechanisms. Alpha particles in ASCOT5 and KORC-T simulations are initialised in 3-D space according to DT fusion-reactivity profiles consistent with plasma profiles (Bosch & Hale Reference Bosch and Hale1992). We use the AFSI code built into the Monte Carlo ASCOT5 code to generate the initial spatial and velocity distribution of fusion-born alpha particles. An extension to include finite Larmor effects in our analysis is done by simulating FO fusion-born alpha particles with ASCOT5 and KORC-T. Unlike ASCOT5, KORC-T does not possess a capability to include a model for the wall; thus, we only compare estimates of particle and energy losses at the plasma boundary as defined by the last closed flux surface (LCFS) of the free-boundary VMEC equilibrium. In both ASCOT5 and KORC-T simulations, we use 3-D magnetic fields that include the vacuum magnetic fields and the finite- $\beta$
plasma contribution to the magnetic fields, encompassing the core plasma and the region between the LCFS and the wall. These are computed by the BMW code (Cianciosa Reference Cianciosa2024).
$\beta$
plasma contribution to the magnetic fields, encompassing the core plasma and the region between the LCFS and the wall. These are computed by the BMW code (Cianciosa Reference Cianciosa2024).
In the analysis of power loads to the walls of Infinity Two, we use four models for the wall to assess the effect of wall shaping and its separation from the plasma on power loads due to alpha particles. The first of these models is the standard Infinity Two wall (ITW), which is generated by computing a conformal envelope of the plasma that includes the magnetic islands of the island-divertor design of Infinity Two at the edge. The other three models use three-dimensional extensions of the LCFS as defined by a free-boundary VMEC equilibrium, each with different separation from the LCFS. To study the effect of collisionality at the scrape-off layer (SOL) on power loads to the wall, we modify the plasma density and temperature profiles (Killer et al. Reference Killer, Grulke, Drews, Gao, Jakubowski, Knieps, Nicolai, Niemann, Sitjes and Satheeswaran2019) at the SOL of Infinity Two plasmas. More complex effects at the SOL, such as the poloidal variation due to the island structure, the inclusion of neutrals or $E\times B$
drifts (Kriete et al. Reference Kriete2023), are not included in this work.
$E\times B$
drifts (Kriete et al. Reference Kriete2023), are not included in this work.
Finally, we assess the stability of alpha-particle-driven AE activity in Infinity Two using the STELLGAP and FAR3d codes. For this, we use STELLGAP to compute the Alfvén continuum given by the profiles of the thermal plasma of Infinity Two. This analysis allows us to find the location in radius and frequency of Alfvén gaps in the plasma. Next, the stability analysis of AE occurring in these Alfvén gaps is performed using the FAR3d code. The slowing-down alpha-particle distribution obtained from ASCOT5 simulations is used for this calculation.
This paper is organised as follows. In § 2, we describe the basic properties of Infinity Two stellarator design. In § 3, estimates of the core particle and energy confinement of alpha particles present in the Infinity FPP are provided based on orbit calculations. From these calculations, estimates for power loads on the walls are provided in § 4. In § 5, the stability properties of Infinity Two with respect to Alfvén eigenmodes are addressed. Finally, a discussion of the major results from this work is provided in § 6.
2. Properties of Infinity Two stellarator design
In this work, we evaluate alpha-particle transport and confinement in the Infinity Two FPP baseline plasma physics design (Hegna et al. Reference Hegna2025). Infinity Two is a quasi-isodynamic (QI) (Helander Reference Helander2014) four-field-period stellarator designed for reactor conditions. Plasma parameters used for this evaluation (Guttenfelder et al. Reference Guttenfelder2025) include the peak electron density and temperature at the magnetic axis $n_{e,0} = 2.5\times 10^{20}$
m
$n_{e,0} = 2.5\times 10^{20}$
m $^{-3}$
and
$^{-3}$
and $T_{e,0}=17.5$
keV, a 50–50 D–T mix, and an assumed 5 % He ash. This corresponds to a volume-average thermal plasma
$T_{e,0}=17.5$
keV, a 50–50 D–T mix, and an assumed 5 % He ash. This corresponds to a volume-average thermal plasma $\langle \beta \rangle = 1.6\,\%$
and alpha-particle beta
$\langle \beta \rangle = 1.6\,\%$
and alpha-particle beta $\langle \beta _{\alpha } \rangle = 0.31\,\%$
, with an alpha-particle power of
$\langle \beta _{\alpha } \rangle = 0.31\,\%$
, with an alpha-particle power of $P_{\alpha }=158$
MW corresponding to a fusion power of
$P_{\alpha }=158$
MW corresponding to a fusion power of $P_{fus}\approx 790$
MW. The major and minor radii of this configuration are
$P_{fus}\approx 790$
MW. The major and minor radii of this configuration are $R_0 = 12.5$
m and
$R_0 = 12.5$
m and $a = 1.25$
m. However, for this study, we describe a confinement zone (with topologically toroidal flux surfaces) for a somewhat smaller plasma (with
$a = 1.25$
m. However, for this study, we describe a confinement zone (with topologically toroidal flux surfaces) for a somewhat smaller plasma (with $a_{eff} = 1.1$
m) from a free boundary VMEC calculation and use BMW to describe the fields outside this region which includes the presence of an
$a_{eff} = 1.1$
m) from a free boundary VMEC calculation and use BMW to describe the fields outside this region which includes the presence of an $N/M = 4/5$
divertor magnetic island.
$N/M = 4/5$
divertor magnetic island.
Plasma profiles of Infinity Two. Electron and ion density and temperature profiles using constant values at the SOL, $n_{SOL}=n_{LCFS}$
and
$n_{SOL}=n_{LCFS}$
and $T_{SOL}=T_{LCFS}$
, are shown with solid lines. Profiles using an exponential radial decay at the SOL,
$T_{SOL}=T_{LCFS}$
, are shown with solid lines. Profiles using an exponential radial decay at the SOL, $n_{SOL}=n(\rho )$
and
$n_{SOL}=n(\rho )$
and $T_{SOL}=T(\rho )$
, are shown with dashed lines. We only show deuterium density profiles since tritium profiles are the same in this 50–50 D–T plasma. Radial profiles of alpha-particle power density,
$T_{SOL}=T(\rho )$
, are shown with dashed lines. We only show deuterium density profiles since tritium profiles are the same in this 50–50 D–T plasma. Radial profiles of alpha-particle power density, $\mathcal {P}_\alpha$
, and cumulative alpha-particle power,
$\mathcal {P}_\alpha$
, and cumulative alpha-particle power, $P_\alpha$
, are the same for both flat and radially decaying profiles at the SOL. The slowing-down time of alpha particles,
$P_\alpha$
, are the same for both flat and radially decaying profiles at the SOL. The slowing-down time of alpha particles, $\tau _{S_\alpha }$
, spans several time scales from milliseconds to seconds.
$\tau _{S_\alpha }$
, spans several time scales from milliseconds to seconds.
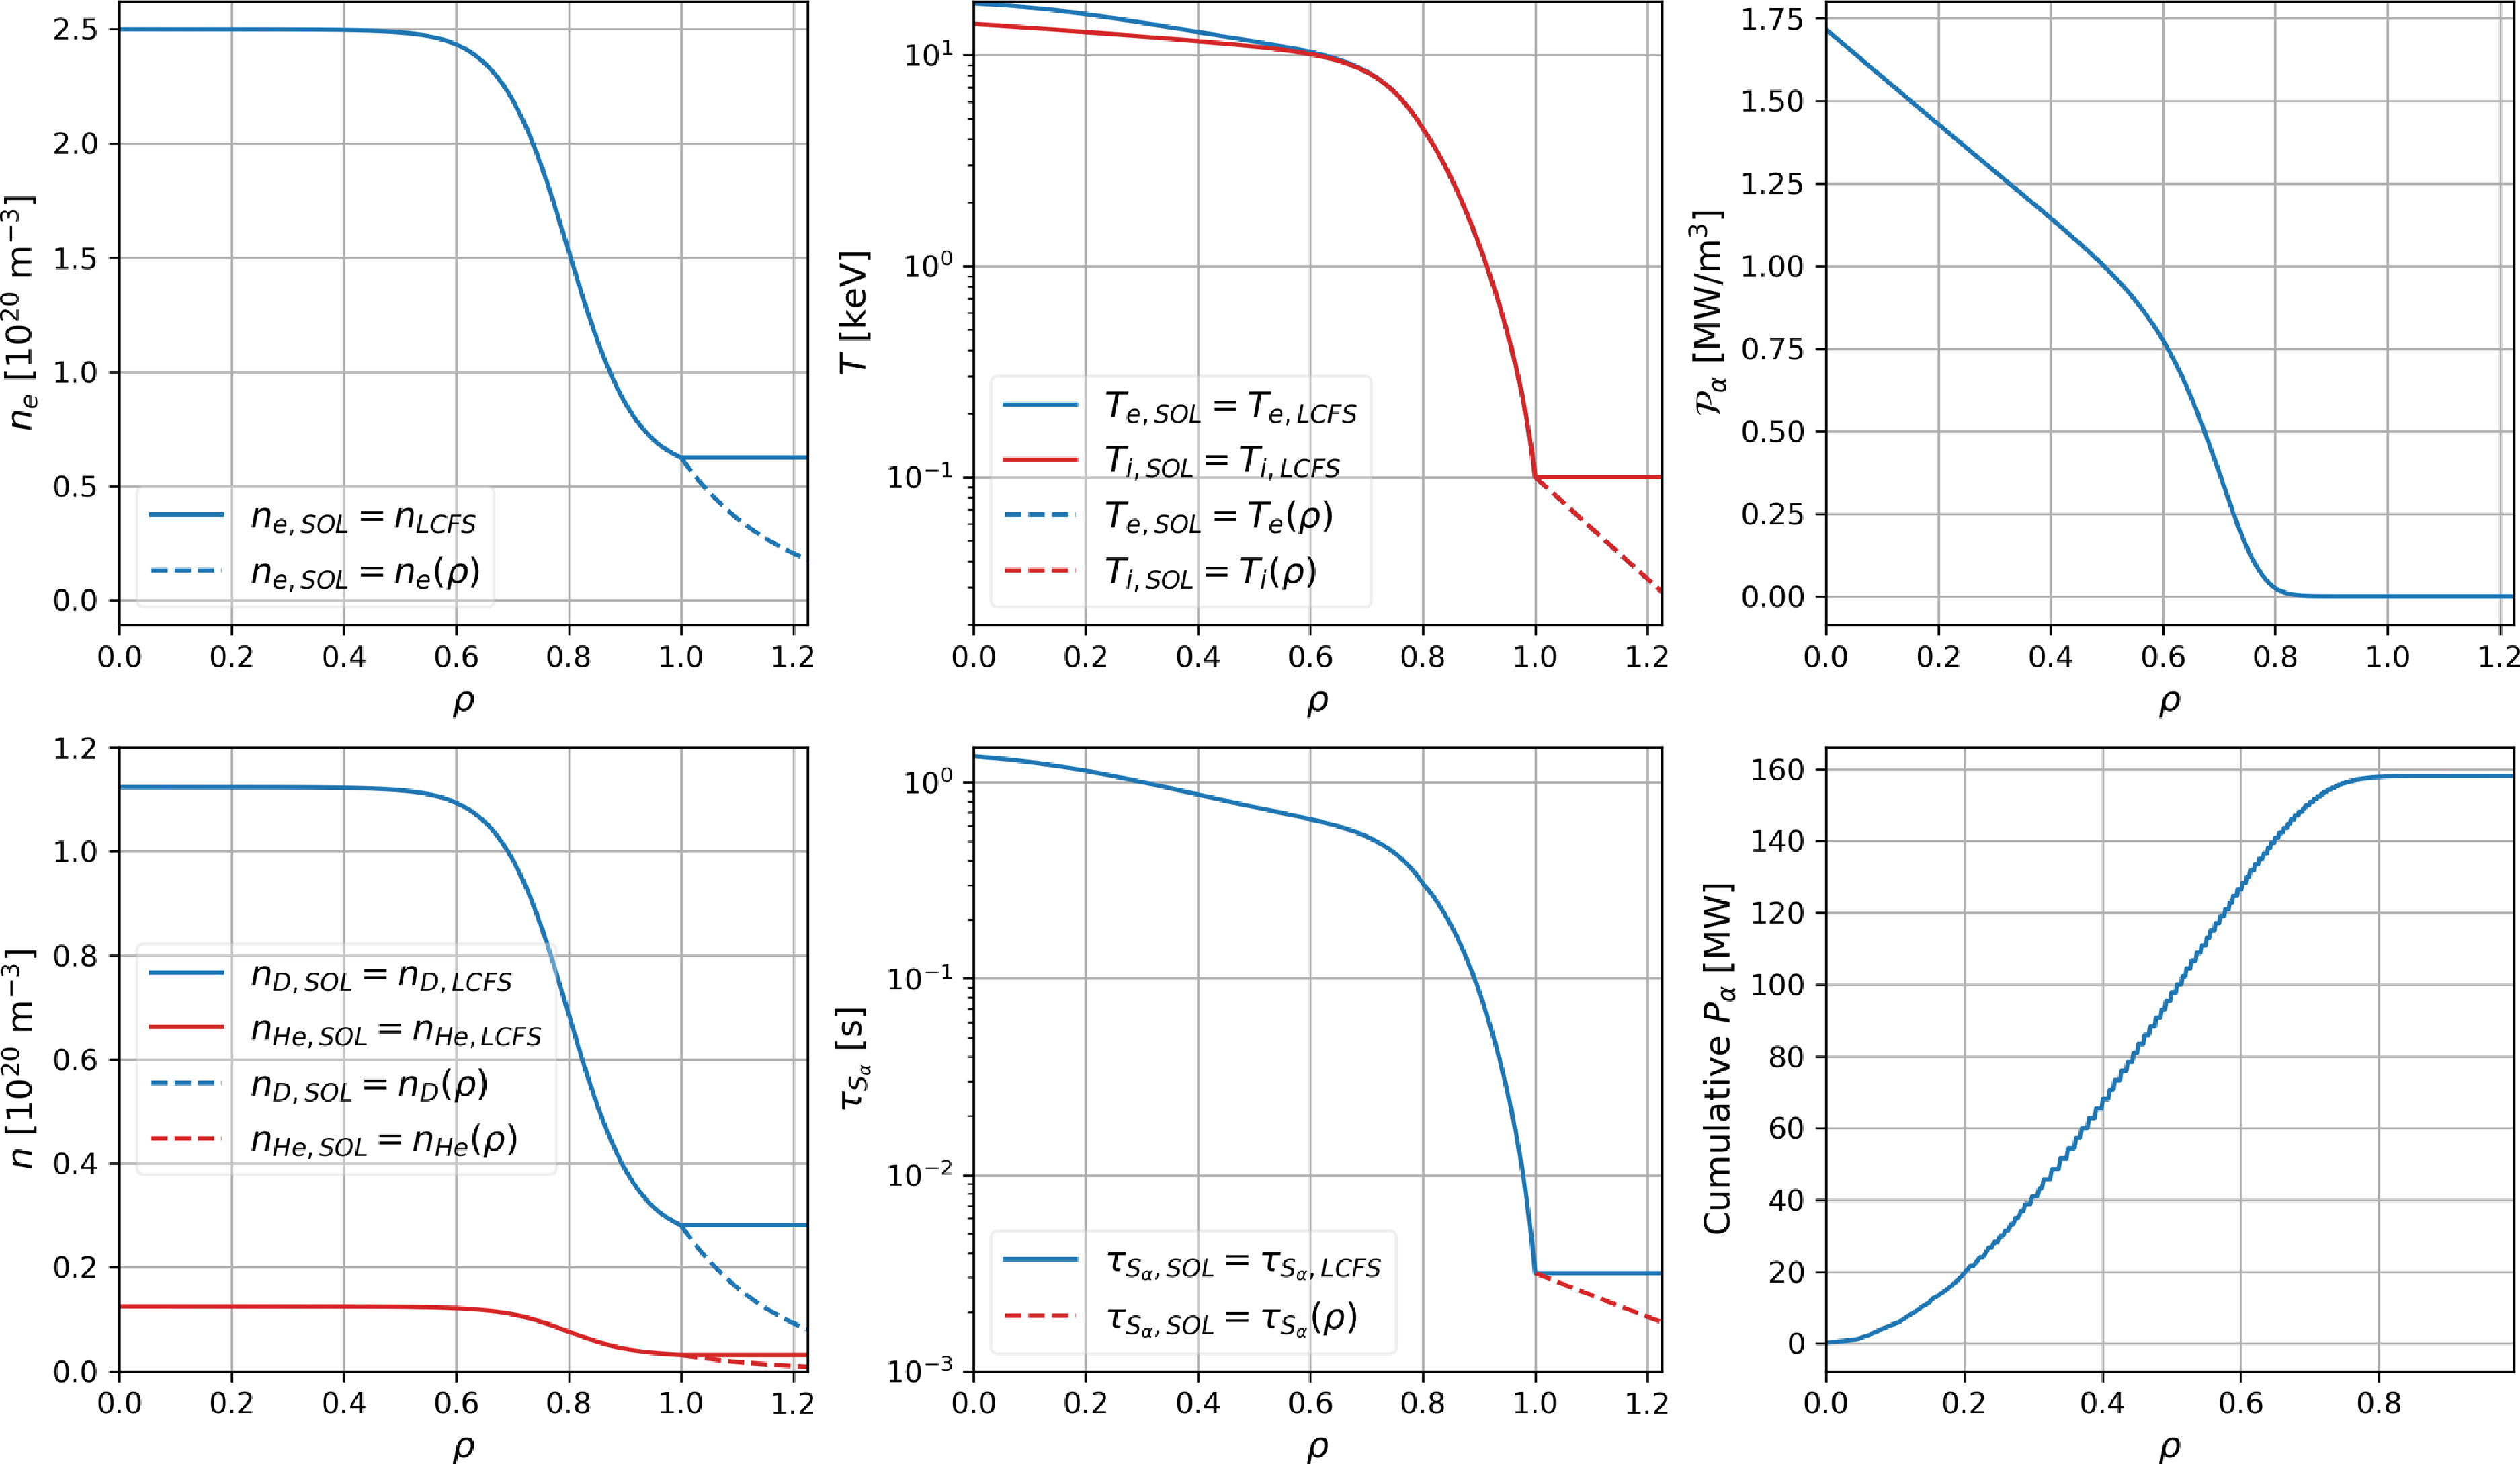
In figure 1, we show the plasma profiles as function of the normalised radius, $\rho$
. Here,
$\rho$
. Here, $\rho =r/a=\sqrt {\psi /\psi _{LCFS}}$
, with
$\rho =r/a=\sqrt {\psi /\psi _{LCFS}}$
, with $\psi$
the toroidal magnetic flux and
$\psi$
the toroidal magnetic flux and $\psi _{LCFS}$
the toroidal magnetic flux at the LCFS. This plasma has a relatively flat density profile at the core and concentrated alpha-particle power at
$\psi _{LCFS}$
the toroidal magnetic flux at the LCFS. This plasma has a relatively flat density profile at the core and concentrated alpha-particle power at $\rho \leq 0.7$
from fusion reactions following thermal plasma profiles. Additionally,
$\rho \leq 0.7$
from fusion reactions following thermal plasma profiles. Additionally, $P_{\alpha }$
is computed using Bosch–Hale reactivity of D–T plasmas (Bosch & Hale Reference Bosch and Hale1992). Note that the plasma profiles beyond the LCFS at
$P_{\alpha }$
is computed using Bosch–Hale reactivity of D–T plasmas (Bosch & Hale Reference Bosch and Hale1992). Note that the plasma profiles beyond the LCFS at $\rho =1$
, that is, in the SOL, are kept constant in this simplified model. In other words, density, temperature and other plasma parameters at the SOL use the constant value found at the LCFS. This means constant collisionality for alpha particles from the LCFS (magenta) up to the location of the wall, shown in figure 2. During operation, the fast-ion particles will actually travel through a very cold and dense region in the magnetic islands before passing into the far SOL. In this work, we did not attempt to self-consistently simulate the helically non-uniform edge structure but instead, we analyse the sensitivity of the results to the SOL conditions by varying the plasma conditions.
$\rho =1$
, that is, in the SOL, are kept constant in this simplified model. In other words, density, temperature and other plasma parameters at the SOL use the constant value found at the LCFS. This means constant collisionality for alpha particles from the LCFS (magenta) up to the location of the wall, shown in figure 2. During operation, the fast-ion particles will actually travel through a very cold and dense region in the magnetic islands before passing into the far SOL. In this work, we did not attempt to self-consistently simulate the helically non-uniform edge structure but instead, we analyse the sensitivity of the results to the SOL conditions by varying the plasma conditions.
Poincaré sections of (a) vacuum and (b) finite- $\beta$
magnetic fields of Infinity Two at half-field period,
$\beta$
magnetic fields of Infinity Two at half-field period, $\phi =45^\circ$
. The magenta line and red cross represent the LCFS and magnetic axis location, respectively, as obtained from the free-boundary VMEC equilibrium. The red dashed line show the location of the standard Infinity Two wall. The blue dashed lines show the location of the walls obtained from three-dimensional extensions of the LCFS. We observe a small Shafranov shift in the finite-
$\phi =45^\circ$
. The magenta line and red cross represent the LCFS and magnetic axis location, respectively, as obtained from the free-boundary VMEC equilibrium. The red dashed line show the location of the standard Infinity Two wall. The blue dashed lines show the location of the walls obtained from three-dimensional extensions of the LCFS. We observe a small Shafranov shift in the finite- $\beta$
magnetic field, seen on this poloidal section as a displacement of flux surfaces (black markers) towards the outboard side of Infinity Two. This is visible by comparing the location of flux surfaces in both cases with respect to the LCFS and the magnetic axis.
$\beta$
magnetic field, seen on this poloidal section as a displacement of flux surfaces (black markers) towards the outboard side of Infinity Two. This is visible by comparing the location of flux surfaces in both cases with respect to the LCFS and the magnetic axis.
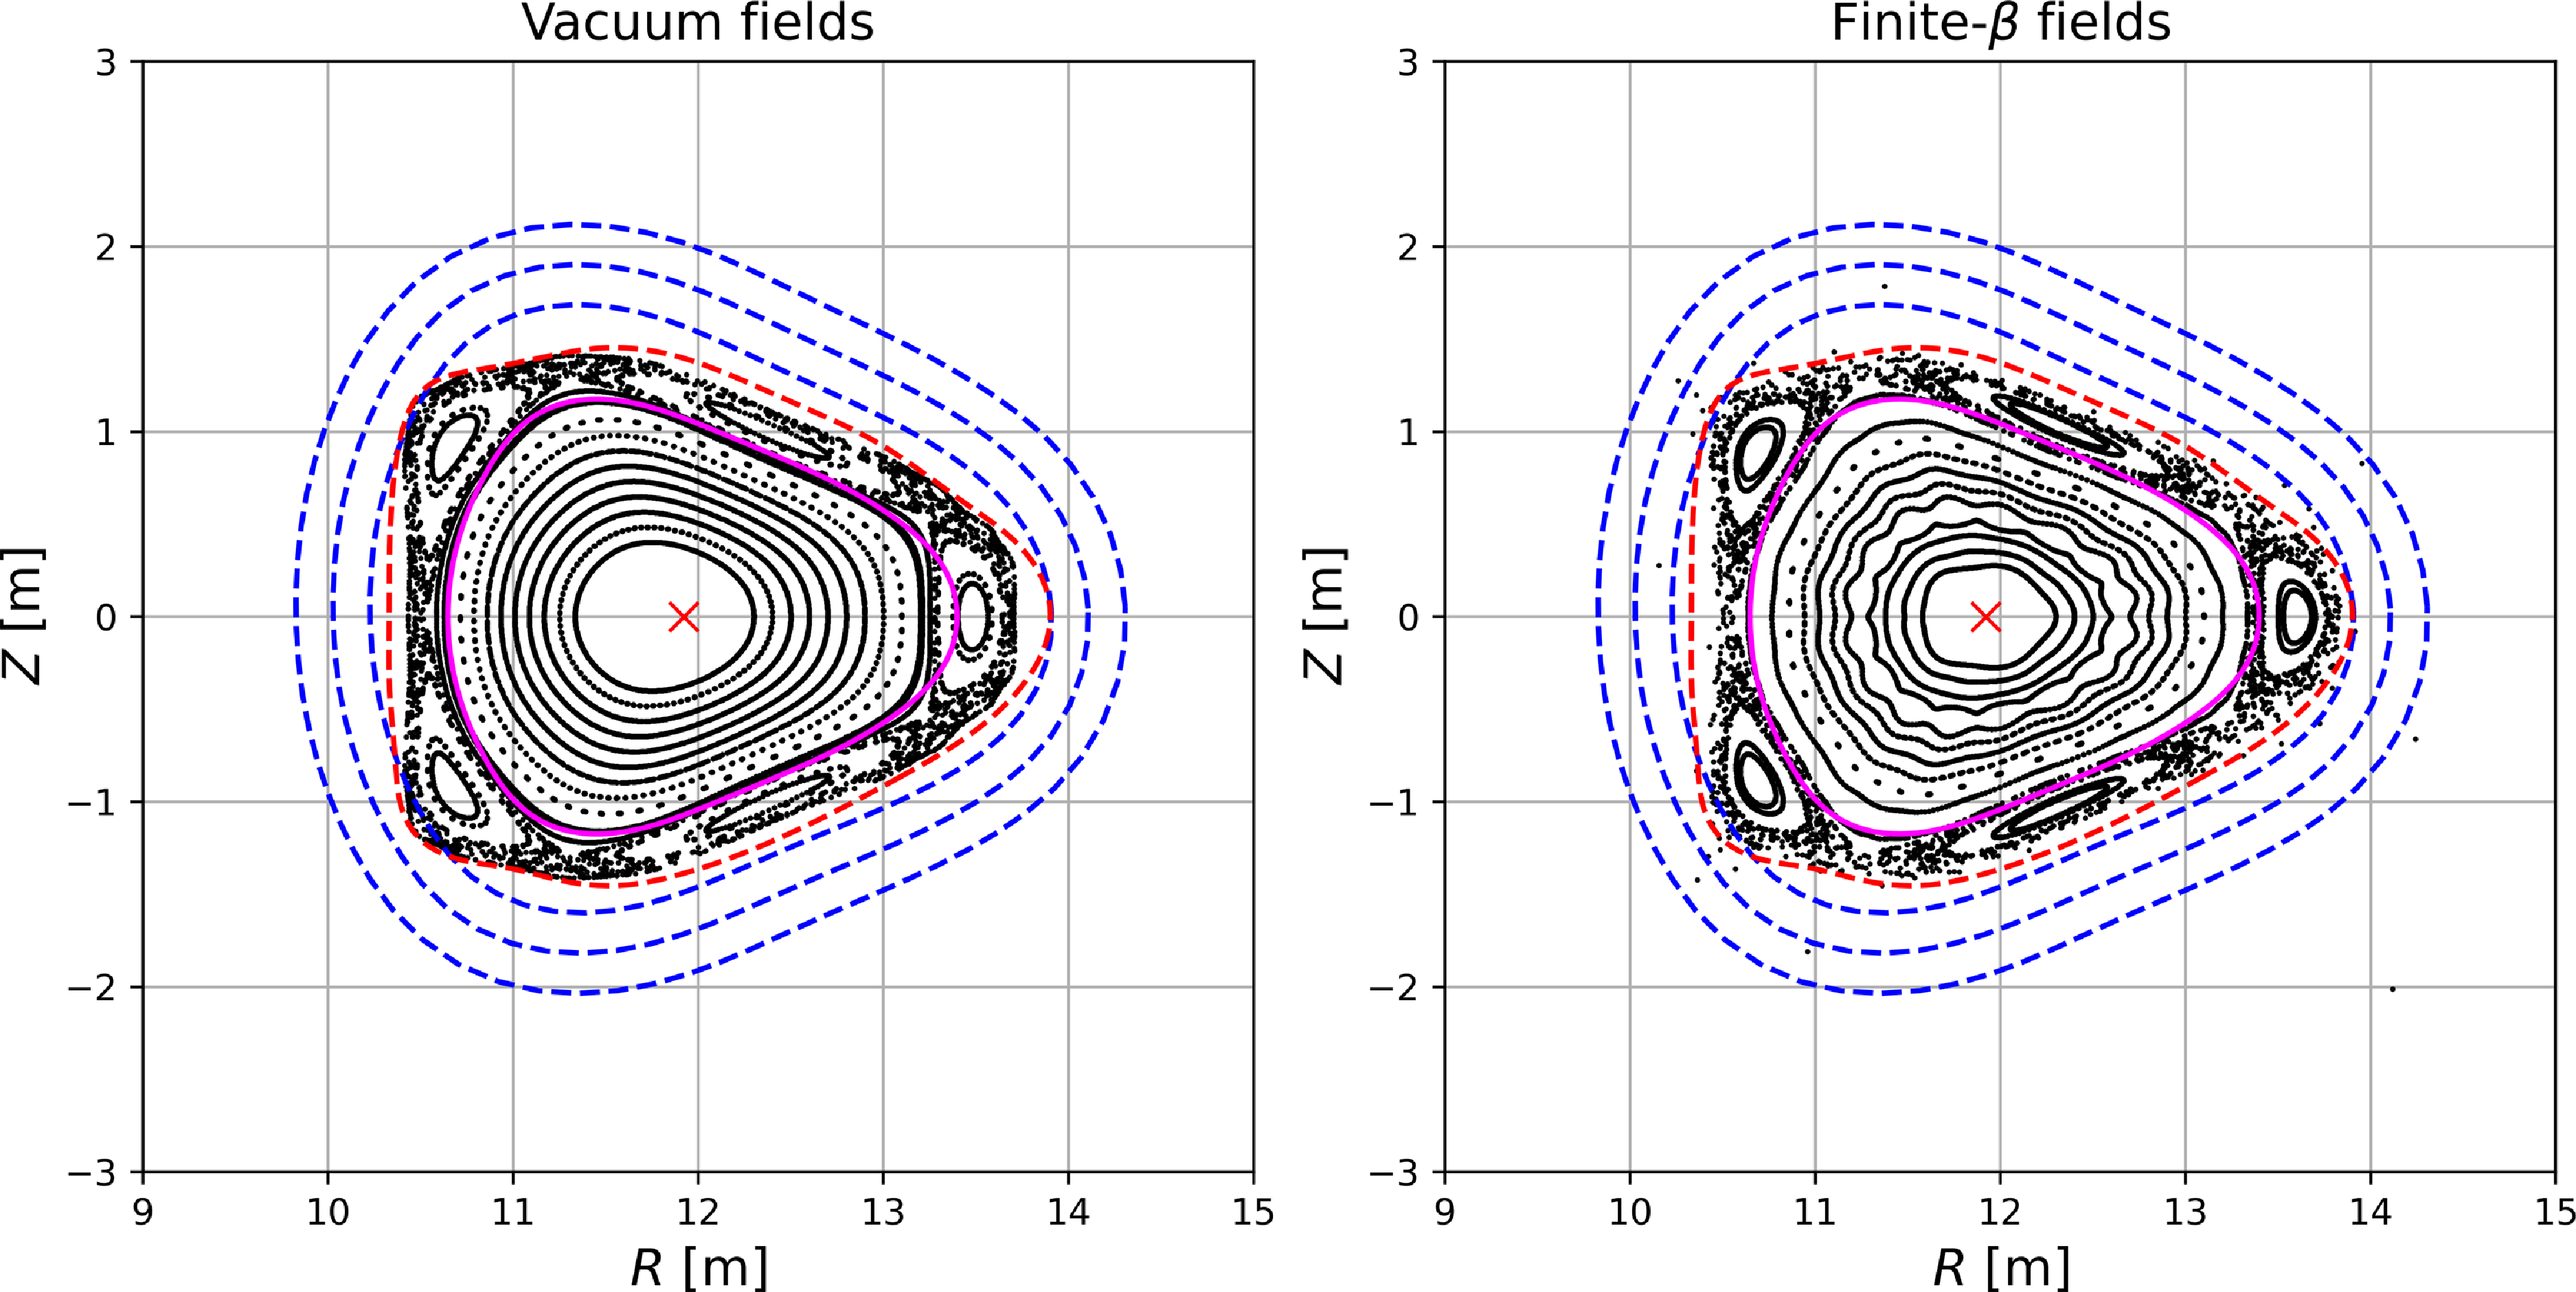
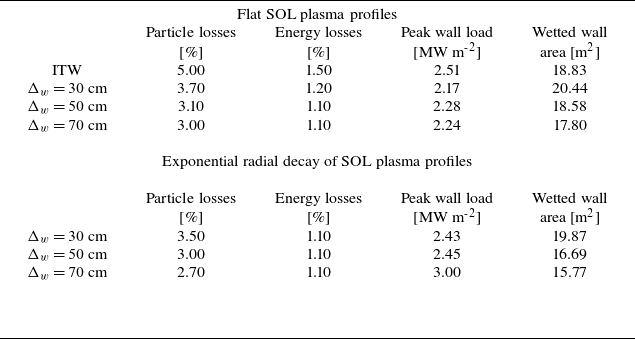
For analysing the sensitivity of our results on wall loads to SOL conditions, we generate an additional model for the plasma that includes an exponential radial decay of the plasma profiles in the SOL, see figure 1. That is, density and temperature profiles in the SOL have the following radial dependence:
 \begin{eqnarray} T(\rho ) & = & T_{LCFS}\exp {\left ( -\rho /\lambda '\right ) }, \end{eqnarray}
 \begin{eqnarray} n(\rho ) & = & n_{LCFS}\exp {\left ( -\rho /\lambda '\right ) }, \end{eqnarray}
where $\lambda ' = \lambda /a$
is the normalised radial decay length of the SOL and
$\lambda ' = \lambda /a$
is the normalised radial decay length of the SOL and $\lambda$
is chosen to be of the order of
$\lambda$
is chosen to be of the order of $\lambda \sim 10$
cm. This value allows us to assess both alpha-particle transport and wall loads in a different collisionality regime (with respect to flat profiles at the SOL) and to obtain sensible values of plasma density
$\lambda \sim 10$
cm. This value allows us to assess both alpha-particle transport and wall loads in a different collisionality regime (with respect to flat profiles at the SOL) and to obtain sensible values of plasma density $n\sim 10^{18}$
m
$n\sim 10^{18}$
m $^{-3}$
and temperature
$^{-3}$
and temperature $T\sim 1$
eV at the location of the farthest wall (outermost dashed line in figure 2). Notice that this radial decay of the plasma profiles is uniform along the helical direction, in contrast to the actual configuration which has a high degree of helical dependence due to the magnetic island.
$T\sim 1$
eV at the location of the farthest wall (outermost dashed line in figure 2). Notice that this radial decay of the plasma profiles is uniform along the helical direction, in contrast to the actual configuration which has a high degree of helical dependence due to the magnetic island.
We use the above models for the plasma to assess core confinement of alpha particles and to obtain estimates of wall loads from alpha particles leaving the core and ultimately hitting any of the walls shown in figure 2. Note that in these walls, the divertor components were not included. In figure 2, we also show Poincaré sections of the vacuum (panel a) and finite- $\beta$
(panel b) magnetic fields for this configuration at half-field period, that is, at
$\beta$
(panel b) magnetic fields for this configuration at half-field period, that is, at $\phi =45^\circ$
. The vacuum magnetic field is computed using currents in the coils of Infinity Two. The finite-
$\phi =45^\circ$
. The vacuum magnetic field is computed using currents in the coils of Infinity Two. The finite- $\beta$
fields include the response from the plasma in addition to the vacuum magnetic fields. This is computed via the Biot–Savart Magnetic VMEC Vector-potential (BMW) code (Cianciosa Reference Cianciosa2024; Frerichs Reference Frerichs2024). The BMW code uses Biot–Savart integration of the equilibrium current density to obtain a continuous magnetic vector potential everywhere. By combining the vacuum and plasma portions of the vector potential, the resulting total magnetic field can be evaluated from
$\beta$
fields include the response from the plasma in addition to the vacuum magnetic fields. This is computed via the Biot–Savart Magnetic VMEC Vector-potential (BMW) code (Cianciosa Reference Cianciosa2024; Frerichs Reference Frerichs2024). The BMW code uses Biot–Savart integration of the equilibrium current density to obtain a continuous magnetic vector potential everywhere. By combining the vacuum and plasma portions of the vector potential, the resulting total magnetic field can be evaluated from $\nabla \times \textbf {A}=\textbf {B}$
at any point in space (even beyond the VMEC boundary) and ensures divergence-free fields.
$\nabla \times \textbf {A}=\textbf {B}$
at any point in space (even beyond the VMEC boundary) and ensures divergence-free fields.
SIMPLE simulations are collisionless, guiding-centre calculations used to provide a first estimate of alpha-particle losses in optimised configurations. Once a particular configuration is found to have promising alpha-particle confinement, a more detailed and computational-expensive analysis follows using other set of codes such as ASCOT5 and KORC-T. The magnetic field for SIMPLE simulations is provided by a VMEC equilibrium. Particles are sourced on a single flux surface by selecting random locations along a field line. Each particle is given an isotropic starting velocity. Particles are followed until they either leave the LCFS indicating a lost particle or until a set amount of time has elapsed. We follow these alpha particles in time for 0.1 s, which is enough time for analysing prompt losses. SIMPLE simulations showed very low alpha-particle losses. Only 0.4 % of the launched particles reached the LCFS.
SIMPLE is extremely quick to run and therefore can provide results for a vast number of equilibria. However, while useful to verify a baseline of good confinement, these simulations are insufficient to characterise how a configuration will perform in realistic conditions. A more detailed analysis, including a proper 3-D birth distribution of alphas, the effect of collisions and full-orbit effects, is conducted to obtain more robust estimates of particle and energy losses of fusion-born alpha particles as well as estimates of wall loads. This is presented in the following sections.
3. Core particle and energy confinement
In this section, we present an assessment of particle and energy confinement of fusion-born alpha particles in Infinity Two core plasmas.
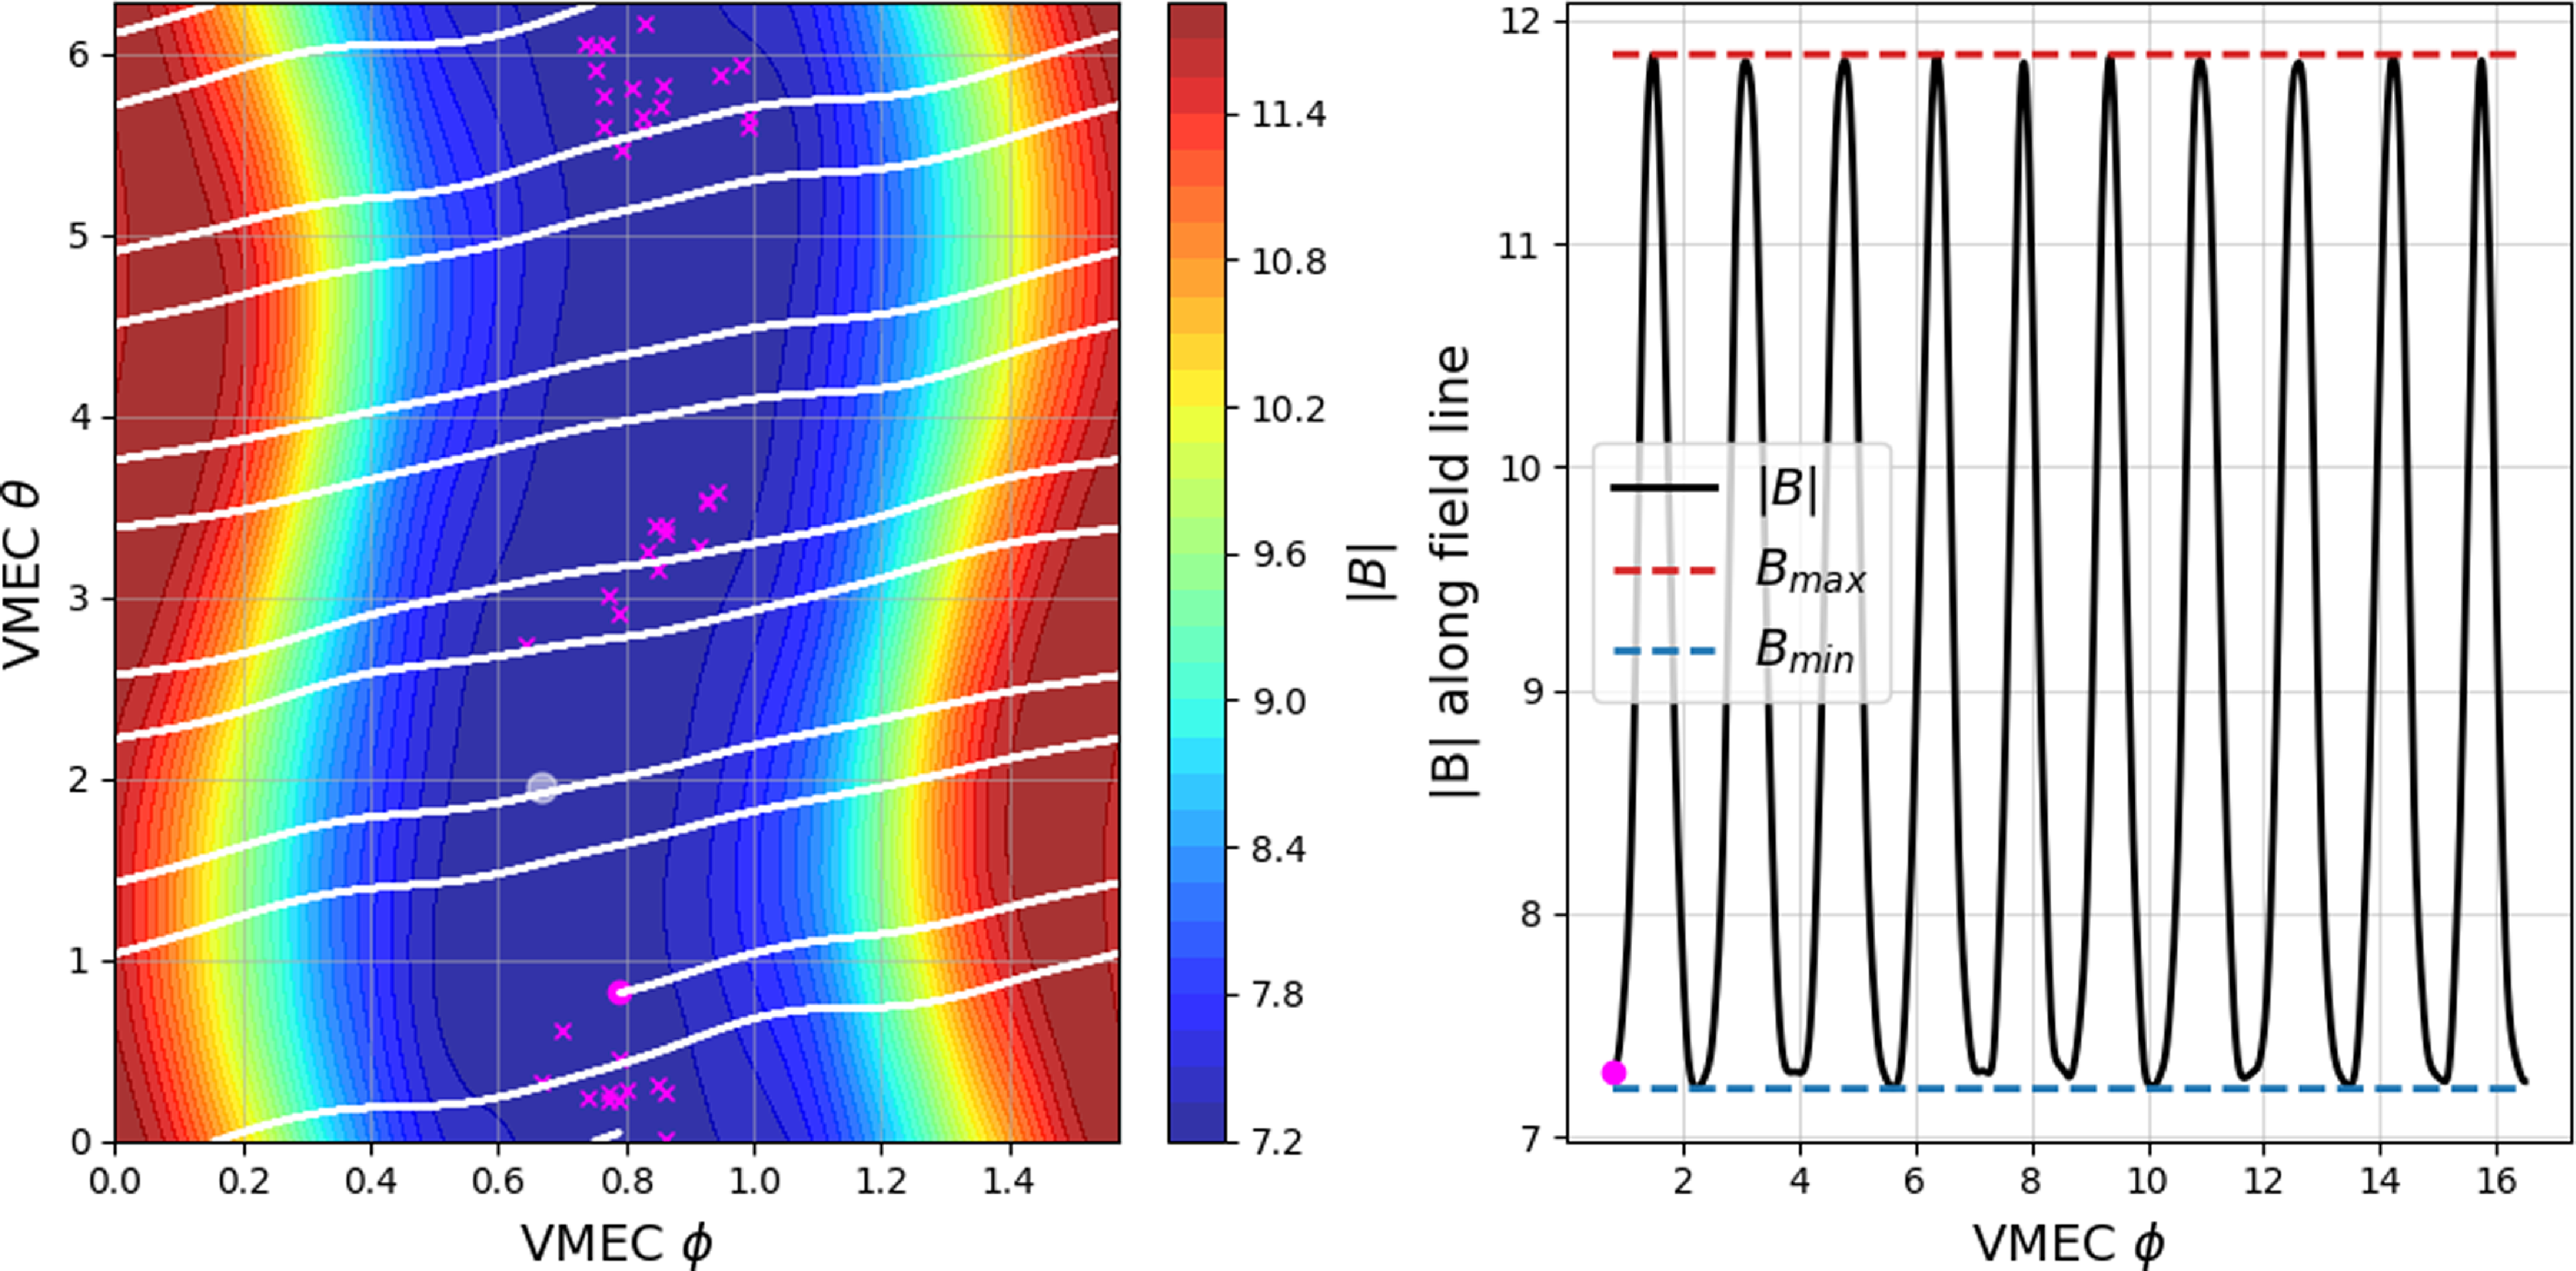
In figure 3, we show the initial location in the $\theta \phi$
-plane in VMEC coordinates of lost alpha particles in a SIMPLE simulation of Infinity Two. These alpha particles are initialised at
$\theta \phi$
-plane in VMEC coordinates of lost alpha particles in a SIMPLE simulation of Infinity Two. These alpha particles are initialised at $\rho =0.55$
. As can be seen from this figure, all lost particles are located in a region of relatively low magnetic field,
$\rho =0.55$
. As can be seen from this figure, all lost particles are located in a region of relatively low magnetic field, $|B|$
, indicating the poor orbits are due to deeply trapped particles. One of the design principles of Infinity Two is the alignment of
$|B|$
, indicating the poor orbits are due to deeply trapped particles. One of the design principles of Infinity Two is the alignment of $B_{min}$
(and
$B_{min}$
(and $B_{max}$
) along the field as this provides robust collisionless guiding centre orbit confinement. As shown in figure 3(b
), which shows a plot of
$B_{max}$
) along the field as this provides robust collisionless guiding centre orbit confinement. As shown in figure 3(b
), which shows a plot of $|B|$
along the field, this design goal is largely produced. However, not all of the local
$|B|$
along the field, this design goal is largely produced. However, not all of the local $B_{min}$
locations are perfectly aligned. In these regions, particles can be locally trapped with a non-zero bounce averaged radial drift.
$B_{min}$
locations are perfectly aligned. In these regions, particles can be locally trapped with a non-zero bounce averaged radial drift.
(a) Isosurfaces of the magnitude of the magnetic field $|B|$
at the flux surface
$|B|$
at the flux surface $\rho =0.55$
and an example of a magnetic field line starting in the well region (white trace). Initial location of simulated lost particles in Infinity Two are shown with magenta crosses. (b) Same magnetic field line as in panel (a) as a function of the toroidal angle (VMEC
$\rho =0.55$
and an example of a magnetic field line starting in the well region (white trace). Initial location of simulated lost particles in Infinity Two are shown with magenta crosses. (b) Same magnetic field line as in panel (a) as a function of the toroidal angle (VMEC $\phi$
coordinate). Red and blue dashed lines show the global maximum and minimum values of
$\phi$
coordinate). Red and blue dashed lines show the global maximum and minimum values of $|B|$
at
$|B|$
at $\rho =0.55$
.
$\rho =0.55$
.
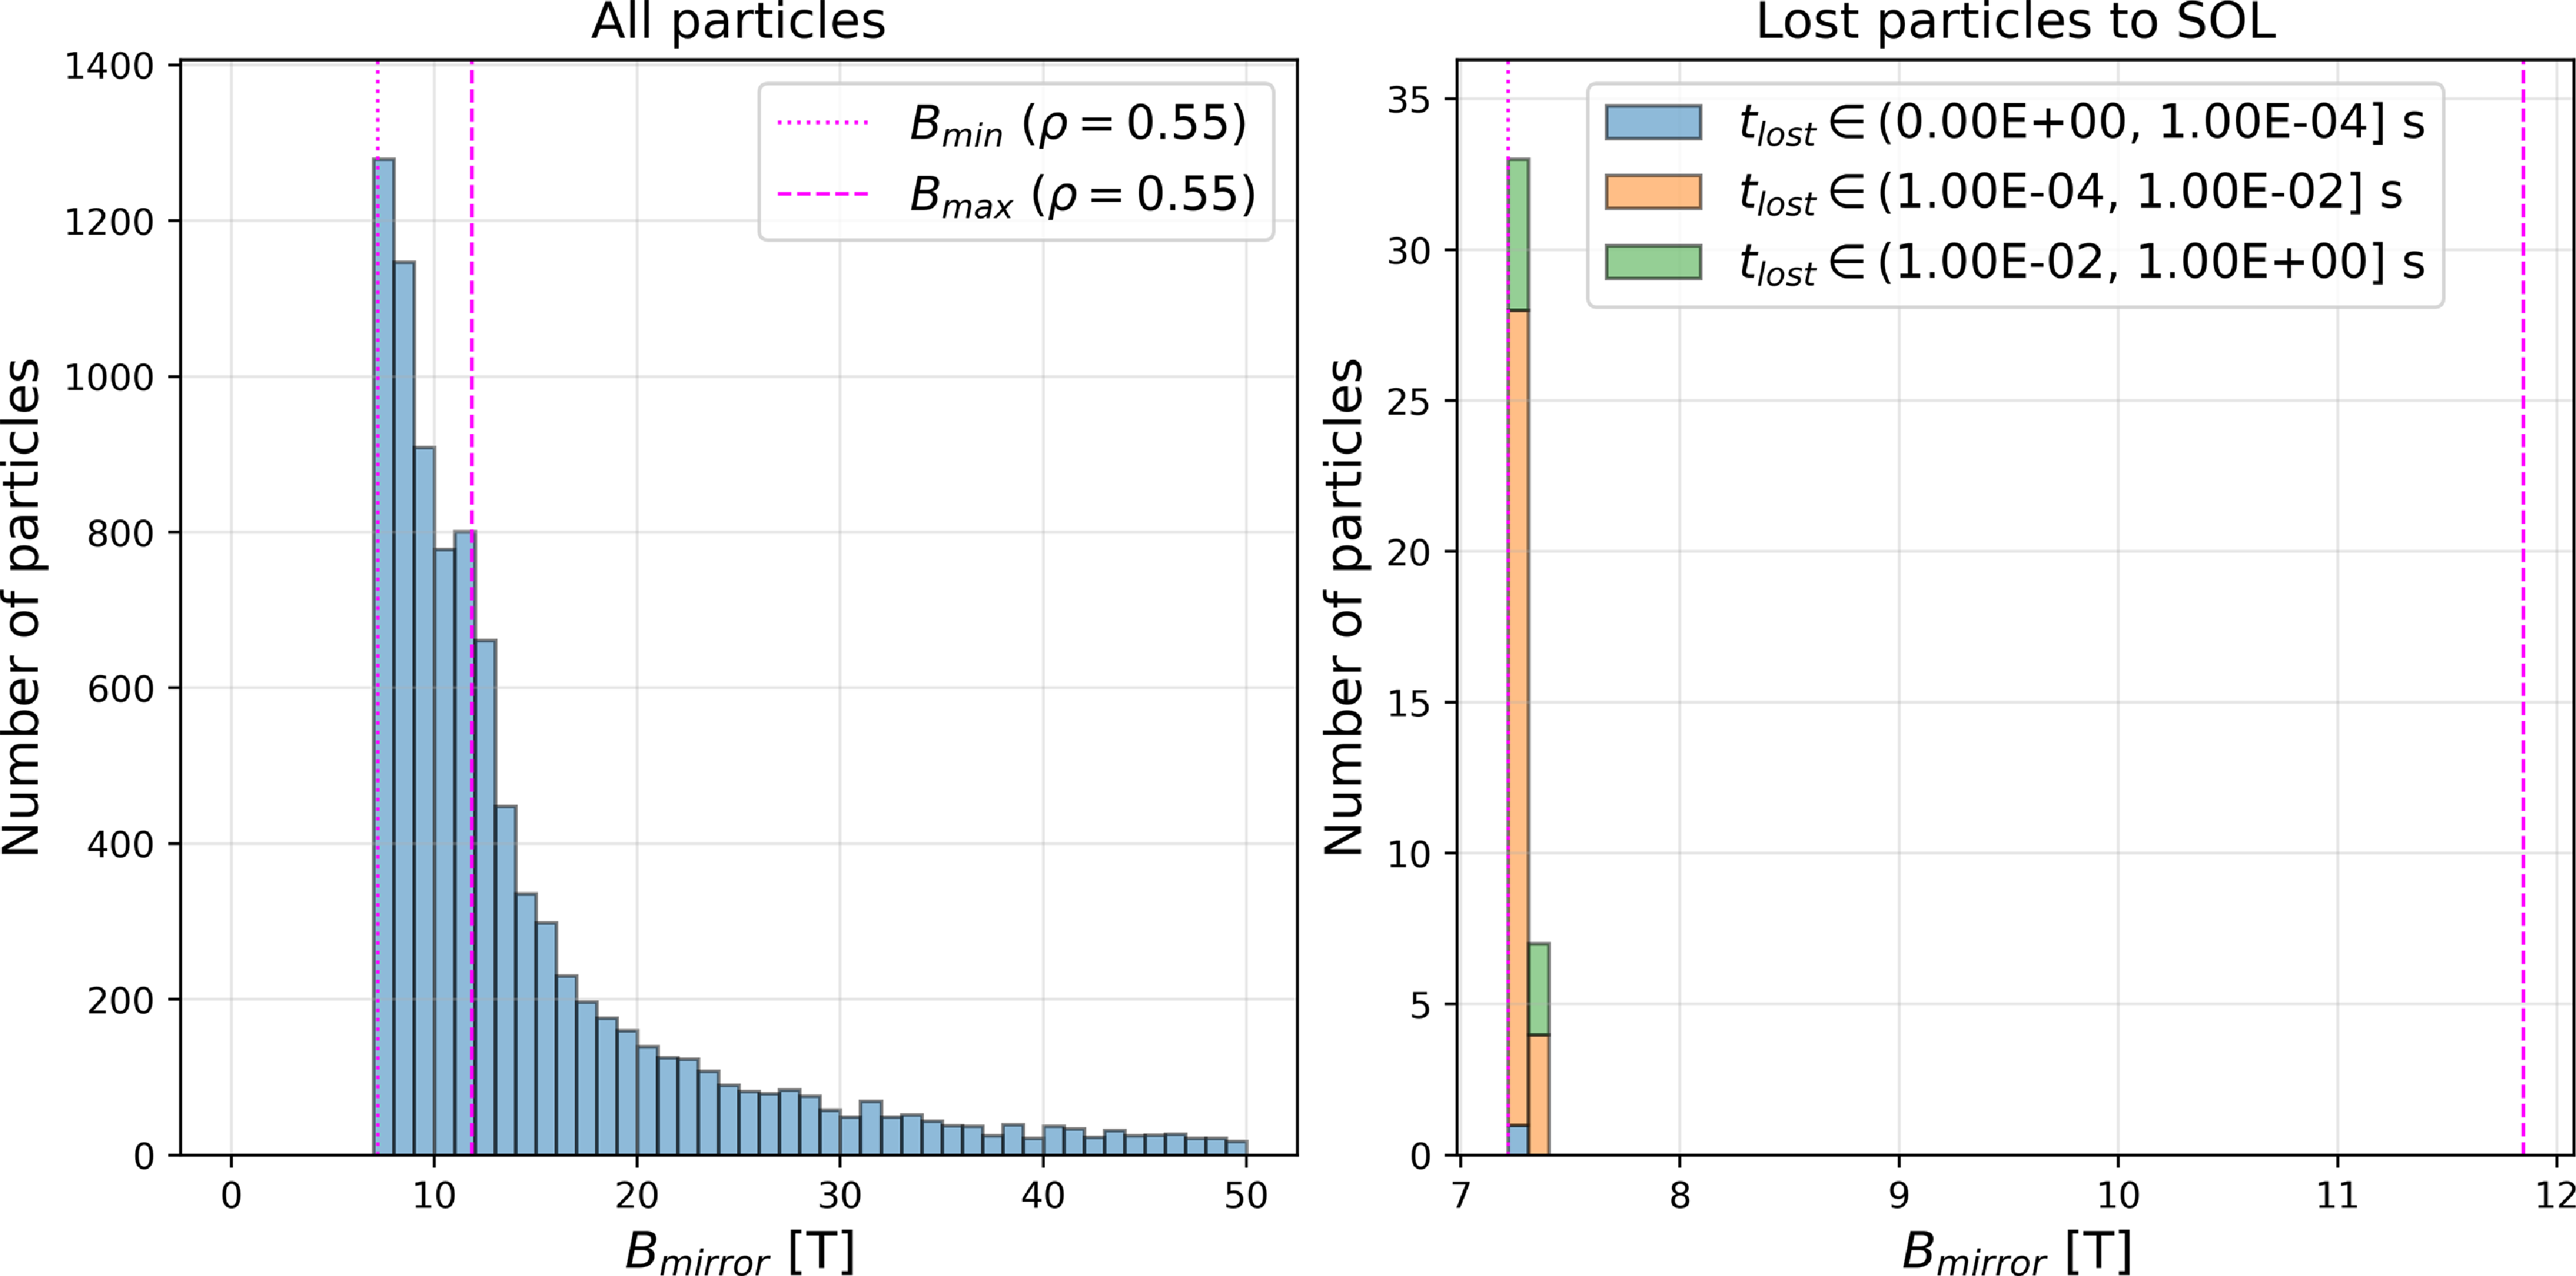
To further illustrate the role of bad deeply trapped particle orbits on the confinement, we use results from collisionless guiding-centre theory to classify particle orbits in SIMPLE simulations based on the magnitude of the magnetic field at which they are expected to be reflected (bounce), $B_{mirror} = \mathcal {E}_0/\mu$
, where
$B_{mirror} = \mathcal {E}_0/\mu$
, where $\mathcal {E}_0$
is the initial (birth) energy of alpha particles at 3.5 MeV and
$\mathcal {E}_0$
is the initial (birth) energy of alpha particles at 3.5 MeV and $\mu$
is the magnetic moment. Because orbits are collisionless, both quantities are assumed to be constant. In figure 4, we show the classification of an ensemble of 5000 simulated alpha particles according to their value of
$\mu$
is the magnetic moment. Because orbits are collisionless, both quantities are assumed to be constant. In figure 4, we show the classification of an ensemble of 5000 simulated alpha particles according to their value of $B_{mirror}$
. Particles with
$B_{mirror}$
. Particles with $B_{mirror}$
between the global minimum of
$B_{mirror}$
between the global minimum of $|B|$
at that flux surface,
$|B|$
at that flux surface, $B_{min}$
, and the global maximum of
$B_{min}$
, and the global maximum of $|B|$
at the same flux surface,
$|B|$
at the same flux surface, $B_{max}$
, are considered to be trapped alpha particles. Those with
$B_{max}$
, are considered to be trapped alpha particles. Those with $B_{mirror}\gt B_{max}$
are passing alpha particles. After verifying that no passing particles are ever lost in the SIMPLE calculations, we only follow trapped particles. From these SIMPLE simulations, we observe that it is deeply trapped particles (
$B_{mirror}\gt B_{max}$
are passing alpha particles. After verifying that no passing particles are ever lost in the SIMPLE calculations, we only follow trapped particles. From these SIMPLE simulations, we observe that it is deeply trapped particles ( $B_{mirror}\approx B_{min}$
) that drive collisionless alpha-particle losses, see figure 4(b). In these simulations, we consider that an alpha particle is lost to the SOL when it crosses the LCFS as defined by the free boundary VMEC equilibrium. Most of the losses occur prior to 10 milliseconds. Particles lost in this time region are expected to exit with most of their energy.
$B_{mirror}\approx B_{min}$
) that drive collisionless alpha-particle losses, see figure 4(b). In these simulations, we consider that an alpha particle is lost to the SOL when it crosses the LCFS as defined by the free boundary VMEC equilibrium. Most of the losses occur prior to 10 milliseconds. Particles lost in this time region are expected to exit with most of their energy.
Orbit classification of simulated collisionless GC alpha particles using the SIMPLE code.
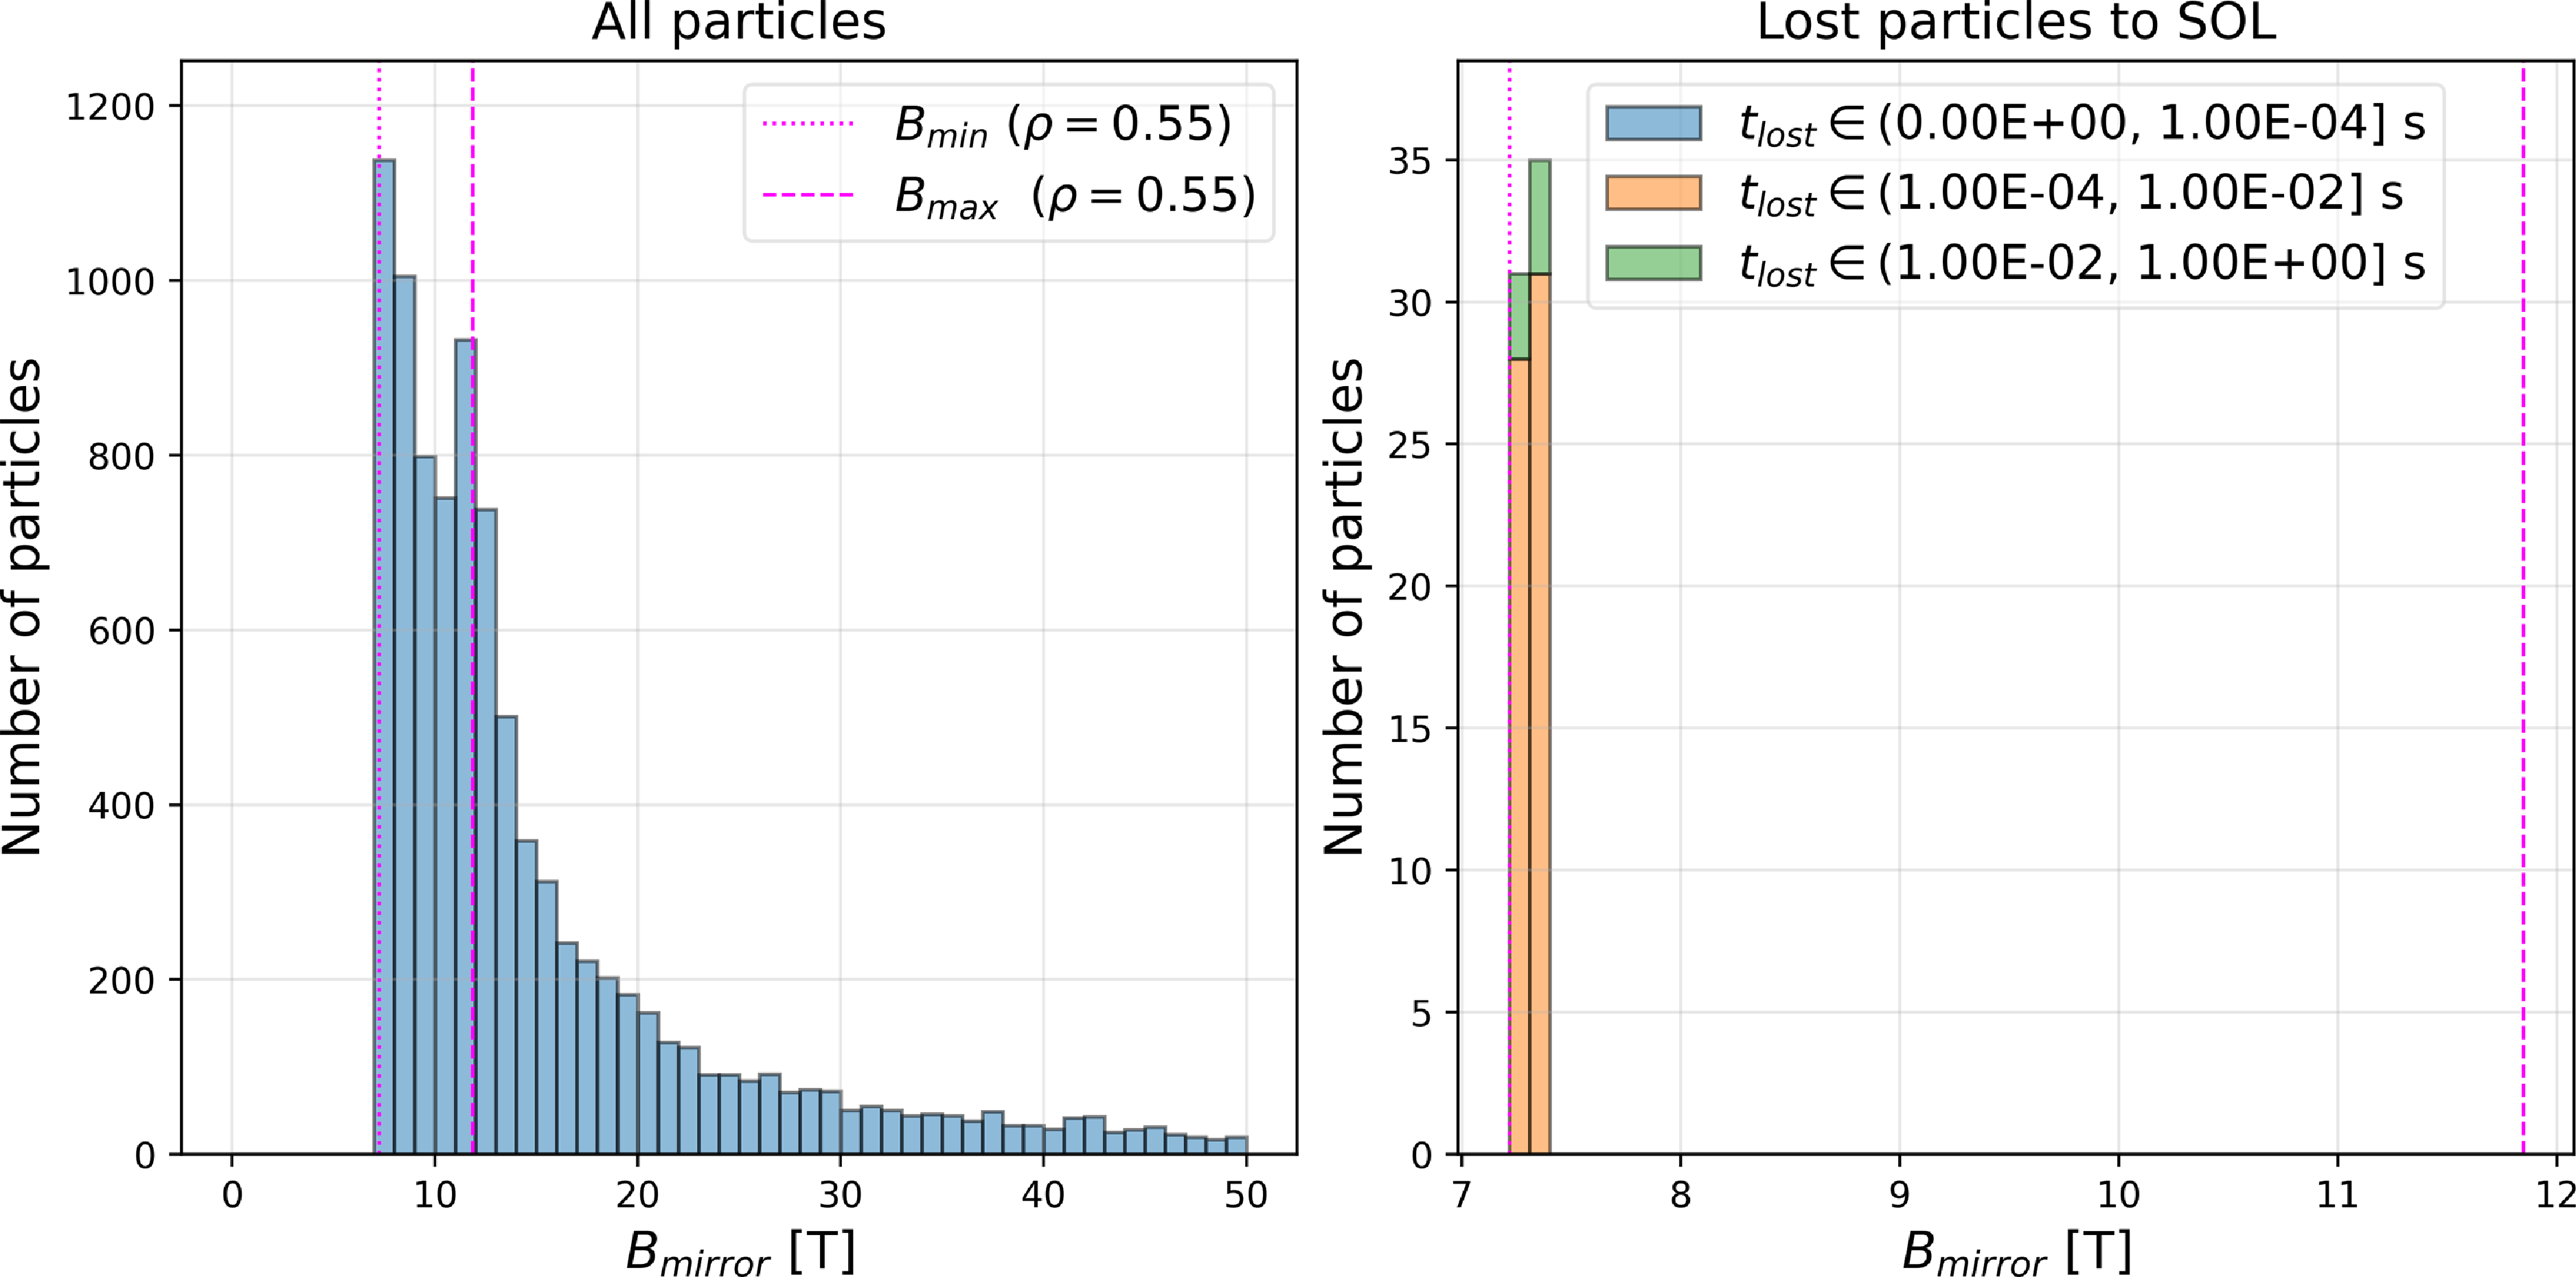
The next step in our analysis of alpha-particle confinement in the core plasma is the use of the ASCOT5 code (Särkimäki Reference Särkimäki2019), which can be used to follow the collisionless and collisional dynamics of alpha particles. For these simulations, the BMW code is used to convert the magnetic field components from the VMEC equilibrium onto the rectangular cylindrical grid that ASCOT5 uses. BMW includes both the vacuum magnetic fields from the coils of Infinity Two and the plasma contribution to the magnetic field. We have performed a benchmark test between SIMPLE and collisionless GC ASCOT5 simulations to verify that the different representations of the magnetic field do not result in different core alpha-particle confinement properties. In this test, we use the same initial isotropic distribution in pitch angle of 3.5 MeV alpha-particles in both codes. Also, simulated alpha particles are initialised at the same flux surface $\rho =0.55$
. We find good agreement between estimates of alpha-particle losses from SIMPLE and ASCOT5 simulations, being 0.4 % for the former and 0.6 % for the latter. As in SIMPLE simulations, ASCOT5 simulations predict that particle losses are driven by deeply trapped alpha particles in Infinity Two, and are lost on the same time scales of hundreds of micro-seconds to tens of milliseconds, as shown in figure 5. This benchmark test provides confidence that the different representations of the magnetic field do not influence results of core alpha-particle confinement significantly.
$\rho =0.55$
. We find good agreement between estimates of alpha-particle losses from SIMPLE and ASCOT5 simulations, being 0.4 % for the former and 0.6 % for the latter. As in SIMPLE simulations, ASCOT5 simulations predict that particle losses are driven by deeply trapped alpha particles in Infinity Two, and are lost on the same time scales of hundreds of micro-seconds to tens of milliseconds, as shown in figure 5. This benchmark test provides confidence that the different representations of the magnetic field do not influence results of core alpha-particle confinement significantly.
Orbit classification of simulated collisionless GC alpha particles using the ASCOT5 code.
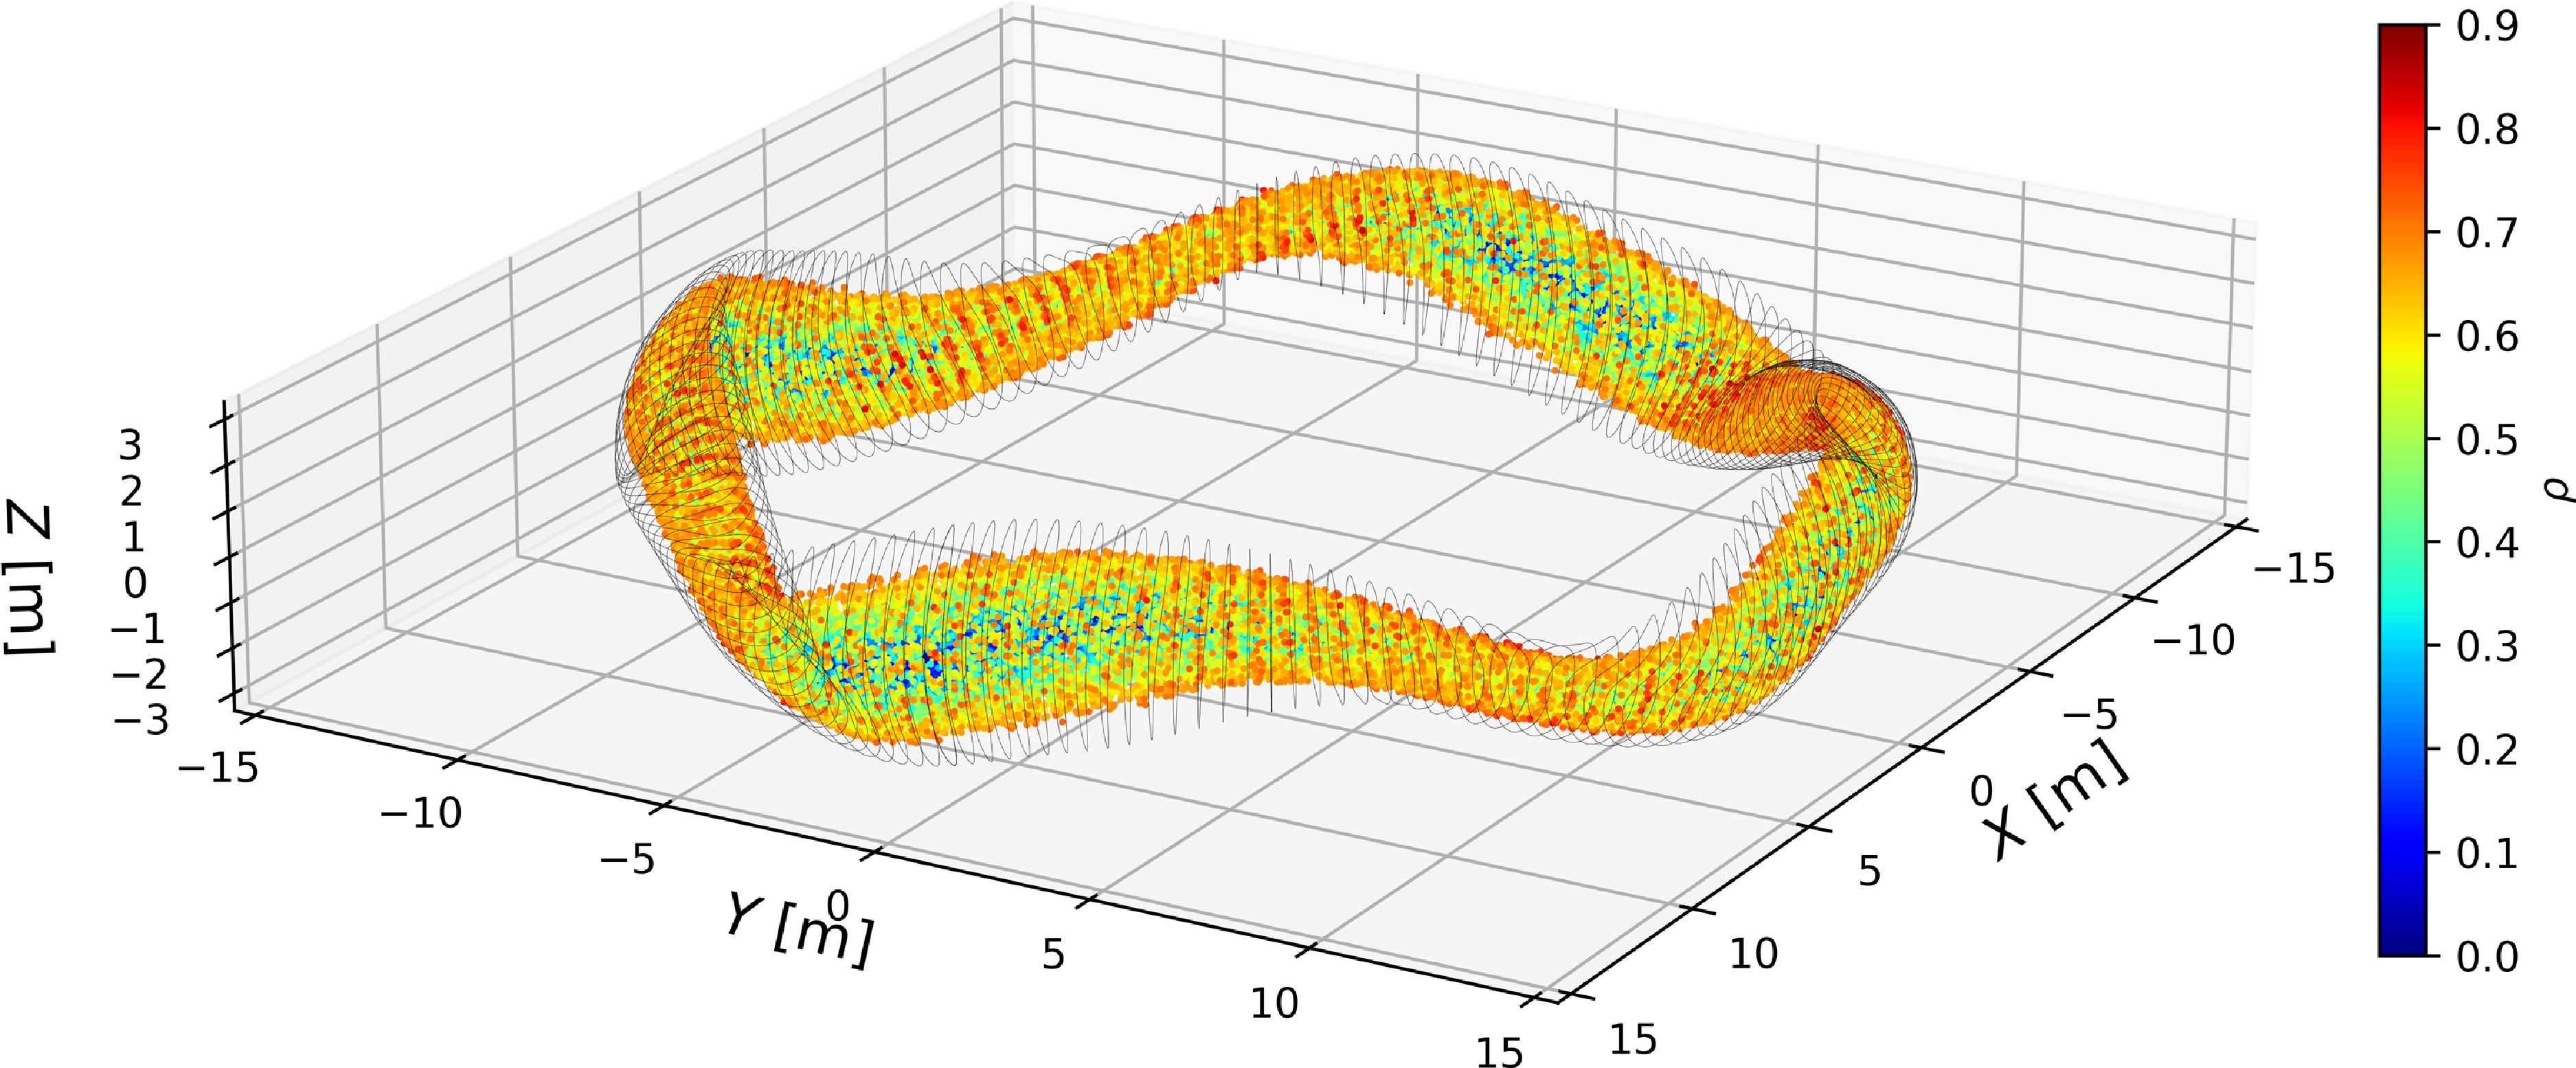
We now simulate the dynamics of collisional alpha particles in Infinity Two using ASCOT5. These simulated alpha particles are initialised with an isotropic distribution for their initial pitch angle and initial birth energy of $\mathcal {E}_0 = 3.5$
MeV, and are evolved in time until either they become locally thermalised with the background plasma via Coulomb collisions or are lost to the SOL, that is, when they cross the LCFS. Their initial spatial distribution follows the D–T fusion-reactivity distribution computed using the built-in AFSI code in ASCOT5, which applies the Bosch–Hale model (Bosch & Hale Reference Bosch and Hale1992) of D–T fusion reactions to thermal plasma profiles of Infinity Two. We observe that most alpha particles are born in the core plasma at
$\mathcal {E}_0 = 3.5$
MeV, and are evolved in time until either they become locally thermalised with the background plasma via Coulomb collisions or are lost to the SOL, that is, when they cross the LCFS. Their initial spatial distribution follows the D–T fusion-reactivity distribution computed using the built-in AFSI code in ASCOT5, which applies the Bosch–Hale model (Bosch & Hale Reference Bosch and Hale1992) of D–T fusion reactions to thermal plasma profiles of Infinity Two. We observe that most alpha particles are born in the core plasma at $\rho \leq 0.7$
, with very few being born at the plasma edge. In addition, importance sampling is used to efficiently sample the initial distribution function of fusion-born alpha particles. For this, each numerical particle is weighted according to the initial local alpha-particle density. In figure 6, we show an example of the initial spatial distribution of simulated alpha particles in ASCOT5, generated as described above.
$\rho \leq 0.7$
, with very few being born at the plasma edge. In addition, importance sampling is used to efficiently sample the initial distribution function of fusion-born alpha particles. For this, each numerical particle is weighted according to the initial local alpha-particle density. In figure 6, we show an example of the initial spatial distribution of simulated alpha particles in ASCOT5, generated as described above.
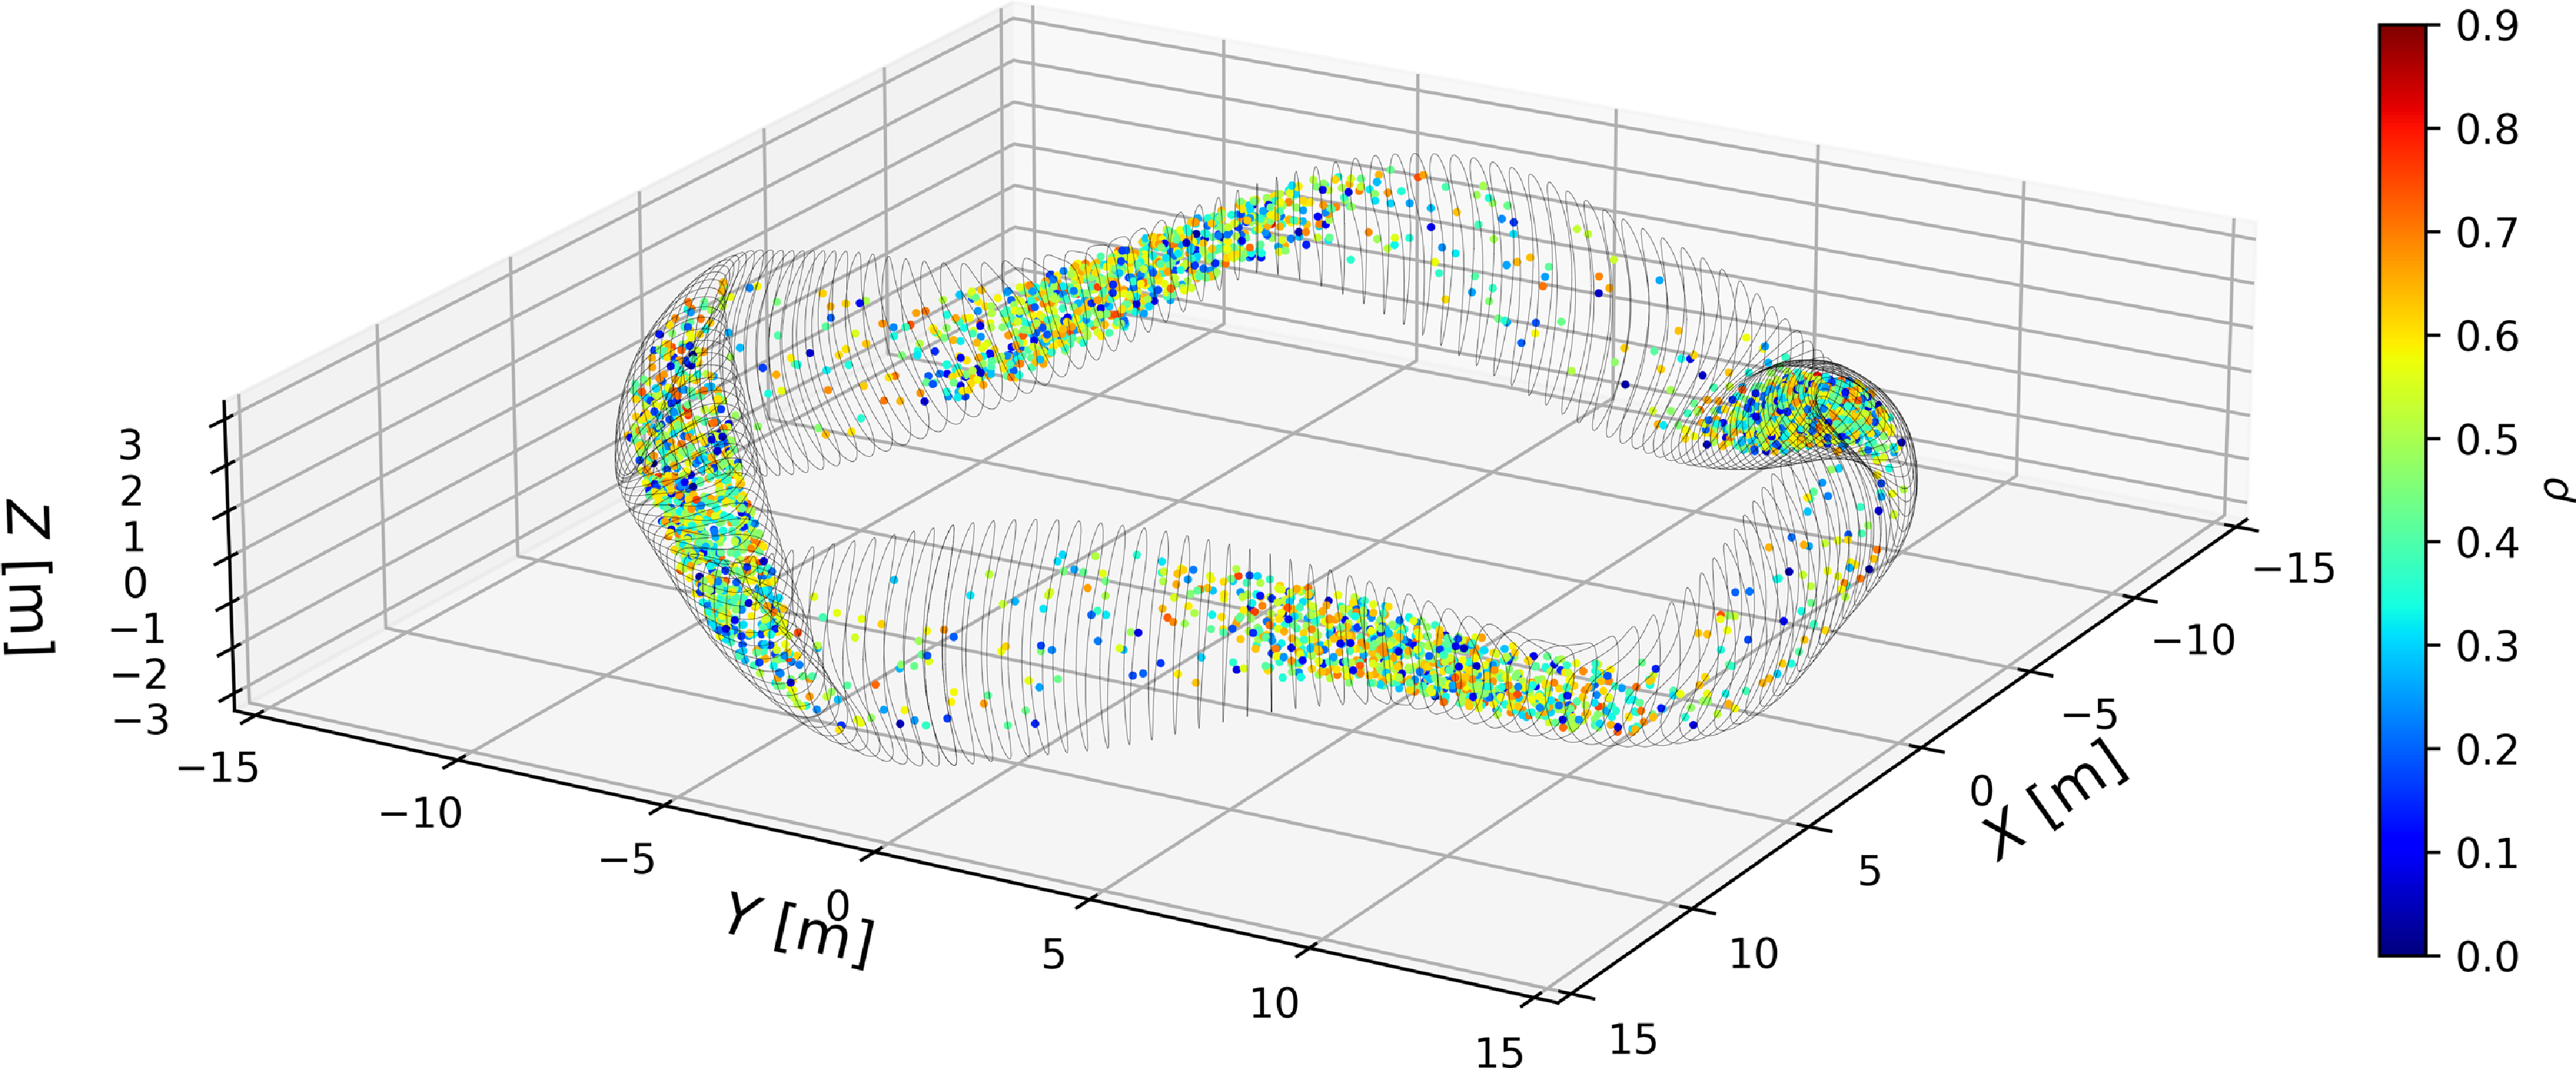
Initial spatial distribution of simulated alpha particles in ASCOT5. Simulated alpha particles are coloured by their initial radial location ( $\rho$
) as show in the colour bar on the right. The black lines show the location of the LCFS of the Infinity Two plasma at various toroidal angles.
$\rho$
) as show in the colour bar on the right. The black lines show the location of the LCFS of the Infinity Two plasma at various toroidal angles.
We also perform some FO simulations to study finite Larmor effects on alpha-particle confinement in Infinity Two. For this, we use the ASCOT5 and KORC-T codes. Both codes use the same initial conditions for the simulated alpha particles, representation of the magnetic field, plasma profiles, and model for collisions between alpha particles and the background plasma, which includes electrons, D, T and He. Also, they use the same type of spline interpolations for the magnetic field components. They mainly differ in the algorithm for advancing in time the particles subject to the relativistic Lorentz force. ASCOT5 uses a volume-preserving algorithm (VPA) (Zhang et al. Reference Zhang, Liu, Qin, Wang, He and Sun2015) while KORC-T uses a modified Boris algorithm (Vay Reference Vay2008). Performing FO simulations with these two codes allows us to assess the effect of using different algorithms for solving the FO orbits on estimates of alpha-particle confinement.
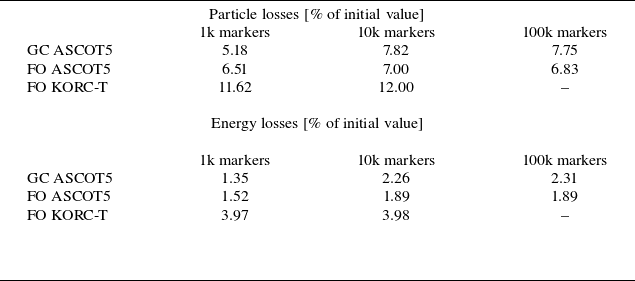
In table 1, we show estimates of core particle and energy losses from GC and FO ASCOT5 simulations as well as FO KORC-T simulations. As expected for the Monte Carlo approach to estimate particle confinement, we note that as we increase the number of markers, we improve statistics of these estimates. Simulations using 10k markers already provide accurate particle and energy loss estimates in these simulations. From these collisional simulations, we conclude that core alpha-particle energy losses are approximately 2 % of the initial energy according to GC and FO ASCOT5 and approximately 4 % according to FO KORC-T simulations. Particle losses are higher, approximately 8 % of alpha-particles traced from the initial distribution according to GC and FO ASCOT5 simulations and 12 % according to KORC-T simulation. Due to collisions with the background plasma, the simulated alpha particles transfer some of their initial energy to the background plasma before they are lost to the SOL. We stress that the main difference between ASCOT5 and KORC-T simulations is the algorithm used to evolve the orbits of the particles. The discrepancy between ASCOT and KORC-T FO results highlight the difficulty involved in obtaining accurate and robust results for full-orbit calculations.
Simulated particle and energy losses in core Infinity Two plasma.
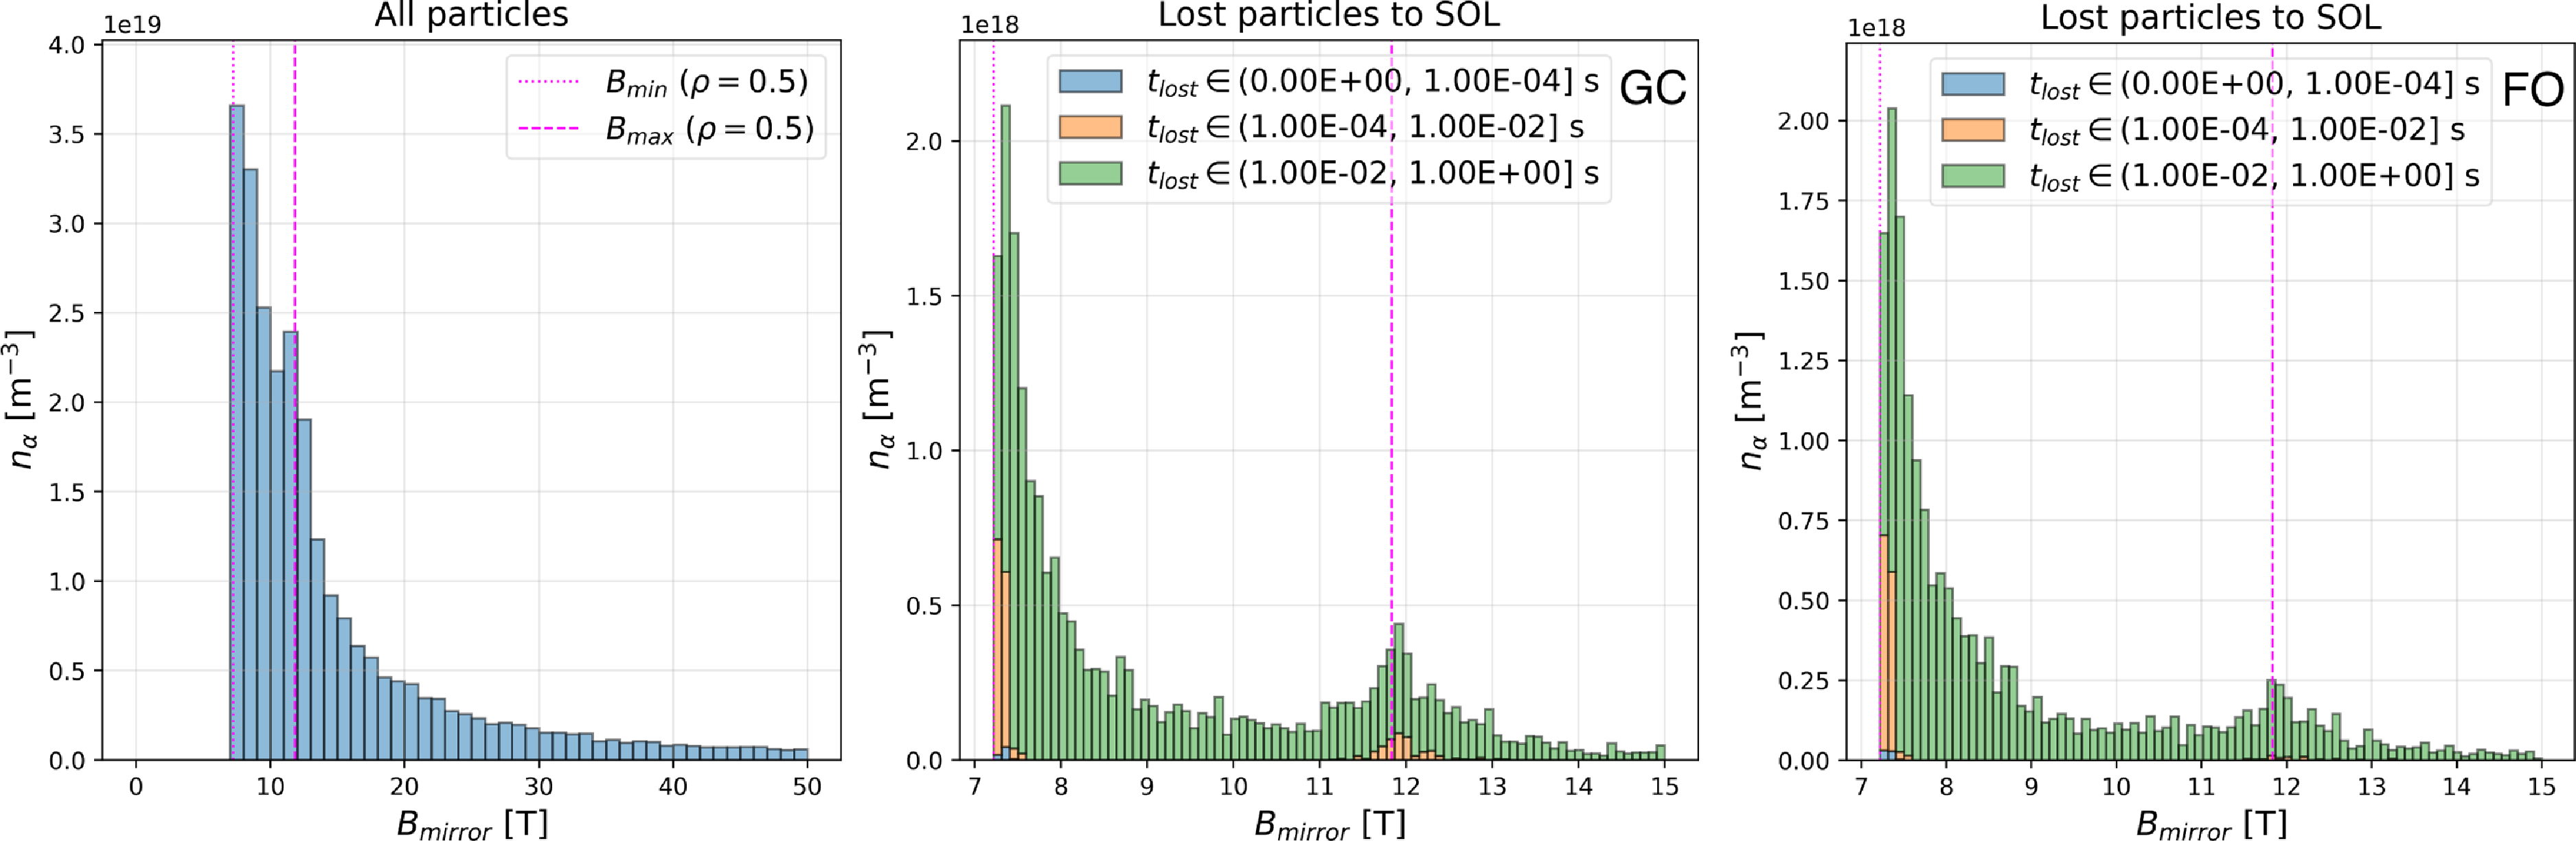
In figure 7, we show an attempt to classify lost GC and FO alpha particles from simulations in table 1 based on their initial value of $B_{mirror}$
. Because collisions do not conserve the energy and magnetic moment of particles, those that start on confined orbits, such as passing particles, can be lost. However, these are lost after many collisions and thus long time scales. Most lost particles prior to 10 ms arise from the deeply trapped orbits, as was seen before in the collisionless GC case above, see figure 5. There is a particular increase of lost particles near the trapped–passing boundary (
$B_{mirror}$
. Because collisions do not conserve the energy and magnetic moment of particles, those that start on confined orbits, such as passing particles, can be lost. However, these are lost after many collisions and thus long time scales. Most lost particles prior to 10 ms arise from the deeply trapped orbits, as was seen before in the collisionless GC case above, see figure 5. There is a particular increase of lost particles near the trapped–passing boundary ( $B_{mirror} \approx B_{max}$
) with respect to collisionless SIMPLE and ASCOT5 simulations relative to what was seen in figures 4 and 5. Also, a small population of initially passing particles (
$B_{mirror} \approx B_{max}$
) with respect to collisionless SIMPLE and ASCOT5 simulations relative to what was seen in figures 4 and 5. Also, a small population of initially passing particles ( $B_{mirror} \gt B_{max}$
) are observed to be lost in these simulations, which is likely due to collisions modifying their pitch angle, eventually turning them into trapped particles that leave the plasma.
$B_{mirror} \gt B_{max}$
) are observed to be lost in these simulations, which is likely due to collisions modifying their pitch angle, eventually turning them into trapped particles that leave the plasma.
Orbit classification of simulated alpha particles in ASCOT5: (a) initial condition of all particles; (b) initial condition of lost particles in collisional GC simulation; and (c) initial condition of lost particles in FO simulation.
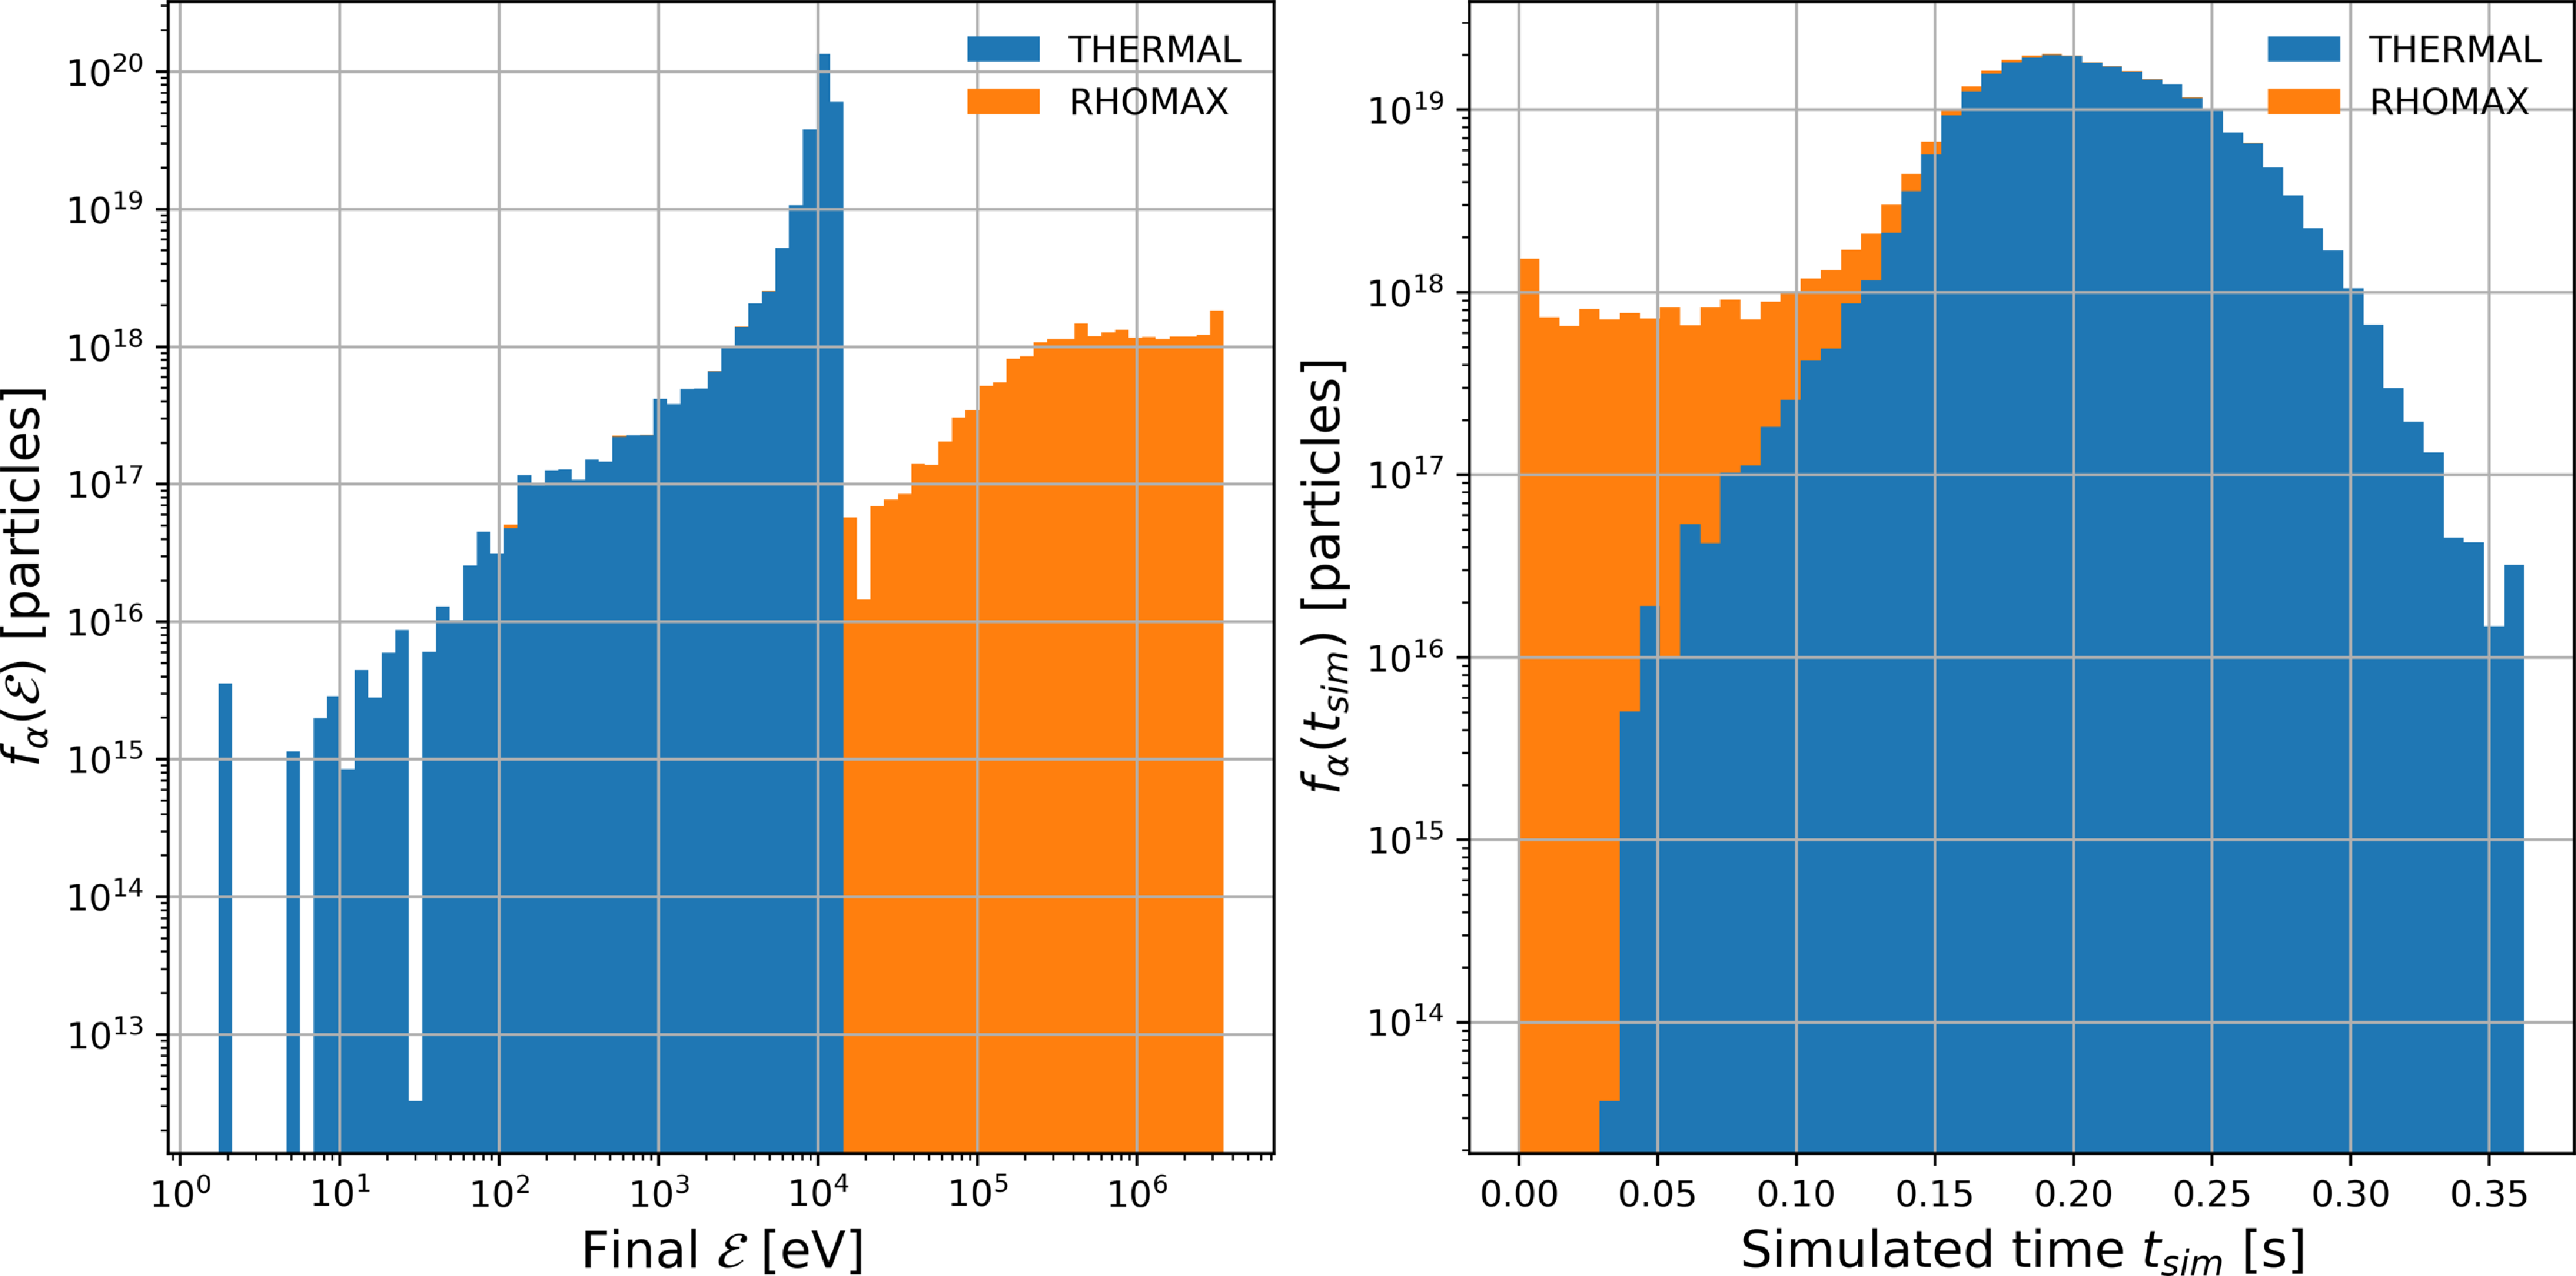
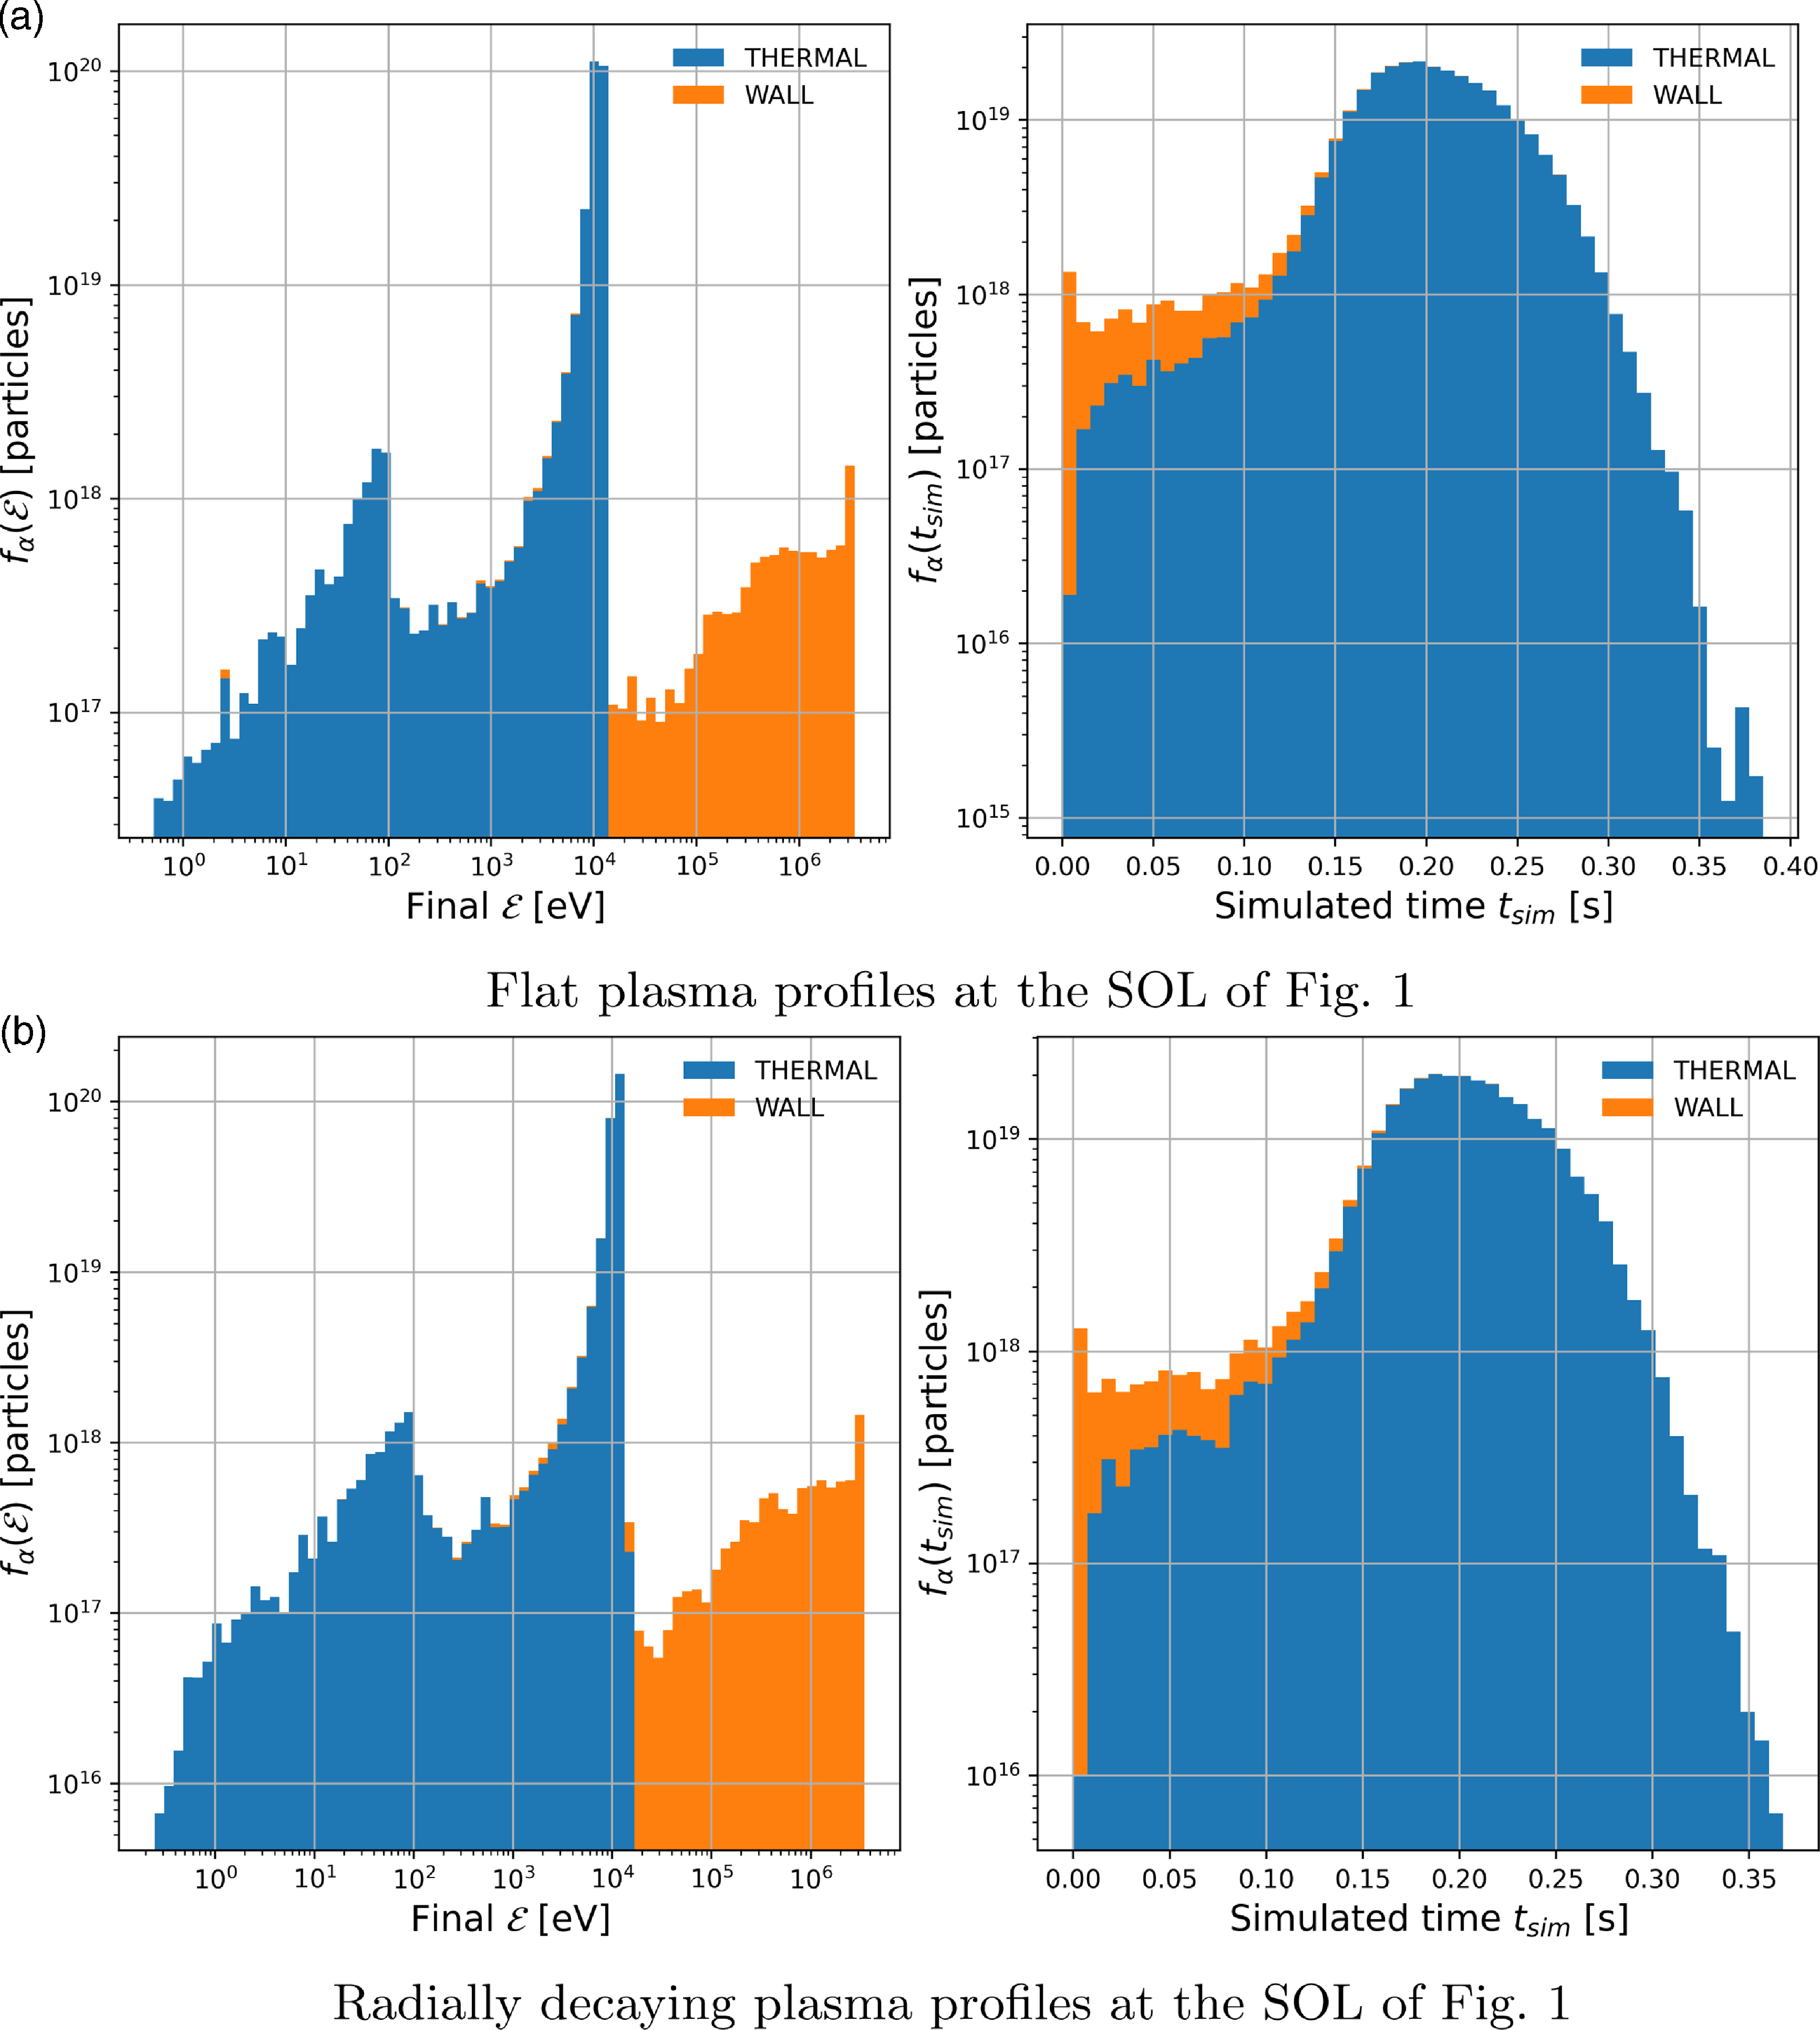
In figure 8, we show the end states of energy of simulated collisional GC alpha particles in ASCOT5. We stress that in these simulations of core alpha-particle confinement, we follow the simulated particles in time until they either become thermalised with the background plasma (THERMAL) or until they get lost to the SOL by crossing the LCFS (RHOMAX). In the same figure, we show the corresponding end states of simulated time of these alpha particles. As it can be seen from this figure, most alpha-particle losses occur in time scales shorter than hundreds of milliseconds, $t_{sim}\leq 100$
ms, and mostly correspond to alpha particles with relatively high energy,
$t_{sim}\leq 100$
ms, and mostly correspond to alpha particles with relatively high energy, $\mathcal {E}\geq 100$
keV. FO ASCOT5 simulations show very similar results.
$\mathcal {E}\geq 100$
keV. FO ASCOT5 simulations show very similar results.
(a) Energy and (b) simulated time end states of GC alpha particles in ASCOT5 simulation of core Infinity Two plasma. The sharp increase of $f_{\alpha }(\mathcal {E}$
at energies
$f_{\alpha }(\mathcal {E}$
at energies $\mathcal {E}\sim 10^4$
eV is expected, since confined alpha particles thermalise via Coulomb collisions with the background plasma, where temperature is of the order of
$\mathcal {E}\sim 10^4$
eV is expected, since confined alpha particles thermalise via Coulomb collisions with the background plasma, where temperature is of the order of $T\sim 10^4$
eV.
$T\sim 10^4$
eV.
When we analyse the initial parameters of the distribution of lost alpha particles in these simulations, we find that their mean initial radial position is approximately $\rho =0.54$
with very small mean pitch angle (
$\rho =0.54$
with very small mean pitch angle ( $v_\parallel /v \approx 0$
), initially located in the region of low magnetic field of Infinity Two (
$v_\parallel /v \approx 0$
), initially located in the region of low magnetic field of Infinity Two ( $\phi \approx 45^\circ$
), corresponding to deeply trapped particles, see figure 9.
$\phi \approx 45^\circ$
), corresponding to deeply trapped particles, see figure 9.
Initial spatial distribution of lost, trapped alpha particles in ASCOT5. Consistent with the analysis of figure 3, most lost, trapped alpha particles are located in the region of low magnetic field of Infinity Two, around $\phi =45^\circ$
. Simulated alpha particles are coloured by their initial radial location (
$\phi =45^\circ$
. Simulated alpha particles are coloured by their initial radial location ( $\rho$
) as shown in the colour bar on the right. The black lines show the location of the LCFS of the Infinity Two plasma at various toroidal angles as a visual aid.
$\rho$
) as shown in the colour bar on the right. The black lines show the location of the LCFS of the Infinity Two plasma at various toroidal angles as a visual aid.
4. Power wall loads
Now, we analyse power loads on the Infinity Two wall due to alpha-particle losses. For this analysis, we use the same initial set-up for ASCOT5 simulations described in § 3. In this analysis, we only use GC simulations of alpha particles. The number of particles required to obtain good statistics of power wall loads was too large to be simulated including FO effects. Furthermore, the loss characteristics between ASCOT GC and ASCOT FO were very similar, justifying the use of GC for this calculation. The ASCOT5 code has been extensively used in the past to study power wall loads due to energetic ions on different tokamak devices, including reactor-relevant scenarios in ITER (Kurki-Suonio et al. Reference Kurki-Suonio, Kiviniemi, Sipilä, Heikkinen, Fundamenski, Matthews and Riccardo2002; Hynönen et al. Reference Hynönen, Kurki-Suonio, Suttrop, Dux and Sugiyama2007; Kurki-Suonio et al. Reference Kurki-Suonio2009; Shinohara et al. Reference Shinohara2011; Snicker et al. Reference Snicker, Sipilä and Kurki-Suonio2012; Kurki-Suonio et al. Reference Kurki-Suonio2017).
For this analysis, we use four models for the wall that do not include any divertor structures. The first of these models corresponds to the standard Infinity Two wall (ITW). This wall is generated by computing a conformal envelope of the plasma that is outside the magnetic islands that are used for the island divertor. The average distance from this wall to the separatrix of the magnetic island chain is 10 cm and its total area is 1034 m $^2$
. The other three models are obtained from three-dimensional extensions of the LCFS as defined by the free-boundary VMEC equilibrium described previously, using the methodology suggested in the appendix of Landreman (Reference Landreman2017). These three walls have different separation between the wall and the LCFS which we will refer to as the ‘wall gap’,
$^2$
. The other three models are obtained from three-dimensional extensions of the LCFS as defined by the free-boundary VMEC equilibrium described previously, using the methodology suggested in the appendix of Landreman (Reference Landreman2017). These three walls have different separation between the wall and the LCFS which we will refer to as the ‘wall gap’, $\Delta _{w}$
. We consider three values of
$\Delta _{w}$
. We consider three values of $\Delta _w$
in our analysis: 30 cm, 50 cm and 70 cm, corresponding to a total wall area of 1046 m
$\Delta _w$
in our analysis: 30 cm, 50 cm and 70 cm, corresponding to a total wall area of 1046 m $^2$
, 1153 m
$^2$
, 1153 m $^2$
and 1263 m
$^2$
and 1263 m $^2$
, respectively. These walls are transformed into a triangulation (tri-mesh) which is then passed to ASCOT5 for the simulations, each triangulation consisting of 50 552 triangles. These models for the wall are intended to assess the sensitivity of the wall loads on the wall structure and to inform the later design of divertor structures and shielding of first wall components.
$^2$
, respectively. These walls are transformed into a triangulation (tri-mesh) which is then passed to ASCOT5 for the simulations, each triangulation consisting of 50 552 triangles. These models for the wall are intended to assess the sensitivity of the wall loads on the wall structure and to inform the later design of divertor structures and shielding of first wall components.
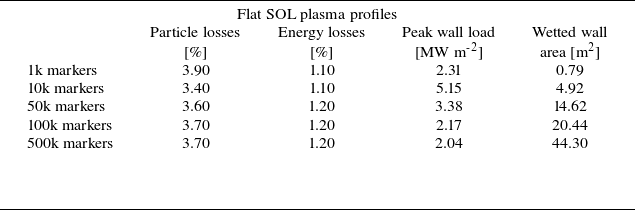
Peak wall loads, particle and energy losses to the wall, and wetted area as function of number of markers in GC ASCOT5 simulations of wall loads in Infinity Two. All simulations reported in this table use a wall with $\Delta _w=30$
cm, simulations using other wall model show the same trend.
$\Delta _w=30$
cm, simulations using other wall model show the same trend.
Simulated peaked wall loads, particle and energy losses to the wall, and wetted area in Infinity Two plasmas. Results from GC ASCOT5 simulations using 100k markers.
In table 2, we show peak wall loads, particle and energy losses to the wall, and wetted area in Infinity Two plasmas for GC ASCOT5 simulations using different numbers of markers. Here, wetted area is defined as the sum of the areas of triangles of the discrete wall that have been hit by at least one alpha particle. Particle and energy losses refer to alpha particles being lost to the wall, unlike core losses in § 3, which were defined as those alpha particles crossing the LCFS ( $\rho =1.0$
). The implications on the values of particle and energy losses from using this different definition is discussed below. From this table, we note that estimates of particle and energy losses are well described by simulations with as few as 1k markers. However, peak wall loads are not correctly described by simulations with fewer markers than 100k. Therefore, all results in the rest of this section refer to GC ASCOT5 simulations using 100k markers. Regarding the wetted wall area, this is a standard quantity used in past reactor-relevant analysis (Kurki-Suonio et al. Reference Kurki-Suonio2017; Scott et al. Reference Scott, Kramer, Tolman, Snicker, Varje, Särkimäki, Wright and Rodriguez-Fernandez2020). However, we observe that this quantity depends on both the number of markers and area of triangles (via the number of triangles) used in the simulations. We do not observe convergence towards a value as for particle and energy losses, and peak wall loads. Rather, the wetted wall area keeps increasing as we increase the number of markers, although these new wetted areas with more markers correspond to wall loads of the order of kW m-
$\rho =1.0$
). The implications on the values of particle and energy losses from using this different definition is discussed below. From this table, we note that estimates of particle and energy losses are well described by simulations with as few as 1k markers. However, peak wall loads are not correctly described by simulations with fewer markers than 100k. Therefore, all results in the rest of this section refer to GC ASCOT5 simulations using 100k markers. Regarding the wetted wall area, this is a standard quantity used in past reactor-relevant analysis (Kurki-Suonio et al. Reference Kurki-Suonio2017; Scott et al. Reference Scott, Kramer, Tolman, Snicker, Varje, Särkimäki, Wright and Rodriguez-Fernandez2020). However, we observe that this quantity depends on both the number of markers and area of triangles (via the number of triangles) used in the simulations. We do not observe convergence towards a value as for particle and energy losses, and peak wall loads. Rather, the wetted wall area keeps increasing as we increase the number of markers, although these new wetted areas with more markers correspond to wall loads of the order of kW m- $^2$
or lower. Thus, we report the wall wetted area in our simulations of Infinity Two only for completeness.
$^2$
or lower. Thus, we report the wall wetted area in our simulations of Infinity Two only for completeness.
In table 3, we show peak wall loads, particle and energy losses to the wall, and wetted area in Infinity Two plasmas using both flat plasma profiles at the SOL, see figure 1, and plasma profiles with exponential radial decay at the SOL, see figure 1. First, we note that both particle and energy losses are lower than the core alpha-particle losses discussed in § 3. This is because once alpha particles leave the core plasma and enter the SOL plasma, they experience more collisional plasma. These collisions stop (thermalise) some of these energetic alpha particles in our ASCOT5 simulations before they hit the wall. This can be seen in figure 10, where we show the end state of energy and simulated time of alpha particles for both the flat and plasma profiles with exponential radial decay at the SOL. While we observe that particle losses to the wall occur on a similar time scale as core losses, see figure 8(b), the final distribution of simulated alpha particles shows a larger population of particles in the range of energies from $\mathcal {E}=1$
eV to
$\mathcal {E}=1$
eV to $\mathcal {E}=100$
eV due to alpha particles interacting via Coulomb collisions with the SOL plasma.
$\mathcal {E}=100$
eV due to alpha particles interacting via Coulomb collisions with the SOL plasma.
(a,c) Energy and (b,d) simulated time end states of GC alpha particles in ASCOT5 simulation using (a,b) flat and (c,d) radially decaying plasma profiles at the SOL. The sharp increase of $f_{\alpha }(\mathcal {E}$
at energies
$f_{\alpha }(\mathcal {E}$
at energies $\mathcal {E}\sim 10^4$
eV is expected, since confined alpha particles thermalise via Coulomb collisions with the background plasma, where temperature is of the order of
$\mathcal {E}\sim 10^4$
eV is expected, since confined alpha particles thermalise via Coulomb collisions with the background plasma, where temperature is of the order of $T\sim 10^4$
eV.
$T\sim 10^4$
eV.
Regarding estimates of peak wall loads, we observe lower values of this quantity for the wall with $\Delta _w=30$
cm. Note that we only perform simualtions of the ITW with flat SOL profiles. Given the proximity of the ITW to the LCFS, there is very little difference in the analysis when different SOL profiles are used. We note that for these cases with lower peak wall loads, we obtain the largest wetted areas. This suggests that wall loads are reduced when alpha-particle losses to the wall are spread over wider wall areas.
$\Delta _w=30$
cm. Note that we only perform simualtions of the ITW with flat SOL profiles. Given the proximity of the ITW to the LCFS, there is very little difference in the analysis when different SOL profiles are used. We note that for these cases with lower peak wall loads, we obtain the largest wetted areas. This suggests that wall loads are reduced when alpha-particle losses to the wall are spread over wider wall areas.
In figure 11, we show the power wall loads on the $\theta \phi$
-plane for simulations with
$\theta \phi$
-plane for simulations with $\Delta _w=30$
cm,
$\Delta _w=30$
cm, $\Delta _w=70$
cm and the ITW for flat SOL plasma profiles. In these figures, the positions of wall elements (triangles) are mapped onto the
$\Delta _w=70$
cm and the ITW for flat SOL plasma profiles. In these figures, the positions of wall elements (triangles) are mapped onto the $\theta \phi$
-plane and are coloured according to the power load computed by ASCOT5. In all simulations, we observe higher power loads at approximately
$\theta \phi$
-plane and are coloured according to the power load computed by ASCOT5. In all simulations, we observe higher power loads at approximately $\phi =60^\circ$
, with different poloidal locations. From the analysis of § 3, we observe that most lost alpha particles are deeply trapped particles with
$\phi =60^\circ$
, with different poloidal locations. From the analysis of § 3, we observe that most lost alpha particles are deeply trapped particles with $B = B_{mirror}\approx 7.5$
T, initially at radial location
$B = B_{mirror}\approx 7.5$
T, initially at radial location $\rho \approx 0.5$
and toroidally localised around
$\rho \approx 0.5$
and toroidally localised around $\phi =45^\circ$
, the region of low magnetic field of Infinity Two, see figure 9. We compute the location of the reflection points of these particles by calculating the angle
$\phi =45^\circ$
, the region of low magnetic field of Infinity Two, see figure 9. We compute the location of the reflection points of these particles by calculating the angle $\phi$
at which
$\phi$
at which $\bar {|B|}(\phi )=B_{mirror}$
at
$\bar {|B|}(\phi )=B_{mirror}$
at $\rho =0.5$
. We find that these occur at
$\rho =0.5$
. We find that these occur at $\phi \approx 30^\circ$
and
$\phi \approx 30^\circ$
and $\phi \approx 60^\circ$
. This suggests that these particular alpha particles radially drift outwards around those toroidal locations, crossing the LCFS and escaping the core plasma around the poloidal location of the x-points. Also, we observe the four-field-period periodicity of the wall loads patterns, but stellarator symmetry (Dewar & Hudson Reference Dewar and Hudson1998) is broken, as observed in previous works (Lazerson et al. Reference Lazerson, Leviness and Lion2021b
,
Reference Lazersonc
). Our analysis shows that this asymmetry is caused by
$\phi \approx 60^\circ$
. This suggests that these particular alpha particles radially drift outwards around those toroidal locations, crossing the LCFS and escaping the core plasma around the poloidal location of the x-points. Also, we observe the four-field-period periodicity of the wall loads patterns, but stellarator symmetry (Dewar & Hudson Reference Dewar and Hudson1998) is broken, as observed in previous works (Lazerson et al. Reference Lazerson, Leviness and Lion2021b
,
Reference Lazersonc
). Our analysis shows that this asymmetry is caused by $\nabla B$
drifts, which for positive ions and the toroidal field pointing clockwise in Infinity Two effectively points downwards, according to our simulations. Thus, peak wall loads are localised around
$\nabla B$
drifts, which for positive ions and the toroidal field pointing clockwise in Infinity Two effectively points downwards, according to our simulations. Thus, peak wall loads are localised around $\phi =60^\circ$
and
$\phi =60^\circ$
and $\theta \lt 0^\circ$
. A test ASCOT5 simulation of Infinity Two using negatively charged alpha particles confirm this, showing the same four-field-period periodicity, similar wall load values, but with peak wall loads now localised at
$\theta \lt 0^\circ$
. A test ASCOT5 simulation of Infinity Two using negatively charged alpha particles confirm this, showing the same four-field-period periodicity, similar wall load values, but with peak wall loads now localised at $\phi =30^\circ$
and
$\phi =30^\circ$
and $\theta \gt 0^\circ$
, as expected from
$\theta \gt 0^\circ$
, as expected from
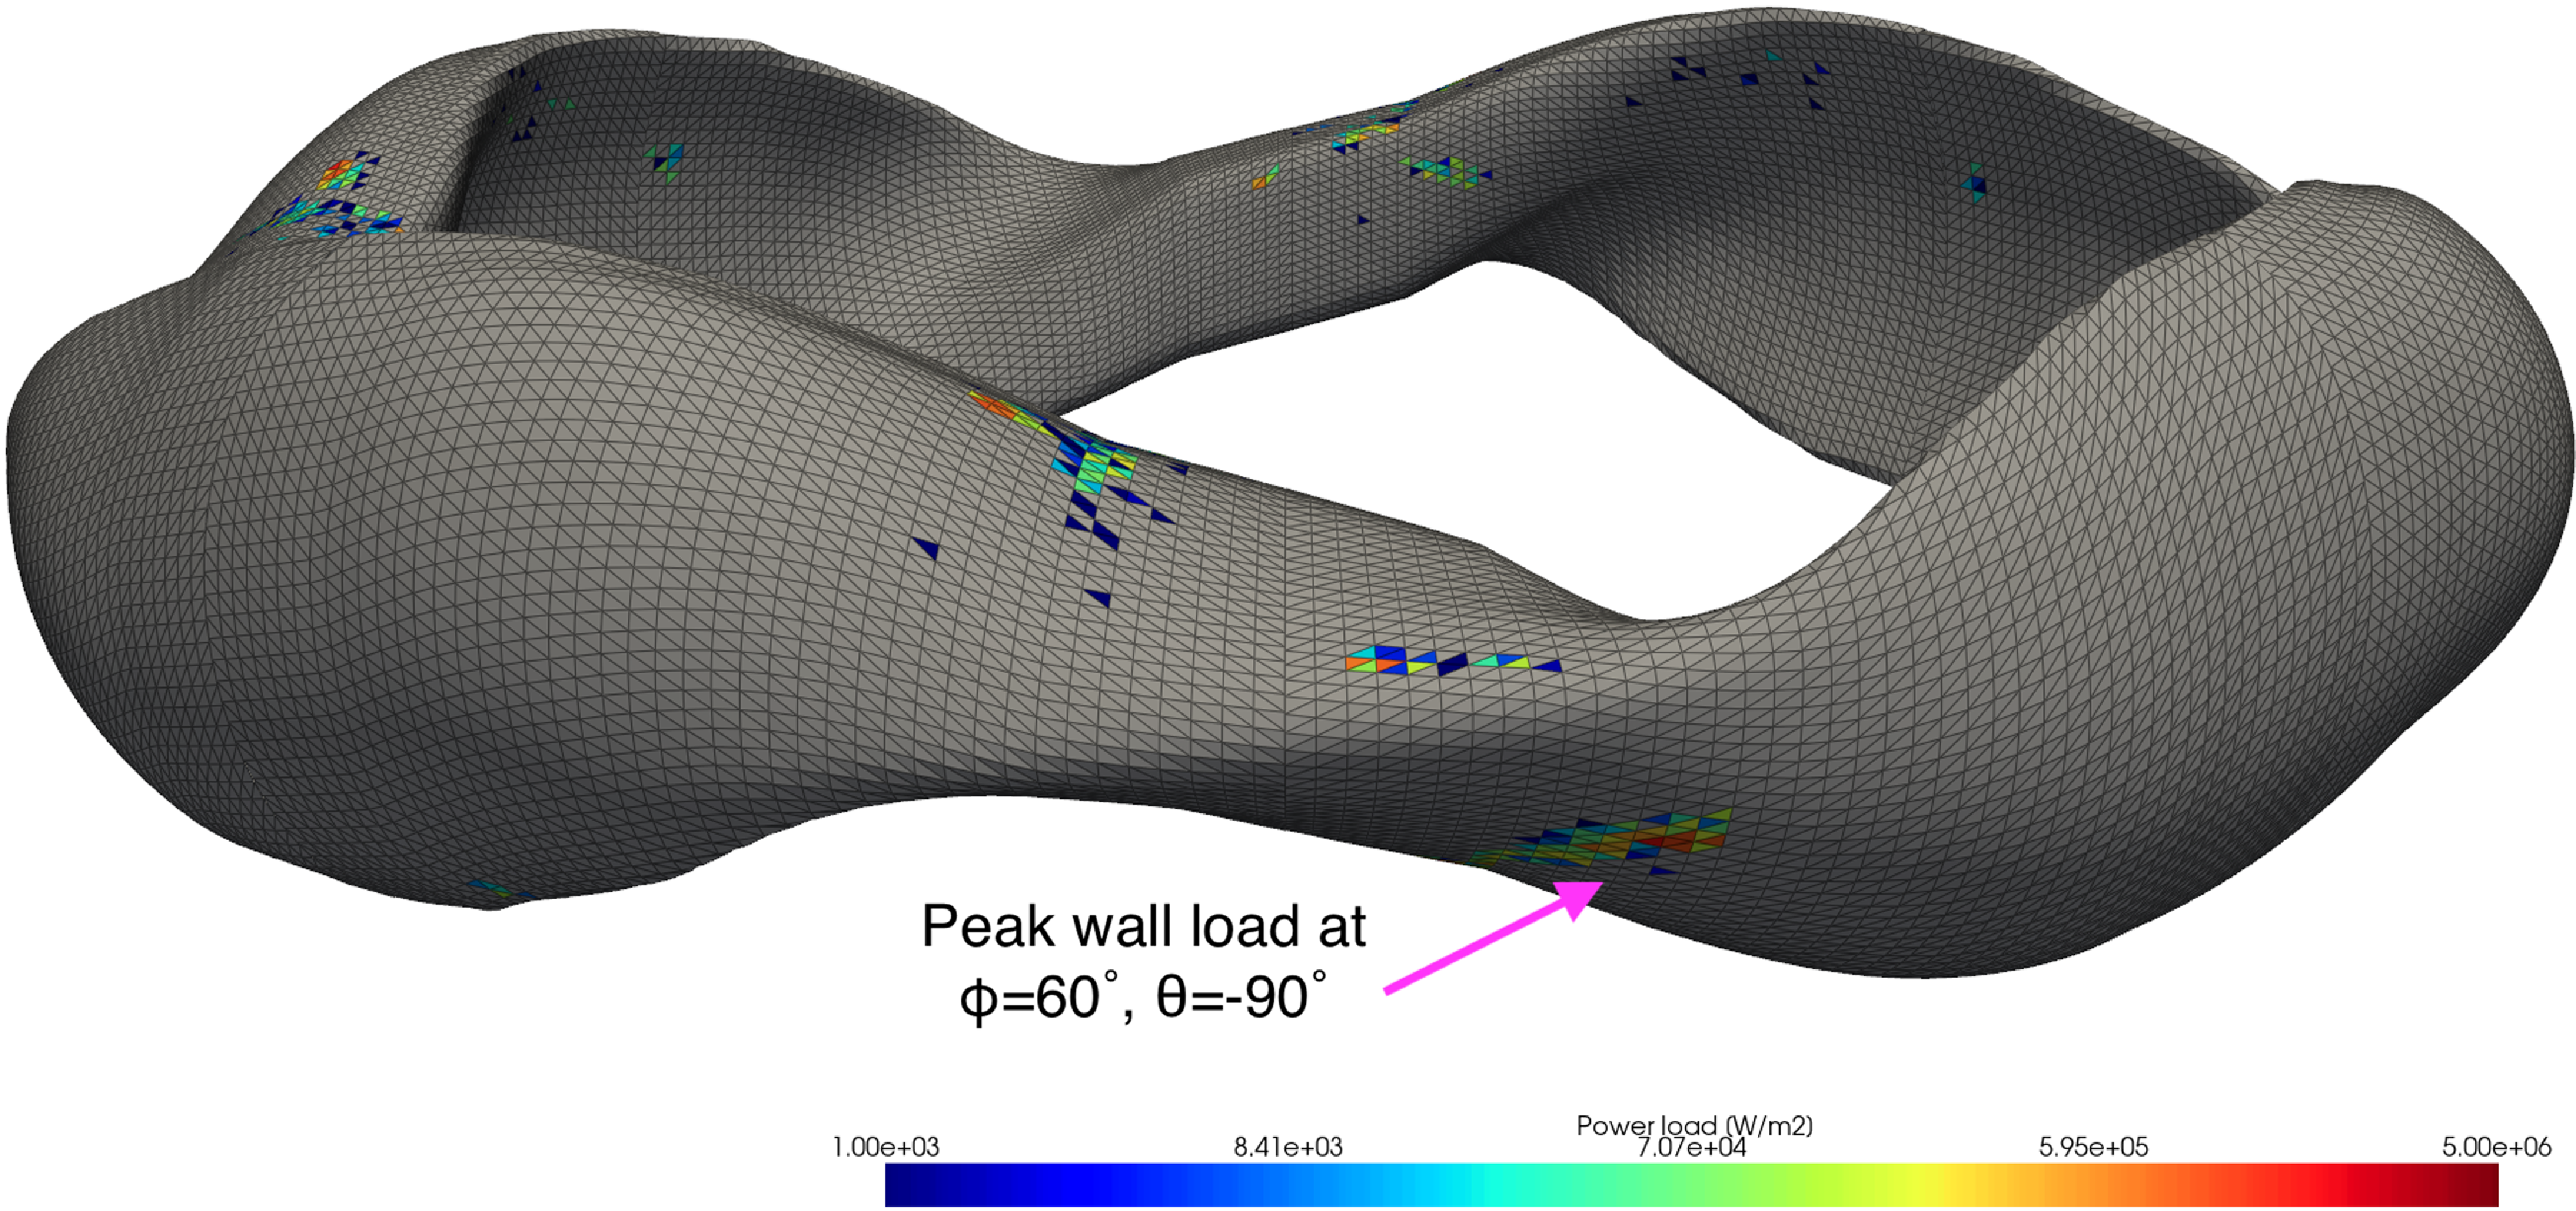
 $\nabla B$
drifts. In figure 12, we show power wall loads in 3-D for the ASCOT5 simulation using the ITW. Peak wall loads are shown with an arrow, other hot spots in the MW/m
$\nabla B$
drifts. In figure 12, we show power wall loads in 3-D for the ASCOT5 simulation using the ITW. Peak wall loads are shown with an arrow, other hot spots in the MW/m $^2$
range are visible in other locations, but these are lower than the peak value of 2.51 MW m-
$^2$
range are visible in other locations, but these are lower than the peak value of 2.51 MW m- $^2$
for this wall.
$^2$
for this wall.
Power wall loads on the $\theta \phi$
-plane for flat SOL profiles for wall with (a)
$\theta \phi$
-plane for flat SOL profiles for wall with (a) $\Delta _w=30$
, (b)
$\Delta _w=30$
, (b) $\Delta _w=70$
and (c) for the ITW. Only the first field period (
$\Delta _w=70$
and (c) for the ITW. Only the first field period ( $0^\circ \leq \phi \leq 90^\circ$
) is shown given the four-field-period periodicity of wall loads in ASCOT5 simulations. (d) Poincaré sections of Infinity Two at
$0^\circ \leq \phi \leq 90^\circ$
) is shown given the four-field-period periodicity of wall loads in ASCOT5 simulations. (d) Poincaré sections of Infinity Two at $\phi =60^\circ$
show the approximate poloidal locations,
$\phi =60^\circ$
show the approximate poloidal locations, $\theta$
, where peak wall loads occur.
$\theta$
, where peak wall loads occur.
Power wall loads of ASCOT5 simulation using the ITW in 3-D geometry. The edges of the triangles used in ASCOT5 simulations are shown in black. Reddish triangles show wall elements with higher values of power loads. Grey triangles show wall elements with negligible (below 1 kW m- $^2$
) power loads.
$^2$
) power loads.
From this analysis, we conclude that the lowest peak wall loads due to alpha-particle losses to the wall are found to be approximately 2.17 MW m- $^{2}$
, for the wall with
$^{2}$
, for the wall with $\Delta _w=30$
, with localised poloidal position close to the x-point of the magnetic island chain outside the plasma volume of Infinity Two, see figure 11(d). Other power loads in these simulations are in the range of tens of kW m-
$\Delta _w=30$
, with localised poloidal position close to the x-point of the magnetic island chain outside the plasma volume of Infinity Two, see figure 11(d). Other power loads in these simulations are in the range of tens of kW m- $^2$
to hundreds of kW m-
$^2$
to hundreds of kW m- $^2$
. It is expected that these peak power loads can be accommodated by existing helium-cooled plasma-facing component technologies, either through the use of specialty FW tiles (Arbeiter et al. Reference Arbeiter, Chen, Ghidersa, Klein, Neuberger, Ruck, Schlindwein, Schwab and von der Weth2017) or helium-cooled limiters (Norajitra et al. Reference Norajitra, Basuki, Giniyatulin, Hernandez, Kuznetsov, Mazoul, Richou and Spatafora2015). Further, this suggest that there might be an optimal shaping and separation between the wall and plasma volume that can reduce peak power loads with respect to the standard ITW. Different collisional conditions at the SOL seem to modify peak wall loads by modifying slightly the wetted area but preserving the same patterns on the
$^2$
. It is expected that these peak power loads can be accommodated by existing helium-cooled plasma-facing component technologies, either through the use of specialty FW tiles (Arbeiter et al. Reference Arbeiter, Chen, Ghidersa, Klein, Neuberger, Ruck, Schlindwein, Schwab and von der Weth2017) or helium-cooled limiters (Norajitra et al. Reference Norajitra, Basuki, Giniyatulin, Hernandez, Kuznetsov, Mazoul, Richou and Spatafora2015). Further, this suggest that there might be an optimal shaping and separation between the wall and plasma volume that can reduce peak power loads with respect to the standard ITW. Different collisional conditions at the SOL seem to modify peak wall loads by modifying slightly the wetted area but preserving the same patterns on the $\theta \phi$
-plane.
$\theta \phi$
-plane.
5. Stability of Alfvén eigenmodes
In this section, we assess the Alfvén eigenmode (AE) activity driven by alpha particles in Infinity Two. Alfvén waves are ubiquitous collective modes supported by thermal plasma in the presence of a magnetic field. The frequency at which Alfvén waves occur depends on local plasma conditions. In the case of toroidal plasmas with radial plasma profiles and sheared magnetic fields, the wave frequency follows a radial dependence, too. This is known as the Alfvén continuum. In these plasmas, coupling between counter-propagating Alfvén waves might occur due to the toroidal and/or poloidal periodicity of the magnetic field, leading to regions in frequency where these Alfvén waves cannot exist. This is the result of destructive interference between coupled waves. These regions are known as Alfvén gaps (Heidbrink Reference Heidbrink2008). In these gaps, radially extended, weakly damped modes might be driven unstable by alpha particles. We aim to identify these modes in Infinity Two, if any, that may affect the confinement of fusion-born alpha particles and cause inefficient plasma heating and enhancement of wall loads.
For this, we use the STELLGAP code to compute the Alfvén continuum and Alfvén gaps of Infinity Two. The FAR3d code is used to assess the stability of the dominant and sub-dominant Alfvén eigenmodes existing in these gaps. The FAR3d code solves a reduced set of equations for high-aspect ratio plasmas and moderate $\beta$
-values (of the order of the inverse aspect ratio), retaining the toroidal angle dependency in an exact three-dimensional VMEC equilibrium. In these simulations, we include the effects of finite Larmor radius (FLR) damping effects of thermal and energetic ions as well as electron–ion Landau damping. The free-energy source of alpha-particle destabilisation of AE is provided to FAR3d via moments of the gyro-kinetic distribution function of the alpha particles, specifically, the alpha-particle density and their average parallel velocity. The correct model calibration requires performing gyro-kinetic simulations to calculate the Landau closure coefficients in the gyro-fluid simulations, matching the analytic TAE growth rates of the two-pole approximation of the plasma dispersion function with a Lorentzian energy distribution function for the energetic particles. This calibration has been done for DIII-D tokamak geometry by matching the gyro-fliud response function with its kinetic analogue for a parallel propagating Alfvén wave (Spong Reference Spong2013). The lowest-order Lorentzian can be matched either to a Maxwellian or to a slowing-down distribution by choosing an equivalent average energy. In our assessment, we use a Maxwellian distribution for the alpha particles using a temperature that matches the moment-averaged temperature of the simulated alpha-particle distribution, see discussion in § 2.3 of Reference Varela, Spong, Garcia, Ghai and OrtizVarela et al. (2024d). Previous benchmarking studies validated FAR3d code results with the gyro-kinetic codes EUTERPE, GEM, GTC, GYRO and ORB, with the hybrid code MEGA, and with the perturbative eigenvalue NOVA-K, see Taimourzadeh et al. (Reference Taimourzadeh2019) for details. The FAR3d code has been validated against experimental measurements in helical plasmas such as LHD (Varela et al. Reference Varela, Spong and Garcia2017b
, Reference Varela, Spong, Garcia, Ohdachi, Watanabe and Seki2019a
, Reference Varela, Nagasaki, Nagaoka, Yamamoto, Watanabe, Spong, Garcia, Cappa and Azegami2020a
, Reference Varela, Spong, Garcia, Ohdachi, Watanabe, Seki and Ghai2021, Reference Varela, Spong, Todo, Garcia, Ghai, Ortiz and Seki2022b
, Reference Varela2024a,Reference Varelab), TJ-II (Varela et al. Reference Varela, Spong and Garcia2017a
; Cappa et al. Reference Cappa2021; Eliseev et al. Reference Eliseev2021) and Heliotron J (Yamamoto et al. Reference Yamamoto2020; Varela et al. Reference Varela, Nagasaki, Nagaoka, Yamamoto, Watanabe, Spong, Garcia, Cappa and Azegami2020b
, Reference Varela2022a
). Similarly, validation against experimental measurements in tokamak plasmas, such as DIII-D (Pace et al. Reference Pace2018; Varela et al. Reference Varela2018, Reference Varela, Spong, Murakami, Garcia, D’Azevedo, Van Zeeland and Munaretto2019b
; Huang et al. Reference Huang2020; Spong et al. Reference Spong, Van Zeeland, Heidbrink, Du, Varela, Garcia and Ghai2021; Ghai et al. Reference Ghai, Spong, Varela, Garcia, Van Zeeland and Austin2021), EAST (Wang et al. Reference Wang2023; Sun et al. Reference Sun2024) and JET (Garcia et al. Reference Garcia2024), has also been done.
$\beta$
-values (of the order of the inverse aspect ratio), retaining the toroidal angle dependency in an exact three-dimensional VMEC equilibrium. In these simulations, we include the effects of finite Larmor radius (FLR) damping effects of thermal and energetic ions as well as electron–ion Landau damping. The free-energy source of alpha-particle destabilisation of AE is provided to FAR3d via moments of the gyro-kinetic distribution function of the alpha particles, specifically, the alpha-particle density and their average parallel velocity. The correct model calibration requires performing gyro-kinetic simulations to calculate the Landau closure coefficients in the gyro-fluid simulations, matching the analytic TAE growth rates of the two-pole approximation of the plasma dispersion function with a Lorentzian energy distribution function for the energetic particles. This calibration has been done for DIII-D tokamak geometry by matching the gyro-fliud response function with its kinetic analogue for a parallel propagating Alfvén wave (Spong Reference Spong2013). The lowest-order Lorentzian can be matched either to a Maxwellian or to a slowing-down distribution by choosing an equivalent average energy. In our assessment, we use a Maxwellian distribution for the alpha particles using a temperature that matches the moment-averaged temperature of the simulated alpha-particle distribution, see discussion in § 2.3 of Reference Varela, Spong, Garcia, Ghai and OrtizVarela et al. (2024d). Previous benchmarking studies validated FAR3d code results with the gyro-kinetic codes EUTERPE, GEM, GTC, GYRO and ORB, with the hybrid code MEGA, and with the perturbative eigenvalue NOVA-K, see Taimourzadeh et al. (Reference Taimourzadeh2019) for details. The FAR3d code has been validated against experimental measurements in helical plasmas such as LHD (Varela et al. Reference Varela, Spong and Garcia2017b
, Reference Varela, Spong, Garcia, Ohdachi, Watanabe and Seki2019a
, Reference Varela, Nagasaki, Nagaoka, Yamamoto, Watanabe, Spong, Garcia, Cappa and Azegami2020a
, Reference Varela, Spong, Garcia, Ohdachi, Watanabe, Seki and Ghai2021, Reference Varela, Spong, Todo, Garcia, Ghai, Ortiz and Seki2022b
, Reference Varela2024a,Reference Varelab), TJ-II (Varela et al. Reference Varela, Spong and Garcia2017a
; Cappa et al. Reference Cappa2021; Eliseev et al. Reference Eliseev2021) and Heliotron J (Yamamoto et al. Reference Yamamoto2020; Varela et al. Reference Varela, Nagasaki, Nagaoka, Yamamoto, Watanabe, Spong, Garcia, Cappa and Azegami2020b
, Reference Varela2022a
). Similarly, validation against experimental measurements in tokamak plasmas, such as DIII-D (Pace et al. Reference Pace2018; Varela et al. Reference Varela2018, Reference Varela, Spong, Murakami, Garcia, D’Azevedo, Van Zeeland and Munaretto2019b
; Huang et al. Reference Huang2020; Spong et al. Reference Spong, Van Zeeland, Heidbrink, Du, Varela, Garcia and Ghai2021; Ghai et al. Reference Ghai, Spong, Varela, Garcia, Van Zeeland and Austin2021), EAST (Wang et al. Reference Wang2023; Sun et al. Reference Sun2024) and JET (Garcia et al. Reference Garcia2024), has also been done.
Figure 13(a), shows the rotational transform of Infinity Two, which is optimised to avoid major resonant surfaces in the core and to resonate with the $n/m = 4/5$
surface at the edge. Figure 13(b) shows the radial profile of alpha-particle density and energy used for this assessment. These distributions are taken from a collisional GC ASCOT5 simulation at
$n/m = 4/5$
surface at the edge. Figure 13(b) shows the radial profile of alpha-particle density and energy used for this assessment. These distributions are taken from a collisional GC ASCOT5 simulation at $t=50$
ms. At this time in the simulation, the alpha particles have redistributed in the core plasma following drifts and start to slow down, with peak energy of approximately 2.0 MeV at the magnetic axis and mean average energy of the entire distribution of 1.48 MeV. These alpha particles have an average velocity of
$t=50$
ms. At this time in the simulation, the alpha particles have redistributed in the core plasma following drifts and start to slow down, with peak energy of approximately 2.0 MeV at the magnetic axis and mean average energy of the entire distribution of 1.48 MeV. These alpha particles have an average velocity of $v_\alpha /V_A \sim 0.7$
at the core and
$v_\alpha /V_A \sim 0.7$
at the core and $v_\alpha /V_A \sim 0.3$
at the edge, suggesting that alpha particles can potentially drive instabilities. Thus, the importance of performing this stability analysis. Here,
$v_\alpha /V_A \sim 0.3$
at the edge, suggesting that alpha particles can potentially drive instabilities. Thus, the importance of performing this stability analysis. Here, $V_A$
is the local Alfvén velocity. In figure 13(c), we analyse the contribution of alpha particles of the slowing-down distribution (Alonso et al. Reference Alonso, Calvo, Carralero, Velasco, García-Regaña, Palermo and Rapisarda2022) with different energies (red filled circles) to the total
$V_A$
is the local Alfvén velocity. In figure 13(c), we analyse the contribution of alpha particles of the slowing-down distribution (Alonso et al. Reference Alonso, Calvo, Carralero, Velasco, García-Regaña, Palermo and Rapisarda2022) with different energies (red filled circles) to the total $\langle \beta _\alpha \rangle =0.31\,\%$
(black star). These
$\langle \beta _\alpha \rangle =0.31\,\%$
(black star). These $\langle \beta _\alpha \rangle$
for different energy ranges of the alpha-particle distribution are the ones used in the analysis in § 5.1, where the stability limit of Infinity Two is explored. The geometry of Infinity Two is included in STELLGAP and FAR3d simulations via Boozer coordinates of the free-boundary VMEC equilibrium. The normalised radius is discretised using 200 radial points. Our sensitivity analysis varying the number of radial points show this is already enough resolution to compute the Alfvén continuum with STELLGAP and to perform the stability analysis of FAR3d.
$\langle \beta _\alpha \rangle$
for different energy ranges of the alpha-particle distribution are the ones used in the analysis in § 5.1, where the stability limit of Infinity Two is explored. The geometry of Infinity Two is included in STELLGAP and FAR3d simulations via Boozer coordinates of the free-boundary VMEC equilibrium. The normalised radius is discretised using 200 radial points. Our sensitivity analysis varying the number of radial points show this is already enough resolution to compute the Alfvén continuum with STELLGAP and to perform the stability analysis of FAR3d.
(a) Iota profile of Infinity Two. The dashed coloured vertical and horizontal lines indicate the radial location of the main rational surfaces. (b) Alpha-particle density (black line) and energy (blue) radial profiles in FAR3d simulations. (c) Total alpha-particle beta $\langle \beta _\alpha \rangle$
(black star) and
$\langle \beta _\alpha \rangle$
(black star) and $\langle \beta _\alpha \rangle$
for alpha particles with different ranges of energies (red filled circles) according to a theoretical slowing-down distribution function (Alonso et al. Reference Alonso, Calvo, Carralero, Velasco, García-Regaña, Palermo and Rapisarda2022). Here, the total
$\langle \beta _\alpha \rangle$
for alpha particles with different ranges of energies (red filled circles) according to a theoretical slowing-down distribution function (Alonso et al. Reference Alonso, Calvo, Carralero, Velasco, García-Regaña, Palermo and Rapisarda2022). Here, the total $\langle \beta _\alpha \rangle$
is the sum of the
$\langle \beta _\alpha \rangle$
is the sum of the $\langle \beta _\alpha \rangle$
for alpha particles with different energies. Note that
$\langle \beta _\alpha \rangle$
for alpha particles with different energies. Note that $\langle \beta _\alpha \rangle$
is very small (
$\langle \beta _\alpha \rangle$
is very small ( $\lt 10^{-3} \,\%$
) for alpha-particle energies
$\lt 10^{-3} \,\%$
) for alpha-particle energies $\mathcal {E}\lt 1.0$
MeV.
$\mathcal {E}\lt 1.0$
MeV.
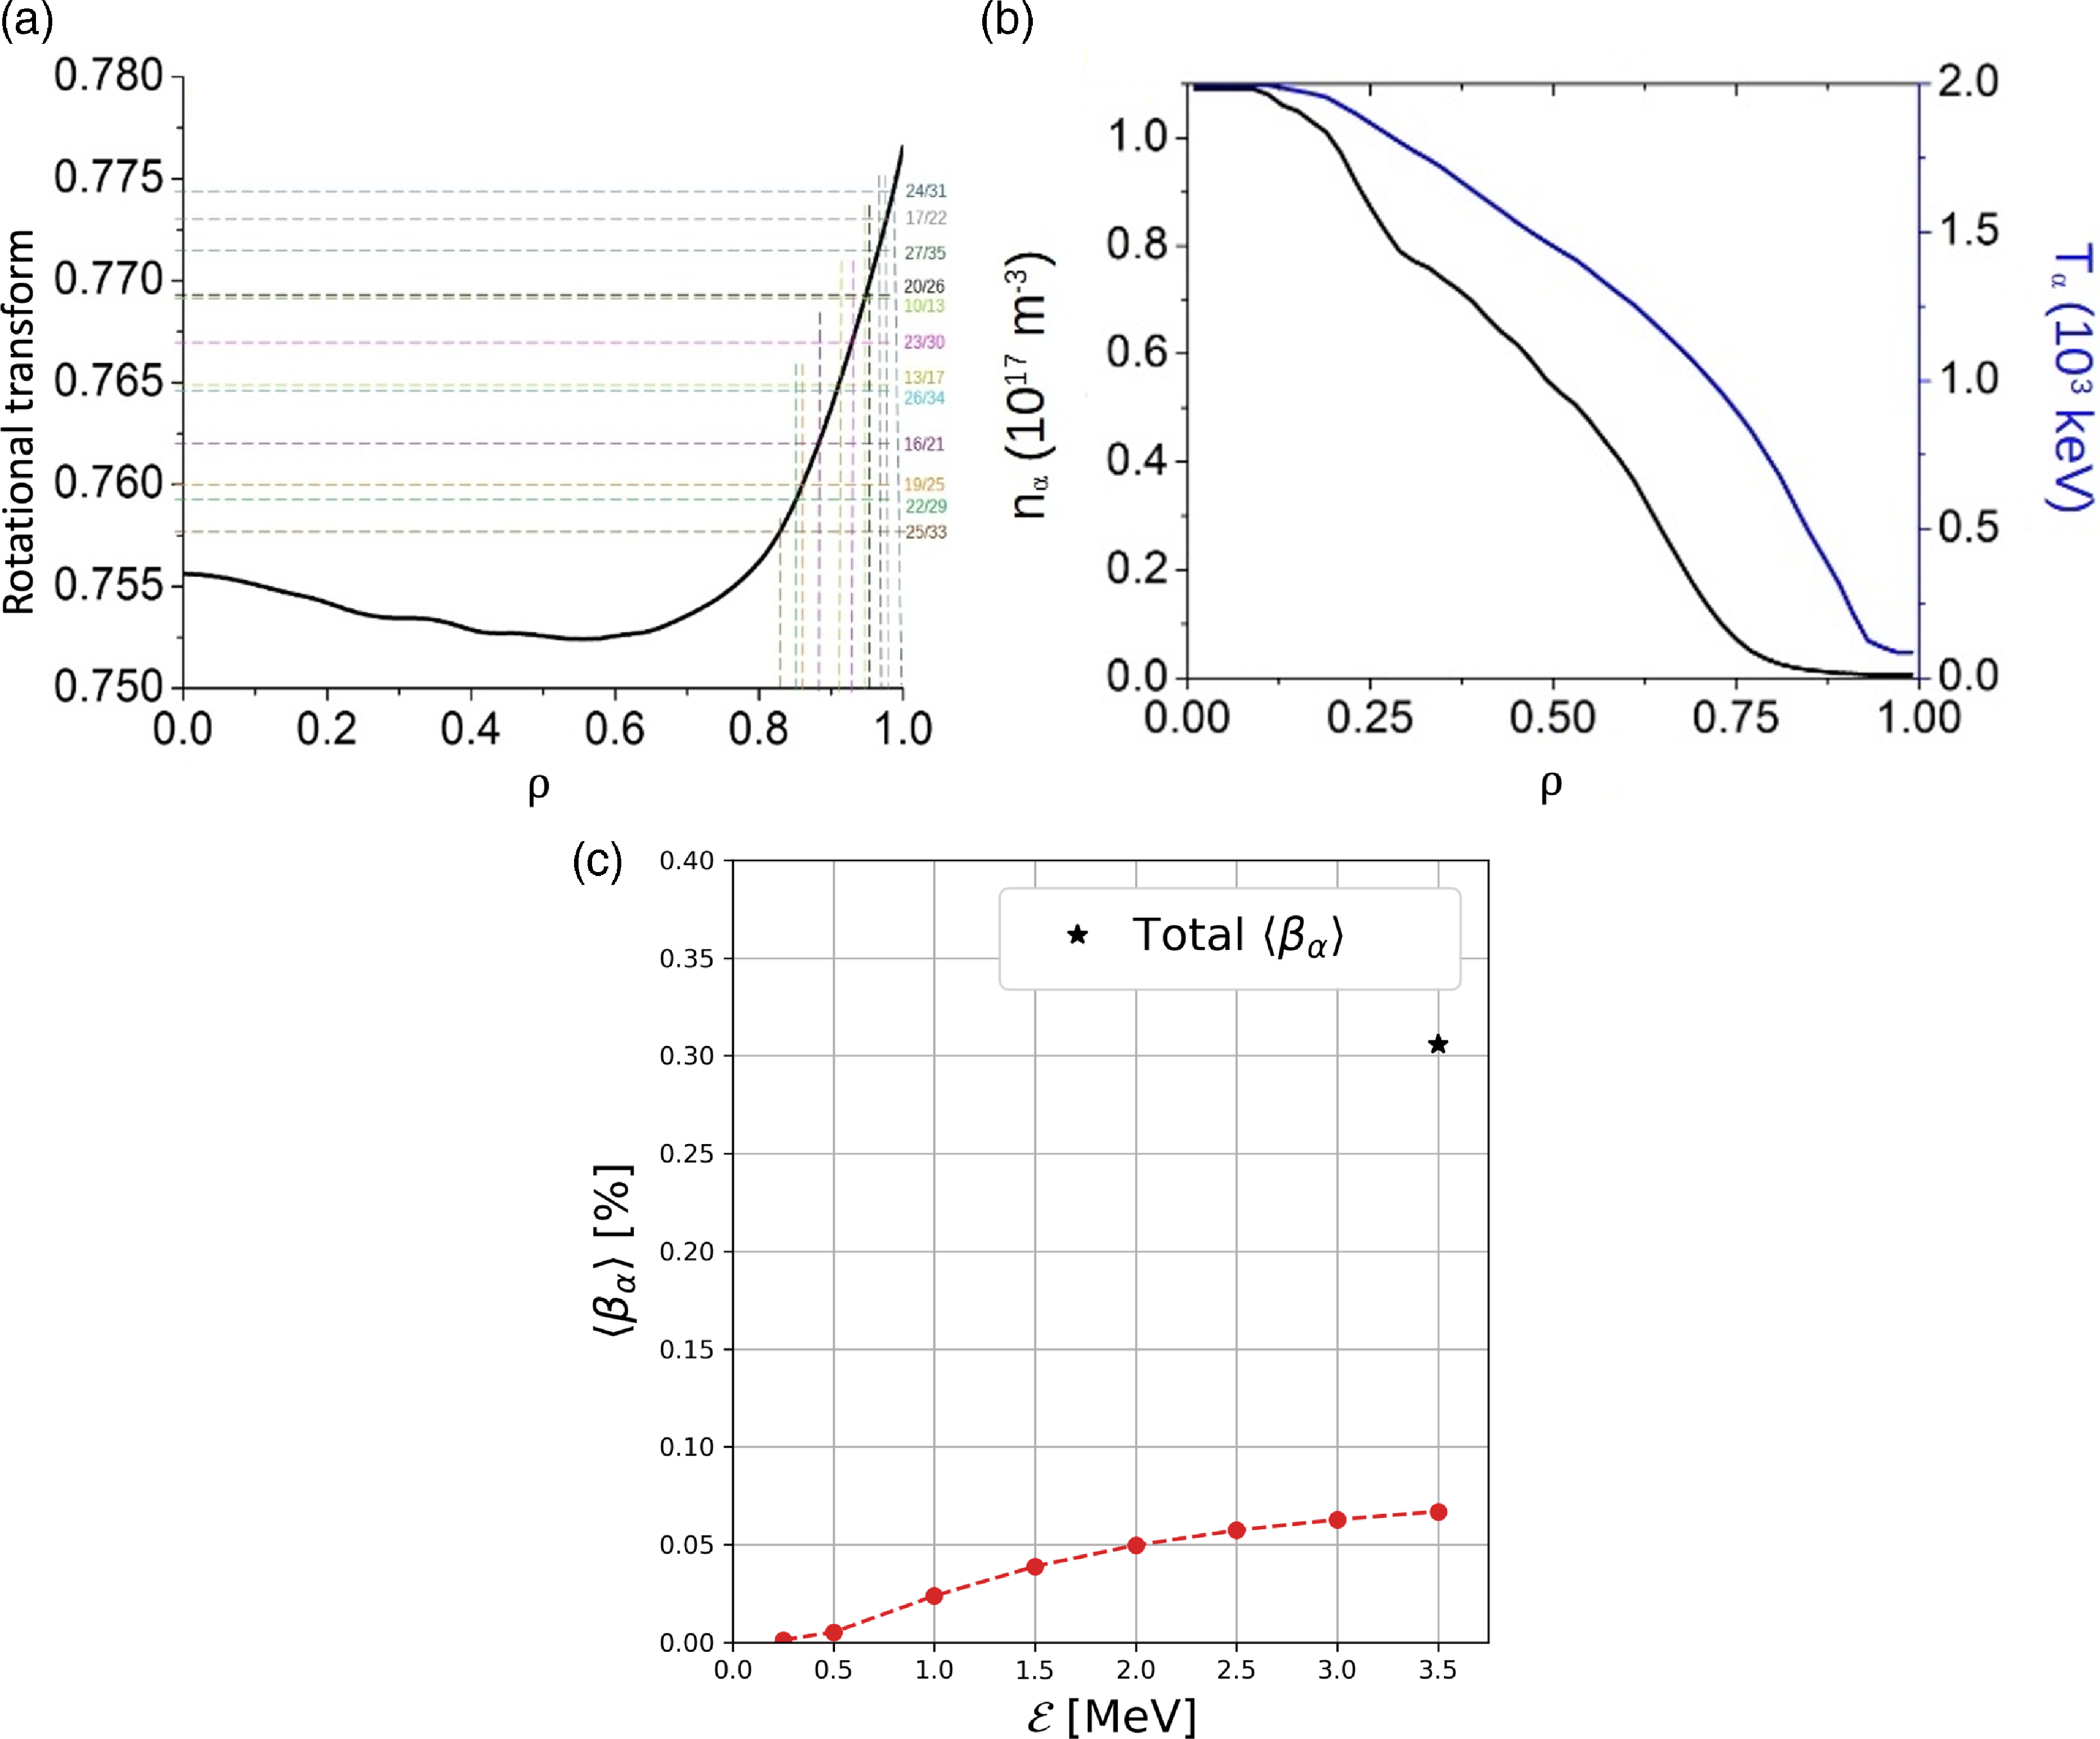
In figure 14, we show the Alfvén gap structure of Infinity Two computed by STELLGAP for $n=0$
,
$n=0$
, $1$
and
$1$
and $2$
mode families. Here, a given mode family
$2$
mode families. Here, a given mode family $n=k$
is defined as
$n=k$
is defined as $n=k\ \mbox {mod}\ N$
, where
$n=k\ \mbox {mod}\ N$
, where $N=4$
is the magnetic field periods of Infinity Two. The Alfvén gaps are calculated for the modes
$N=4$
is the magnetic field periods of Infinity Two. The Alfvén gaps are calculated for the modes $n=0,4,8,12,16,20,24,28$
,
$n=0,4,8,12,16,20,24,28$
, $n=1,3,5,7,9,11,13,15,17,19,21,23,25,27$
and
$n=1,3,5,7,9,11,13,15,17,19,21,23,25,27$
and $n=2,6,10,14,18,22,26$
, including the coupling with the sound wave (BAE gap). In figure 14(a), we show the complete Alfvén gap structure including all three mode families. In figure 14(b), we show the Alfvén gap structure only for the
$n=2,6,10,14,18,22,26$
, including the coupling with the sound wave (BAE gap). In figure 14(a), we show the complete Alfvén gap structure including all three mode families. In figure 14(b), we show the Alfvén gap structure only for the $n=0$
mode family. In figures 14(c)–14(e), we separate the spectra to show the details of panel (b), and to label some of the Alfvén gaps as reference. In figures 14(f)–14(i), we do the same for mode family
$n=0$
mode family. In figures 14(c)–14(e), we separate the spectra to show the details of panel (b), and to label some of the Alfvén gaps as reference. In figures 14(f)–14(i), we do the same for mode family $n=1$
, and in figures 14(j)–14(m) for mode family
$n=1$
, and in figures 14(j)–14(m) for mode family $n=2$
. Wide BAE gaps cover all the minor radius (
$n=2$
. Wide BAE gaps cover all the minor radius ( $\rho = 0.0{-}0.75$
) in the frequency range of
$\rho = 0.0{-}0.75$
) in the frequency range of $5 {-} 50$
kHz. There are TAE gaps from the inner to outer plasma region in the frequency range of
$5 {-} 50$
kHz. There are TAE gaps from the inner to outer plasma region in the frequency range of $60 {-} 100$
kHz. In addition, broad EAE gaps are observed above
$60 {-} 100$
kHz. In addition, broad EAE gaps are observed above $100$
kHz.
$100$
kHz.
Alfvén gap structure of Infinity Two. (a) Complete spectra of Alfvén modes. (b), (f) and (j) Same spectra but separating mode families $n=0$
,
$n=0$
, $n=1$
,
$n=1$
, $n=2$
, respectively. (c)–(e) Break down of the spectra of panel (b) so we can label some of the computed Alfvén gaps as reference. (g)–(i) Details of panel (f) for the mode family
$n=2$
, respectively. (c)–(e) Break down of the spectra of panel (b) so we can label some of the computed Alfvén gaps as reference. (g)–(i) Details of panel (f) for the mode family $n=1$
, and (k)–(m) details of panel (j) for the mode family
$n=1$
, and (k)–(m) details of panel (j) for the mode family $n=2$
.
$n=2$
.
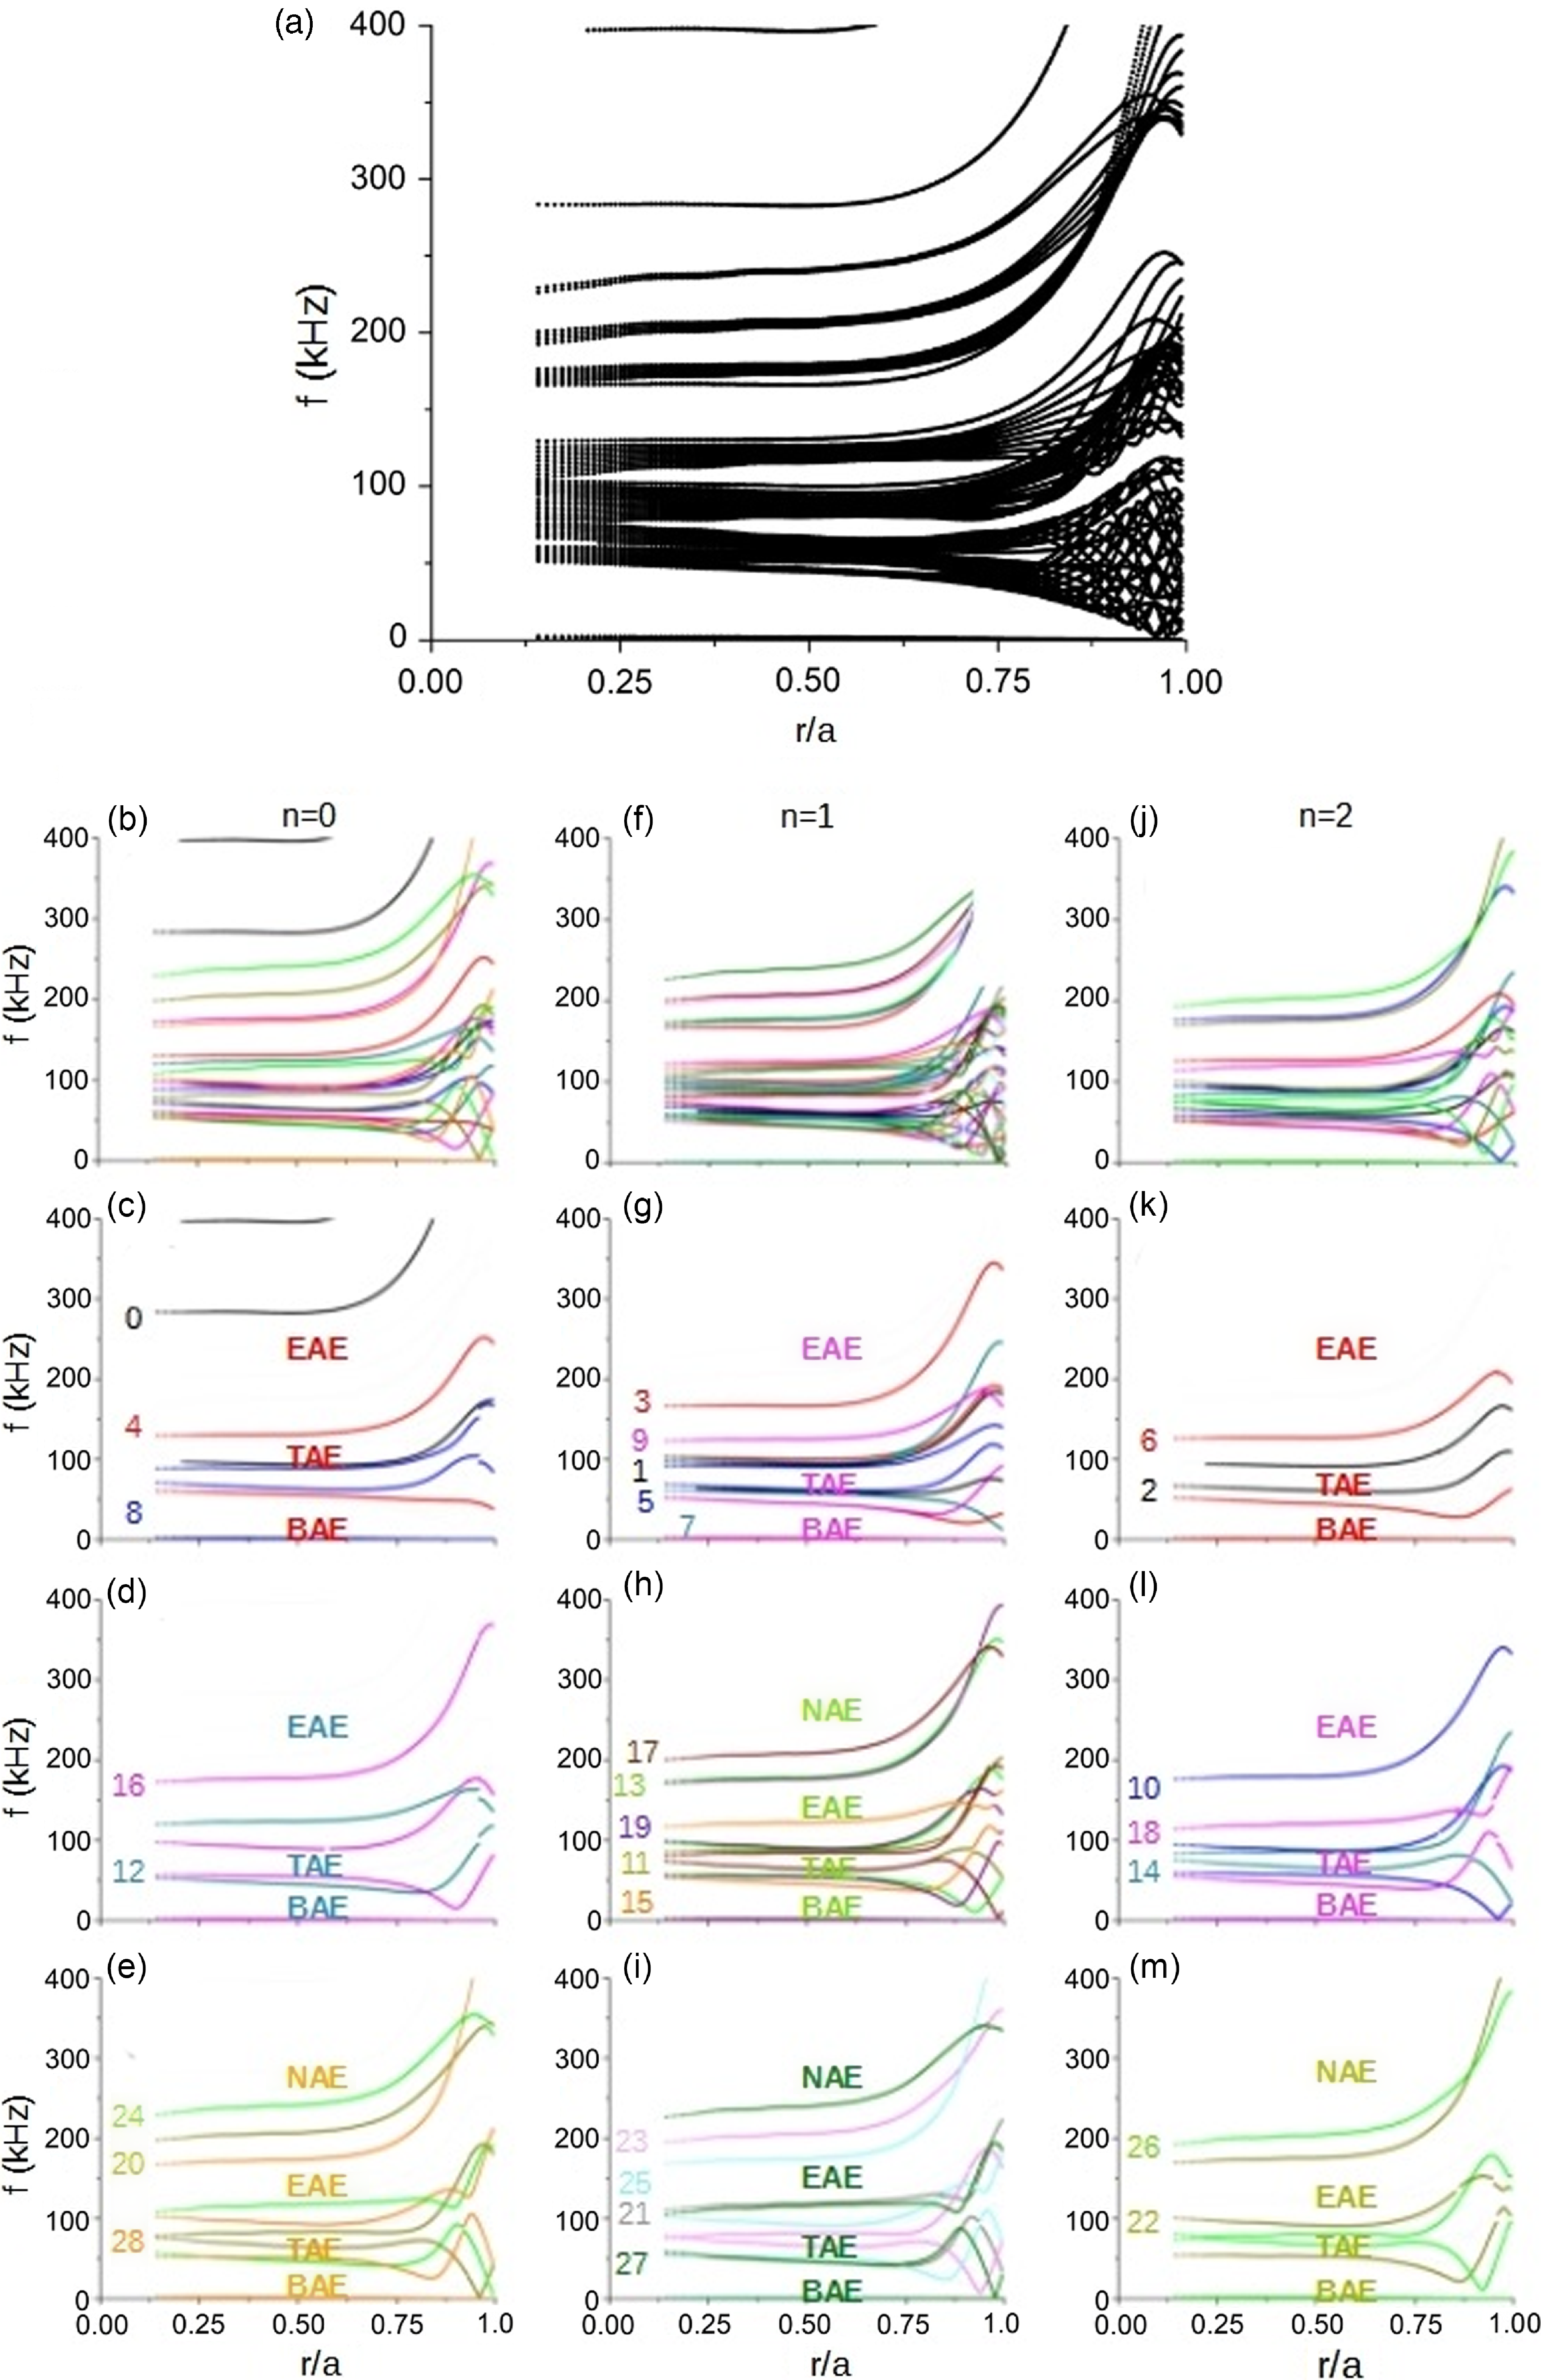
In figure 15, we show the expected helical gaps in Infinity Two as computed by STELLGAP. These gaps are located in the plasma periphery where no significant alpha-particle density gradient is observed from ASCOT5 simulations. Thus, destabilisation of helical AEs by alpha particles in these gaps is not likely to occur.
Helical Alfvén gaps in Infinity Two. Orange dashed oval indicates the radial location and frequency range of the helical gaps.
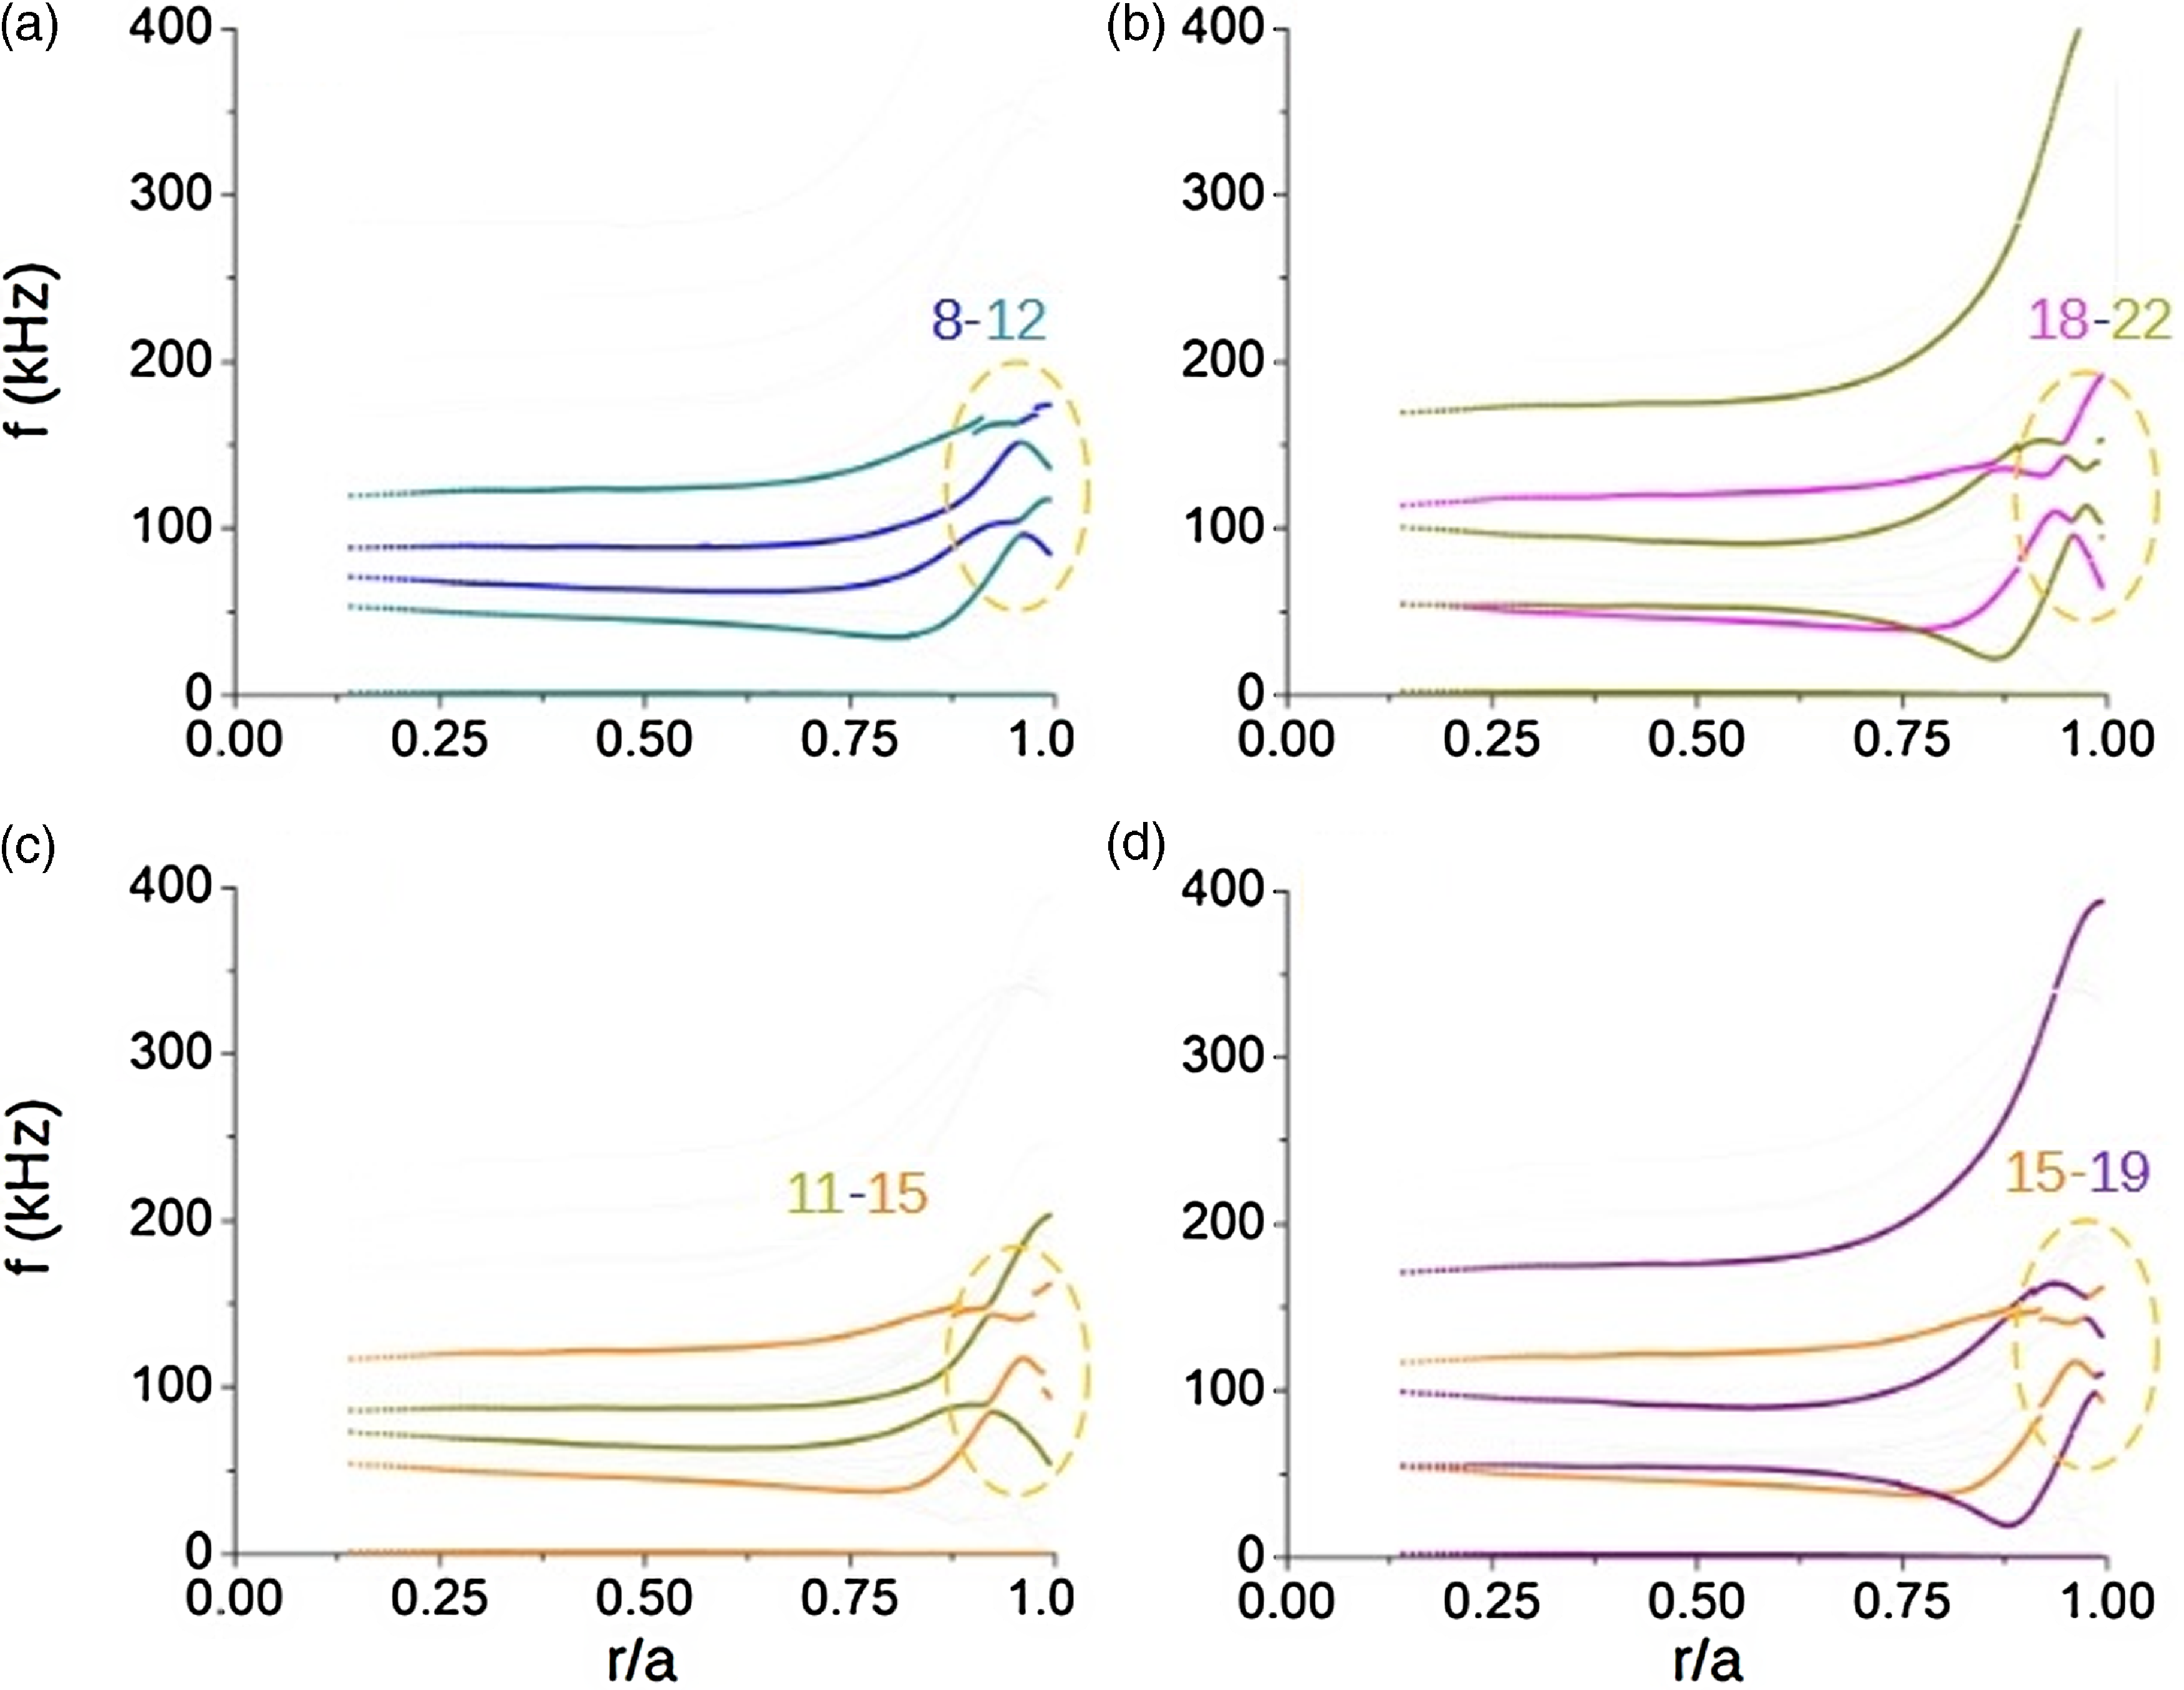
The stability assessment of AE that might occur in the Alfvén gaps obtained from STELLGAP simulations is now performed with FAR3d. The stability assessment includes the modes $n=1,3,5,7,9,11,13$
and
$n=1,3,5,7,9,11,13$
and $n=2,6,10,14$
.
$n=2,6,10,14$
.
The stability of AE modes in Infinity Two is mainly determined by the following factors: (1) the alpha-particle $\langle \beta _\alpha \rangle$
, driving the strength of the perturbation; (2) Alfvén continuum damping, dictated by the magnetic field structure and thermal plasma profiles; (3) FLR damping effects; and (4) electron–ion Landau damping. In Infinity Two, Alfvén continuum damping plays a relatively small role on reducing the radial extent of perturbations due to its weak magnetic shear (Varela et al. Reference Varela2024c
). Our FAR3d simulations with the alpha-particle density and energy profiles shown in figure 13 indicate the absence of unstable AE in the Alfvén gaps of Infinity Two, this is the result of its low alpha-particle beta,
$\langle \beta _\alpha \rangle$
, driving the strength of the perturbation; (2) Alfvén continuum damping, dictated by the magnetic field structure and thermal plasma profiles; (3) FLR damping effects; and (4) electron–ion Landau damping. In Infinity Two, Alfvén continuum damping plays a relatively small role on reducing the radial extent of perturbations due to its weak magnetic shear (Varela et al. Reference Varela2024c
). Our FAR3d simulations with the alpha-particle density and energy profiles shown in figure 13 indicate the absence of unstable AE in the Alfvén gaps of Infinity Two, this is the result of its low alpha-particle beta, $\langle \beta _\alpha \rangle = 0.31\,\%$
, not being large enough to drive any AE unstable.
$\langle \beta _\alpha \rangle = 0.31\,\%$
, not being large enough to drive any AE unstable.
5.1. Stability limit of Infinity Two
Finally, we address the issue of finding the stability limit of Infinity Two to AE activity driven by fusion-born alpha particles. This analysis provides information about trends of AE stability of Infinity Two away from its nominal steady-state operational regime. For this, we performed a parametric analysis varying beta of the simulated alpha-particle population. We perform this analysis for $\langle \beta _\alpha \rangle =0.2\,\%$
,
$\langle \beta _\alpha \rangle =0.2\,\%$
, $0.5\,\%$
,
$0.5\,\%$
, $1.0\,\%$
and
$1.0\,\%$
and $2.0\,\%$
. We note that when setting a value of
$2.0\,\%$
. We note that when setting a value of $\langle \beta _\alpha \rangle$
, we can either choose to keep fixed alpha-particle density and modify their energy, or to keep fixed energy and modify the alpha-particle density. In this analysis, we follow both approaches to mimic the effects of two populations of alpha particles: relatively low-density and high-energy alpha particles corresponding to alpha particles in the early slowing-down phase, and higher density and relatively low-energy alpha particles corresponding to alpha particles in the late slowing-down phase. The shape of the alpha-particle profile of figure 13 is kept fixed in this analysis, given that the profile shape is not observed to change significantly for alpha particles with energies ranging from 3.5 MeV down to 0.5 MeV in our ASCOT5 simulations. In a similar way to our analysis above, our FAR3d simulations for this parametric analysis use Maxwellian distributions with a temperature that matches the moment-averaged energy of the analysed alpha-particle population. Specifically, we analyse AE driven by alpha particles with
$\langle \beta _\alpha \rangle$
, we can either choose to keep fixed alpha-particle density and modify their energy, or to keep fixed energy and modify the alpha-particle density. In this analysis, we follow both approaches to mimic the effects of two populations of alpha particles: relatively low-density and high-energy alpha particles corresponding to alpha particles in the early slowing-down phase, and higher density and relatively low-energy alpha particles corresponding to alpha particles in the late slowing-down phase. The shape of the alpha-particle profile of figure 13 is kept fixed in this analysis, given that the profile shape is not observed to change significantly for alpha particles with energies ranging from 3.5 MeV down to 0.5 MeV in our ASCOT5 simulations. In a similar way to our analysis above, our FAR3d simulations for this parametric analysis use Maxwellian distributions with a temperature that matches the moment-averaged energy of the analysed alpha-particle population. Specifically, we analyse AE driven by alpha particles with $\mathcal {E} = 0.25$
, 0.50, 1.0, 1.5, 2.0, 2.5 and 3.0 MeV, that is, the same energies for which we calculate
$\mathcal {E} = 0.25$
, 0.50, 1.0, 1.5, 2.0, 2.5 and 3.0 MeV, that is, the same energies for which we calculate $\langle \beta _\alpha \rangle$
in figure 13(c). Also, we keep thermal plasma profiles and magnetic configuration fixed.
$\langle \beta _\alpha \rangle$
in figure 13(c). Also, we keep thermal plasma profiles and magnetic configuration fixed.
Our parametric analysis indicates that at high- $\langle \beta _\alpha \rangle$
particles in the early-slowing-down phase (
$\langle \beta _\alpha \rangle$
particles in the early-slowing-down phase ( $\mathcal {E}=1.5$
MeV to 2.0 MeV) lead to destabilisation of dominant low-frequency AEs, between 30 and 40 kHz, falling into the frequency range of BAEs. The critical value of
$\mathcal {E}=1.5$
MeV to 2.0 MeV) lead to destabilisation of dominant low-frequency AEs, between 30 and 40 kHz, falling into the frequency range of BAEs. The critical value of $\langle \beta _\alpha \rangle$
for the destabilisation of these AEs is
$\langle \beta _\alpha \rangle$
for the destabilisation of these AEs is $\langle \beta _\alpha \rangle =0.5\,\%$
, increasing to
$\langle \beta _\alpha \rangle =0.5\,\%$
, increasing to $\langle \beta _\alpha \rangle =1.0\,\%$
as we decrease the alpha-particle energy down to
$\langle \beta _\alpha \rangle =1.0\,\%$
as we decrease the alpha-particle energy down to $\mathcal {E}=1.5$
MeV. These critical values of
$\mathcal {E}=1.5$
MeV. These critical values of $\langle \beta _\alpha \rangle$
fall well above the operational
$\langle \beta _\alpha \rangle$
fall well above the operational $\langle \beta _\alpha \rangle =0.31\,\%$
of Infinity Two for beta values of alpha particles with
$\langle \beta _\alpha \rangle =0.31\,\%$
of Infinity Two for beta values of alpha particles with $\mathcal {E}\geq 1.5$
MeV.
$\mathcal {E}\geq 1.5$
MeV.
However alpha particles in the late slowing-down phase ( $\mathcal {E}\lt 1.5$
MeV) show the destabilisation of AEs above 70 kHz, corresponding to the frequency range of the TAE gap and lower bound of the EAE gap. Nevertheless, if the
$\mathcal {E}\lt 1.5$
MeV) show the destabilisation of AEs above 70 kHz, corresponding to the frequency range of the TAE gap and lower bound of the EAE gap. Nevertheless, if the $\langle \beta _\alpha \rangle$
is large enough, BAEs are the dominant instability. The critical value of
$\langle \beta _\alpha \rangle$
is large enough, BAEs are the dominant instability. The critical value of $\langle \beta _\alpha \rangle$
for destabilisation of these modes is
$\langle \beta _\alpha \rangle$
for destabilisation of these modes is $\langle \beta _\alpha \rangle =1.0\,\%$
for the
$\langle \beta _\alpha \rangle =1.0\,\%$
for the $n=1$
mode family. The critical
$n=1$
mode family. The critical $\langle \beta _\alpha \rangle$
decreases to
$\langle \beta _\alpha \rangle$
decreases to $\langle \beta _\alpha \rangle =0.5\,\%$
for alpha particles with
$\langle \beta _\alpha \rangle =0.5\,\%$
for alpha particles with $\mathcal {E} \lt 0.5$
MeV. The frequency of the dominant mode in this case is close to 120 kHz. We observe similar trends and mode structure for the unstable modes of the
$\mathcal {E} \lt 0.5$
MeV. The frequency of the dominant mode in this case is close to 120 kHz. We observe similar trends and mode structure for the unstable modes of the $n=2$
mode family. Importantly, GAEs are also identified in the parametric analysis, although their growth rates are smaller compared with BAE and TAE. Thus, GAEs are not the most limiting stability for the device performance.
$n=2$
mode family. Importantly, GAEs are also identified in the parametric analysis, although their growth rates are smaller compared with BAE and TAE. Thus, GAEs are not the most limiting stability for the device performance.
In figure 16, we show the growth rates and frequency ranges of dominant modes identified from this analysis driven by alpha particles with different energies when their beta is varied. The observed trend for growth rates of these dominant modes is that these increase as we increase alpha-particle beta, this being the main mechanism for destabilisation of AEs in Infinity Two. The analysis of dominant AEs also indicates that the resonance induced by alpha particles in the early-slowing-down phase lead to the destabilisation of BAEs, while alpha particles in the late slowing-down phase can trigger higher frequency modes in the range of the TAE and EAEs. BAEs shows a larger growth rate compared with the TAE and EAE.
From this analysis, we conclude that the required alpha-particle betas required to destabilise AEs in Infinity Two are much higher than those from its base operational regime, showing strong stability against AE activity. Importantly, we note that from past validation of FAR3d against gyro-kinetic simulations, these trends of stability are expected to hold.
(a) Growth rate and (b) frequency of dominant AE destabilised by the $n=1$
mode family. (c) Growth rate and (d) frequency of the dominant AE destabilised by the
$n=1$
mode family. (c) Growth rate and (d) frequency of the dominant AE destabilised by the $n=2$
mode family.
$n=2$
mode family.
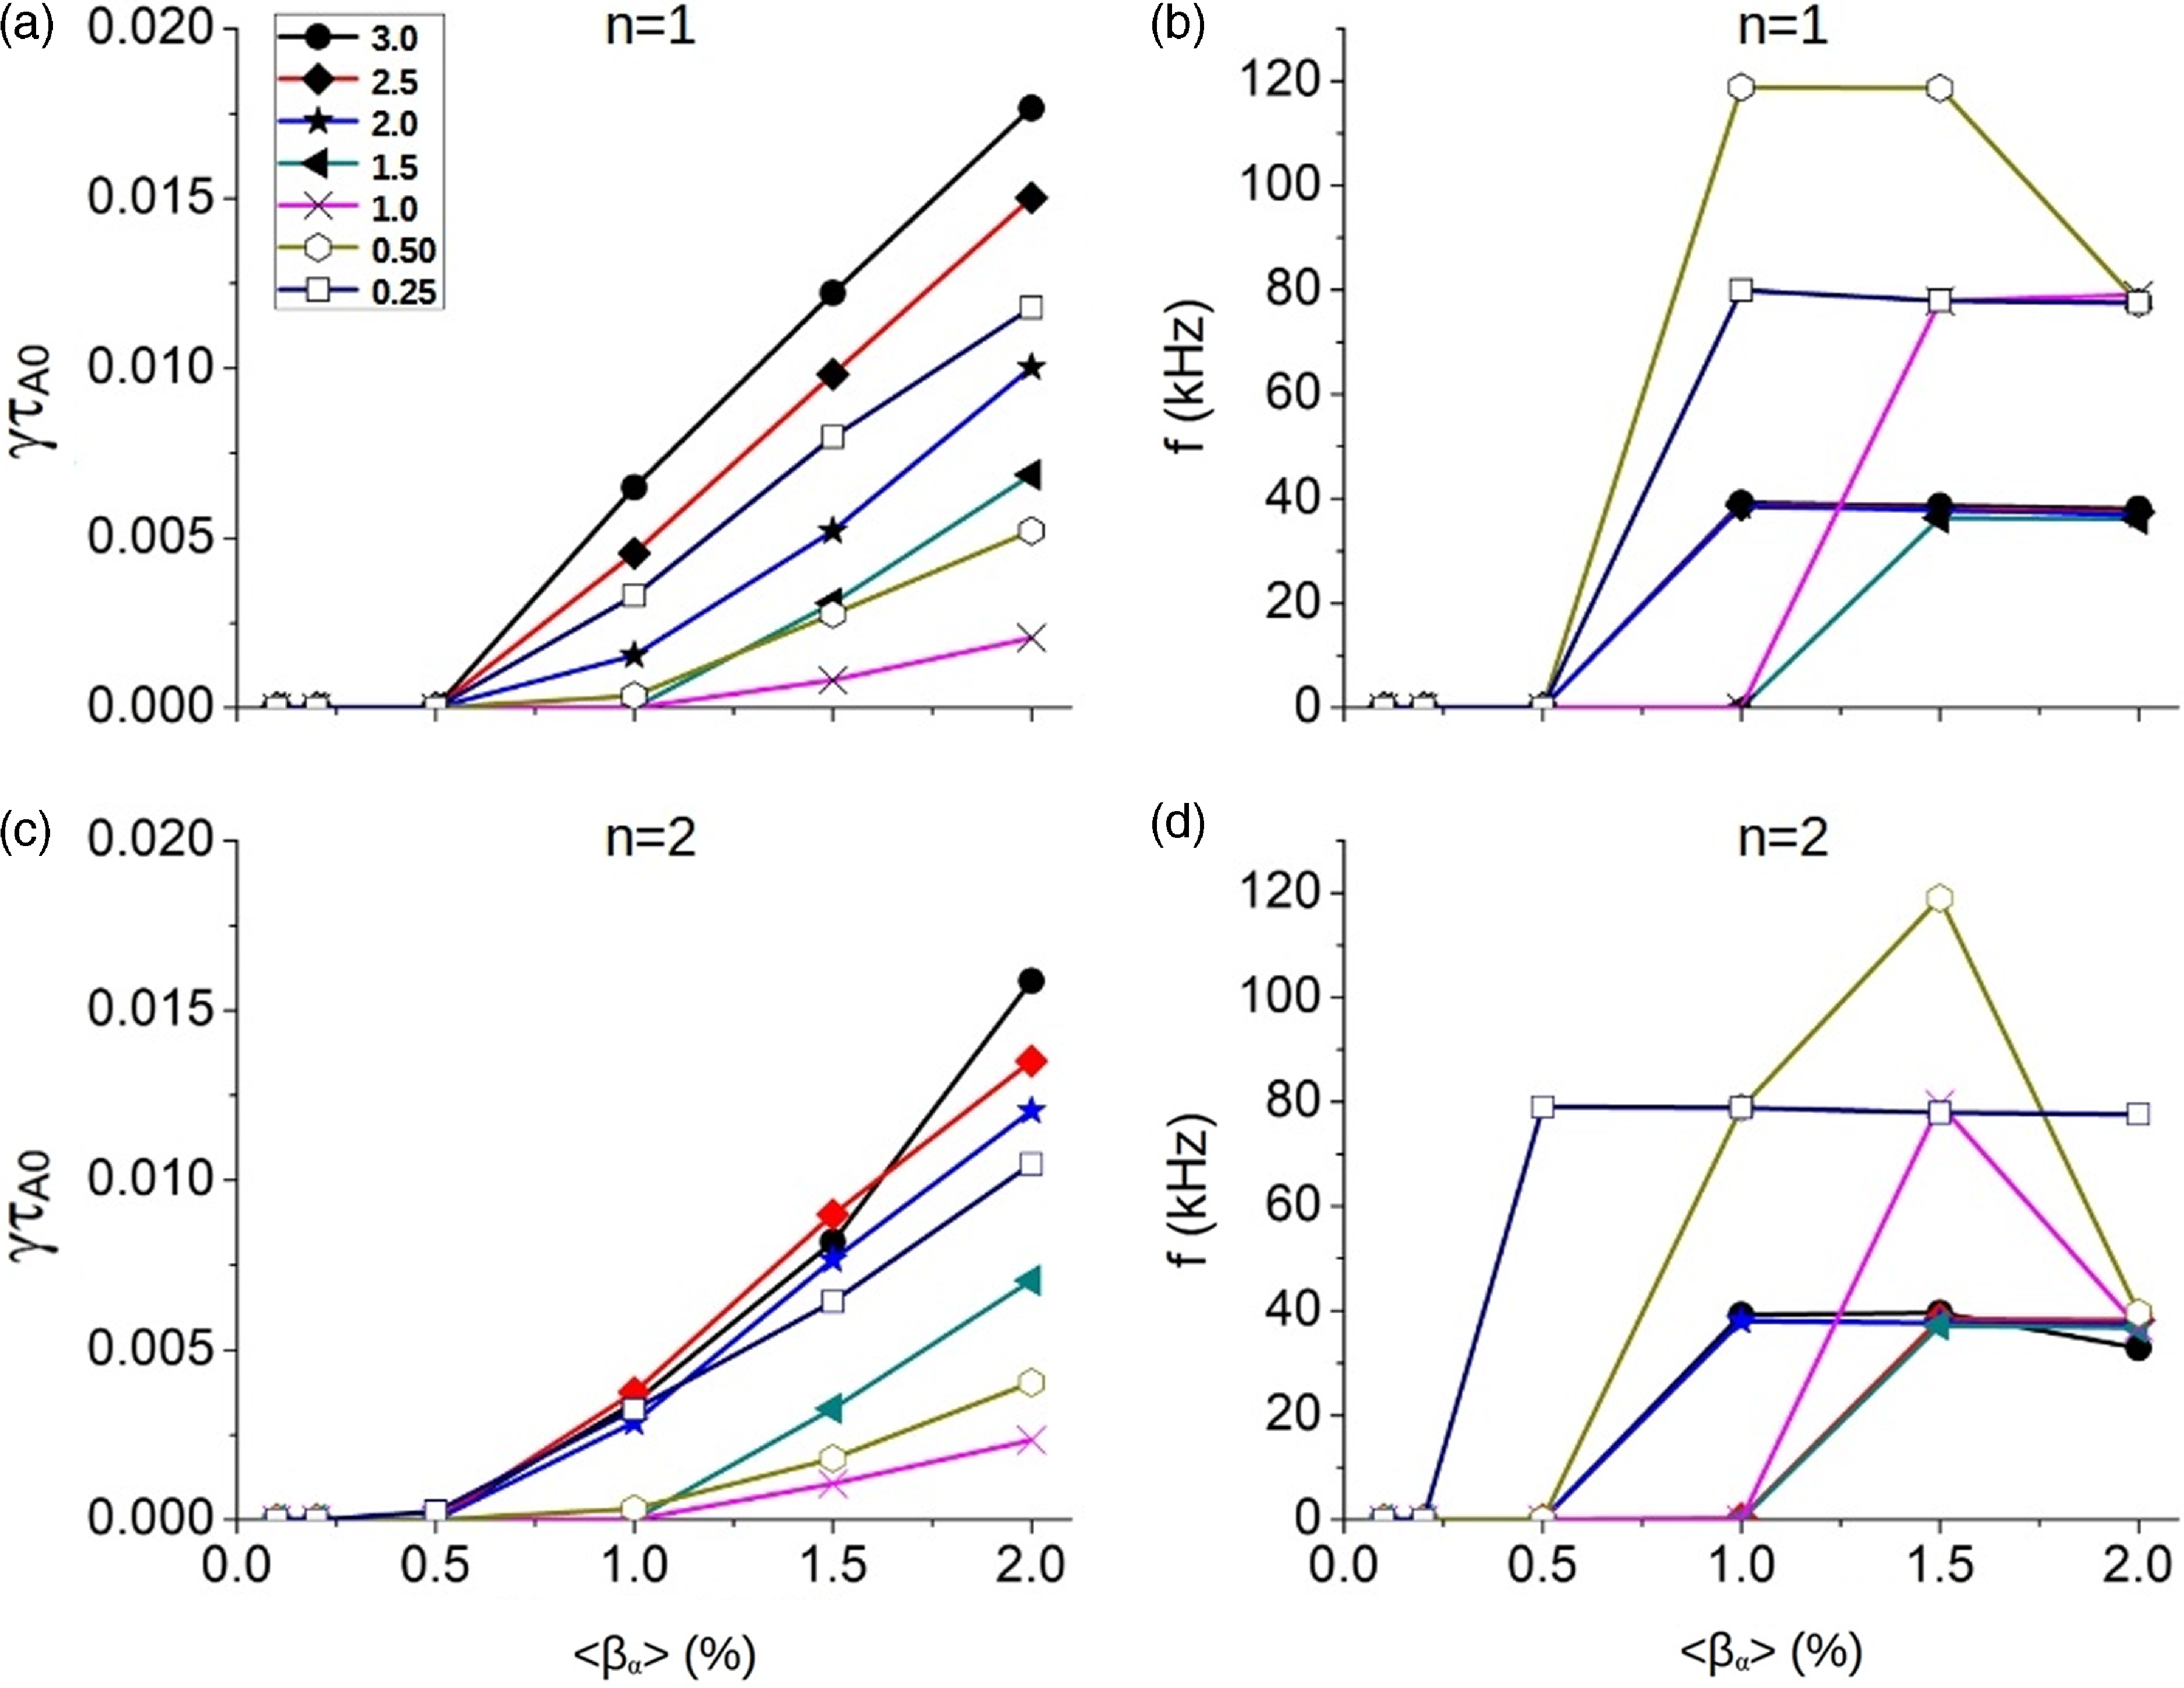
6. Discussion
In this work, we assessed alpha-particle transport and confinement in the four-field-period optimised quasi-isodynamic (QI) stellarator Infinity Two. The generation of this optimised configuration relied on a programme of aligning second adiabatic invariant contours with contours of the flux surface and the alignment of both $B_{max}$
and
$B_{max}$
and $B_{min}$
along the field line. Moreover, the Infinity Two configuration is also shown to have small values of the energetic particle confinement metric
$B_{min}$
along the field line. Moreover, the Infinity Two configuration is also shown to have small values of the energetic particle confinement metric $\Gamma _c \lt 0.02$
for
$\Gamma _c \lt 0.02$
for $\rho \lt 0.8$
. All of these features portend excellent collisionless guiding centre orbits for Infinity Two.
$\rho \lt 0.8$
. All of these features portend excellent collisionless guiding centre orbits for Infinity Two.
Collisionless SIMPLE and ASCOT5 simulations of GC alpha particles showed particle losses less than 1 % in the core Infinity Two plasma. Deeply trapped alpha particles with small pitch-angle, $v_\parallel /v\approx 0$
, dominate the losses in these simulations. Collisional simulations with alpha-particle distribution functions consistent with Infinity Two’s reactivity profile using both GC and FO alpha particles estimate less than 8 % particle losses and less than 4 % energy losses in the core plasma. Deeply trapped particles dominate particle and energy losses with other trapped particles, some close to the trapped-passing boundary, contributing to the losses. In this case, Coulomb collisions modifying the pitch angle of alpha particles work as a source of particles for the region of small pitch angles that dominate losses. We observed that most alpha particles are lost within few tens of milliseconds, still carrying relatively high energies,
$v_\parallel /v\approx 0$
, dominate the losses in these simulations. Collisional simulations with alpha-particle distribution functions consistent with Infinity Two’s reactivity profile using both GC and FO alpha particles estimate less than 8 % particle losses and less than 4 % energy losses in the core plasma. Deeply trapped particles dominate particle and energy losses with other trapped particles, some close to the trapped-passing boundary, contributing to the losses. In this case, Coulomb collisions modifying the pitch angle of alpha particles work as a source of particles for the region of small pitch angles that dominate losses. We observed that most alpha particles are lost within few tens of milliseconds, still carrying relatively high energies, $\mathcal {E}\geq 100$
keV.
$\mathcal {E}\geq 100$
keV.
We evaluated power wall loads due to lost alpha particles using GC ASCOT5 simulations. For this, we used a simple wall model corresponding to a three-dimensional extension of the LCFS from the free-boundary VMEC equilibrium of Infinity Two. We found that when the distance between the wall and the core plasma is approximately $\Delta _w=30$
cm, we obtain the lower peak power loads, approximately 2.17 MW m-
$\Delta _w=30$
cm, we obtain the lower peak power loads, approximately 2.17 MW m- $^2$
. These power loads are well within the technological capabilities of high-heat flux plasma facing components. When we varied the collisionality of the SOL plasma in Infinity Two by changing the plasma profiles in that region, we observed negligible variations in peak power loads. This showed that even when collisional effects at the SOL are important for stopping energetic alpha particles from reaching the wall, their contribution to energy wall loads was insignificant. In all cases, peak wall loads are observed to occur at approximately
$^2$
. These power loads are well within the technological capabilities of high-heat flux plasma facing components. When we varied the collisionality of the SOL plasma in Infinity Two by changing the plasma profiles in that region, we observed negligible variations in peak power loads. This showed that even when collisional effects at the SOL are important for stopping energetic alpha particles from reaching the wall, their contribution to energy wall loads was insignificant. In all cases, peak wall loads are observed to occur at approximately $\phi =60^\circ$
with varying poloidal locations coinciding with the location of x-points of the magnetic island chain
$\phi =60^\circ$
with varying poloidal locations coinciding with the location of x-points of the magnetic island chain $n/m=4/5$
at the edge of Infinity Two. These are mainly produced by MeV alpha particles corresponding to deeply trapped particles in the region of low-magnetic field. These particles drift radially outwards around their reflection points at
$n/m=4/5$
at the edge of Infinity Two. These are mainly produced by MeV alpha particles corresponding to deeply trapped particles in the region of low-magnetic field. These particles drift radially outwards around their reflection points at $\phi \approx 30^\circ$
and
$\phi \approx 30^\circ$
and $60^\circ$
, until they eventually cross the LCFS, escaping the core plasma in the vicinity of the x-points of the magnetic island chain, by a combined effect of drifts and collisions with the background plasma. Also, the wall loads from these simulations show the four-field-period periodicity of Infinity Two but stellarator symmetry is broken, likely due to
$60^\circ$
, until they eventually cross the LCFS, escaping the core plasma in the vicinity of the x-points of the magnetic island chain, by a combined effect of drifts and collisions with the background plasma. Also, the wall loads from these simulations show the four-field-period periodicity of Infinity Two but stellarator symmetry is broken, likely due to $\nabla B$
drifts. These results are intended to help design of first wall components and shielding of Infinity Two in the future. Also, we note that full-orbit effects were not included in the analysis of wall loads. Full-orbit effects need to be included to obtain more robust estimates.
$\nabla B$
drifts. These results are intended to help design of first wall components and shielding of Infinity Two in the future. Also, we note that full-orbit effects were not included in the analysis of wall loads. Full-orbit effects need to be included to obtain more robust estimates.
The calculation of the Alfvén continuum of Infinity Two using the STELLGAP code showed the existence of TAE, BAE, EAE and Helical Alfvén gaps at different frequency and radial locations. However, the stability assessment performed with FAR3d of Alfvén eigenmodes driven by alpha particles in these gaps show the absence of unstable AE. This, due to the low alpha-particle beta $\langle \beta _\alpha \rangle =0.31\,\%$
of the base
$\langle \beta _\alpha \rangle =0.31\,\%$
of the base $800$
MW DT power scenario is not large enough to destabilise AE in the plasma. Our parametric analysis to identify the stability limit of Infinity Two shows that critical alpha-particle betas of
$800$
MW DT power scenario is not large enough to destabilise AE in the plasma. Our parametric analysis to identify the stability limit of Infinity Two shows that critical alpha-particle betas of $\langle \beta _\alpha \rangle \gt 0.5\,\%$
are required to destabilise AEs in the BAE, TAE and EAE frequency range, much higher than the planed operational
$\langle \beta _\alpha \rangle \gt 0.5\,\%$
are required to destabilise AEs in the BAE, TAE and EAE frequency range, much higher than the planed operational $\langle \beta _\alpha \rangle =0.31\,\%$
of Infinity Two.
$\langle \beta _\alpha \rangle =0.31\,\%$
of Infinity Two.
We have yet to perform a detailed coil sensitivity study to determine the sensitivity of the good energetic particle confinement to field perturbations. However, from an MHD equilibrium and stability standpoint, small field error effects should not produce dramatic changes as the rotational transform profile avoids major resonances and the operational $\beta$
is far from stability limits.
$\beta$
is far from stability limits.
Acknowledgments
The authors thank Mark R. Cianciosa at ORNL for useful discussions on usage of the BMW code. We thank Don Spong for useful conversations regarding stability of Alfvén eigenmodes.
Editor Per Helander thanks the referees for their advice in evaluating this article.
Funding
This work was supported by Type One Energy. ASCOT5 development was partially funded by the Academy of Finland projects No. 353370, 324759, and 362342.
Declaration of interests
The work of M.L. and W.D. was performed as consultants and was not part of the employees’ responsibilities to the University of Maryland. The work of J.V. was performed as a consultant and was not part of the employee’s responsibilities at the University of Texas.


 Open access