



Leptin, a hormone derived from adipose tissue in mammals, plays a pivotal role in the regulation of food intake and energy expenditure(Reference Campfield, Smith and Guisez1–Reference Pelleymounter, Cullen and Baker3). The leptin signal is mediated through its receptor (LepR), which belongs to the class I cytokine receptor superfamily(Reference Perez-Perez, Maymo and Gambino4). The Janus kinase 2 (JAK2)–signal transducer and activator of transcription (STAT) signal transduction pathway is known to be the major signalling pathway of leptin. When leptin binds to LepR, JAK2 is activated, leading to the activation of STAT and subsequent physiological actions, including energy balance regulation(Reference Bates, Stearns and Dundon5–Reference Huynh, Neumann and Wang7). In addition, leptin can increase fatty acid oxidation by the AMP-activated protein kinase (AMPK)–acetyl coenzyme A carboxylase (ACC) pathway that stimulates fatty acid oxidation by blocking the effect of ACC in skeletal muscle(Reference Minokoshi, Kim and Peroni8). STAT3 can activate PPARα, thereby elevating fatty acid oxidation(Reference Roglans, Vilà and Farré9). Leptin also interacts with insulin signalling by activating the insulin receptor substrate (IRS)–phosphatidylinositol 3-kinase (PI3K) pathways in the liver(Reference Morton, Blevins and Kim10).
In contrast to mammals, the liver and subcutaneous adipose tissue are two key sites for leptin synthesis in fish(Reference Copeland, Duff and Liu11,Reference Liu, He and Ning12) . Although the similarity of leptin sequences between mammals and teleosts is very low, energy homoeostasis regulation in fish after recombinant mammalian leptin injection demonstrated the conserved biological functions of leptin in teleosts(Reference Londraville, Macotela and Duff13). It has been reported that mammalian-derived leptin causes increased fat metabolism in green sunfish(Reference Londraville and Duvall14). Leptin stimulated energy consumption by promoting glycogenolysis in tilapia after recombinant human leptin (rt-hLEP) administration(Reference Benomar, Naour and Aubourg15,Reference Baltzegar, Reading and Douros16) . The injection of leptin induced changes in the lipid metabolism of yellow catfish (Pelteobagrus fulvidraco)(Reference Song, Wu and Tan17,Reference Wu, Tan and Xu18) , and leptin also induced lipolysis in grass carp (Ctenopharyngodon idellus) steatosis hepatocytes(Reference Lu, Liang and Wang19). In Nile tilapia (Oreochromis niloticus), leptin could selectively regulate glucolipid metabolism(Reference Liu, He and Ning12), which can stimulate cellular glycolysis by STAT3-dependent mechanisms(Reference Douros, Baltzegar and Reading20). Results in zebrafish demonstrated that leptin regulated sugar metabolism, with no significant effect on fat decomposition(Reference Michel, Page-McCaw and Chen21,Reference Deck, Honeycutt and Cheung22) . Obviously, leptin can maintain energy balance by regulating lipid and glucose metabolism. However, at present, there is a lack of in-depth research on the molecular mechanism by which recombinant mammal leptin affects glucose and lipid metabolism in fish. Therefore, it is particularly important to further understand the mechanism of leptin in the regulation of energy metabolism and the signalling pathways that mediate these processes in fish.
Gibel carp (Carassius gibelio) is an economically important fish widely distributed in China, with annual yield of nearly three million tons in 2018(Reference Bureau23). The CAS III strain (A strain) was produced by selecting different strains through the use of heterospermic female nuclear reproduction. Owing to its fast growth and low susceptibility to diseases, the A strain has become one of the most popular species in aquaculture(Reference Wang, Zhu and Wang24). The natural wild Dongting strain (DT strain) grows more slowly than the A strain. It has been reported that insulin enhanced fatty acid synthesis ability and inhibited fatty acid oxidation potential in the A strain. Contrary, enhanced glycolysis and fatty acid oxidation were induced by insulin in the DT strain(Reference Jin, Zhu and Han25). These data demonstrated the significant differences in the regulation of glucose and lipid metabolism by insulin injection between these two strains(Reference Jin, Zhu and Han25). In view of the regulation of leptin on glucose and lipid metabolism, we hypothesised that the leptin regulation between two strains would differ. To verify our hypothesis, we performed intraperitoneal injection of rt-hLEP at a physiological dose on the DT and A strains and then detected plasma metabolites at 6, 12, 24 and 48 h after injection. We also measured liver and muscle glycogen content, and we assessed the role of leptin by measuring gene expression in liver and muscle tissues involved in glycolysis, gluconeogenesis, adipogenesis and fatty acid β-oxidation within 6, 12 and 24 h after injection. We analysed mRNA levels of the transcription factors sterol regulatory element-binding protein 1 (SREBP1) and PPARα in the liver as well as mRNA levels of Forkhead box protein O1-A (FOXO1a), the glucose-promoting transporter GLUT2 in the liver and the glucose-promoting transporter GLUT4 in skeletal muscle. In addition, we analysed the phosphorylation of STAT3, protein kinase B (AKT) and AMPK in the liver and white muscle at 6 h after injection. The present study aimed to investigate the metabolic differences regulated by leptin between two gibel carp strains. The results presented herein will improve our understanding of the relationship between leptin and gene background with respect to the regulation of glucose and lipid metabolism in fish.
Materials and methods
Experimental design and sampling procedure
Two strains (the DT and A strains) of juvenile gibel carp (Carassius gibelio) were obtained from the Institute of Hydrobiology, Chinese Academy of Sciences (Wuhan, Hubei, China). Ninety-six fish (DT strain body weight 9·43 (se 0·17) g; A strain body weight 8·20 (se 0·13) g) were raised in sixteen fibreglass tanks (water volume 300 l) maintained a constant water temperature of 17°C. Fish were hand-fed (feed 30 % carbohydrate and 8 % lipid) to apparent satiation twice per day (09.00 and 15.00 hours). Water quality was monitored twice a week, with ammonia nitrogen concentration <0·1 mg/l and pH of about 6·5. The photoperiod was 12 h light–12 h dark.
Fish were left unfed for 48 h before the injection. Fish were lightly anaesthetised with MS-222 (60 mg/l, Sigma) and weighed, after which they were administered an intraperitoneal injection of rt-hLEP (1·5 μg/g body weight, Pepro Tech Inc.) or 5 μl of PBS alone per g fish body weight (control), then distributed into triplicate tanks per treatment. The injection dose of rt-hLEP was based on our preliminary experiments and reports on yellow catfish(Reference Song, Wu and Tan17) and goldfish (Carassius auratus)(Reference Baltzegar, Reading and Douros16,Reference de Pedro, Martinez-Alvarez and Delgado26,Reference Volkoff, Eykelbosh and Peter27) . Six fish per treatment (from three tanks) were anaesthetised and sampled at 6, 12, 24 and 48 h after injection. For each sampling time, fish from each tank were anesthetised as above, selected and dissected on ice. Blood was quickly removed from the caudal vein using syringes rinsed with heparin sodium (0·2 %), then centrifuged at 3000 g for 10 min. The recovered plasma was immediately frozen and kept at −20°C until analysis. After blood was removed, the fish were killed, and the entire liver and dorsal muscle were analysed, quickly frozen in liquid N2, and stored at –80°C until use. The ethics committee of the Institute of Hydrobiology, Chinese Academy of Sciences, approved the experimental protocol (approval ID: IHB20140724).
Biochemical analysis
Liver and muscle glycogen concentrations were determined in samples (n 6) at 6, 12, 24 and 48 h after rt-hLEP or PBS injection using a liver and muscle glycogen kit according to the manufacturer’s instructions (Jiancheng Bioengineering Institute). Briefly, six independent samples were used as biological replicates under each experimental condition. The frozen tissues (<100 mg) were individually weighed, and three times the volume of alkaline water provided by the kit was added. The tissues were hydrolysed in boiling water for 20 min. Then, the corresponding volume of distilled water was added for the determination of glycogen. During the test, 1 ml of distilled water and 2 ml of colour reagent were loaded into the test tube as the blank tube. The standard tube contained 2 ml of chromogenic agent and 1 ml of glucose standard. Then, 0·1 ml of glycogen detection solution was added to the measuring tube and mixed with 0·9 ml of distilled water and 2 ml of colour rendering solution. All of the test tubes were thoroughly mixed and heated in boiling water for 5 min. Then, the test tubes were cooled to room temperature, zeroed with blank test tubes, and the absorbance of the sample and standard were read at the wavelength range of 620 nm.
Plasma glucose (glucose kit), TAG (triglycerides kit) and NEFA (NEFA kit) levels were determined using a microplate test according to the manufacturer’s recommendations. Results were expressed as the average of repeated measurements for each plasma sample (n 6). Human leptin level was measured using a commercial ELISA kit (Invitrogen), which contains a monoclonal antibody specific for human leptin. Fish leptin would not be detected as the kit exclusively recognises human leptin.
Gene expression analysis
Gene expression analysis was performed on samples from the liver and skeletal muscle tissues collected at 6, 12 and 24 h after injection with rt-hLEP or PBS (n 6 for each tissue, strain and injection time). Total RNA was extracted using TRIzol reagent (Invitrogen) according to the manufacturer’s recommendations. The integrity of RNA was detected by electrophoresis on 1 % agarose gels. The concentration and purity of total RNA were determined by protein and nucleic acid analysers. The isolated RNA (1 μg) was reverse-transcribed into complementary DNA using the M-MLV First-Strand synthesis kit (Invitrogen) according to the manufacturer’s instructions.
Quantitative RT-PCR was conducted using a LightCycler® 480 II System (Roche Diagnostics) with SYBR Green I Master Mix. We evaluated the mRNA levels of the following genes related to specific biochemical pathways: glucokinase, hexokinase 2, 6-phosphofructokinase (6PFK) and pyruvate kinase (PK) for glycolysis; glucose-6-phosphatase, fructose 1, 6-bisphosphatase and phosphoenolpyruvate carboxykinase (PEPCK) for gluconeogenesis; glucose facilitative transporter type 2 (GLUT2) and type 4 (GLUT4) for glucose transport; SREBP1 for transcription factor mediating insulin effect; ATP citrate lyase (ACLY), ACC and fatty acid synthase (FAS) for lipogenesis; carnitine palmitoyl transferase 1A (CPT1a) and acyl-CoA oxidase 3 (ACO3) for fatty acid β-oxidation. Specific primers described in previous studies were used to detect the expression levels of the genes of interest by quantitative RT-PCR(Reference Jin, Zhu and Han25,Reference Volkoff, Eykelbosh and Peter27) . Specific RT-PCR primers for FOXO1a (forward: CCAGCAGACCCAACAAGACTAT; reverse: GTAGGGTGGCAACATACATCCA; Genbank accession number: XM026282808), PPARα (forward: GTTCTCAGAAGTGTTTGCGTCC; reverse: GCACTCCATAGTGGAAACCTGA; Genbank accession number: MK160995) and JAK2 (forward: CCGTCAACAGACAGGATGGAA; reverse: CGGAGCACGAATAGACCTCTC; Genbank accession number: XM026212193) were designed for this research; β-actin and elongation factor 1α were used to evaluate the level of reference gene transcription in liver and muscle tissues, respectively. Relative quantification of target gene expression was performed using the mathematical model described by Pfaffl(Reference Pfaffl28).
Western blot analysis
At 6 h after injection with rt-hLEP or PBS, six fish (n 6) were taken for analysis of protein expression in liver and muscle. Protein was extracted from the liver and the muscle using a protein extraction buffer (Thermo Scientific) according to the manufacturer’s instructions. Western blots using appropriate proportions of proteins and protein lysates (20 μg of protein for liver; 40 μg for muscle) were subjected to SDS-PAGE. Equal amounts of protein were subjected to SDS-PAGE and transferred to polyvinylidene fluoride (PDVF) membranes. The PVDF membranes were blocked with 5 % milk in Tris-buffered saline, 0·1 % Tween 20 (TBST) and then incubated with the antibody of glyceraldehyde-3-phosphate dehydrogenase (GAPDH) (ab70699, Abcam), anti-AKT (9272, Cell Signaling Technology (CST)), anti-phosphorylated AKTs473 (4060, CST), anti-AMPK (2532, CST), anti-phosphorylated AMPK (2535, CST) and STAT3 (ab68153, Abcam), and phosphorylation of STAT3 (ab76315, Abcam). Horseradish peroxidase-labelled secondary antibodies were used to produce chemiluminescence signals detected by CCD camera-based imagers (Chemidoc MP Imaging System, BioRad). Each process was repeated six times.
Statistical analysis
All of the data were statistically analysed with SPSS 19.0. Results from plasma metabolite levels (n 6), glycogen content (n 6) and protein phosphorylation levels and gene expression (n 6) were expressed as the mean values with their standard errors and were analysed using two-way ANOVA to assess differences induced by rt-hLEP v. PBS injections, strains (DT strain v. A strain) and interactions. When an interaction was significant, the Student–Newman–Keuls multiple comparison test was used to compare the means. The significance level for all statistical analyses was set at P < 0·05.
Results
Plasma metabolite levels
The contents of exogenous leptin and plasma-specific metabolites of the two strains at 6, 12, 24 and 48 h after intraperitoneal injection of leptin or PBS are shown in Table 1. Plasma leptin content was at a high level 6 h after the injection of leptin, after which there were significant decreases in both strains. Glycaemia was decreased by leptin at 6, 12 and 48 h in both strains. No effects of glycaemia on genotype or injection were found in fish 24 h after leptin administration. Higher glucose levels were found in the A strain compared with the DT strain at the 24-h time point. TAG showed an interaction between strain and injection 6 h after intraperitoneal injection of leptin. Increased plasma TAG levels were only induced in the A strain, whereas no changes of plasma TAG levels were found in the DT strain. No significant effects on NEFA were found in either strain.
Plasma metabolite levels of DT and A strains after intraperitoneal injection of leptin (1·5 μg/g) or PBS (n 6)* (Mean values with their standard errors)

* Two-way ANOVA was used to analyse the effects of injection type, strain and interaction by Student–Newman–Keuls multiple comparison tests. When strains and injections interacted, differences are shown by lowercase letters. The use of unlike uppercase letters (one-way ANOVA) indicates a significant difference (P < 0·05) at each time point (6, 12, 24 and 48 h) for each injection treatment.
Tissue glycogen content
As shown in Fig. 1, the glycogen contents of the livers of both strains were significantly decreased at 12 h after leptin injection. The injection of leptin enhanced glycogen storage in the DT strain, but no significant effect was found in the A strain. At 6, 12, 24 and 48 h after exogenous leptin injection, there were no significant effects on muscle glycogen content in either strain (Fig. 2). The liver and muscle glycogen contents of the A strain were significantly higher than those of the DT strain, regardless of whether leptin was injected or not.
After intraperitoneal injection of leptin (Lep) or PBS, analysis of glycogen content in liver of gibel carp from DT strain ( ) and A strain (
 ) at 6 h (A), 12 h (B), 24 h (C) and 48 h (D). A two-way ANOVA was used, followed by the Student–Newman–Keuls multiple comparison test. Data are mean values with their standard errors (n 6), and P < 0·05 is considered statistically significant. a,b,c Mean values with unlike letters were significantly different. I, injection; S, strain.

After intraperitoneal injection of leptin or PBS, analysis of glycogen content in muscle of gibel carp from DT strain () and A strain () at 6 h (A), 12 h (B), 24 h (C) and 48 h (D). A two-way ANOVA was used, followed by the Student–Newman–Keuls multiple comparison test. Data are mean values with their standard errors (n 6), and P < 0·05 is considered statistically significant.

Leptin signalling pathways
AKT, AMPK and STAT3 are key proteins involved in the leptin signalling pathways IRS–PI3K, AMPK–ACC and JAK2–STAT, respectively. The changes in phosphorylation levels of AKT, AMPK and STAT3 in liver and muscle of the two strains at 6 h after injection are presented in Fig. 3. Phosphorylation levels of AKT and AMPK were significantly induced by leptin administration in both liver and muscle of the two strains. However, the increased phosphorylation levels of STAT3 induced by leptin were only found in the liver of the DT strain. In the muscle, lower phosphorylation levels of AKT and higher phosphorylation levels of AMPK were found in the DT strain than in the A strain.
Western blot analysis of protein kinase B (AKT), AMP-activated protein kinase (AMPK) and signal transducer and activator of transcription 3 (STAT3) phosphorylation in the liver (A) and muscle (B) samples of gibel carp from DT strain () and A strain (), 6 h after intraperitoneal administration of leptin (Lep) or PBS solution. Six independent samples from each treatment were selected for Western blot analysis. The proteins shown here are representative. Graphs represent the ratio between the phosphorylated protein and the total amount of the target protein. Results were analysed by two-way ANOVA (P < 0·05), expressed as mean values and standard deviations (n 6), and then the Student–Newman–Keuls multiple comparison test was used. a,b In the case of interaction, mean values with unlike letters are significantly different. I, injection; S, strain.

mRNA levels of genes involved in glucose metabolism
mRNA levels of JAK2, a key factor of the JAK2-STAT signalling pathway, are shown in Fig. 4. JAK2 mRNA levels were significantly up-regulated by leptin in the livers of both strains at 6 and 12 h after injection. The A strain showed higher JAK2 expression levels than the DT strain. A significant interaction between injection and strain was found in the expression of JAK2, whereas enhanced JAK2 expression induced by leptin was only found in the DT strain.
After intraperitoneal administration of leptin (Lep) or PBS solution, gene expression of the key factors of the Janus kinase 2 (JAK2)–signal transducer and activator of transcription signalling pathway in the liver of gibel carp from DT strain () and A strain () at 6 h (A), 12 h (B), and 24 h (C). JAK2 mRNA levels were measured using quantitative RT-PCR. β-Actin was used as the reference gene. Results were analysed by two-way ANOVA (P < 0·05), expressed as mean values and standard deviations (n 6), and then the Student–Newman–Keuls multiple comparison test was used. a,b In the case of interaction, mean values with unlike letters are significantly different. I, injection; S, strain.

The relative mRNA levels of GLUT and key glycolytic enzymes in the liver are shown in Fig. 5. GLUT2 expression was induced by leptin at 6 h after injection, and this up-regulation was only found in the DT strain at 24 h. In both strains, leptin treatment enhanced expression of glucokinase mRNA abundance at 6 and 24 h after injection. Enhanced 6PFK expression was found in both strains at 6 and 12 h. Higher levels of 6PFK transcripts were found in the A strain than in the DT strain. A significant interaction between strain and injection was found in PK at both 6 and 12 h, whereas up-regulated PK expression was only found in the DT strain after leptin injection.
After intraperitoneal administration of leptin (Lep) or PBS solution, gene expression of selected glycolytic enzymes and GLUT in the liver of gibel carp from DT strain () and A strain () at 6 h (A), 12 h (B) and 24 h (C). Glucokinase (GK), 6-phosphofructo-1-kinase (6PFK), pyruvate kinase (PK) and GLUT type 2 (GLUT2) mRNA levels were measured using quantitative RT-PCR. β-Actin was used as the reference gene. Results were analysed by two-way ANOVA (P < 0·05), expressed as mean values and standard deviations (n 6), and then the Student–Newman–Keuls multiple comparison test was used. a,b In the case of interaction, mean values with unlike letters are significantly different. I, injection; S, strain.

Fig. 6 shows mRNA levels of key enzymes involved in the gluconeogenic process in the liver. Leptin inhibited FOXO1a at all of the times points after injection. Lower glucose-6-phosphatase expression levels were found in the DT strain at 12 h after injection. Decreased transcripts of fructose 1, 6-bisphosphatase induced by leptin injection at 6 and 12 h were found in both strains. Similarly, decreased expression of PEPCK was found in the A and DT strains at 24 h. The A strain showed higher levels of fructose 1, 6-bisphosphatase and PEPCK expression at 24 h, regardless of injection. A significant interaction between strain and injection was observed at the level of PEPCK mRNA, where leptin treatment only down-regulated the expression of this enzyme in the DT strain at both 6 and 12 h. At 24 h after injection, expression of PEPCK was suppressed by leptin, and lower PEPCK abundance was found in the DT strain.
After intraperitoneal administration of leptin (Lep) or PBS solution, gene expression of selected enzymes and transcription factors involved in gluconeogenesis in the liver of gibel carp from DT strain () and A strain () at 6 h (A), 12 h (B) and 24 h (C). Forkhead box protein O1-A (Foxo1a), glucose-6-phosphatase isoform (G6Pase), fructose 1,6-bisphosphatase (FBPase) and phosphoenolpyruvate carboxykinase (PEPCK) mRNA levels were measured using quantitative RT-PCR. β-Actin was used as the reference gene. Results were analysed by two-way ANOVA (P < 0·05), expressed as mean values and standard deviations (n 6), and then the Student–Newman–Keuls multiple comparison test was used. a,b,c In the case of interaction, mean values with unlike letters are significantly different. I, injection; S, strain.

mRNA levels of glycolytic key enzymes in white muscle are shown in Fig. 7. GLUT4 transcripts were significantly enhanced by leptin at 6 h. The expression levels of GLUT4 in the A strain were higher than those of the DT strain at all post-injection time points. Similarly, higher HK and 6PFK levels were observed in both strains at 6 and 12 h. Increased PK expression was induced by leptin at 12 and 24 h. Higher abundances of HK and PK were observed in the A strain than in the DT at 6 and 24 h, respectively.
After intraperitoneal administration of leptin (Lep) or PBS solution, gene expression of selected glycolytic enzymes and GLUT in the muscle of gibel carp from DT strain () and A strain () at 6 h (A), 12 h (B) and 24 h (C). Hexokinase (HK), 6-phosphofructo-1-kinase (6PFK), pyruvate kinase (PK) and GLUT type 4 (GLUT4) mRNA levels were measured using quantitative RT-PCR. Elongation factor 1α (EF-1α) was used as the reference gene. Results were analysed by two-way ANOVA (P < 0·05), expressed as mean values and standard deviations (n 6), and then the Student–Newman–Keuls multiple comparison test was used.

Transcripts levels of genes involved in lipid metabolism
The expression levels of transcription factors and lipogenesis genes in the liver are presented in Fig. 8. Leptin decreased SREBP1 and ACC expression at 24 h after injection. An interaction between genotype and injection was found in SREBP1 expression at 6 h, with leptin up-regulating expression of SREBP1. Compared with the A strain, the DT strain showed lower ACLY expression levels at 6 and 12 h. Similar lower expression of ACC was also observed in the DT strain at 6 h after administration. Down-regulation of FAS transcript abundance induced by leptin was found in both strains at 6 and 12 h. A significant interaction between strain and injection in FAS expression at 24 h was observed, with suppressed expression of FAS only in the DT strain.
After intraperitoneal administration of leptin (Lep) or PBS solution, gene expression of selected transcription factors and enzymes involved in lipogenesis in the liver of gibel carp from DT strain () and A strain () at 6 h (A), 12 h (B) and 24 h (C). Sterol regulatory element-binding protein 1 (SREBP1), ATP citrate lyase (ACLY), acetyl-CoA carboxylase (ACC) and fatty acid synthase (FAS) mRNA levels were measured using quantitative RT-PCR. β-Actin was used as the reference gene. Results were analysed by two-way ANOVA (P < 0·05), expressed as mean values and standard deviations (n 6), and then the Student–Newman–Keuls multiple comparison test was used. a,b,c In the case of interaction, mean values with unlike letters are significantly different. I, injection; S, strain.

The expression levels of transcription factors and selected enzymes involved in NADPH generation and lipogenic enzymes in white muscle after injection in both strains are presented in Fig. 9. The levels of transcription factors SREBP1, ACLY, ACC and FAS mRNA levels of the two strains decreased significantly at 6 and 12 h after leptin injection, except for ACLY and FAS expression at 6 h. In particular, the SREBP1, ACC and FAS mRNA levels of the DT strain were all higher than those of the A strain, regardless of treatment. Similarly, the expression of ACC showed the same results 24 h after injection. There was a significant interaction between injection and strain in FAS expression at 6 and 24 h, in which leptin only down-regulated FAS expression in the DT strain.
After intraperitoneal administration of leptin (Lep) or PBS solution, gene expression of selected transcription factors and enzymes involved in lipogenesis in the muscle of gibel carp from DT strain () and A strain () at 6 h (A), 12 h (B) and 24 h (C). Sterol regulatory element-binding protein 1 (SREBP1), ATP citrate lyase (ACLY), acetyl-CoA carboxylase (ACC) and fatty acid synthase (FAS) mRNA levels were measured using quantitative RT-PCR. Elongation factor 1α (EF-1α) was used as the reference gene. Results were analysed by two-way ANOVA (P < 0·05), expressed as mean values and standard deviations (n 6), and then the Student–Newman–Keuls multiple comparison test was used. a,b In the case of interaction, mean values with unlike letters are significantly different. I, injection; S, strain.

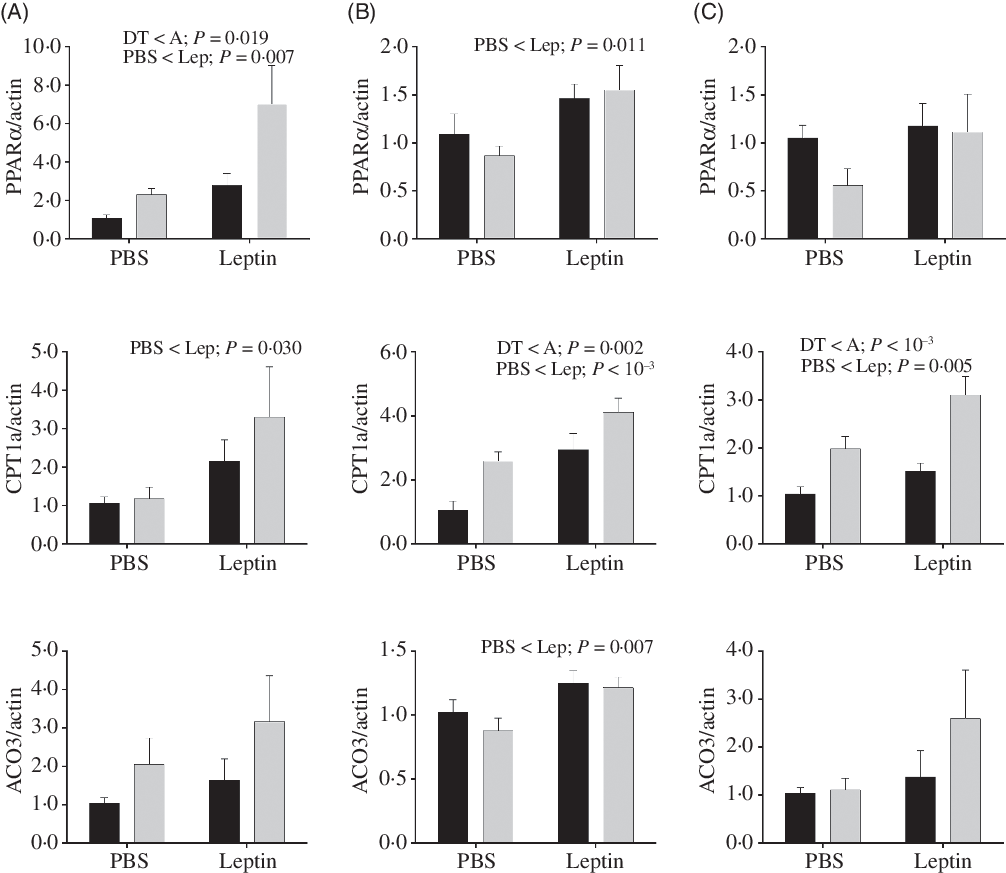
Expression levels of genes involved in fatty acid oxidation in the liver are shown in Fig. 10. PPARα and CPT1a mRNA levels were increased by leptin in both strains at all time points except for PPARα expression at 6 h. mRNA levels of PPARα in the A strain were significantly higher than those of the DT strain. Higher expression levels of CPT1a were also observed in the A strain at 12 and 24 h. At 12 h post-injection, increased ACO3 expression induced by leptin was found in both strains.
After intraperitoneal administration of leptin (Lep) or PBS solution, gene expression of selected enzymes associated with fatty acid oxidation in the liver of gibel carp from DT strain () and A strain () at 6 h (A), 12 h (B) and 24 h (C). PPARα, carnitine palmitoyl transferase 1A (CPT1a), and acyl-CoA oxidase 3 (ACO3) mRNA levels were measured using quantitative RT-PCR. β-Actin was used as the reference gene. Results were analysed by two-way ANOVA (P < 0·05), expressed as mean values and standard deviations (n 6), and then the Student–Newman–Keuls multiple comparison test was used.
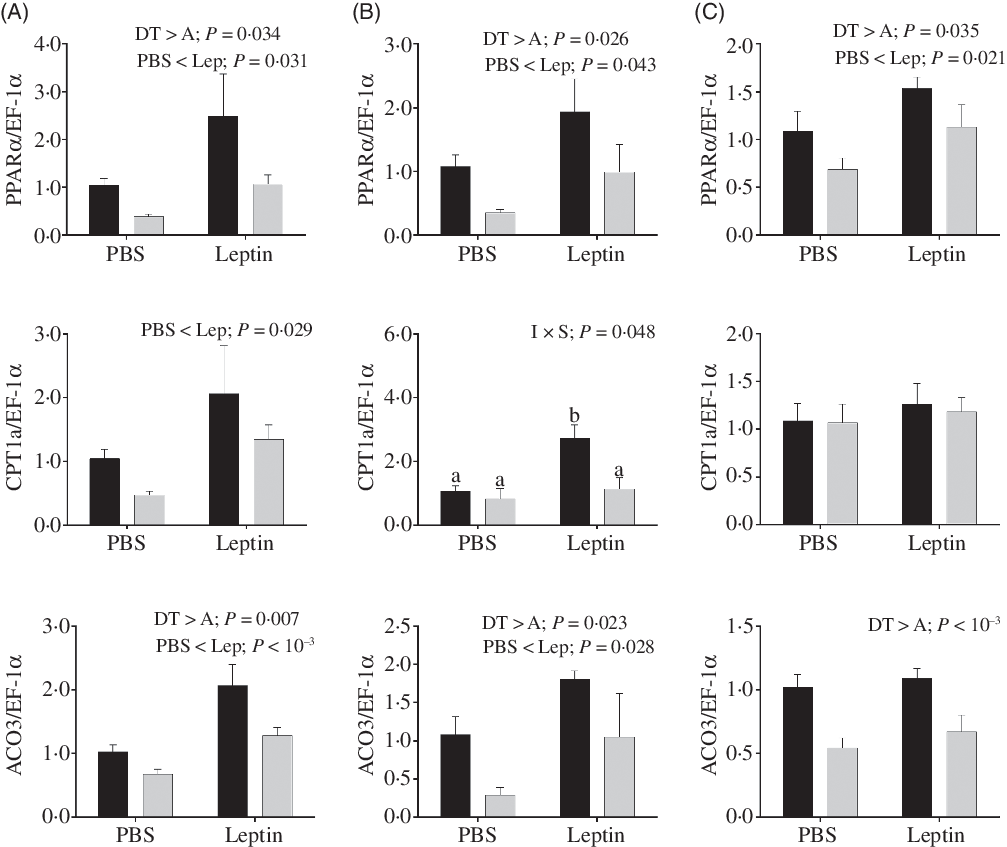
Changes in relative mRNA levels of key enzymes involved in fatty acids oxidation are presented in Fig. 11. PPARα mRNA levels up-regulated by leptin were observed in both strains at 6, 12 and 24 h after injection. The CPT1a expression levels were also increased at 6 h. Similarly, ACO3 mRNA levels were induced by leptin at 6 and 12 h. Both PPARα and ACO3 mRNA levels were higher in the DT strain than in the A strain. At 12 h after injection, a significant interaction between injection and strain was observed in the expression of CPT1a, and CPT1a expression enhanced by leptin was only observed in the DT strain.
After intraperitoneal administration of leptin (Lep) or PBS solution, gene expression of selected enzymes associated with fatty acid oxidation in the muscle of gibel carp from DT strain () and A strain () at 6 h (A), 12 h (B) and 24 h (C). PPARα, carnitine palmitoyl transferase 1A (CPT1a), and acyl-CoA oxidase 3 (ACO3) mRNA levels were measured using quantitative RT-PCR. Elongation factor 1α (EF-1α) was used as the reference gene. Results were analysed by two-way ANOVA (P < 0·05), expressed as mean values and standard deviations (n 6), and then the Student–Newman–Keuls multiple comparison test was used. a,b In the case of interaction, mean values with unlike letters are significantly different. I, injection; S, strain.
Discussion
Previous studies indicated that the level of lipid synthesis in the A strain was higher than that of the DT strain after insulin stimulation(Reference Jin, Zhu and Han25), and there was evidence that leptin could inhibit glucose-stimulated insulin secretion(Reference Cases, Gabriely and Ma29). Therefore, in the present study, we hypothesised that leptin might regulate glucose and lipid metabolism differently in the two strains of gibel carp. To test this hypothesis, the DT and A strains were intraperitoneally injected with rt-hLEP or PBS solution to study the differential regulatory effects of leptin on lipid and glucose metabolism. We focused our analysis on the JAK2–STAT, PI3K–AKT and AMPK–ACC signalling pathways as well as target genes connected with glucose and lipid metabolism.
Leptin enhanced glycolysis and inhibited gluconeogenesis pathway in both strains
As expected, hypoglycaemia induced by leptin was observed in both strains, which is consistent with previous studies(Reference Schwartz, Baskin and Bukowski30,Reference Mistry, Swick and Romsos31) . Liver glycogen levels of both strains decreased significantly 12 h after leptin treatment, which might have been due to hypoglycaemia caused by leptin, resulting in increased uptake of glucose(Reference Lecavalier, Bolli and Cryer32). In line with this, mRNA levels of GLUT2 and GLUT4 in both strains were up-regulated after leptin injection, suggesting the increased glucose uptake by the liver and muscle in both strains, consistent with earlier reports(Reference Michel, Page-McCaw and Chen21). Interestingly, unaltered muscle glycogen suggested that there were differences in the regulation of leptin between muscle and liver tissue in gibel carp.
Leptin also activates the IRS to activate the PI3K–AKT pathway and promotes leptin action by inhibiting FOXO1(Reference Morton, Blevins and Kim10,Reference Wauman and Tavernier33,Reference Buettner, Muse and Cheng34) . In the present study, leptin significantly enhanced phosphorylation of AKT, a key component of the IRS–PI3K signalling pathway in the liver and muscle, thereby regulating glucose and lipid metabolism. The rate of glycolysis depends on the control by metabolic and regulatory enzymes. Glucokinase, as the first enzyme involved in liver glycolysis, is a key enzyme in the glucose metabolism pathway(Reference Rider, Bertrand and Vertommen35). In the present study, mRNA levels of glucokinase and 6PFK increased in the liver 6 h after the injection of leptin in both strains, indicating that the glycolytic potential increased in gibel carp after the injection of leptin. Similarly, the mRNA levels of enzymes involved in glycolytic process (hexokinase 2, 6PFK and PK) were significantly increased, consistent with the increase in GLUT4 mRNA levels and implying enhanced glycolysis in the muscle, in line with the results in tilapia(Reference Douros, Baltzegar and Reading20). The transcription factor FOXO1a controls expression of the gluconeogenic enzymes, and this factor was suppressed by leptin in the present study. Correspondingly, key enzymes of gluconeogenesis (glucose-6-phosphatase, fructose 1, 6-bisphosphatase and of PEPCK) mRNA levels were also down-regulated. Thus, the results suggest that leptin increased glycolytic potential and suppressed gluconeogenesis by activating the PI3K–AKT pathway in the two strains of gibel carp(Reference Pai, Lin and Tran36,Reference Tong, Shieh and Chen37) .
The DT strain displays stronger regulation of glucose metabolism in the liver by leptin as compared with the A strain
Human leptin concentration was only 65 % in the DT strain compared with that of the A strain at 24 h after leptin injection. Similarly, compared with the A strain, a lower concentration of insulin in the DT strain was observed at 8 h after insulin injection in previous studies(Reference Jin, Zhu and Han25). Interestingly, we observed a significant interaction between leptin treatment and genotype, where leptin enhanced the liver glycogen content of the DT strain and had no effect on the A strain at this time point, implying that there was stronger glycogen regulation in the DT strain. In fish, insulin-like growth factors induce muscle growth through the PI3K–AKT–target of rapamycin signalling pathway(Reference Eduardo, Juan and Alfredo38). Herein, lower phosphorylation levels of AKT was found in the DT strain compared with the A strain, which might be partly explained slower growth rate of this strain. Moreover, a higher glycolytic potential was found in the liver of the DT strain, as reflected by increased expression of the key gene PK mRNA, but in the A strain, there was no change induced by leptin administration. Accordingly, augmentation of gluconeogenic potential was found in the A strain compared with the DT strain, as suggested by enhanced PEPCK expression after leptin injection. Taken together, the results suggest that DT showed stronger regulation of glucose metabolism by leptin. In addition, the A strain showed enhanced glycolytic potential and gluconeogenic potential compared with the DT strain, concomitant with higher glycogen storage in both liver and muscle. Thus, the A strain might be more apt to utilise glucose as an energy source.
Leptin stimulates the fatty acid oxidation ability and inhibits the expression of lipogenic genes in both strains
Studies have shown that leptin can activate AMPK phosphorylation and block the effect of ACC, thereby inhibiting fat accumulation and promoting fatty acid oxidation(Reference Lago, Gomez and Gomez-Reino39). Confirming this, enhanced AMPK was related to total protein phosphorylation, suggesting that the AMPK–ACC signalling pathway was activated by leptin in both strains in the present study. SREBP1 leads to the transcriptional induction of hepatic lipogenic enzymes through the PI3K–AKT pathway(Reference Miyake, Ogawa and Matsumoto40). In the present study, leptin treatment down-regulated the mRNA levels of the lipid transcription factor SREBP1 in both liver and muscle of strains A and DT and was positively correlated with the mRNA levels of the genes related to lipid synthesis. These results suggested the ability of leptin to inhibit lipid production, consistent with previous results(Reference Buettner, Muse and Cheng34,Reference Soukas, Cohen and Socci41,Reference Nogalska, Sucajtys-Szulc and Swierczynski42) .
In mammals, the physiological function of leptin is mainly mediated by membrane-related leptin receptors, and the most important pathway for the regulation of mammalian gene and protein expression is through the JAK2–STAT pathway(Reference Duan, Li and Rui43–Reference Morton, Cummings and Baskin45). In the present study, increased mRNA levels of JAK2 after leptin injection implied that the JAK2–STAT pathway was activated by leptin, consistent with results in yellow catfish(Reference Wu, Tan and Xu18). STAT3 could elevate fatty acid oxidation by activating PPARα(Reference Roglans, Vilà and Farré9). PPARα is the central regulator of lipid metabolism as it up-regulates the expression of downstream genes related to the catabolism of fatty acids in mitochondria and peroxisome organelles(Reference Kliewer, Sundseth and Jones46,Reference Ribet, Montastier and Valle47) . In the present study, the levels of PPARα transcription in the livers of two strains were up-regulated 6 h after leptin injection. CPT1 determines the mitochondrial β-oxidation cycle, and ACO is a key regulator of peroxisomes(Reference Leaver, Bautista and Bjornsson48,Reference Kerner and Hoppel49) . Consistent with changes in PPARα, expression of lipolytic genes (CPT1a and ACO3) was also enhanced by leptin, similar to previous reports(Reference Zhang, Tan and Wu50–Reference Huang, Chen and Luo52). Similarly, the mRNA levels of PPARα in the muscle were also increased, concomitant with up-regulated expression of key enzymes involved in fatty acid β-oxidation (CPT1a and ACO3). Thus, our results suggested that leptin could regulate lipid metabolism by inhibiting lipogenesis and enhancing lipolysis in both strains(Reference Lu, Liang and Wang19).
The A strain had higher lipogenic and lipolytic capacity in liver than the DT strain, in contrast to results in muscle
In the present study, the A strain showed better lipogenic ability in the liver than the DT strain, as reflected in the increased mRNA levels of ACLY and ACC in the liver of the A strain, irrespective of injection. In line with this, a higher plasma TAG concentration was also found in this strain. Regarding fatty acid oxidation, we demonstrated enhanced lipid catabolism potential in the liver of the A strain, as indicated by elevated expression levels of key genes (PPARα and CPT1) associated with fatty acid oxidation(Reference Londraville and Duvall14,Reference Lu, Liang and Wang19,Reference Wang, Lee and Unger53) . However, in contrast to the results for the liver, the DT strain displayed higher lipogenic capability, as indicated by enhanced expression of SREBP1, ACC and FAS in the white muscle compared with the A strain. Similarly, the fatty acid oxidation potential (PPARα and ACO3) in muscle of the DT strain was also higher than that of the A strain. These results implied that lipid metabolism differed between the A and DT strains. It has been reported that salmonid fish exhibited a relatively high ability to use fatty acid as an energy source in muscle(Reference Sanchez-Gurmaches, Ostbye and Navarro54). In the present study, the DT strain showed higher fatty acid synthesis and oxidation capability together with a lower glycolytic ability in the white muscle, suggesting a relatively high ability to use fatty acids as an energy source in the muscle of this strain(Reference Jin, Panserat and Kamalam55). In contrast, the A strain is more apt to utilise glucose as an energy source in the muscle. In addition, compared with the A strain, an interaction between injection and strain in FAS expression in the DT strain implied that the inhibition of fatty acid synthesis by leptin was stronger in this strain. Concurrently, the JAK2–STAT signalling pathway was more strongly activated by leptin in the liver of the DT strain. Therefore, lipid metabolism regulation by leptin differed between the A and DT strains, as expected.
Conclusions
In summary, the results of the present study revealed differences in the transcriptional regulation of glucose and lipid metabolism after leptin injection between different genotypes of gibel carp from a physiological point of view. Our results confirmed that the PI3K–AKT, JAK2–STAT and AMPK–ACC signalling pathways were involved in the biological effects caused by leptin in both strains. Intraperitoneal injection of leptin caused a decrease in plasma glucose; this might have been due to enhanced glucose uptake and glycolysis together with suppressed gluconeogenesis by the liver and muscle in both strains. Regarding genotype, favourite energy source in the muscle was significantly different between two gibel carp strains. Obviously, the DT strain was more apt to utilise fatty acid as an energy source in the muscle, whereas the A strain might use glucose. The DT strain displayed stronger regulation of glucose metabolism and lipid metabolism by leptin compared with the A strain. Overall, the regulation of glucose and lipid metabolism was different in the two strains of gibel carp. Our findings will help us to better understand the regulation of glucose and lipid metabolism by leptin between fish with different genetic backgrounds.
Acknowledgements
The authors thank Mr Guanghan Nie for his technical support with the research system.
This work was financially supported by the National Natural Science Foundation of China (U19A2041; 31972805), the National Key R&D Program of China (2018YFD0900605) and the China Agriculture Research System (CARS-45-09).
The entire experiment was designed by J. J. Under the guidance of J. J., L. W. conducted experiments and wrote the manuscript. The data analysis was completed with the help of H. L., W. X. and B. D. Chemical analysis was assisted by Y. Y.; D. H., X. Z., H. L. and S. X. made suggestions on the experimental design and contributed to the revision of the manuscript.
The authors declared no competing interests.



