


Introduction
Several species of marine turtles are categorized as Endangered or Critically Endangered on the IUCN Red List (IUCN, 2021). The most numerous species of marine turtle worldwide, and also locally along the Pacific coast of Guatemala and Mexico, is the olive ridley sea turtle Lepidochelys olivacea (Hart et al., Reference Hart, Maldonado-Gasca, Ley-Quiñonez, Flores-Peregrina, de Jesús Romero-Villarruel and Aranda-Mena2018). This turtle exhibits polymorphic nesting behaviours: the arribada (synchronous mass nesting) and solitary nesting, which has made it a species of particular interest to scientists. It is categorized as Vulnerable on the IUCN Red List (Abreu-Grobois & Plotkin, Reference Abreu-Grobois and Plotkin2008); in the East Pacific, the main threats are coastal development and artificial illumination, egg harvesting, climate change and rising seas, introduced animals such as feral and domestic dogs and pigs, and removal of beach sand (Rguez-Baron et al., Reference Rguez-Baron, Kelez, Liles, Zavala-Norzagaray, Torres-Suárez, Amorocho and Gaos2019). Conservation efforts need to focus on managing these threats.
Guatemala is of special interest because of its unique national conservation strategy. Hatcheries are at the core of this strategy, allowing egg collectors to deliver 20% of a nest to a hatchery in exchange for selling the rest (CONAP, 2018). In this context, nearly 100% of nests are collected and no nests are left on the beaches, thus preventing natural selection and adaptation processes. Although this has been done for > 50 years, it is not known whether the system is sustainable.
In 2020, an analysis of the number of recorded tracks along a 7.5-km stretch of El Hawaii nesting beach on the Guatemalan Pacific coast concluded that the activities of olive ridley sea turtles increased exponentially during 2003–2018 (Ariano-Sánchez et al., Reference Ariano-Sánchez, Muccio, Rosell and Reinhardt2020). This information is especially important as it was interpreted as the overall trend at the scale of the country. However, we note several weaknesses in this study. Firstly, the number of recorded tracks in Table 1 of Ariano-Sánchez et al. (Reference Ariano-Sánchez, Muccio, Rosell and Reinhardt2020) is only partially consistent with the values reported in the original reports of the Asociación de Rescate y Conservación de Vida Silvestre (ARCAS), an NGO for wildlife rescue and conservation (Muccio, Reference Muccio2019). Secondly, the authors define the nesting season based on civil years (January–December), whereas a nesting season spans two civil years: from early July to February or March the following year. Thirdly, only tracks counted in the field were used, although the monitoring period was not precisely indicated for all of the study years; thus, the sum of the tracks for each year was dependent on the monitoring effort, which was not detailed. Fourthly, not all of the relevant years were considered, as 1997–2001 were excluded. Fifthly, the use of fixed start and end dates of the monitoring period supposed that the phenology was constant from year to year but this was not tested. A decrease in the net change of eggs taken to hatcheries occurred in the years following the two extreme El Niño–Southern Oscillation events (one El Niño and one La Niña phase). It should be noted, however, that these two extreme events occurred only once each during this time series, thus making it impossible to draw conclusions regarding the general applicability of this information. Furthermore, both warming-phase (El Niño) and cooling-phase (La Niña) events produced the same effect on the number of nests in the hatcheries, which was unexpected. An effect of El Niño–Southern Oscillation events on the phenology of the nesting season could be expected, although this was not tested. Finally, data from a single 7.5-km beach were used, whereas nesting occurs along the entire 250-km Pacific coastline of Guatemala. For all of these reasons we believe that the conclusion of ‘an upward trend in olive ridley nesting abundance on the Pacific coast of Guatemala’ (Ariano-Sánchez et al., Reference Ariano-Sánchez, Muccio, Rosell and Reinhardt2020, p. 10) should be examined using new modelling techniques.
Marine turtles exhibit philopatry, meaning they return to the regions where they were born (Clusa et al., Reference Clusa, Carreras, Cardona, Demetropoulos, Margaritoulis and Rees2018). Given that various threats and pressures exerted on marine turtles can affect their nesting, it is important to analyse a length of coastline longer than 7.5-km. In Guatemala, the need of local communities to collect turtle eggs to generate income, and encouragement of tourism by entrepreneurs and hoteliers, could have varying effects along the 250-km Pacific coastline where L. olivacea nests and where the collection of eggs is permitted. By using all available field nesting data and global information regarding hatcheries, we aim to verify the validity of the conclusion that the olive ridley sea turtle population along the Pacific coast of Guatemala has increased.
Methods
Olive ridley sea turtle tracks
Beach patrols were conducted by field workers hired by ARCAS during the 1997–2012 nesting seasons on El Hawaii beach and during 2013–2018 on a total of 11 beaches (Fig. 1). Patrols were normally performed at dawn on 6 days per week to count the number of sea turtle tracks from the previous night. It is sometimes difficult to distinguish between successful and unsuccessful nesting attempts (Schroeder & Murphy, Reference Schroeder, Murphy, Eckert, Bjorndal, Abreu-Grobois and Donnelly1999) and, for this reason, all tracks (successful and unsuccessful attempts) were counted. Supplementary Table 1 summarizes the number of monitored nights by beach and year. For statistical modelling, the nesting season is defined here as 1 June to 31 May in the following year. The teams of field workers did not consistently report zero counts in the databases (zero counts could indicate either they did not carry out a survey or they did survey but did not find any tracks). We therefore removed the zero counts in the databases and employed a strategy using conditional likelihood to take the absence of zero counts into account (Girondot, Reference Girondot2010a).
Locations of the monitored beaches and hatcheries for olive ridley sea turtles Lepidochelys olivacea in Guatemala.

Hatchery data
Hatcheries have existed in Guatemala since early 1971. According to governmental policy, the National Council of Protected Areas is the entity responsible for gathering and managing each hatchery and collecting its data. Each hatchery must provide information on an annual basis regarding the number of eggs incubated, hatchlings released and per cent hatching success. On the Pacific coast of Guatemala, 9–25 hatcheries (depending on the year) were officially registered with the National Council of Protected Areas (Fig. 1). Supplementary Table 2 presents the number of eggs incubated in each hatchery per year during 2001–2018, from official National Council of Protected Areas documents and informal surveys conducted by ARCAS. There was no data available for the years prior to 2001 and for 2007–2011.
Model for nesting seasonality
We modelled nesting seasonality following a phenological model (Girondot, Reference Girondot2010b, Reference Girondot2017). This model can be applied to any proxy of nesting such as clutch, nest or track counts. It requires five parameters, all of which have direct biological interpretations: B, P and E are the ordinal dates for the beginning, the peak and the end of the nesting season, respectively, Max is the mean number of tracks at the peak of the nesting season and PMin is the mean nightly track numbers relative to Max before and after the nesting season. The nesting season is defined as the interval [B, E]. Rather than fitting B and E, it is more convenient to fit LengthB = P – B and LengthE = E – P with LengthB > 0 and LengthE > 0 to ensure that B < P < E. When several nesting seasons are analysed, a year effect for P and/or for LengthB and LengthE can be implemented. We then fitted four categories of models depending on the year effects on P and/or on LengthB and LengthE. These are defined as Peak-Global or Peak-Year and Length-Global or Length-Year.
Interannual spatial and temporal trends
We used a model to estimate the number of tracks for a beach that is not patrolled based on the relative frequency of tracks on the other beaches with data and the total number of tracks for each year (Laloë et al., Reference Laloë, Cozens, Renom, Taxonera and Hays2014). We describe this model here briefly. Let the total theoretical number of tracks be Ti for year i in the entire region where K beaches were monitored during a range of Y years. The distribution of the tracks across the beaches is defined by the proportion pj of Ti tracks in the jth beach. For a total of K beaches, K – 1 parameters p are necessary because of the relation  $\mathop \sum \limits_{j = 1}^K p_j = 1.$ The values pj can be modelled as constant (K – 1 parameters) or as first (2K – 2 parameters) or second (3K – 3 parameters) order as a function of time to represent situations with changes in the relative use of the different nesting sites. The expected number of tracks for year i on beach j is then Ei,j = Ti × pj.
Strategy for parameter fitting
The same strategy for fitting parameters was used for the seasonality, interannual spatial and temporal trend models. Firstly, we fitted the parameters using maximum likelihood and then selected the models using the Akaike information criterion (AIC; Akaike, Reference Akaike1974) and Akaike weight (Burnham & Anderson, Reference Burnham and Anderson2002). The AIC evaluates the quality of the fit, penalizing for overfitting with too many parameters, and the Akaike weight gives the relative support for the models (i.e. the probability of each model being the best one). We searched the distribution of parameters using the Metropolis–Hastings algorithm, which is a Markov chain Monte Carlo method for obtaining a sequence of random samples from a probability distribution (Metropolis et al., Reference Metropolis, Rosenbluth, Rosenbluth, Teller and Teller1953; Hastings, Reference Hastings1970). We ran a total of 10,000 iterations. Priors were all uniform with a range of proposals large enough to ensure they do not constrain the limits of the parameters. From the 10,000 sets of parameters, we calculated their respective means and standard errors. The adjustments were conducted using the R 4.2.1 (R Foundation for Statistical Computing, Vienna, Austria) package phenology, which implements these models (Girondot, Reference Girondot2022).
Relationship between phenology parameters and El Niño–Southern Oscillation events
We tested the relationship between the parameters of the phenology by computing a Pearson correlation matrix with 95% confidence intervals. We also investigated the relationships between the phenology parameters and El Niño–Southern Oscillation events. The bi-monthly Multivariate ENSO Index (MEI v. 2) uses five variables over the tropical Pacific: sea-level pressure, sea-surface temperature, zonal and meridional components of the surface wind and outgoing longwave radiation (Zhang et al., Reference Zhang, Hoell, Perlwitz, Eischeid, Murray, Hoerling and Hamill2019). The lagged effect of El Niño–Southern Oscillation events and their cumulative effect are not known. We calculated partial Spearman correlations between the phenology parameters and El Niño–Southern Oscillation events averaged for 1–37 months with a lag of 0–36 months.
Results
Seasonality of track counts and spatial and temporal trends
We fitted and compared a total of four models (Table 1). The selected model is the year-specific P, LengthB and LengthE model. Only this model will be discussed as the ΔAIC of the second model was 30.23, with a probability of zero that it could be the best model amongst those tested (Akaike weight). The observed and modelled seasonality of the track counts for El Hawaii beach is shown in Fig. 2, and the limits of the nesting season (B and E parameters) and its peak (P) are shown in Fig. 3.
Seasonality of olive ridley sea turtle nesting activity measured on El Hawaii beach in Guatemala in 2008. The selected model for assessing the seasonality of nesting activity is that of the year effect on the P, LengthB and LengthE parameters (Table 1). Seasonality during 1997–2018 is shown in Supplementary Fig. 1. Dots are the nightly counted nests; central plain line is the fitted Bayesian model and central dashed lines represent the 95% credible interval of the seasonality of nesting. Exterior dashed lines represent the 95% credible interval of the nightly nest counts based on the negative binomial distribution.

Synthetic view of the nesting seasonality of olive ridley sea turtles (Table 1) during 1997–2018. The lines show the duration of each nesting season, with the date of peak nesting activity in each season shown as a black circle.

Model selection for assessing the nesting seasonality of the olive ridley sea turtle Lepidochelys olivacea on the Pacific coast of Guatemala during 1997–2018 (Figs 2 & 3). The selected model based on Akaike information criterion (AIC) is shown in bold. We fixed the Max and Min parameters for Churirin in 2014–2015 and El Chico in 2016–2017 (both times series have only one track reported) at 10−4 and 10−6, respectively.

Model of spatial and temporal changes in nesting activities
Information on the total number of nesting activities were available for 11 beaches and 20 of 22 years (1997–2018). The selected model has a constant number of nesting activities for the 11 beaches but with a first-order change according to the year for the probability of using these beaches (Table 2). The total number of nesting activities for the 11 beaches is shown in Fig. 4a and the comparison between the observed and estimated numbers of nesting activities at the beach level is shown in Fig. 4b (adjusted R2 = 0.44). The proportions of nesting activities on the different beaches for these 22 years are shown in Fig. 4c.
Spatial and temporal distributions of the nesting activities of olive ridley sea turtles on the Pacific coast of Guatemala during 1997–2018 (Table 2). (a) Total nesting activities and 95% CI for 11 beaches. (b) The log10 of the observed number of nesting activities per year for the 11 monitored beaches (65 observations) (x-axis) and the log10 of modelled number of nesting activities, using 23 parameters describing spatial and temporal trends (y-axis). The dashed line represents identity of observed and modelled numbers. (c) Temporal distribution of the proportion of nesting activities along the coast during 1997–2018 (beaches are organized from south-east to north-west).

Model selection for assessing spatial and temporal changes in olive ridley sea turtle nesting activities on the Pacific coast of Guatemala during 1997–2018 (Fig. 4). The selected model based on AIC is shown in bold.

Model of spatial and temporal changes in the number of eggs incubated in hatcheries
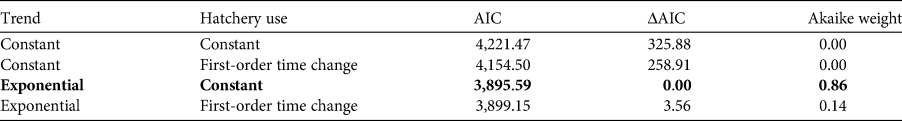
Information on the number of incubated eggs in 29 hatcheries on the Pacific coast of Guatemala was available for 13 years during 2001–2018, with a complete lack of data for 2007–2011. Amongst the total of 522 potential combinations of hatchery and 18 years, data were available for 183 such combinations (35%). We estimated the missing information using a model linking the identity of the hatchery to the year. This model assumes that the number of incubated eggs in a hatchery is related to the number of nests on the nearby beaches. The selected model is an exponential model with a constant temporal proportion of the number of eggs incubated in each hatchery (Table 3). The best model has an instantaneous growth rate of 0.23 (95% CI 0.22–0.24; Fig. 5). The second-best model according to the AIC and Akaike weight had a probability of 0.14 of being the best model. This model is also an exponential model but with a first-order time proportion of the number of eggs incubated in hatcheries.
(a) Olive ridley sea turtle eggs incubated in 29 hatcheries on the Pacific coast of Guatemala during 2001–2018. The points represent the modelled total number of incubated eggs, and the bars the 95% credible interval. The solid line represents the fitted exponential model, and its 95% credible interval is shown with dashed lines. (b) The log10 of the number of eggs incubated per year in the 29 hatcheries (183 observations; x-axis) and the modelled number of eggs incubated, using 31 parameters describing spatial and temporal trends (y-axis). The dashed line represents identity of observed and modelled numbers.

Model selection of assessing spatial and temporal changes in the number of olive ridley sea turtle eggs in hatcheries on the Pacific coast of Guatemala during 2001–2018 (Fig. 5). The selected model based on AIC is shown in bold.
Impacts of El Niño–Southern Oscillation on nesting and phenology
We investigated the relationship between the phenology parameters, which are organized into two groups: (B, LengthB, P) and (Length, E, LengthE) (Table 4). Thus, we searched the relationships between El Niño–Southern Oscillation events and the phenology parameters for the number of tracks, B, and Length. We chose these parameters as they are the easiest to link with the biology of sea turtles if a relationship is found. We detected no clear signal between lagged cumulative El Niño–Southern Oscillation events and number of tracks (Fig. 2a, Supplementary Fig. 2). Nevertheless, we found a positive signal between the sum of 10 months of El Niño–Southern Oscillation events lagged by 18 months and the beginning of the nesting season (Fig. 2b, Supplementary Fig. 2). We also found a positive signal between the sum of 15 months of El Niño–Southern Oscillation events lagged by 12 months and the length of the nesting season (Fig. 2c, Supplementary Fig. 2).
Matrix of Pearson correlation coefficients (with 95% CI) for the phenology parameters assessed in this study of the olive ridley sea turtle. Confidence intervals not encompassing zero are shown in bold. Groups of linked parameters are shown with similar shading (light: B, P, LengthB; dark: E, LengthE, Length).

Discussion
The conservation status of sea turtles is often inferred from trends in the numbers of nests on beaches. The conservation status at the national scale can be used to assess whether an implemented conservation strategy is performing well. It was concluded previously that there has been an exponentially increasing trend in nesting activity on El Hawaii beach in Guatemala (Ariano-Sánchez et al., Reference Ariano-Sánchez, Muccio, Rosell and Reinhardt2020), and based on this conclusion it was assumed that the implemented conservation strategy in Guatemala was performing well.
Ariano-Sánchez et al. (Reference Ariano-Sánchez, Muccio, Rosell and Reinhardt2020) based the nesting season in Guatemala on the civil year (January–December). Figures 2 and 3 show that the peak in nesting activity is not consistent between years: the nesting season generally occurs between July and March of the following year, but the precise dates of the beginning and end of the nesting season change from year to year. When these data are included in the interannual analysis, we can conclude that a constant trend best represents the data (Fig. 4a), not an exponentially increasing trend (P < 10−6; Table 2). Nevertheless, the proportion of tracks on El Hawaii beach compared to the total amount of nesting activity on the 10 other monitored beaches along the Pacific coast of Guatemala shows an increasing trend (Fig. 4c). Thus, the increasing trend reported originally for El Hawaii beach (Ariano-Sánchez et al., Reference Ariano-Sánchez, Muccio, Rosell and Reinhardt2020) should not be interpreted as a national trend.
There is a contradictory issue in Ariano-Sánchez et al. (Reference Ariano-Sánchez, Muccio, Rosell and Reinhardt2020) concerning the impacts of El Niño–Southern Oscillation events on nesting: an increase in the nesting abundance of the population along the Pacific coast of Guatemala was described that was resilient to El Niño–Southern Oscillation event variability, but no correlation between El Niño–Southern Oscillation events and nesting abundance was found. The conclusion regarding the increasing trend in nesting activity was based on the fact that the number of eggs incubated in hatcheries increased in the second year after two extreme El Niño–Southern Oscillation events, even though decreases in nesting activity were observed in 2010 and 2015, immediately after the extreme events (La Niña and El Niño, respectively). When using a more precise analytical approach, we did not detect a relationship between the annual number of tracks and the El Niño–Southern Oscillation event index. However, we did detect a strong effect of El Niño–Southern Oscillation events lagged by 12 or 18 months in terms of both the beginning and the length of the nesting season (Fig. 7). The longer nesting seasons could be because of two different phenomena: either larger clutch frequency (number of nests deposited by females during one nesting season) or greater polymorphism in the arrival dates of females. The lack of information on these phenomena means that we are unable to examine these hypotheses. The nature of any link between El Niño–Southern Oscillation events and nesting phenology needs to be studied in greater detail.
The comparison between track counts (Fig. 4a) and yearly incubated egg numbers in hatcheries (Fig. 5a) indicates that the number of eggs incubated in hatcheries cannot be safely used as a proxy for L. olivacea nesting trends along the Pacific coast of Guatemala. The number of eggs purchased and incubated in hatcheries has increased because of popular demand for releasing hatchlings, which is paid for by tourists visiting the hatcheries. Some hatcheries are funded by national or international organizations, others by individual sponsors or by tourists who pay a fee to release a hatchling. This probably explains why many hatcheries are buying the majority of eggs in a nest (80%) from collectors or incubating whole nests, although this process can affect turtles and their habitats if not performed correctly (Katselidis et al., Reference Katselidis, Schofield, Stamou, Dimopoulos and Pantis2013). Thus, the exponential increase in the number of incubated eggs cannot be used as evidence for an increase in the number of nests deposited on the Pacific coast of Guatemala.
Our data invalidate the hypothesis that the nesting activities of olive ridley sea turtles increased during 2003–2018 (Ariano-Sánchez et al., Reference Ariano-Sánchez, Muccio, Rosell and Reinhardt2020). The trend is stable, with some peaks. The number of eggs being incubated in hatcheries is mainly related to the funding available to each hatchery to purchase eggs. The evaluation of population status should focus on the nesting phenology and the total number of nests deposited on the beach as opposed to the number of incubated eggs, which is more likely a measure of the funding of hatcheries.
The 2008 IUCN Red List categorization of the olive ridley sea turtle as Vulnerable is at a global scale (Abreu-Grobois & Plotkin, Reference Abreu-Grobois and Plotkin2008). However, the regional status of sea turtle species is a more realistic representation of the situation at a local scale (Wallace et al., Reference Wallace, DiMatteo, Hurley, Finkbeiner, Bolten and Chaloupka2010). Furthermore, for olive ridley sea turtles it could be relevant to assess the status of mass nesting and solitary populations separately and obtain an accurate description of the trends in each subpopulation within each Regional Management Unit (Wallace et al., Reference Wallace, DiMatteo, Hurley, Finkbeiner, Bolten and Chaloupka2010). At the national scale in Guatemala, the stable trend of the olive ridley sea turtle population indicates that the current management scheme adopted for this species, in which 80% of eggs are used for human consumption and 20% are incubated artificially, is not causing a population decline. However, we urge conservation groups to monitor and improve egg incubation conditions as these appear sometimes to be suboptimal, potentially affecting hatching success rates and resulting in potentially skewed sex ratios of hatchlings, as olive ridley sea turtles exhibit temperature-dependent sex determination (Abreu-Grobois et al., Reference Abreu-Grobois, Morales-Mérida, Hart, Guillon, Godfrey, Navarro and Girondot2020).
Acknowledgements
The nesting data used in this study were part of the sea turtle population monitoring programme of the NGO ARCAS, which has been funded by the US Agency for International Development, the National Conservation Fund of Guatemala, the US Fish and Wildlife Service and Idea Wild. The hatchery data were made available by the National Council of Protected Areas. We thank the local patrollers and park directors who helped in recording the nesting tracks on El Hawaii beach; Airam López for provision of the hatchery data; and Martin Fisher for his editing help.
Author contributions
Study design: BAM-M, MG; fieldwork coordination: CM; data analysis, writing: BAM-M, MG.
Conflicts of interest
None.
Ethical standards
This research abided by the Oryx guidelines on ethical standards. Collection of data was performed with the authorization of the government of Guatemala and track information was obtained under the authority and permissions obtained by the NGO ARCAS. Hatchery information is provided from hatcheries to the National Council of Protected Areas (Guatemala's governmental authority), for them to construct an annual database, and this was provided officially for this publication.


 Open access