

Approximately one-quarter of adult Canadians are obese and an additional 37 % are overweight, while more than one-third of Canadian children and youth are either obese or overweight( 1 , 2 ). A primary determinant of the increase in obesity is increased consumption of energy-dense foods, driven in part by greater energy intake outside the home from foods consumed at restaurants and fast-food outlets, as well as larger portion sizes( Reference French, Harnack and Jeffery 3 – Reference Steenhuis and Vermeer 5 ). Eating out has become increasingly more common: the average Canadian household now spends approximately one-quarter of its food dollars on the food-service industry( 6 ). Food eaten outside the home – at fast-food and other restaurants – is associated with higher intakes of energy, fat and saturated fat, as well as lower intakes of fibre, calcium, fruit and vegetables( Reference Kant and Graubard 7 – Reference Schmidt, Affenito and Striegel-Moore 10 ).
Pre-packaged food products in Canada are required to display a nutrition facts table; however, consumers receive little or no information on the nutritional content of foods served in restaurants or fast-food outlets. Nutrition labelling on menus has been proposed as a method to educate the general public on the nutritional content of food items prepared away from home. In 2010, the USA was the first country in the world to pass legislation to regulate a menu labelling policy in restaurants and fast-food outlets, which is expected to be implemented by late 2013. Restaurant chains with more than twenty outlets will be required to display energy (calorie) information on menus and menu boards beside each food item( 11 ). Although menu labelling policy has previously been implemented in several jurisdictions in the USA, no Canadian jurisdictions require nutrition information at the point of sale.
To date, evidence is mixed with respect to the potential impact of nutrition labelling on dietary behaviour. Studies have found that the proportion of individuals who notice nutrition information ranges from 32 % to 82 %( Reference Bassett, Dumanovsky and Huang 12 – Reference Vadiveloo, Dixon and Elbel 18 ). Studies have also found that of those individuals who notice menu labelling, between 14·5 % and 37·0 % claim to use it( Reference Bassett, Dumanovsky and Huang 12 , Reference Pulos and Leng 13 , Reference Elbel, Kersh and Brescoll 15 , Reference Vadiveloo, Dixon and Elbel 18 ). Several experimental studies examining interventions that post energy information on menus have found a reduction in energy ordering or consumption, ranging from 59 kJ (14 kcal) to 849 kJ (203 kcal) lower( Reference Bassett, Dumanovsky and Huang 12 , Reference Pulos and Leng 13 , Reference Roberto, Larsen and Agnew 19 – Reference Dumanovsky, Huang and Nonas 22 ). Other studies have reported no significant change in energy ordered( Reference Harnack, French and Oakes 14 , Reference Elbel, Kersh and Brescoll 15 , Reference Elbel, Gyamfi and Kersh 16 , Reference Finkelstein, Strombotne and Chan 23 ), while one study has reported a slight increase in energy purchased( Reference Aaron, Evans and Mela 24 ). Several studies have examined menu labelling in hospital cafeterias. One study in a hospital cafeteria reported moderate improvements in macronutrient and energy intakes (approximately 293 kJ (70 kcal) fewer purchased) with the provision of nutrition information and healthier offerings in the cafeteria; however, the authors cite several limitations to the study including the possibility that participants reduced fat and energy intakes because they knew that these were outcomes of interest in the study( Reference Lowe, Tappe and Butryn 25 ). Another study in a hospital cafeteria found that a 12-week menu labelling intervention was association with increased purchases of lower-energy side dishes and snacks( Reference Webb, Solomon and Sanders 26 ). The use of a health logo has also been tested in worksite and university cafeterias, with no significant changes to food consumption( Reference Hoefkens, Lachat and Kolsteren 27 , Reference Vyth, Steenhuis and Heymans 28 ).
The current study examined the impact of a nutrition labelling programme in a cafeteria setting. In particular, the study sought to examine the impact of displaying comprehensive nutrition information at the point of sale on: (i) consumer noticing; (ii) perceived influence of the information on food choices; and (iii) nutritional content of food ordered and consumed.
Experimental methods
The study compares two cafeterias on hospital campuses in a large Canadian city that provided differing levels of nutrition information. Surveys were conducted with cafeteria patrons at The Ottawa Hospital Civic Campus cafeteria (the ‘intervention’ cafeteria) and the General Campus cafeteria (the ‘control’ cafeteria) in August/September 2011. The nutrition information programme in the intervention cafeteria provided five digital menu boards with prominent displays of nutrition information at the point of sale, featuring information on energy (calories), sodium, saturated fat and total fat, and was part of a larger ‘Hospital Check’ programme (see Fig. 1). The nutrition information programme was implemented in January 2011, approximately 8 months prior to the data collection period. The menu boards provided nutrition information for soups and salads, pizza and pastas, grill items, and entrées and paninis. Several food items were available daily that were not included on the menu boards, in addition to pre-packaged food items that were not labelled.
Image of digital menu boards in the intervention cafeteria (1 kcal = 4·184 kJ)
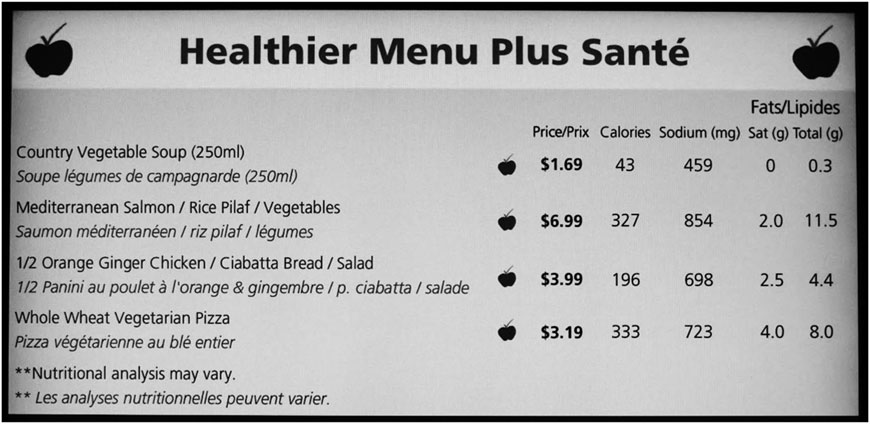
Other components of the programme included: (i) a health logo (an apple with a check mark) for items that met the developed nutritional standards; (ii) a ‘Healthier Menu Plus Santé’ at the entrance to the cafeteria highlighting healthier menu items available on the menus; and (iii) an educational campaign (posters and pamphlets) promoting the programme and how the programme can be used effectively at the entrance to the seating area of the cafeteria. In addition, the cafeteria with nutrition information reformulated recipes for some food items and removed the deep fryer from the cafeteria in an effort to provide a greater selection of ‘healthier’ food items that met the Hospital Check criteria. Due to these changes, there were overall differences in the average nutrient profiles for food categories between sites.
During the time of the study, the control cafeteria provided limited nutrition labelling, displaying energy, sodium, saturated fat, trans-fat and total fat information for a limited selection of items using 11 cm×28 cm (8·5 in×11 in) paper signs throughout the cafeteria. There was also limited nutrition information provided at the entrance to the cafeteria. Daily visual scans of the control cafeteria indicated that the information provided in the cafeteria was available only for selected items, and was not available for these items on a consistent basis.
Data were collected over a 5-week period. From Monday to Friday, data were collected from 11.00 to 19.00 hours, and on Saturday and Sunday from 08.30 to 16.30 hours. Breakfast information was only collected on Saturday and Sunday. To minimize self-selection bias, participants were recruited using a standard intercept survey technique, whereby trained interviewers were stationed at the exit of the cafeteria seating areas and approached each patron who passed a designated landmark as they exited the cafeteria. Participants were invited to participate in a 10-min survey on food choices in cafeterias. Computer-assisted personal interviews were administered using iPads. The survey was offered in English and French. A short introductory script was used to introduce the survey and ensure that individuals met eligibility criteria. The study was conducted according to the guidelines laid down in the Declaration of Helsinki and all procedures involving human subjects were approved by the University of Waterloo Office of Research Ethics and the Ottawa Hospital Research Ethics Board. Verbal informed consent was obtained from all participants.
Sample description
A total of 1013 individuals completed surveys. Ten individuals were excluded from the final sample due to incomplete or inconsistent sociodemographic information, for a final sample size of 1003 (n 497 at the intervention site and n 506 at the control site). Individuals were eligible for the study if they were over 18 years of age, had purchased food in the cafeteria on the day of the survey, could speak and understand English or French, and had not previously completed the survey. A total of seven interviews were conducted in French. According to criteria for the calculation of response rate #4 of the American Association for Public Opinion Research( 29 ), the response rate was 25·9 % at the intervention site and 29·1 % at the control site; this was not significantly different between sites.
Survey measures
Sociodemographic information
Personal demographic information included gender, age (18–34 years; 35–44 years; 45–54 years; ≥55 years), education level (high school or less; some college or university; completed college or university; graduate or professional school), income level (<$CAN 40 000; $CAN 40 000–80 000; >$CAN 80 000), and ethnicity (white; other). Two questions were asked regarding consumer demographics: consumer type (staff; visitor; patient) and frequency of eating at the cafeteria (never; less than once per week; once per week; two to three times per week; four or more times per week).
Menu label noticing and impact
A series of questions examined menu label noticing: whether or not the individual noticed any nutrition information (‘Did you notice any nutritional information anywhere in the cafeteria?’) and if yes, ‘Where was this information located?’ (open ended). Participants were also asked what types of nutrition information they noticed (open ended). To examine consumer perceptions of the impact of menu labelling, participants were asked if the nutrition information influenced which food items were selected and if so, what influence the nutrition information had on their food choice.
Health and nutrition knowledge and behaviours
Participants were asked about the frequency of using nutrition labels when shopping for pre-packaged food (never; sometimes; usually; always), and were asked to rate their overall health (poor; fair; good; very good; excellent). Participants were also asked to self-report their height and weight to calculate BMI.
Support for nutrition information on menus
Prior to the conclusion of the survey, respondents were asked ‘Overall, do you think it is a good idea for this hospital to have nutrition information on menus in the cafeterias?’, as well as ‘Do you think that all fast-food and other chain restaurants should list nutrition information on menus and menu boards?’ Participants were also asked: ‘Do you think it is a good idea to put a logo or symbol beside food items on menus to indicate a health option?’ Finally, participants were asked about specific types of nutrition information, if any, they would like to be displayed on menus.
Food order and consumption
The respondent's food order was identified through a series of five open-ended questions: (i) ‘What was the main food item you ordered today?’; (ii) ‘Did you modify or add anything to this item, for example adding extra cheese or asking for no sauce?’; (iii) ‘Did you choose any additional side dishes with this meal?’; (iv) ‘Did you purchase a drink?’; and (v) ‘Did you purchase a dessert or any other snack items?’ To examine the amount of food consumed, participants were first asked ‘Did you eat all of your meal today?’ If the respondent had not finished his/her entire meal, he/she was asked approximately how much of each food/drink item he/she consumed (one-quarter, one-half, three-quarters, or the entire item). Items were coded as ‘take-out’ if the respondent did not eat any of the items and was taking the entire item with them. It was assumed that those who had take-out orders consumed the entire item.
Nutritional content of food items was provided by the hospital's nutrition and food-service department, and was ascertained using C-Bord Nutrition Service Software. For food items that did not have accessible nutrition information, the information was obtained from the Canadian Nutrient File. Individuals who did not report details on portion or serving size were assumed to have selected the most commonly sold value according to hospital sales data. For entries that did not contain sufficient detail to illicit the specific item sold (e.g. ‘pizza’ or ‘soup’), an average was assigned proportionate to sales data specific to each site. It was assumed that meals came as they appeared on the menu, unless detail was otherwise provided in the participant's description. There was not enough detail to assign individualized nutrition information for salad bar purchases. Salad bar purchases were assigned a category average for energy, sodium, saturated fat and total fat, with average nutritional content for salad dressing. Averages were based on the volume of each salad bar item sold within a week period and divided by the number of salad bar purchases over the same period. Data specific to each site were collected over a 1-week period upon conclusion of the study. Participants whose food order descriptions were not sufficiently detailed to identify foods purchased were excluded from the analysis of food consumption (n 118). This included items mentioned that were not for sale in the cafeteria, items for which there was inadequate detail to assign a category average, or items for which there was no available nutritional information. The proportion of participants excluded from analysis was not significantly different between sites (13·2 % at the control site v. 10·5 % at the intervention site).
Analysis
Analyses were conducted using the statistical software package IBM SPSS Statistics version 20. The Pearson χ 2 test was used to test statistical significance for proportions. The t test was used to examine mean differences for continuous variables. Logistic regression models were conducted among the total sample to examine predictors for two primary outcomes: menu label noticing (0 = did not notice labelling, 1 = noticed labelling) and perceived influence of menu labelling (0 = labelling did not influence behaviour, 1 = labelling did influence behaviour). Those who did not notice menu labelling were assigned ‘0’ for the perceived influence of menu labelling. Demographic covariates in both logistic regression models were: ‘site’ (i.e. indicator variable for intervention or control), consumer type, frequency of eating at the cafeteria, age, gender, education, income and ethnicity. A preliminary step was undertaken to select other potential covariates from the following list: frequency of eating outside the home, nutritional knowledge, frequency of label use when shopping, frequency of moderate-to-vigorous physical activity, dieting behaviour, perceived general health status, perceived weight and BMI status. Bivariate correlations with each key outcome were tested. The following variables were correlated at a significance level lower than 0·10 and were entered as a covariate in the logistic regression models: frequency of nutrition label use (never; sometimes; usually; always), general health (poor; fair; good; very good; excellent) and BMI status (underweight; normal weight; overweight; obese; missing).
Four linear regression models were conducted to examine energy, sodium, saturated fat and total fat consumption. The total energy, sodium, saturated fat and total fat contents for all food and beverages consumed were calculated and entered as the outcome variables in separate models. Covariates in each linear regression model included ‘site’ (intervention; control), consumer type, frequency of eating at the cafeteria, age, gender, education, income, ethnicity, frequency of label use, general health and BMI status. Two-way interactions between ‘site’ and age, gender, ethnicity, income, education and BMI were tested in the final model.
Results
Sample characteristics
Sample characteristics can be found in Table 1. No significant differences were found between sites, except for income level (χ 2 = 14·9, P = 0·005).
Characteristics of the study sample; patrons at two cafeterias on hospital campusesFootnote * in Ottawa, Canada that provided differing levels of nutrition information, 2011

* The Ottawa Hospital General Campus cafeteria = the ‘control’ cafeteria; The Ottawa Hospital Civic Campus cafeteria = the ‘intervention’ cafeteria.
† Values are presented as mean and sd.
Menu label noticing
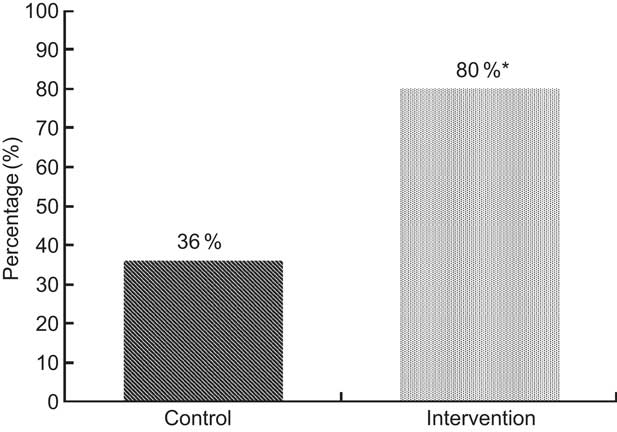
Significantly more respondents noticed labelling in the intervention cafeteria than the control cafeteria (79·5 % v. 36·2 %; OR = 7·63, 95 % CI 5·56, 10·53; P < 0·001; see Fig. 2). The most common location recalled by respondents was the digital menu board in the intervention cafeteria (72·8 %) and on a sign in the control cafeteria (31·6 %). At the intervention site, the most common types of nutrition information noticed were energy (51·7 %), sodium (37·4 %) and total fat (32·8 %). At the control site, the most common types of nutrition information noticed were energy (22·5 %), sodium (16·8 %) and total fat (4·2 %).
Proportion of participants (n 1003) who noticed any nutritional information anywhere in the cafeteria (
 $$$$
, control cafeteria;
$$$$
, control cafeteria;
 $$$$
, intervention cafeteria); two cafeterias on hospital campuses in Ottawa, Canada that provided differing levels of nutrition information, 2011. *Significant difference compared with the control group: OR = 7·62, P < 0·001
$$$$
, intervention cafeteria); two cafeterias on hospital campuses in Ottawa, Canada that provided differing levels of nutrition information, 2011. *Significant difference compared with the control group: OR = 7·62, P < 0·001
Logistic regression models were run to examine menu label noticing adjusting for age, gender, education, income, ethnicity, BMI, general health and frequency of nutrition label use when shopping.
Predictors of noticing menu labelling
There was a significant effect of consumer type (P = 0·001): staff were more likely to notice menu labelling than visitors (OR = 1·77, 95 % CI 1·14, 2·75; P = 0·011) and patients (OR = 3·06, 95 % CI 1·67, 5·59; P < 0·001). Females were also significantly more likely to notice labelling than males (OR = 1·55, 95 % CI 1·10, 2·18; P = 0·011).
Influence of menu labelling
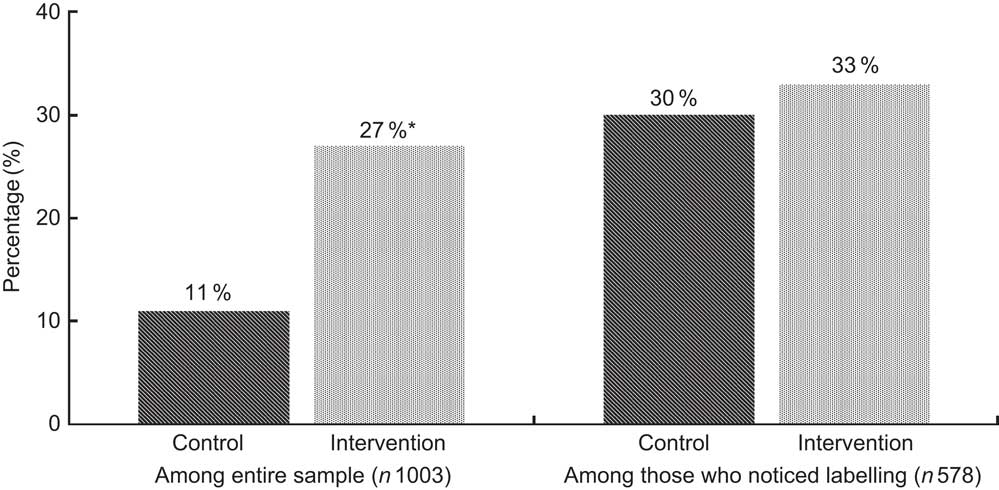
Respondents were asked if the information influenced their food choice. Figure 3 shows patterns of menu labelling influence at intervention and control sites. Overall, significantly more respondents reported that they were influenced by menu labelling at the intervention site compared with the control site (26·6 % v. 10·7 %; OR = 3·32, 95 % CI 2·24, 4·92; P < 0·001). There were no significant differences between sites in the proportion of individuals who were influenced by menu labelling among those who noticed menu labelling. Among those who were influenced by labelling, 35·5 % claimed that they had selected items with less sodium and 30·6 % claimed that they had selected items with lower energy (fewer calories) overall. This was equivalent to 6·6 % of the entire sample claiming that they had selected less sodium and 5·7 % claiming they had selected lower energy.
Proportion of participants who reported that the nutrition information influenced which food or drink items they purchased for their meal (
 $$$$
, control cafeteria;
$$$$
, control cafeteria;
 $$$$
, intervention cafeteria); two cafeterias on hospital campuses in Ottawa, Canada that provided differing levels of nutrition information, 2011. *Significant difference compared with the control group: OR = 3·32, P < 0·001
$$$$
, intervention cafeteria); two cafeterias on hospital campuses in Ottawa, Canada that provided differing levels of nutrition information, 2011. *Significant difference compared with the control group: OR = 3·32, P < 0·001
Predictors of being influenced by menu labelling
There was an overall significant effect of consumer type (P = 0·019): staff were more likely to be influenced by menu labelling than visitors (OR = 1·86, 95 % CI 1·07, 3·23; P = 0·029) and patients (OR = 3·17, 95 % CI 1·22, 8·19; P = 0·018). Ethnicity was also a significant predictor: participants who reported any ethnicity other than ‘white’ were more likely to report using menu labelling than those who reported ‘white’ ethnicity (OR = 1·55, 95 % CI 1·01, 2·39; P = 0·046). There was also a significant effect of use of nutrition labels when shopping for food (P < 0·001): compared with those who reported ‘never’ using labelling, those who ‘usually’ used labelling (OR = 4·83, 95 % CI 2·01, 11·63; P < 0·001) and ‘always’ used labelling (OR = 7·18, 95 % CI 3·07, 16·82; P < 0·001) were significantly more like to perceive that they were influenced by the menu labelling in the cafeterias. Similarly, compared with those who reported ‘sometimes’ using labelling when shopping, those who ‘usually’ used labelling (OR = 2·53, 95 % CI 1·45, 4·43; P = 0·001) and ‘always’ used labelling (OR = 3·76, 95 % CI 2·24, 6·31; P < 0·001) were significantly more likely to perceive that they were influenced by the menu labelling in the cafeterias.
Food and beverage consumption
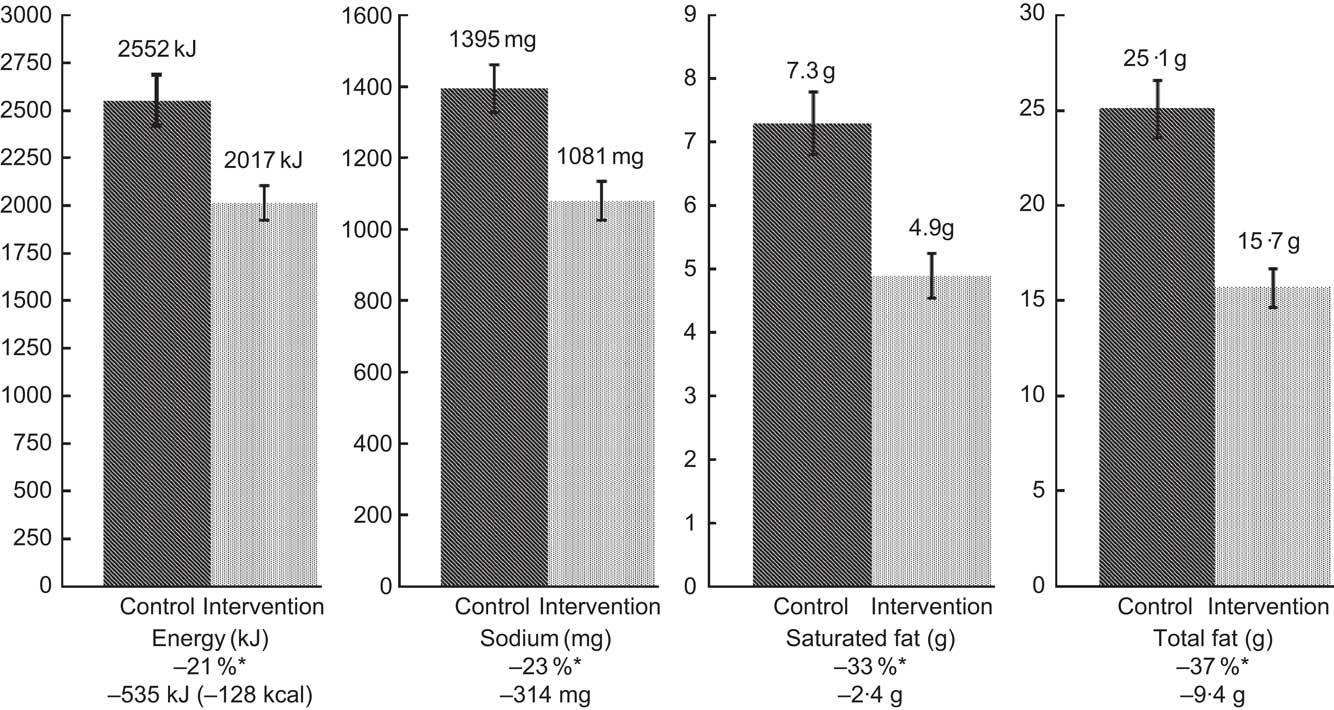
Figure 4 shows the mean energy, sodium, saturated fat and total fat content of all food and beverage items consumed per participant at each site. A linear regression model was conducted to examine differences in mean energy, sodium, saturated fat and total fat consumption. Compared with the control site, patrons at the intervention site consumed significantly less energy (β = −133·26, P < 0·001), sodium (β = −323·11, P < 0·001), saturated fat (β = −2·36, P < 0·001) and total fat (β = −9·43, P < 0·001), adjusting for consumer type, age, gender, education, income, ethnicity, BMI, general health and frequency of nutrition label use when shopping (see Fig. 4).
Comparison of energy, sodium, saturated fat and total fat consumption (n 823) between sites (
 $$$$
, control cafeteria;
$$$$
, control cafeteria;
 $$$$
, intervention cafeteria); two cafeterias on hospital campuses in Ottawa, Canada that provided differing levels of nutrition information, 2011. Values are means with their standard errors represented by vertical bars. *Difference in intake between the control and intervention groups was significant: P < 0·001
$$$$
, intervention cafeteria); two cafeterias on hospital campuses in Ottawa, Canada that provided differing levels of nutrition information, 2011. Values are means with their standard errors represented by vertical bars. *Difference in intake between the control and intervention groups was significant: P < 0·001
Separate linear regression models were conducted to examine differences for foods and beverages independently. Significant differences in food consumption between sites were found for energy (intervention mean = 1820 kJ (435 kcal) v. control mean = 2356 kJ (563 kcal), P < 0·001), sodium (intervention = 1047 mg v. control = 1344 mg, P < 0·001), saturated fat (intervention = 4·8 g v. control =7·0 g, P < 0·001) and total fat (intervention = 15·6 g v. control = 24·6 g, P < 0·001). Differences in beverage consumption were more modest and were significantly different for sodium (intervention = 41 mg v. control =55 mg, P = 0·011), saturated fat (intervention 0·3 g v. control 0·2 g, P = 0·005) and total fat (intervention = 0·3 g v. control 0·5 g, P = 0·004), but not for energy.
Results for measures of consumption were very similar to measures for ordering, which did not account for self-reported consumption amount. Compared with the control site, patrons at the intervention site ordered significantly less energy (intervention mean = 2092 kJ (500 kcal) v. control mean = 2372 kJ (627 kcal), β = 131·57, P < 0·001), sodium (intervention mean = 1126 mg v. control mean =1444 mg, β = 315·18, P < 0·001), saturated fat (intervention mean = 5·1 g v. control mean = 7·5 g, β = 2·35, P < 0·001) and total fat (intervention mean = 16·2 g v. control mean = 25·8 g, β = 9·54, P < 0·001). When an analysis was conducted excluding those respondents who were coded as ‘take-out’, the pattern of results was largely the same both with respect to mean differences of macronutrients consumed as well as the linear regression models. The only major difference in the pattern of results was that the difference between sites for sodium consumption was no longer significant when the take-out sample was excluded; however, the analysis excluding ‘take-out’ users had lower power to detect statistically significant differences due to the reduced sample size.
Predictors of energy consumption
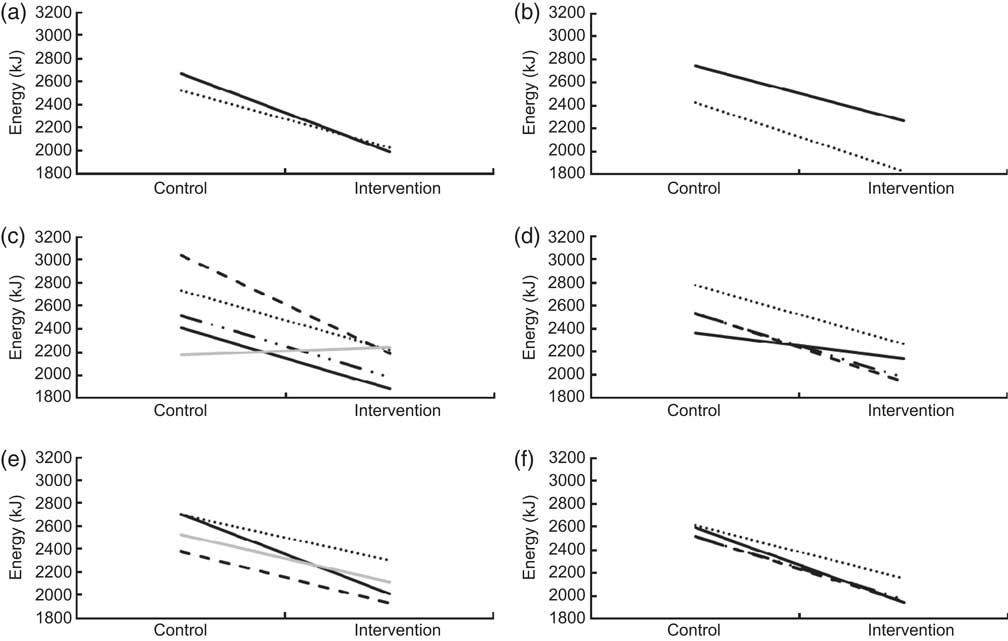
Men consumed significantly more energy than women (β = 70·44, P < 0·001). No significant two-way interaction effects were observed between site and age, gender, ethnicity, income, education or BMI, as illustrated in Fig. 5.
Differences in energy consumption among participants at the intervention and control cafeterias according to demographic subgroups: (a) ethnicity (· · · · ·, white; ——, other); (b) gender (——, male; · · · · ·, female); (c) BMI status (· · · · ·, underweight; ——, normal weight; — · · —, overweight; – – –, obese;
 $$$$
, missing); (d) education (· · · · ·, high school or less; ——, some college or university; — · · —, completed college or university; – – –, graduate or professional school); (e) annual income (· · · · ·, <$CAN 40 000; ——, $CAN 40 000–80 000; – – –, >$CAN 80 000;
$$$$
, missing); (d) education (· · · · ·, high school or less; ——, some college or university; — · · —, completed college or university; – – –, graduate or professional school); (e) annual income (· · · · ·, <$CAN 40 000; ——, $CAN 40 000–80 000; – – –, >$CAN 80 000;
 $$$$
, missing); (f) age group (· · · · ·, 18–34 years; ——, 35–44 years; — · · —, 45–54 years; – – –, ≥55 years). Two cafeterias on hospital campuses in Ottawa, Canada that provided differing levels of nutrition information, 2011 (1 kcal = 4·184 kJ)
$$$$
, missing); (f) age group (· · · · ·, 18–34 years; ——, 35–44 years; — · · —, 45–54 years; – – –, ≥55 years). Two cafeterias on hospital campuses in Ottawa, Canada that provided differing levels of nutrition information, 2011 (1 kcal = 4·184 kJ)
Differences in consumption among those who noticed and were influenced
t Tests were conducted to examine mean differences in energy consumption among those who noticed and used menu labelling. Among the entire sample, those who noticed menu labelling consumed 322 kJ (77 kcal) less energy (2142 kJ (512 kcal) v. 2464 kJ (589 kcal), P < 0·001), 159 mg less sodium (1169 mg v. 1328 mg, P < 0·001), 1·5 g less saturated fat (5·5 g v 6·9 g, P < 0·001) and 4·8 g less fat (18·1 g v. 23·4 g, P < 0·001) than those who did not notice menu labelling.
Overall, those who were influenced by menu labelling consumed significantly less energy than those who were not influenced by menu labelling. Among the entire sample, patrons who were influenced by menu labelling consumed 439 kJ (105 kcal) less energy (1925 kJ (460 kcal) v. 2364 kJ (565 kcal), P < 0·001), 149 mg less sodium (1116 mg v. 1265 mg, P = 0·009), 1·6 g less saturated fat (4·8 mg v. 6·4 g, P < 0·001) and 4·8 g less total fat (16·5 g v. 21·3 g, P < 0·001). Among patrons at the intervention cafeteria, those who reported being influenced by menu labelling consumed 251 kJ (60 kcal) less energy than those who did not report being influenced by menu labelling (1837 kJ (439 kcal) v. 2088 kJ (499 kcal), t = −2·5, P = 0·013). Those who were influenced by labelling at the intervention site also consumed less sodium (1054 mg v. 1091 mg), saturated fat (4·4 g v. 5·1 g) and total fat (14·2 g v. 16·3 g); however these differences were not statistically significant. At the control site, there were no statistically significant differences among those who were influenced and those who were not influenced by menu labelling in energy (2184 kJ (522 kcal) v. 2590 kJ (619 kcal)), sodium (1295 mg v. 1406 mg), saturated fat (5·8 g v. 7·4 g) and total fat consumption (22·9 g v. 25·3 g).
Support for menu labelling
Overall, 95 % of respondents thought it was a good idea to have menu labelling in hospital cafeterias. Similarly, 90 % of respondents thought that all restaurants and fast-food outlets should provide nutrition information on menus. Approximately 83 % of respondents supported the use of a health logo or symbol to represent healthier options on menus. There were no significant differences in levels of support across sites. When asked what nutrition information, if any, they would like to see displayed on menus, respondents reported that they would most like to see energy (72·0 %), followed by fat (54·6 %), sodium (51·1 %), added sugars (18·5 %), carbohydrates (17·4 %), protein (16·8 %) and fibre (10·1 %).
Discussion
The present study suggests that nutrition labelling on menu boards can significantly increase awareness and use of nutrition information when eating outside the home. More than 80 % of consumers reported noticing nutrition information at the intervention site, in which nutrition information was displayed next to the price of items on the menu board. Previous studies suggest that awareness of nutrition information in most restaurants is extremely low (4 % in major chain restaurants in the USA without any menu labelling), despite the fact that many chains ostensibly provide information in pamphlets, posters or other locations at the point of sale( Reference Bassett, Dumanovsky and Huang 12 ). Therefore, the current results highlight menus and menu boards as a critically important location for displaying nutrition information.
Of those who noticed nutrition information, approximately one-third reported they had used this information to guide their food choice in both intervention and control sites. This suggests, as might be expected, that not all patrons alter food selection in response to the provision of nutrition information. This is consistent with previous research demonstrating the importance of other factors in food choice such as price, taste and convenience( Reference Glanz, Basil and Maibach 30 ). Although individuals may self-select to use this information, energy consumption at the intervention site was lower among all population subgroups; therefore, the intervention had an equal impact among cafeteria patrons of both low and high socio-economic status.
Consumption of energy, sodium, saturated fat and total fat was lower at the intervention cafeteria. Differences between sites were substantial, even after adjusting for other sociodemographic factors: 21 % less energy, 23 % less sodium, 33 % less saturated fat and 37 % less total fat was consumed. These reductions could translate into meaningful differences in dietary intake over time. For example, one-third of staff in our study reported they consumed food in the cafeteria two times per week. A reduction of 544 kJ (130 kcal) per meal would be the equivalent of 8·14 lb (3·7 kg) of weight gain avoided per year for these staff at the intervention cafeteria compared with the control cafeteria. Given the differences between sites in a number of factors in addition to the implementation of menu labelling, it is difficult to attribute these differences to menu labelling alone; rather, the reduction is most likely due to the combination of nutrition information on menus and improved nutritional content of the food selection offered.
Overall, patrons who noticed and used nutrition information consumed less energy. This finding indicates a correspondence between claiming to use nutrition information and actual differences in food selection, which may have methodological implications for larger, population-based evaluations of menu labelling regulations. In contrast, a previous study found that those who reported using nutrition information did not purchase less energy( Reference Elbel, Kersh and Brescoll 15 ). Future research should examine the validity of self-reported changes in response to menu labelling in greater detail.
Staff were more likely to notice and use the nutrition information, perhaps due to repeated exposure to the information. This may also reflect that hospital staff and health-care providers may be more knowledgeable and concerned about nutrition than the general public. Interestingly, those who more frequently used nutrition labelling on pre-packaged food were more likely to be influenced by nutrition labelling, perhaps due to higher levels of nutritional knowledge and literacy. Additionally, several population subgroups were more likely to be influenced by nutrition labelling. Females were more likely to notice nutrition labelling than males, consistent with some but not all studies in this field( Reference Dumanovsky, Huang and Bassett 17 , Reference Vadiveloo, Dixon and Elbel 18 ). White participants were less likely to report that they were influenced by nutritional labelling, which has not been reported in other studies of menu labelling.
There were near unanimous levels of support for nutrition information on menus. This evidence suggests that there is strong interest in menu labelling across all demographic groups, particularly in publicly funded venues such as hospitals.
Strengths and limitations
The present study had several limitations. First, the two participating cafeterias differed on a number of factors other than nutrition labelling. As a result, differences in energy, sodium and fat consumption observed in the study cannot be attributed to any one factor. Second, in many cases assumptions were required to assign nutrition information to food selections, such as salad bar items, which had no fixed quantity. This approach will result in measurement error at the individual level within each site; however, the same method was used at both cafeterias and this approach should yield accurate estimates for the purpose of calculating differences between sites. In the analysis, it was assumed that those whose purchases were ‘take-out’ items consumed the entire item, which may have led to an overestimation of energy consumption. However, in the overall sample the vast majority (85 %) consumed the entire item and analysis excluding the ‘take-out’ participants showed little difference in overall patterns of significance. Third, there are limitations to self-reported data in this survey. The study relied upon accurate recall of food items purchased, as well as the general quantity of each item that was consumed. Although food recall can be subject to recall biases, patrons in the current study were surveyed immediately after they had finished their meal. Other self-reported measures, such as height and weight used to calculate BMI, are also subject to biases. Any measurement error associated with self-report questions would apply to both sites and is unlikely to account for the differences observed between cafeterias. Finally, this sample does not include those individuals who may have stopped eating at the cafeteria after nutrition information was posted.
Strengths of the study include the naturalistic environment within which the study was conducted, the use of similar data collection methodologies between sites for comparison and analytical models that adjusted for differences in the sample profile at each site. The findings in the study will also serve as a baseline for two additional waves of data collection, which will provide a pre–post comparison for the control cafeteria after implementation of the Hospital Check programme. This will strengthen the experimental design by accounting for differences in food offerings and controlling for differences in the demographic profiles of patrons between sites.
Conclusions
To our knowledge, the current study is the first to examine the impact of nutrition labels at the point of sale in an actual food-service setting in Canada. It is unclear whether the differences in consumption between sites were due to differences in food selection, the presence of a comprehensive nutrition labelling programme or some combination of both of these factors; overall, however, the results are consistent with a positive impact of providing nutrition information at the point of sale. Future data collection waves will help to isolate differences due to nutrition labelling on menus using a pre–post comparison at the control cafeteria after changes are made to the nutrition information programme without substantial changes to the cafeteria environment or food selection.
Acknowledgements
Sources of funding: This research was supported by a grant entitled ‘Public health analysis of innovative cafeteria initiative at Ottawa Hospitals’ from the Public Health Agency of Canada. Additional support was provided by a Canadian Cancer Society Research Institute Junior Investigator Award (to D.H.), a Canadian Institutes for Health Research (CIHR) New Investigator Award (to D.H.), the Propel Centre for Population Health Impact (to D.H.), a Vanier Canada Graduate Scholarship (to L.V.), an Ontario Graduate Scholarship (to L.V.), a CIHR Master's Award (to L.V.) and a CIHR Training Grant in Population Intervention for Chronic Disease Prevention: A Pan-Canadian Program (Grant # 53893 to L.V.). Conflict of interest: The authors have no conflicts of interest to declare. Authors’ contributions: Both authors contributed to the conceptualization of the study, study design, analysis and writing of the manuscript. Acknowledgements: The authors would like to acknowledge the collaboration with The Ottawa Hospital and Frances Furmankiewicz. They would like to thank Ted Paluch and Janet Robinson for their assistance acquiring nutrition information for food items, and Samantha Daniel and Christine White for their administrative support.


