

Consumption of caffeinated energy drinks in the USA has been investigated as a public health concern because of its widespread prevalence and the potential for adverse events. The Substance Abuse and Mental Health Services Administration reported that the number of emergency-department visits involving energy drinks doubled from 10 068 visits in 2007 to 20 783 visits in 2011, with one in ten of those visits leading to hospitalization(1). A recent literature review found high percentages of serious outcomes among adolescent and young adult energy drink consumers(Reference Seifert, Schaechter and Hershorin2), especially among those with certain pre-existing conditions and those taking certain psychoactive medications.
At the US Food and Drug Administration’s (FDA) request, the Institute of Medicine held a workshop in 2013 to review evidence on safe levels of caffeine consumption in foods, beverages and dietary supplements, and to identify important data gaps(Reference Mattson3,4) . Noted gaps identified by the participating speakers included data on acute and chronic effects of combinations of ingredients found in energy drinks in addition to caffeine, valid assessment methods for consumption, systematic data collection to increase understanding of use over time, screening tools for physicians to collect data on caffeinated energy drink health effects and their magnitude, current data on energy drink usage among children and adolescents, and prospective research on long-term effects, particularly among vulnerable groups. Results from a recent International Life Sciences Institute-sponsored systematic review(Reference Wikoff, Welsh and Henderson5) did not find data challenging Canada’s safe caffeine consumption levels in healthy populations of ≤400 mg/d in adults, ≤300 mg/d in pregnant women and ≤2·5 mg/kg per d in children(Reference Nawrot, Jordan and Eastwood6). Because of limited data on child and adolescent sub-populations, however, the International Life Sciences Institute findings supported focusing in the future on better characterizing effects and factors that could pose greater risk among individuals in younger age groups, as well as in unhealthy and other sensitive populations(Reference Wikoff, Welsh and Henderson5).
Mixed findings have been reported regarding consumption prevalence in the USA(Reference Arria7–Reference Verster and Koenig15). A recent analysis of five National Health and Nutrition Examination Survey (NHANES) data cycles (2003–2012) found that <8 % of 13–29-year-olds in the USA consume caffeinated energy drinks(Reference Tran, Barraj and Bi14). While caffeine intake from energy drinks was observed to rise over the 10-year period, the increase reached statistical significance only among 18–24-year-olds and represented <9 % of total caffeine intake by 13–29-year-olds, with the rest from chocolate, coffee, tea and sodas(Reference Tran, Barraj and Bi14). Modelling results from the same study showed that caffeinated energy drinks replaced, rather than added to, total caffeine intake(Reference Tran, Barraj and Bi14), consistent with previous findings(Reference Branum, Rossen and Schoendorf9).
In contrast, data from longitudinal surveys of students suggest different consumption prevalence. The prospective longitudinal College Life Study (n 1253) indicated that young adults are consuming energy drinks in addition to, rather than instead of, traditional caffeinated beverages. Overall, 2·6 % reported use of energy drinks but no coffee, tea or soda, while 63 % reported use of both energy drinks and other types of caffeinated beverages(4,Reference Arria7) . Reasons for discrepancies in energy drink use estimates stem in part from data collection methods; while NHANES uses the 24 h dietary recall method with indirect questions about consumption(Reference Branum, Rossen and Schoendorf9–Reference Fulgoni, Keast and Lieberman11,Reference Tran, Barraj and Bi14) , different surveys from other studies ask about intake using a specified time frame(4,Reference Arria7,Reference Arria, Bugbee and Caldeira8,Reference Knapik, Austin and McGraw12,Reference Mitchell, Knight and Hockenberry13) .
In addition, young adults who consistently consumed more energy drinks were found more likely to have reported alcohol use disorder, as well as risky behaviours such as alcohol use, tobacco cigarette use, marijuana use, non-medical use of prescription stimulants, cocaine use and non-medical use of prescription analgesics, compared with those who consumed fewer or no energy drinks(Reference Arria, Caldeira and Bugbee16). A 2017 review by Dawodu and Cleaver also found that risky behaviours by teenagers were related to energy drink consumption(Reference Dawodu and Cleaver17). Findings from the 2011 Monitoring the Future (MTF) study showed that 35 % of eighth graders and 29 % of both tenth and twelfth graders reported consuming energy drinks(Reference Arria, Bugbee and Caldeira8). Also, 12, 9 and 10 % of eighth, tenth and twelfth graders, respectively, reported consuming energy shots (concentrated, small-volume energy drinks), with greater use among males than females(Reference Arria, Bugbee and Caldeira8). The highest racial/ethnic prevalence of both energy drink and shot use was seen among Hispanic eighth graders(Reference Arria, Bugbee and Caldeira8). In addition, sales of caffeinated energy drinks have been increasing. Retail scanner information from Information Resources, Inc. showed an increase in sales from $US 8·5 billion in 2011 to $US 11·6 billion in 2015, with unit sales rising from 3·1 billion in 2011 to 4·4 billion in 2015(18). Industry estimates released in 2013 projected that US sales would reach $US 21·5 billion in 2017(Reference Arria, Bugbee and Caldeira8,19) .
Given the increased consumption and sales of these drinks in recent years, especially in the context of the data gaps previously mentioned, we assessed adverse event reports and exposure call data related to intake of caffeinated energy drinks from two distinct data sources: the FDA Center for Food Safety and Applied Nutrition’s Adverse Event Reporting System (CAERS) and the American Association of Poison Control Centers’ National Poison Data System (NPDS). FDA’s CAERS collects data on adverse events reported by consumers, health professionals and industry indicating consumption or use of FDA-regulated products. The NPDS captures calls to poison control centres serving the USA for a variety of products. While these two systems differ in scope and size, they provide the opportunity to assess potential relationships between consumption of caffeinated energy drinks and adverse events. The objectives of these analyses include describing and comparing caffeinated energy drink adverse event report and exposure call data from CAERS and NPDS, respectively, as well as examining the strengths and limitations of these data sources.
Methods
Review by the institutional review board was not required for the present study because analysing adverse event data is considered a public health surveillance activity rather than human subjects research. The study sample from CAERS included case data from caffeinated energy drink adverse event reports submitted to the FDA during the years 2008 to 2015 by firms, consumers, health-care professionals, government agencies and others. The Dietary Supplement and Nonprescription Drug Consumer Protection Act (Public Law 109–462)(20) enacted in December 2007 defines serious adverse events as congenital anomaly, death, disability, hospitalization, life-threatening, requiring intervention to prevent permanent impairment, serious injury/illness and/or other serious. The law mandates that dietary supplement firms (manufacturers, packers and distributors) report serious adverse events to the FDA. CAERS receives adverse event reports from the fifty states and US territories through Medwatch(21) and the Safety Reporting Portal(22) via emails, telephone calls, faxes, letters and nationwide district offices of the FDA Office of Regulatory Affairs.
The study sample from the NPDS drew from caffeinated energy drink human exposure calls to fifty-seven participating poison centres for the same period. NPDS defines human exposure as ‘actual or suspected contact with any substance which has been ingested, inhaled, absorbed, applied to, or injected into a human’(23); calls that were only seeking information were excluded. The fifty-seven poison centres provide telephone consultation services to the entire population of the fifty US states, American Samoa, District of Columbia, Federated States of Micronesia, Guam, Puerto Rico and the US Virgin Islands(Reference Mowry, Spyker and Cantilena24).
In both databases, analyses were performed in two broad categories: exposure to single products and exposure to multiple products. The CAERS single product analysis included data from adverse event reports indicating a single energy drink or single brand of energy drink with caffeine only and/or caffeine plus other caffeine sources (such as guaraná, kola nut or yerba maté) as the sole product consumed (n 357). Ingredients were verified either by firm-provided labels accompanying the mandatory adverse event submissions, when available, or by nutrition or supplement facts labels from firm websites or the National Institutes of Health Dietary Supplement Label Database(25), found by searching names of products cited on submitted reports. Similarly, the NPDS single product analysis included exposure calls specifying a single energy drink or single brand of energy drink as the sole substance ingested (n 12 822). Calls in this group related to two NPDS energy drink category codes: caffeine only and caffeine plus other caffeine sources, such as guaraná, kola nut or yerba maté. Cases indicating co-exposure to alcohol were excluded from each data set prior to analyses.
For the NPDS single product data, we calculated exposure call ‘rates’ (as calls/state population × 100 000) using the US Census population estimate(26) for the mid-point of the study period (average of 2011 and 2012 estimates) in both individual states and the four US Census-defined regions, and generated a map (proc gmap) in the statistical software package SAS version 9.3. The CAERS data were too sparse to produce an informative map or geographic estimates.
In the multiple product analyses, we examined CAERS adverse event reports and NPDS exposure calls involving co-ingested products other than alcohol (such as multiple energy drink brands or other caffeine-containing products). The CAERS multiple product analyses included data from adverse event reports specifying intake of more than one single energy drink or single brand of energy drink (n 153). The NPDS multiple product analyses included data from exposure calls where two or more brands of energy drink products were ingested (n 931).
The extracted CAERS and NPDS data were analysed using Microsoft® Excel 2010 and SAS version 9.3. Cases and calls were excluded from the CAERS and NPDS analyses only if data for the specific variable(s) of interest were missing. Variables analysed in both data sets included age, sex, geographic location, product, single v. multiple product consumption, product name (only CAERS information is presented here), symptoms and outcomes. CAERS symptoms were coded using the Medical Dictionary for Regulatory Activities (MedDRA ® international medical terminology, developed under the auspices of the International Council for Harmonisation of Technical Requirements for Pharmaceuticals for Human Use)(27). NPDS collects over 130 clinical effects in the form of signs, symptoms, and laboratory or study abnormalities. CAERS outcomes included the serious (congenital anomaly, death, disability, hospitalization, life-threatening, requiring intervention to prevent permanent impairment, serious injury/illness, other serious), as well as the non-serious (emergency-room trip, health-care provider visit); one or more outcome(s) could be indicated on a single adverse event report. NPDS outcomes were categorized as moderate–major–death (MMD; i.e. ‘patient exhibited signs or symptoms as a result of the exposure that were more pronounced, more prolonged, or more systemic in nature than minor symptoms’, ‘patient exhibited signs or symptoms as a result of the exposure that were life-threatening or resulted in significant residual disability or disfigurement’ and ‘patient died as a result of the exposure or as a direct complication of the exposure’, respectively(Reference Mowry, Spyker and Brooks28)) v. non-MMD (‘not followed, with minimal clinical effects possible’, ‘minor effect’, ‘no effect’). Intentionality (as intentional or non-intentional) was assessed only in the NPDS data.
Results
Data sources
CAERS and NPDS differ in multiple aspects, as presented in Table 1, which describes each data set and some of the general findings.
Comparison of CAERS and NPDS
CAERS, Center for Food Safety and Applied Nutrition Adverse Event Reporting System; NPDS, National Poison Data System.
* Only includes those with age data (n 12 470 for NPDS and n 210 for CAERS).
† Serious outcome, as defined by Public Law 109–462: congenital anomaly, death, disability, hospitalization, life-threatening, requiring intervention to prevent permanent impairment, serious injury/illness, other serious(20).
‡ Both mandatory and voluntary reports can be recorded in CAERS when an individual reports the same event on a voluntary basis that a dietary supplement firm reports under the mandatory requirement; reports for the same individual event are merged into a single report with information retained on report types submitted. Among 357 single product CAERS cases, 91 % indicated products labelled as dietary supplements and 9 % cited products labelled as conventional foods/drinks.
§ Each case may indicate >1 outcome.
║ Those without specific age or age category available.
Single product analyses
Reports/calls per year
For CAERS, there were 357 single product adverse event reports during the 2008 to 2015 period. Of that total, 201 (56·3 %) were mandatory (serious) only, 142 (39·8 %) were voluntary only and fourteen (3·9 %) were both mandatory and voluntary. During the peak year of 2012, ninety-six reports (26·9 %) were created in the system; since 2012, single energy drink/single brand adverse event reports have decreased annually, with sixty-eight, forty-two and eighteen reports entered into CAERS for 2013, 2014 and 2015, respectively (Fig. 1(a)).
(a) CAERS and (b) NPDS single energy drink product adverse event reports and exposure calls, by year, 2008–2015 (CAERS, Center for Food Safety and Applied Nutrition Adverse Event Reporting System; NPDS, National Poison Data System)
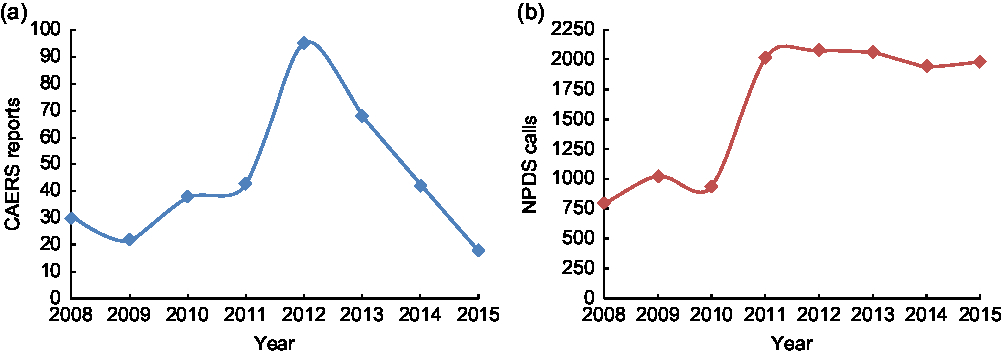
NPDS received 12 822 single caffeinated energy drink exposure calls during the same period, with 78·5 % of the calls occurring in the five most recent years of the period. The annual count of the single product exposure calls remained relatively steady from 2011 to 2015, with 1943 to 2071 calls per year, each representing 15·2 to 16·2 % of the total number of calls for the period (Fig. 1(b)).
Age
Among the 210 CAERS single product cases with age data, the median age was 31 years and the mean age was 33·8 years (sd = 16·6 years; minimum = 7 years; maximum = 88 years; n 210), with most of the adverse events reported among those between 10 and 39 years old.
For the 12 470 NPDS single product calls with age data, the mean was younger: 13·6 years (sd = 13·0 years; minimum = <1 month; maximum = 100 years). Children ≤5 years old accounted for 5297 (42·3 %) of the calls, and those aged 5 to <20 years accounted for 3418 (27·3 %). In addition, age was identified as ‘adult’ for 358 (2·9 %) and ‘paediatric’ for thirty-three (0·3 %), and it was missing for 352 (2·7 %) of the NPDS single product calls.
Sex
Among CAERS single product cases, 215 (60·2 %) were male. Similarly, males accounted for 7606 (59·3 %) of the NPDS single product exposure calls.
State/region
The CAERS single product cases represented thirty-seven states and Puerto Rico. States with the most reports were California (n 22, 6·2 %), Texas (n 19, 5·3 %), Ohio (n 15, 4·2 %) and Pennsylvania (n 12, 3·4 %). Among US Census-defined regions, distribution of the cases was heaviest in the South (n 72, 38 %) and lightest in the Northeast (n 28, 15 %). However, location data were missing for nearly half of the cases (n 167, 46·8 %).
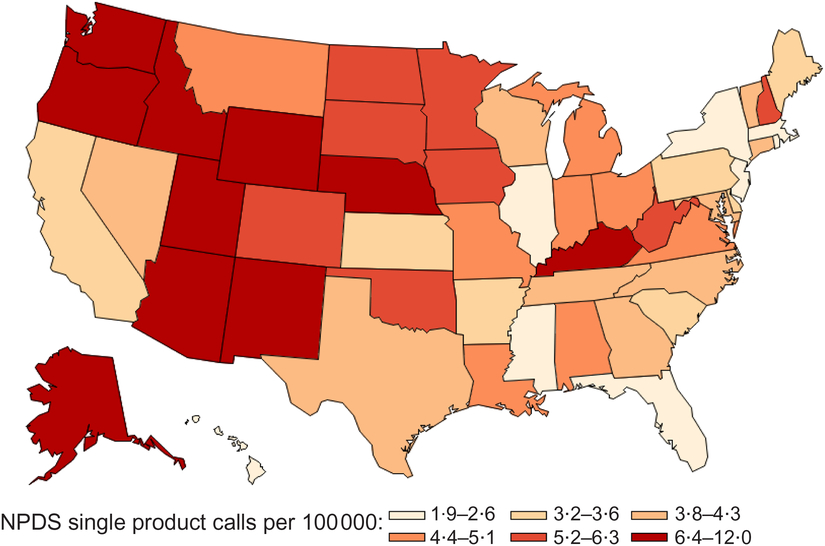
Among US Census-defined regions, NPDS single product exposure call density was highest in the Western region (5·0 calls per 100 000 population; Fig. 2). In the Midwest and South, call density was 4·2 and 4·0 per 100 000, respectively. The lowest call density occurred in the Northeast, with 2·9 calls per 100 000.
NPDS single energy drink product exposure calls by state per 100 000 population, 2008–2015 (NPDS, National Poison Data System)
Intentionality
CAERS data do not provide information on intentionality. Of the 12 437 NPDS single energy drink product exposure calls with intentionality and specified age data, 7455 (58·1 %) were unintentional. Among 5296 calls in the ≤5-year-old age group, 5254 (99·2 %) were unintentional, while 2178 (30·8 %) of the 7062 calls for those aged >5 years were unintentional. Non-paediatric (age ≥20 years), intentional calls accounted for 1434 (11·2 %) of the NPDS calls.
Product name
The CAERS single energy drink product adverse event reports cited a total of forty unique products. The top six most frequently specified products represented 313 (89 %) of the reports (Table 2). Among CAERS single product cases, 168 (47 %) noted 5-hour ENERGY®, sixty-nine (19 %) reported Monster® products, seventeen (5 %) indicated Spark®, fifteen (4 %) specified Red Bull®, and twelve (3 %) reported Redline® or Rockstar® products. The leading brands tended to be similar over time. Despite decreases in total calls for 2013 through 2015, the top brands were still more frequently indicated than others. Median age (years) for the most frequently cited products was 33 for 5-hour ENERGY®, 20·5 for Monster®, 29·5 for Red Bull®, 41 for Spark®, 18 for Redline® and 26 for Rockstar®. NPDS product names are not available for publishing.
CAERS most frequently cited energy drinks from single product adverse event reports, 2008–2015*
CAERS, Center for Food Safety and Applied Nutrition Adverse Event Reporting System; RTD, ready-to-drink.
* In compliance with US federal regulation 21 CFR 20.111(c)(3), this table does not include information from voluntary reports submitted by firms.
† Does not provide separate caffeine content from additional caffeine sources listed on label: yerba maté, green tea extract.
Outcome
More than half (55 %) of CAERS cases with serious adverse outcomes were indicated on the mandatory reports that dietary supplement firms submitted to the FDA. The remainder included serious (22 %) and non-serious (18 %) adverse outcomes submitted on voluntary reports by non-industry filers, as well as both mandatory and voluntary reports of serious outcomes (4 %) from both firms and non-industry filers. For each report, more than one outcome could be indicated. Among the single product cases, thirty-five deaths were reported (see online supplementary material). Of the remaining serious outcome reports, the single product energy drink adverse event reports most commonly indicated hospitalization (n 147, 41 %), other serious (n 127, 36 % and life-threatening events (n 52, 15 %). The most frequently cited non-serious outcomes were emergency-room visits, reported by nearly one-third, and health-care provider visits, noted by 15 %. The most commonly cited outcomes differed across age groups (Table 3) and across the top-specified energy drinks by report type (mandatory/voluntary) and product category (Tables 4 and 5). Among cases indicating intake of products with caffeine plus additional caffeine sources, those reported to have consumed energy drinks with caffeine plus guaraná had a higher proportion of hospitalization than other outcomes; however, an even greater percentage of consumers of caffeine-only products than consumers of caffeine plus guaraná products reported hospitalization, life-threatening and other serious events, and emergency-room and health-care provider visits (Table 5). There were no cases in the ≤5-year-old and only one case in the 5 to <10-year-old age groups.
CAERS single energy drink product reports by age group and most frequently cited outcome, 2008–2015*
CAERS, Center for Food Safety and Applied Nutrition Adverse Event Reporting System.
* Data shown only for those with age data and most frequently cited outcomes (N 237); percentages indicate proportion of cases (n) specifying each outcome by age group (years) or overall (N). Serious outcome, as defined by Public Law 109–462: congenital anomaly, death, disability, hospitalization, life-threatening, requiring intervention to prevent permanent impairment, serious injury/illness, other serious(20). Each case may cite one or more outcomes. Outcomes excluded because not among most frequently cited: ‘Congenital’, ‘Other’ and ‘None’.
CAERS, Center for Food Safety and Applied Nutrition Adverse Event Reporting System.
* In compliance with US federal regulation 21 CFR 20.111(c)(3), this table does not include information from voluntary reports submitted by firms.
† CAERS contains data from mandatory reports of serious events by dietary supplement firms; passive/voluntary reports of non-serious events by dietary supplement firms; passive/voluntary reports of serious and non-serious adverse event reports by non-dietary supplement firms, consumers and health professionals; and passive/voluntary reports for other foods and cosmetics.
‡ Serious outcome, as defined by Public Law 109–462: congenital anomaly, death, disability, hospitalization, life-threatening, requiring intervention to prevent permanent impairment, serious injury/illness, other serious(20).
CAERS single energy drink product reports by product category and most frequently cited outcome, 2008–2015*,†,‡,§
CAERS, Center for Food Safety and Applied Nutrition Adverse Event Reporting System.
* Caffeine-only products include 5-hour ENERGY®, Red Bull® and Spark®.
† Caffeine plus guaraná products include Monster® and Redline®. Native to South America, guaraná (scientific name Paullinia cupana) is a plant that produces fruits with seeds containing caffeine(Reference Rosenfeld, Mihalov and Carlson30).
‡ The χ 2 test indicated statistically significant differences at P < 0·05.
§ Serious outcome, as defined by Public Law 109–462: congenital anomaly, death, disability, hospitalization, life-threatening, requiring intervention to prevent permanent impairment, serious injury/illness, other serious(20).
NPDS single product exposure call outcomes were largely categorized as ‘not followed, with minimal clinical effects possible’ (n 4820, 37·6 %), ‘minor effect’ (n 2526, 19·7 %), ‘no effect’ (n 2092, 16·3 %), ‘moderate effect’ (n 1480, 11·5 %), ‘major effect’ (n 83, 0·6 %) or ‘death’ (n 2, >0·1 %), with the remainder in other categories (n 1819, 14·2 %). In contrast to CAERS, where 77 % of the reports indicated serious outcomes, including thirty-five deaths, NPDS major effect, moderate effect and death (MMD) outcomes accounted for only 12·2 % (n 1565) of the single exposure calls.
Symptoms
Among the 357 CAERS single product cases, nervous system disorders (39·5 %) was the most frequently reported symptom category, followed by general disorders and administration site conditions (29·4 %), gastrointestinal disorders (27·6 %), investigations (26·3 %), cardiac disorders (25·4 %), psychiatric disorders (17·0 %) and respiratory/thoracic/mediastinal disorders (17·0 %; Fig. 3(a)). These symptoms were cited by similar percentages of both sexes but differed across age groups. Symptoms in the nervous system, general disorders (such as tissue and body temperature issues), investigations (such as cardiac, metabolic and neurological tests), psychiatric and respiratory/thoracic/mediastinal categories were indicated more often by the CAERS cases who ingested products containing caffeine plus guaraná (such as Monster® and Redline®) than those who consumed products containing caffeine only (such as 5-hour ENERGY®, Red Bull® and Spark®). However, symptoms in the cardiac and gastrointestinal categories were reported more often by cases who consumed products containing caffeine only.
(a) Top ten symptoms from CAERS single energy drink product adverse event reports and (b) top signs/symptoms from NPDS single product exposure calls, 2008–2015. For CAERS single product adverse event reports, n 357, and CAERS cases could indicate one or more symptoms; for NPDS single product exposure calls, n 12 822, and NPDS calls could indicate multiple signs/symptoms or testing abnormalities (CAERS, Center for Food Safety and Applied Nutrition Adverse Event Reporting System; NPDS, National Poison Data System; GDASC, general disorders and administration site conditions)
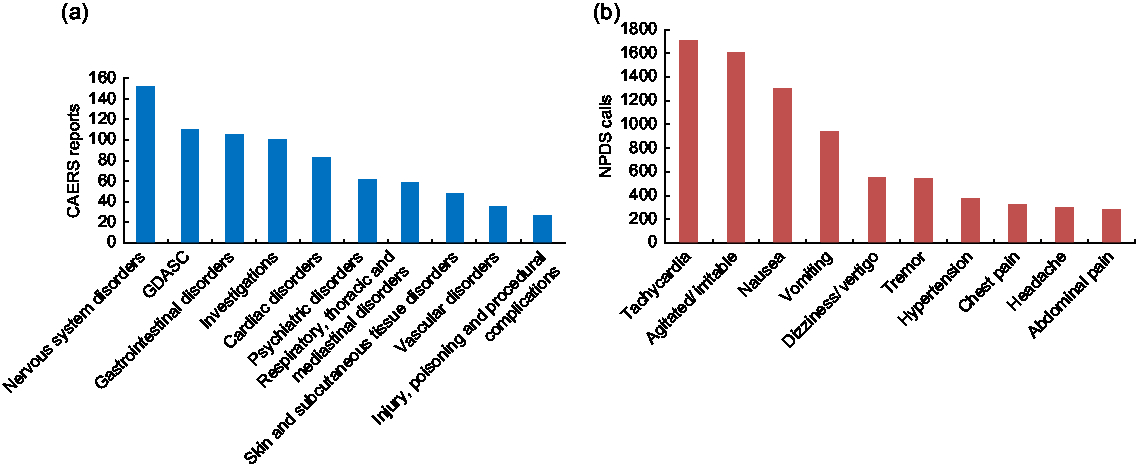
Among the NPDS cases, the most common effects involved the cardiovascular, central nervous and gastrointestinal systems (Fig. 3(b)). Tachycardia was involved in 1729 (14 %) of the NPDS single exposure calls, agitation in 1615 (13 %) and nausea in 1331 (10 %). Among the more serious related clinical effects were six calls with seizure(s), seventeen with coma and three with renal failure. The top five most common symptoms, in order, for males were tachycardia, agitation, nausea, vomiting and tremor. The order was the same as the top four for men, with dizziness ranking fifth, among women. The top five symptoms among calls for individuals ≤5 years old included agitation, headache, chest pain, dizziness and tachycardia. For those in the 10 to <30-year-old age group, the top five symptoms also included agitation, headache, chest pain and dizziness, as well as abdominal pain.
Multiple product analyses
Time and report type
Among the 153 CAERS multiple product cases from 2008 to 2015, 125 (81·7 %) were mandatory only, twenty-one (13·7 %) were voluntary only and seven (0·5 %) were both mandatory and voluntary. During the same period, there were 931 NPDS multiple product exposure calls, with the highest number of yearly calls occurring between 2011 and 2014 (range 140 to 160), dropping to 109 in 2015.
Age
The mean age among the 153 CAERS multiple product cases was 39·5 years (sd = 14·0 years; minimum = 11 years; maximum = 79 years; n 12, 7·8 % were missing age data), with many of the cases being reported among those aged 30 years or above (30 to <40 years old: n 37, 24·2 %; 40 to <50 years old: n 35, 22·9 %). In contrast, the mean age of the 931 NPDS calls was 22·3 years (sd = 8·7 years; minimum = 1·3 years; maximum = 77 years; n 53 (5·7 %) were missing age data). More than 80 % of the NPDS multiple exposure calls occurred among youth aged 10 to <30 years old (n 768).
Sex
More females (n 102, 66·7 %) than males were indicated on the CAERS multiple product reports. However, sex distribution was similar for the NPDS multiple (males: n 569, 61·1 %) and single product exposure calls.
State/region
Geographic distribution of multiple product CAERS reports and NPDS calls with available data were similar for single product cases. However, it should be noted that 115 (75·2 %) of the multiple product CAERS cases were missing geographic data, which were available for most NPDS exposure calls.
Intentionality
As noted above, intentionality data were not available for CAERS cases. Among NPDS multiple product calls, 607 (65·2 %) were intentional, and all intentional exposures occurred among age groups >9 years old. Non-paediatric (age ≥20 years), intentional calls accounted for 312 (33·5 %) of the NPDS calls.
Product name
Overall, the CAERS multiple product cases indicated a total of twenty-three unique energy drinks, with 5-hour ENERGY®, Advocare Spark®, Herbalife Herbal Tea® and Herbalife NRG Nature’s Raw Guarana Tea® among the most frequently specified. Neither Herbalife product was included among the most commonly consumed by the CAERS single product cases. The median and mean ages were highest among those indicating Herbalife NRG® (51 and 48·5 years, respectively) and youngest among those citing Advocare Spark® (36 and 37·8 years, respectively). Distribution of the CAERS multiple product reports by year and by most frequently cited energy drink showed Advocare Spark® increasing since 2012 and outpacing other products indicated on multiple product reports in subsequent years.
The 931 NPDS multiple product calls identified forty-three unique products, with 579 (62·2 %) indicating three energy drinks and forty-four (4·7 %) citing four or more.
Outcome
Three deaths were reported among the 153 CAERS multiple product cases. Other outcomes were similar to findings among the single product cases, except that a higher proportion of males (34/48, 71 %) v. females (59/102, 58 %) reported hospitalization, more males indicated life-threatening events, and more females than males specified health-care provider visits. The majority of the multiple product call outcomes was ‘not followed’ (n 270, 29·0 %), ‘minor effect’ (n 237, 25·5 %) or ‘moderate effect’ (n 238, 25·6 %). There were nine major medical outcomes and no deaths reported.
Symptoms
Hepatobiliary (16 v. 11; 10 % v. 3 %) and musculoskeletal/connective tissue disorders (14 v. 21; 9 % v. 6 %) were indicated more frequently by CAERS multiple than single product cases. Distribution among the most frequently cited symptoms differed by age group and sex. Lower proportions of females than males indicated nervous system disorders (33 v. 24; 32 % v. 50 %) and investigations (29 v. 19; 28 % v. 40 %), but more females than males cited general (38 v. 16; 37 % v. 33 %), gastrointestinal (33 v. 11; 32 % v. 23 %), and skin and subcutaneous tissue disorders (28 v. 8; 27 % v. 17 %). The NPDS multiple product call symptoms included tachycardia (30·6 %), vomiting (17·3 %), tremor (11·7 %), agitation (23·0 %) and nausea (25·3 %) more often than single product calls.
Summary of single and multiple product findings
Differences were found among single and multiple product analyses, both in CAERS and NPDS (Table 6). Overall, multiple product consumers were older than single product consumers in both databases. In CAERS, most multiple product consumers were female, but this was not the case with NPDS. More deaths were indicated on single (n 35/357) v. multiple product (n 3/153) CAERS reports (online supplementary material). Higher proportions of life-threatening events were also cited on the CAERS single v. multiple product reports; however, hospitalization and other serious events were reported more often among the multiple v. single product cases. In NPDS, multiple product calls were much less likely than single calls to involve children aged ≤5 years old and much more likely to be intentional. More MMD outcomes were reported among both single and multiple product calls among those >5 years v. those ≤5 years old. In CAERS, the most commonly cited symptoms were similar in both single and multiple product groups, except for higher proportions of cardiac symptoms among the single product cases and hepatobiliary and skin/subcutaneous tissue disorders among the multiple product cases. The most common symptoms were similar among both the single and multiple product calls in NPDS, but the prevalence of certain symptoms such as agitation and tremor was much higher in multiple product calls than in single product calls.
Summary of single and multiple product CAERS adverse event reports and NPDS exposure calls indicating energy drinks, 2008–2015*
CAERS, Center for Food Safety and Applied Nutrition Adverse Event Reporting System; NPDS, National Poison Data System.
* Intentionality is not an available data field in CAERS.
† Missing age data for n 147 (41.2 %).
‡ Missing age data for n 12 (7.8 %).
§ Missing age data for n 645 (5.0 %).
║ Missing age data for n 53 (5.7 %).
¶ Serious outcome, as defined by Public Law 109–462: congenital anomaly, death, disability, hospitalization, life-threatening, requiring intervention to prevent permanent impairment, serious injury/illness, other serious(20).
** MMD, major effect, moderate effect and death (among only those with specific ages available; n 12 384).
Discussion
For NPDS exposure calls between 2010 and 2011, we observed an increase that was sustained through 2015, with nearly 80 % occurring during the last 5 years of the study period. More than half were unintentional, driven by the ≤5-year-old age group, whereas exposure calls involving older individuals were much more likely to be intentional. The calls were distributed at a disproportionately higher density per 100 000 population in the US Census-defined Western region. The outcomes were generally not severe and the most common symptoms included tachycardia, agitation, nausea, vomiting and dizziness.
However, the CAERS single product cases were typically older than the individuals indicated in NPDS exposure calls (Table 6) and more frequently indicated serious symptoms, including nervous system, gastrointestinal, cardiac, psychiatric and respiratory disorders, as well as deaths. Of the thirty-eight deaths (thirty-five single and three multiple product), exposures to energy drinks were noted among eight (21·1 %) who may have had other causes of death based on the information in the reports, such as motor vehicle accidents, suicide, acute respiratory failure and consumption of other substances. Six deaths (15·8 %) with low-dose (≤400 mg) caffeine exposures from energy drinks reportedly ingested ≤1 energy drink with ≤200 mg of caffeine. Chronic energy drink exposure was indicated on reports for five (13·2 %) other fatalities, but for these cases, it was unclear if an acute energy drink exposure triggered death. Seven cases (18·4 %) reportedly had high-dose (>400 mg) caffeine exposure from energy drinks; the dose and role of energy drinks in the deaths have been disputed. For twelve (31·6 %), there was insufficient information available on exposure and/or cause of death. Except for the six cases (15·8 %) with autopsies, there was insufficient medical information and evidence beyond the adverse event reports to link energy drink consumption to deaths (online supplementary material).
Changes in designation of energy drink products made by the manufacturers themselves, such as with Rockstar® and Monster® in 2013(Reference Meier29), from dietary supplements to conventional foods/beverages subject to different regulatory requirements(Reference Rosenfeld, Mihalov and Carlson30), may have contributed somewhat to the capture of fewer CAERS energy drink adverse events in the later years of the study period. However, voluntary reports decreased after 2012, as well.
As a passive surveillance system, CAERS captures voluntary as well as mandatory adverse event reports; although the system collects mandatory reports of serious events from dietary supplement firms, the firms first must be informed of such events by consumers, health-care providers and/or others for whom reporting is voluntary. The CAERS adverse event capture rate is estimated at ∼1·0 to 2·0 %(Reference Walker31–Reference Timbo, Chirtel and Ihrie33). Such under-reporting is consistent with findings from Arria et al.(4,Reference Arria7,Reference Arria, Bugbee and Caldeira8,Reference Arria, Caldeira and Kaperski34) showing that prevalence of energy drink use among adolescent and college students is greater than previous estimates suggest. The system’s capture of mandatory serious adverse event reports from dietary supplement firms raises the potential issue of bias towards more serious outcomes.
Although trained professionals enter NPDS call data, misclassification may have occurred because of misreporting by callers or other sources of human error. More severe exposures may result in interaction with emergency services or a health-care provider without poison centre involvement. Younger patients, especially those ≤5 years old, may be over-represented because of calls generated by concerned parents or caregivers. Phone data gathering can be a limiting factor on its own, because the phone number for poison control centres might not be available to everyone, and gathering data can be affected by the quality of the phone call and the understanding of the conversation by both caller and poison specialist.
In both sources, data may have been inaccurately coded, miscategorized, or effects may be misattributed to co-ingestants during capture or entry. In addition, under- and/or over-reporting could have occurred. For example, marketing claims about the energy products may cause users to under-report adverse events. Users may perceive the adverse effects as expected ‘energizing’ effects and so choose not to report them. It is also possible that media coverage, including news of deaths, other serious outcomes, product warnings, alerts or recalls, may bias the data and trigger spikes in reporting. Furthermore, co-morbidity, co-consumption, physical activity and other individual data could be incomplete or not available in CAERS and/or NPDS, and temporal associations between product consumption and reported adverse events do not necessarily reflect causation(35). In addition, some formulations may have changed between the time of adverse event onset and the time when ingredient data were accessed from manufacturer websites and/or the National Institutes of Health Dietary Supplement Label Database(25). Finally, many of the reported products contain not just caffeine but other ingredients as well; the effects of, and/or interactions with, the combinations are not well understood and are recognized as a gap area needing further study(4).
Other systems with population representative data could complement the information from CAERS and NPDS while overcoming some of the limitations. For example, until recently, the Substance Abuse and Mental Health Services Administration’s Drug Abuse Warning Network (DAWN) collected US-representative data from hospital emergency-room visits, including on energy drink adverse events. Although DAWN experienced a gap in operations, the Substance Abuse and Mental Health Services Administration has indicated that data collection will resume in 2019(36).
Conclusions
Despite the limitations of the CAERS adverse event report and NPDS exposure call data, each source contributes important post-market surveillance information. The data can help to inform the FDA’s continuing efforts to improve understanding of potential public health concerns, especially among age groups with the highest percentages of serious reported outcomes. The data from CAERS and NPDS may also help to inform FDA’s decision making, as well as consumer outreach/education efforts specific to the vulnerable identified age groups. Publicizing the CAERS and NPDS surveillance systems, along with the resumption of DAWN, and promoting greater reporting, will contribute to improving surveillance and strengthening public health efforts.
Acknowledgements
Acknowledgements: The authors thank Debra A. Street, PhD, and Karl C. Klontz, MD, MPH, for their essential contributions to the early development of this work. They thank Robin A. McKinnon, PhD, MPA, for her insightful suggestions and improvements to the manuscript. Financial support: This research received no specific grant from any funding agency in the public, commercial or not-for-profit sectors. This study used data from the US Food and Drug Administration (FDA) Center for Food Safety and Applied Nutrition’s Adverse Event Reporting System (CAERS), which contains information on adverse event and product complaint reports submitted to the US FDA for foods, dietary supplements and cosmetics (https://www.fda.gov/Food/ComplianceEnforcement/ucm494015.htm). In CAERS, adverse events are coded to terms in the Medical Dictionary for Regulatory Activities (MedDRA ®) terminology. The MedDRA ® trademark is registered by the International Federation of Pharmaceutical Manufacturers and Associations on behalf of the International Council for Harmonisation. Disclaimer: This report presents results of descriptive analyses of adverse event data; it does not and should not be construed to represent any agency determination or policy. Conflict of interest: None. Authorship: A.O.M.’s roles included formulating the research question, designing the study, conducting analyses, and writing and revising the manuscript. O.E.J.’s roles included conducting analyses, as well as writing and revising the manuscript. C.M.P.’s roles included conducting analyses, as well as writing and revising the manuscript. P.L.’s roles included formulating the research question, designing the study, and revising the manuscript. B.W.’s roles included formulating the research question, designing the study, conducting analyses, and writing and revising the manuscript. Ethics of human subject participation: Review by the institutional review board was not required for this study because analysing adverse event data is considered a public health surveillance activity rather than human subjects research.
Supplementary material
To view supplementary material for this article, please visit https://doi.org/10.1017/S1368980019001605


