


Depression is a prevalent and debilitating affective disorder characterised by persistent sadness and anhedonia(Reference Barnett1). As a leading risk factor for suicide, depression is recognised globally as a significant impediment to both mental and physical well-being(Reference McCarron, Shapiro and Rawles2). According to recent WHO estimates, depression affects approximately 5 % of adults worldwide, with a disproportionate impact on women(Reference Santomauro, Herrera and Shadid3,Reference Malhi and Mann4) . The COVID-19 pandemic has further exacerbated this burden, with an estimated 27·6 % increase in major depressive disorder cases globally(Reference Santomauro, Herrera and Shadid3). Given depression’s substantial contribution to the global burden of disease, investigating both risk factors and preventive strategies remains imperative.
While pharmacological interventions remain the mainstay of treatment, conventional antidepressants are frequently associated with adverse effects that limit adherence and efficacy(Reference Cipriani, Furukawa and Salanti5). Consequently, research interest has increasingly focused on the potential role of nutritional factors in both the pathogenesis and management of depressive disorders(Reference Adan, van der Beek and Buitelaar6,Reference Marx, Lane and Hockey7) . Vitamin B6, an essential water-soluble nutrient, comprises a family of six compounds, with pyridoxal-5-phosphate (PLP) representing the predominant biologically active form in plasma(Reference Stach, Stach and Augoff8). PLP functions as a critical cofactor in numerous enzymatic reactions implicated in depression pathophysiology, including the clearance of reactive oxygen species, homocysteine metabolism and the synthesis of neurotransmitters such as serotonin, dopamine and γ-aminobutyric acid (GABA)(Reference Ueland, McCann, Midttun and Ulvik9). 4-Pyridoxic acid (PA), the principal catabolite of vitamin B6, is readily detectable in plasma and has been extensively validated as a reliable biomarker for comprehensive assessment of vitamin B6 status in clinical settings(Reference Ueland, Ulvik and Rios-Avila10). The measurement of PA, particularly in conjunction with PLP levels, provides valuable insights into vitamin B6 metabolism and turnover, which may have implications for understanding its role in neuropsychiatric conditions.
However, studies examining the relationship between vitamin B6 and depression have yielded inconsistent findings. A cross-sectional cohort study of community-dwelling older adults in Ireland demonstrated that individuals in the lowest quintile of serum PLP had elevated depression risk(Reference Moore, Hughes and Hoey11). Research among Iranian adults aged 18–69 years revealed that increased vitamin B6 intake correlated with reduced depression risk in women, but this association was absent in men(Reference Kafeshani, Feizi and Esmaillzadeh12). An intervention study reported that patients with depression had significantly lower plasma PLP concentrations but higher PA-based functional indices of vitamin B6 status compared with healthy controls(Reference Ryan, Allers and Harkin13). This pattern suggests increased utilisation and catabolism of vitamin B6 in depressive states, with PLP depletion accompanied by enhanced conversion to the excretion product PA. Conversely, an investigation of Hispanic elderly participants found no significant correlation between serum PLP and depression(Reference Merete, Falcon and Tucker14). These contradictory findings may stem from methodological differences, including variations in study populations, assessment tools for depression, analytical techniques for vitamin B6 metabolites and insufficient adjustment for confounding factors. Additionally, most previous research has focused on older populations and clinical cohorts rather than representative samples of the general adult population. Recently, Lu et al. reported that higher dietary vitamin B6 intake and higher plasma PLP quartiles were associated with a lower prevalence of depression in USA adults, with an approximately linear inverse dose–response relationship(Reference Lu, Mao and Tan15). Their study provides important population-based evidence linking vitamin B6 status to depression risk. However, that analysis did not evaluate circulating 4-pyridoxic acid (PA), a key catabolite of vitamin B6, nor did it characterise potential non-linear threshold effects for vitamin B6 metabolites. In addition to observational evidence, interventional data also support a potential causal role of vitamin B6 in mood regulation. A recent double-blind randomised controlled trial in young adults reported that 1 month of high-dose vitamin B6 supplementation (100 mg/day) reduced self-reported anxiety and showed a trend towards reduced depressive symptoms compared with placebo, consistent with a role of vitamin B6 in enhancing GABAergic inhibition(Reference Field, Cracknell and Eastwood16). Consequently, the broader pattern of vitamin B6 metabolism in relation to depression risk, particularly the role of PA, remains to be clarified.
Therefore, we aimed to investigate the association between serum PLP, PA and depression risk in a nationally representative sample of USA adults using The National Health and Nutrition Examination Survey (NHANES 2005–2010) data. By focusing on circulating vitamin B6 metabolites rather than dietary intake alone, we sought to complement and extend previous work by (1) jointly examining PLP and PA, (2) exploring potential dose–response relationships and (3) assessing effect modification across key demographic and clinical subgroups through stratified analyses.
Materials and methods
Study population
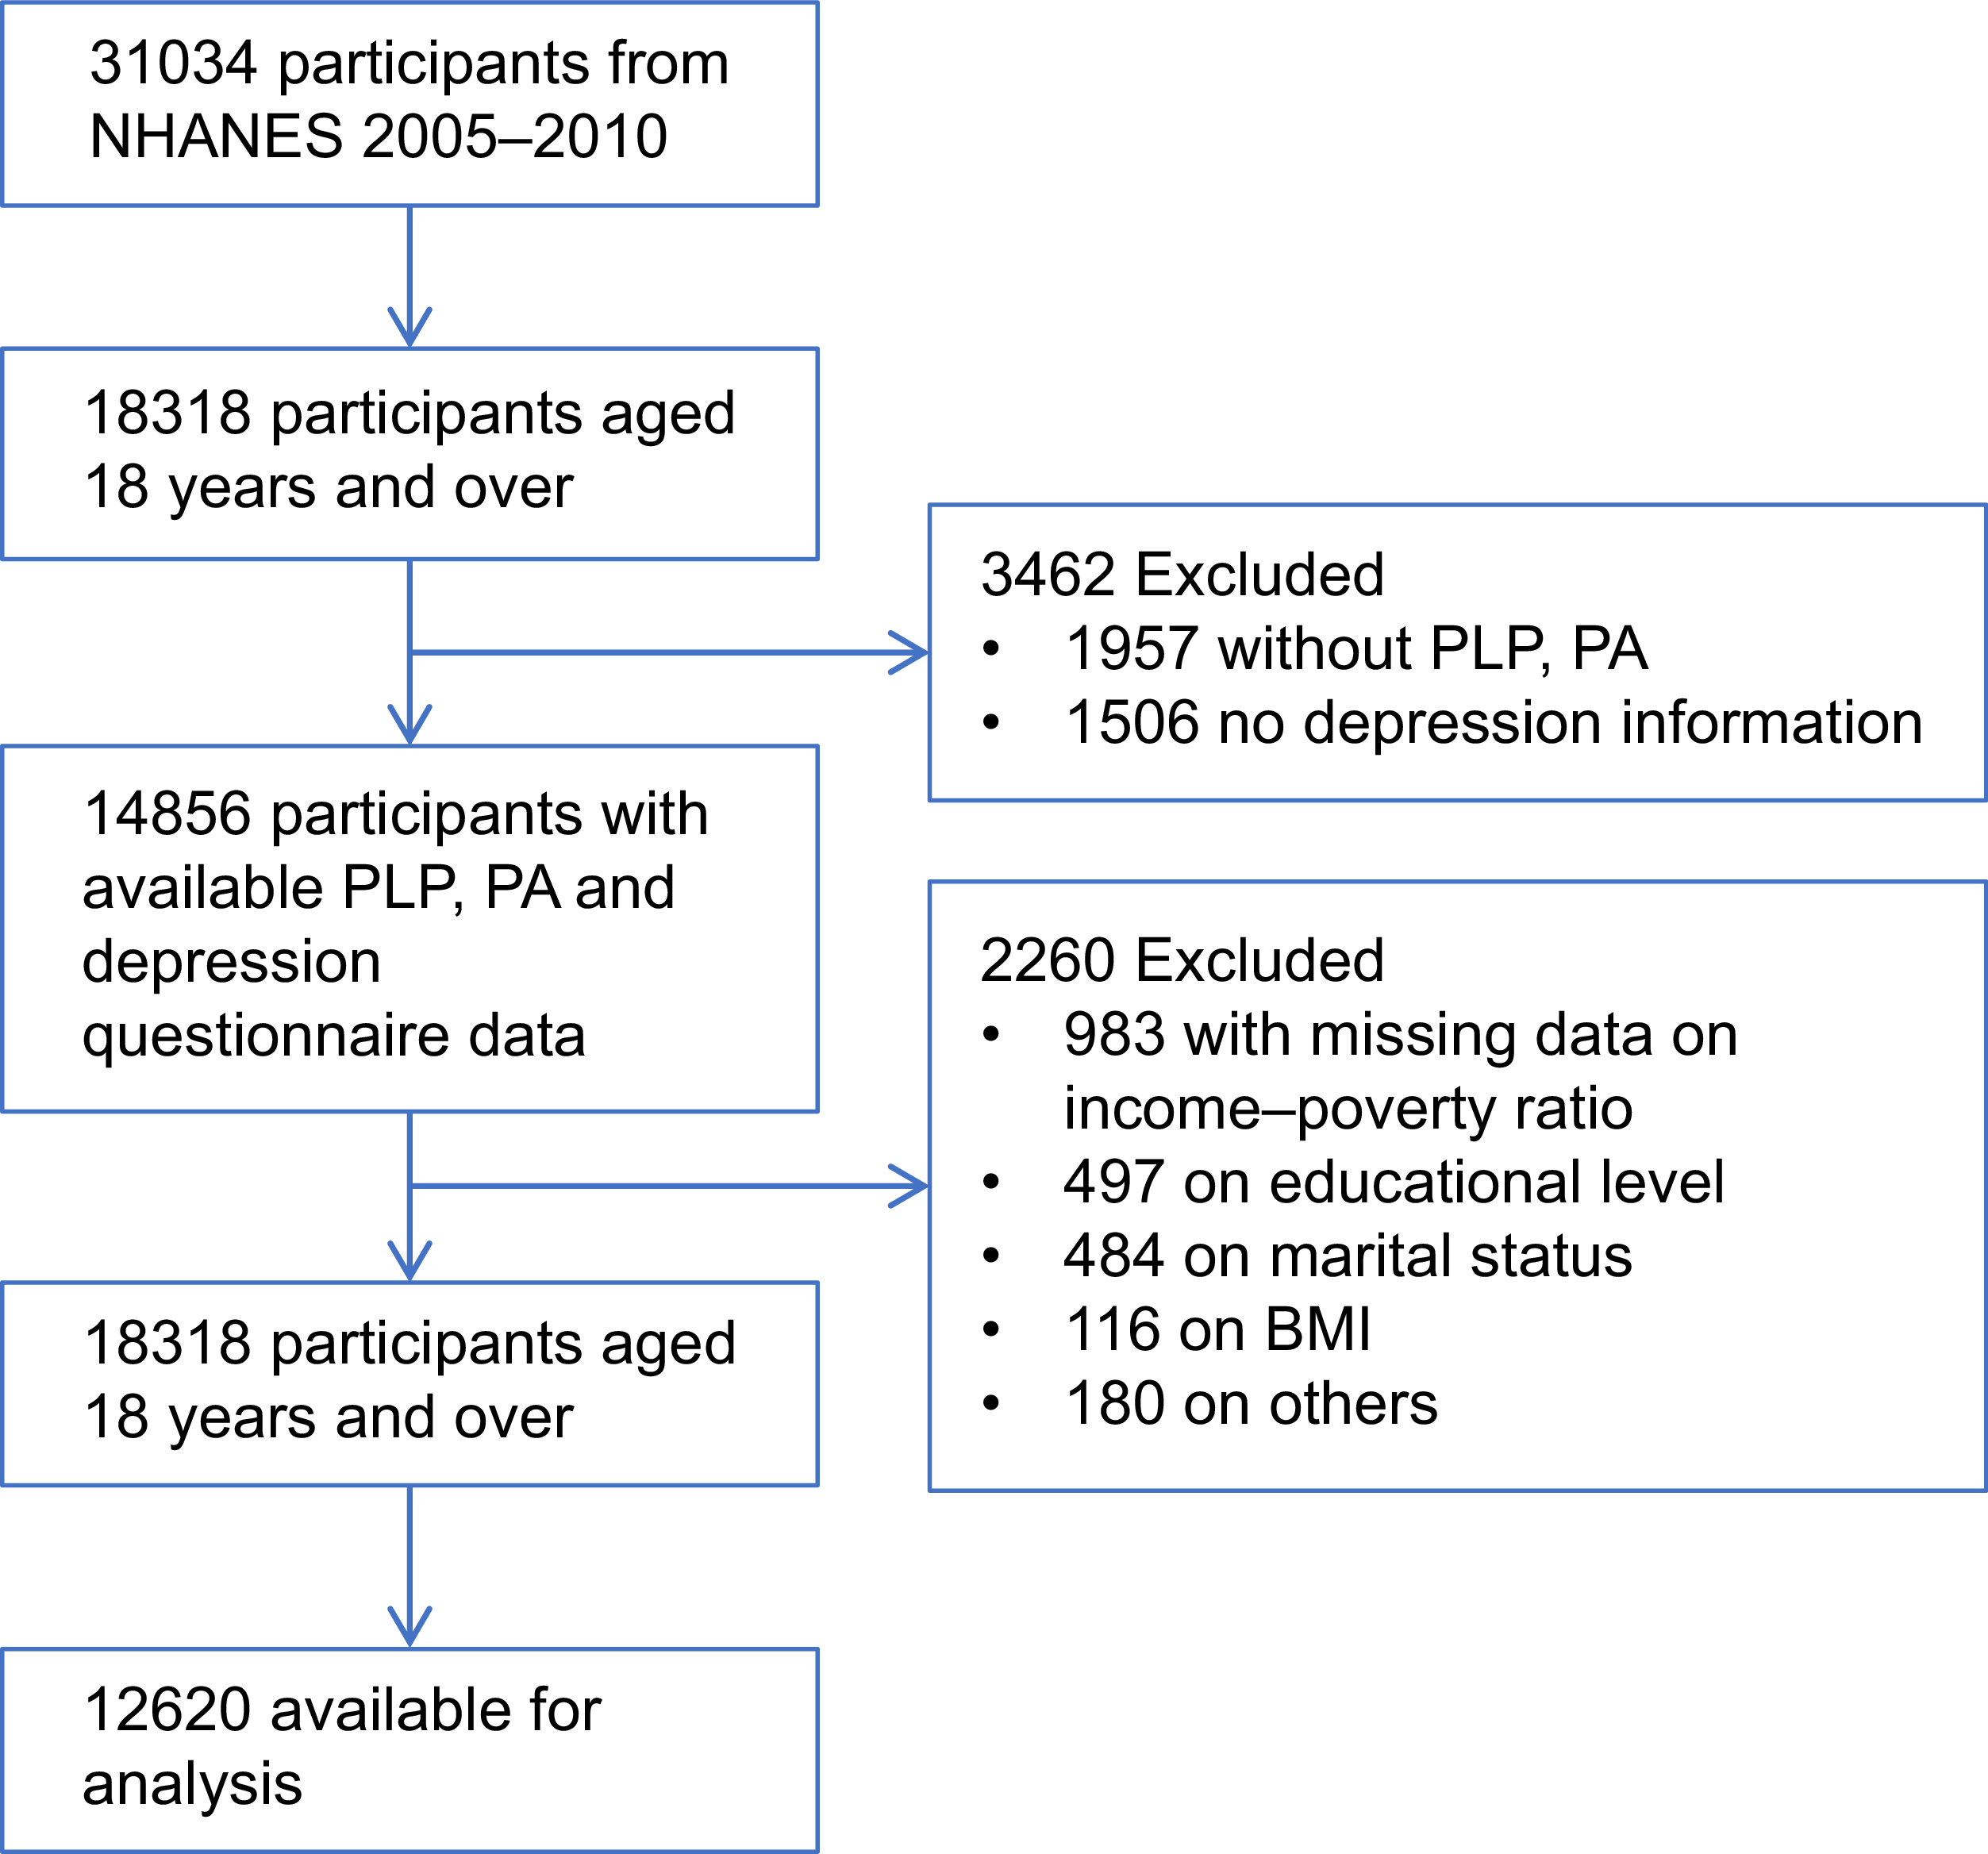
NHANES constitutes a comprehensive, nationally representative surveillance initiative aimed at assessing the health and nutritional status, both physical and psychological, of the non-institutionalised civilian population within the USA. This programme, operating under the ethical oversight of the National Center for Health Statistics Institutional Review Board, annually samples approximately 5000 individuals to ensure national representativeness. Data collection encompasses demographic, nutritional, laboratory and questionnaire-based information. Participants provide informed consent, and survey data are disseminated biennially basis(Reference Curtin, Mohadjer and Dohrmann17–Reference Mirel, Mohadjer and Dohrmann19). PLP and PA measurements were available through the 2009–2010 cycle, with consistent detection methodology employed from 2005 to 2010. For this analysis, we initially identified 31 034 participants from three consecutive cycles (NHANES 2005–2006, 2007–2008 and 2009–2010) to examine the association between vitamin B6 metabolites and depression. After excluding participants lacking PLP or PA measurements, Patient Health Questionnaire-9 (PHQ-9) data, those under 18 years of age and those with missing covariate information, the final analytical sample comprised 12 620 participants (Figure 1).
Flow chart of the population included in our study.

Depression assessment
Depression symptoms were evaluated using the PHQ-9, a validated self-report instrument comprising nine items based on depression diagnostic criteria from the American Psychiatric Association’s Diagnostic and Statistical Manual-IV(Reference Levis, Benedetti and Thombs20). Each PHQ-9 item utilises a four-point Likert scale ranging from 0 (‘not at all’) to 3 (‘nearly every day’), yielding a total score between 0 and 27. A PHQ-9 score ≥10 was designated as indicative of depression, consistent with established thresholds demonstrating 74 % sensitivity and 91 % specificity in primary care settings(Reference Arroll, Goodyear-Smith and Crengle21).
Measurement of vitamin B6 status
Vitamin B6 status was assessed using serum PLP, the biologically active coenzyme form and PA, the principal catabolic and urinary excretion product of vitamin B6 (in nmol/L). Both biomarkers were quantified using HPLC.(Reference Ueland, Ulvik and Rios-Avila10,Reference Pfeiffer, Lacher and Schleicher22) Comprehensive quality control procedures and detailed analytical protocols are documented in the Mobile Examination Center laboratory procedure manual available on the NHANES website(23).
Covariates
Based on established literature and clinical relevance, we incorporated multiple covariates including age, gender, race, marital status, education level, poverty–income ratio, physical activity, BMI, estimated glomerular filtration rate (eGFR), alcohol consumption, smoking status and history of diabetes, hypertension and liver disease(Reference Wang, Huang and Xue24,Reference Zhang, Li and Lang25) . Racial/ethnic categories comprised non-Hispanic White, non-Hispanic Black, other Hispanic, Mexican American and other racial groups. Marital status was classified as partnered (married) or unpartnered (unmarried). Educational attainment was classified as less than high school completion v. high school graduation or higher. Poverty–income ratio was stratified into three tiers: <1·3, 1·3–3·49 and >3·5, with higher values indicating greater household income relative to the federal poverty threshold(Reference Jiang, Sun and Zhou26). Physical activity was defined as engagement in moderate or vigorous intensity exercise for ≥10 consecutive minutes outside of occupational or transportation contexts, while physical inactivity denoted <10 min of such activities(Reference Qi, Wang and Huang27). BMI was calculated as weight (kg) divided by height squared (m2). eGFR was derived using the Chronic Kidney Disease Epidemiology Collaboration creatinine equation(Reference Meeusen, Kasozi and Larson28). Smoking status was classified as non-smokers (<100 lifetime cigarettes) or smokers (≥100 lifetime cigarettes). Alcohol consumption was categorised as non-drinkers (<12 alcoholic beverages in the preceding year) or drinkers (≥12 alcoholic beverages in the preceding year). Diabetes was defined by self-reported physician diagnosis or current insulin use. Hypertension was determined by self-reported physician diagnosis or blood pressure measurements exceeding 140/90 mmHg. Liver disease history was ascertained through participant interviews.
Statistical analysis
This study adhered to STROBE guidelines. Statistical analyses were performed using R software (version 4.4.1) with statistical significance defined as a P value <0·05. Continuous variables were presented as mean ± s d or median with interquartile range (IQR), while categorical variables were expressed as frequencies and percentages. Specifically, vitamin B6 markers (PLP and PA) were presented as median (IQR) due to their skewed distributions, while other continuous variables (e.g., age and BMI) were presented as mean ± s d given their approximately normal distributions. Serum PLP and PA concentrations were categorised into quartiles, with the lowest quartile (Q1) serving as the reference group. The associations between serum vitamin B6 metabolites and depression risk were examined using multivariable logistic regression models, yielding OR with corresponding 95 % CI. Two sequential adjustment models were constructed: model 1 adjusted solely for age and gender, while model 2 for serum PLP incorporated additional adjustments for race, marital status, education level, poverty–income ratio, physical activity, BMI, alcohol consumption, smoking status and history of diabetes, hypertension and liver disease. For serum PA analyses, model 2 included all aforementioned covariates plus estimated glomerular filtration rate. We first calculated correlation coefficients to quantify the association between serum PLP and PA. To further examine whether PLP and PA contribute independently to depression risk, we conducted sensitivity analyses in which both metabolites were entered simultaneously as continuous predictors in the same multivariable logistic regression model. Potential non-linear dose–response relationships between PLP, PA and depression were explored using restricted cubic spline functions with four knots placed at the 5th, 35th, 65th and 95th percentiles of the metabolite distributions, with the median value used as the reference point. Non-linearity was assessed using likelihood ratio tests comparing models with and without the spline terms.
Results
Baseline characteristics of the study population
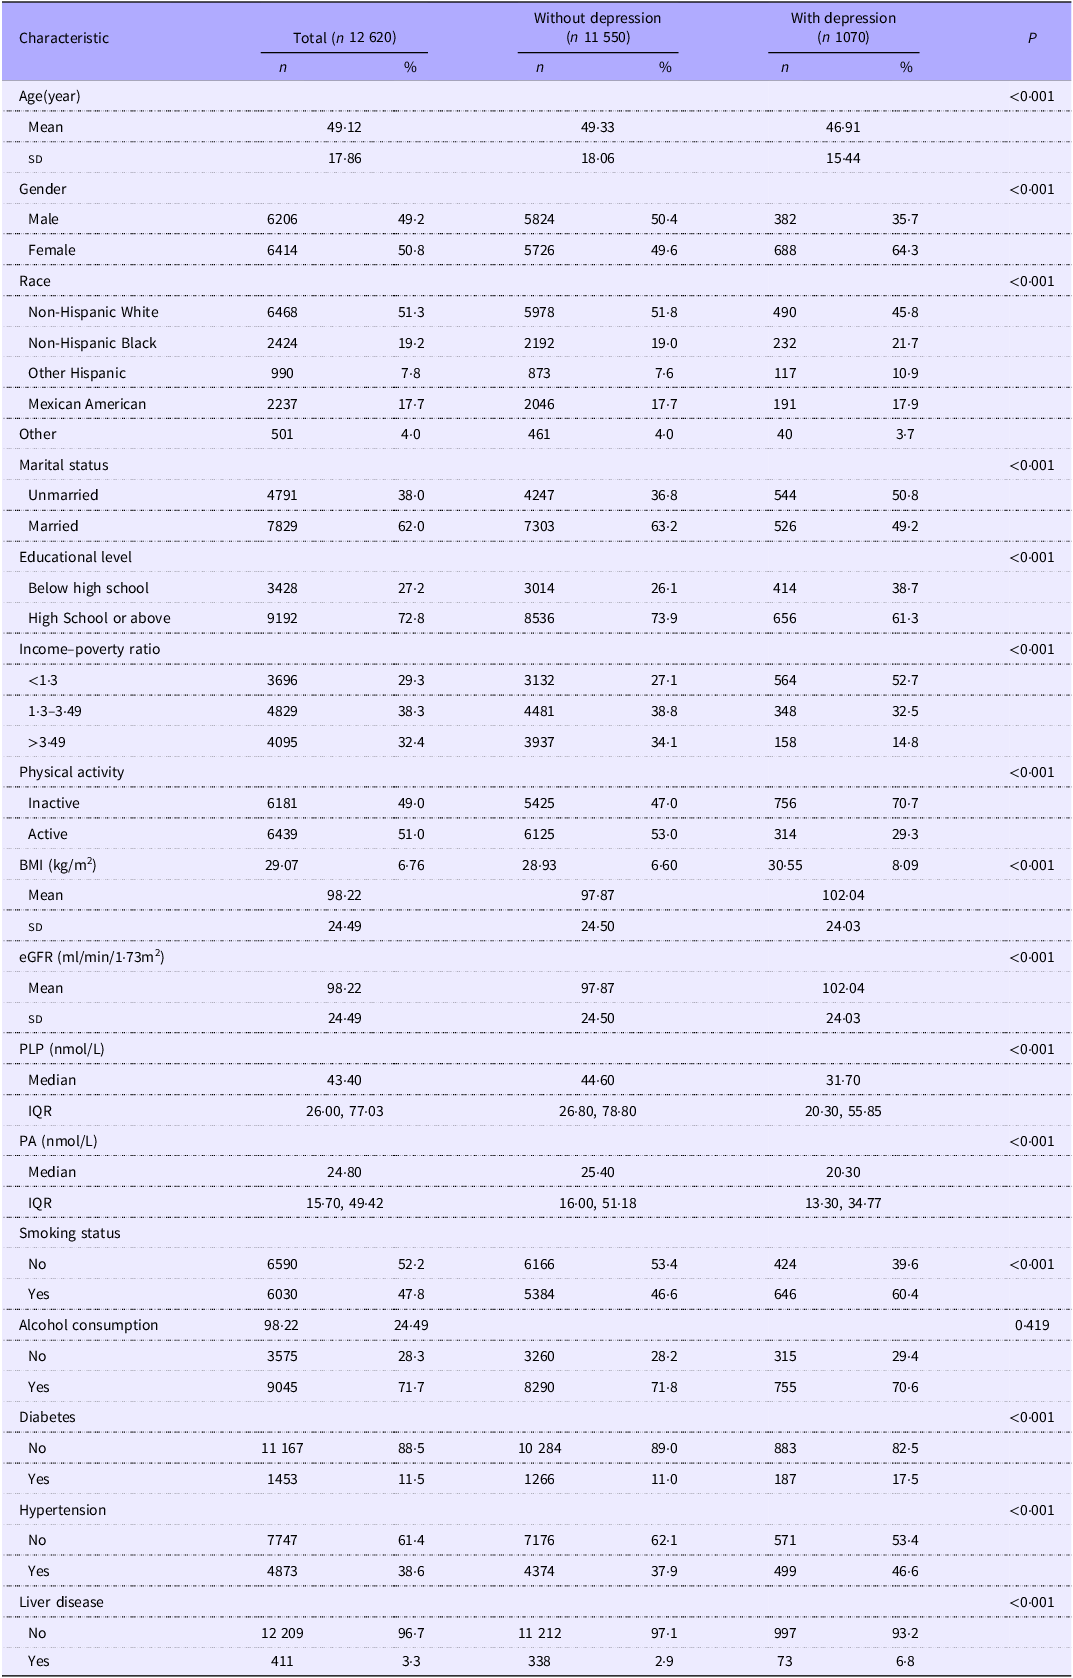
Of the 12 620 participants included in the analysis, 1070 (8·5 %) were classified as having depression based on PHQ-9 scores ≥10, while 11 550 (91·5 %) were classified as non-depressed. Individuals with depression exhibited lower serum concentrations of both vitamin B6 metabolites compared with their non-depressed counterparts. Specifically, median serum PLP in the depression group was 31·7 nmol/L (IQR: 20·3–55·85 nmol/L) v. 44·6 nmol/L (IQR: 26·8–77·8 nmol/L) in the non-depression group. Similarly, median serum PA was 20·3 nmol/L (IQR: 13·3–34·8 nmol/L) among depressed participants v. 25·4 nmol/L (IQR: 16·0–51·2 nmol/L) among non-depressed participants. Significant between-group differences were observed across multiple demographic and clinical characteristics, including age, gender, race, marital status, education level, poverty–income ratio, BMI, estimated glomerular filtration rate, smoking status and history of diabetes, hypertension and liver disease. Detailed baseline characteristics stratified by depression status are presented in Table 1.
Baseline characteristics of included participants (NHANES 2005–2010)

eGFR, estimated glomerular filtration rate; PLP, pyridoxal 5′-phosphate; IQR, interquartile range; PA, 4-pyridoxal acid.
Association between serum vitamin B6 metabolites and depression
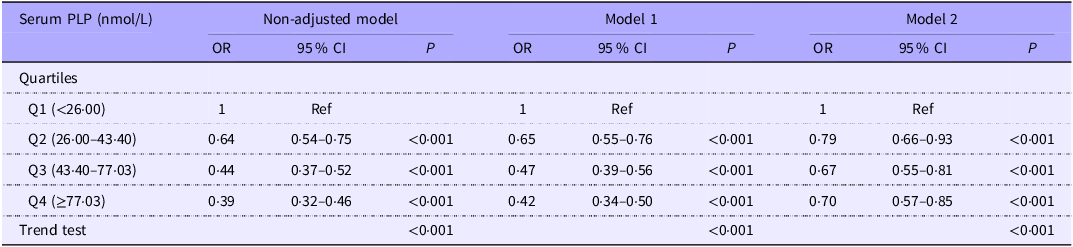
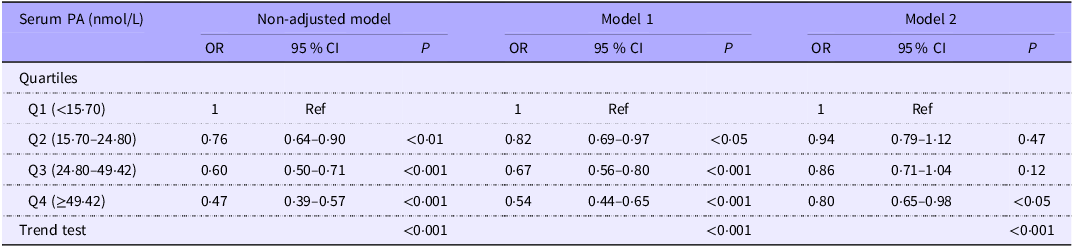
To elucidate the association between vitamin B6 metabolites and depression, we performed multivariable logistic regression analyses with serum PLP and PA categorised into quartiles. When examining serum PLP, participants in higher quartiles exhibited progressively lower odds of depression compared with those in the lowest quartile (Q1, <26·00 nmol/L). Specifically, the fully adjusted odds ratios for depression were 0·79 (95 % CI: 0·66–0·93, P < 0·001) for Q2 (26·00–43·40 nmol/L), 0·67 (95 % CI: 0·55–0·81, P < 0·001) for Q3 (43·40–77·03 nmol/L) and 0·70 (95 % CI: 0·57–0·85, P < 0·001) for Q4 (≥77·03 nmol/L), with a significant dose-response relationship (P-trend <0·001). This inverse association persisted across all adjustment models (Table 2). Similarly, serum PA demonstrated an inverse association with depression, though with attenuated statistical significance in middle quartiles. In the fully adjusted model (model 2), compared with participants in the lowest quartile (Q1 <15·70 nmol/L), those in Q2 (15·70–24·80 nmol/L), Q3 (24·80–49·42 nmol/L) and Q4 (≥49·42 nmol/L) demonstrated odds ratios of 0·94 (95 % CI: 0·79, 1·12, P = 0·47), 0·86 (95 % CI: 0·71, 1·04, P = 0·12) and 0·80 (95 % CI: 0·65, 0·98, P < 0·05), respectively, with a significant trend across quartiles (P-trend <0·001) (Table 3).
Association between serum PLP and depression

PLP, pyridoxal 5′-phosphate.
Model 1 was adjusted for age and gender. Model 2 was adjusted for age, gender, race, marital status, education level, income–poverty ratio, physical activity, BMI, smoking status, alcohol consumption, diabetes, hypertension and liver disease. P for trend was calculated by assigning the median value to each quartile and treating it as a continuous variable in the logistic regression model.
Association between serum PA and depression

PA, 4-pyridoxic acid.
Model 1 was adjusted for age and gender. Model 2 was adjusted for age, gender, race, marital status, education level, income–poverty ratio, physical activity, BMI, eGFR,smoking status, alcohol consumption, diabetes, hypertension and liver disease. P for trend was calculated by assigning the median value to each quartile and treating it as a continuous variable in the logistic regression model.
Dose–response relationship
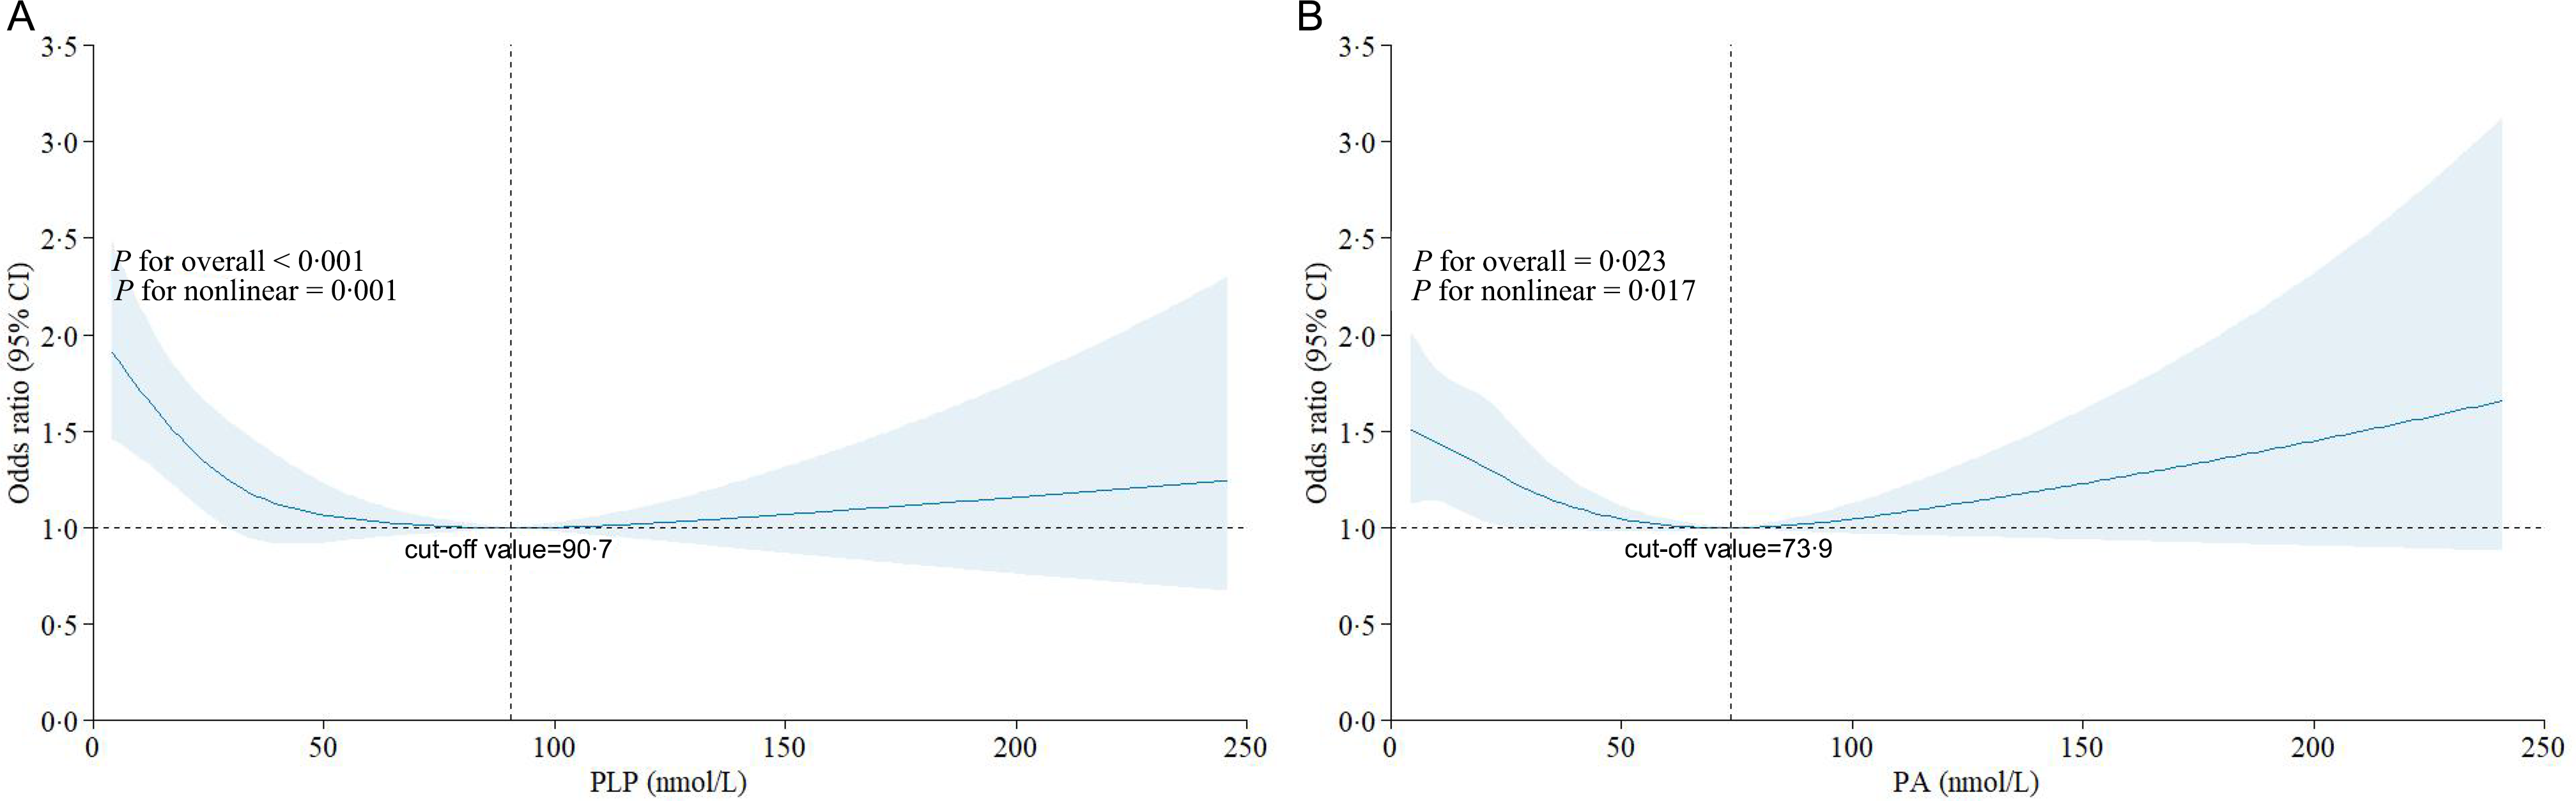
To assess potential non-linear relationships between vitamin B6 metabolites and depression, we employed restricted cubic spline modelling. The analysis revealed a significant non-linear association between serum PLP and depression risk (P for non-linearity = 0·001), characterised by a reversed L-shaped pattern. We identified an inflection point at 90·6 nmol/L that demarcated distinct relationships. At concentrations below this threshold, serum PLP demonstrated a significant inverse association with depression (OR = 0·992, 95 % CI: 0·988–0·996, P < 0·001), whereas no significant association was detected above this threshold (P = 0·353) (Figure 2a).
Association between serum PLP, PA and depression using a restricted cubic spline regression model. Figure 2A shows OR for depression according to serum PLP adjusted for age, gender, race, marital status, education level, income–poverty ratio, physical activity, BMI, alcohol consumption, smoking status, diabetes, hypertension and liver disease. Figure 2B shows OR for status according to PA adjusted for age, gender, race, marital status, education level, income–poverty ratio, physical activity, BMI, alcohol consumption, smoking status, diabetes, hypertension, liver disease and eGFR. Data were fitted by a logistic regression model, and the model was conducted with four knots at the 5th, 35th, 65th and 95th percentiles of serum PLP. Solid lines indicate OR, and shadow shape indicates 95 % CI. PA, 4-pyridoxic acid; PLP, pyridoxal 5′-phosphate.

For serum PA, we also observed a significant non-linear dose–response relationship with depression risk (P for non-linearity = 0·017), but with a distinct U-shaped pattern and an inflection point at 73·9 nmol/L. Below this concentration, serum PA exhibited an inverse association with depression (OR = 0·994, 95 % CI: 0·988–0·999, P < 0·05), analogous to the protective effect observed with PLP. However, at concentrations exceeding 73·9 nmol/L, serum PA demonstrated a positive association with depression risk (OR = 1·008, 95 % CI: 1·002–1·013, P < 0·01) (Figure 2b). Given that PA is the terminal excretion product of vitamin B6, these elevated concentrations are more likely to indicate a state of accelerated vitamin B6 turnover than a direct harmful effect of PA itself.
Because only a relatively small proportion of participants had metabolite concentrations above the spline-derived inflection points, particularly for PA, the majority of individuals in the top quartiles fell within the concentration range where the associations remained inverse. In our data, approximately 5 % of participants had PA levels above 73·9 nmol/L (data not shown). Consequently, the quartile-based logistic regression analyses primarily capture the overall decreasing risk pattern across the concentration range that includes most participants, whereas the RCS models, which exploit the full continuous information, are more sensitive to detecting the upturn in depression risk at the extreme upper tail of the PA distribution.
Subgroup analyses
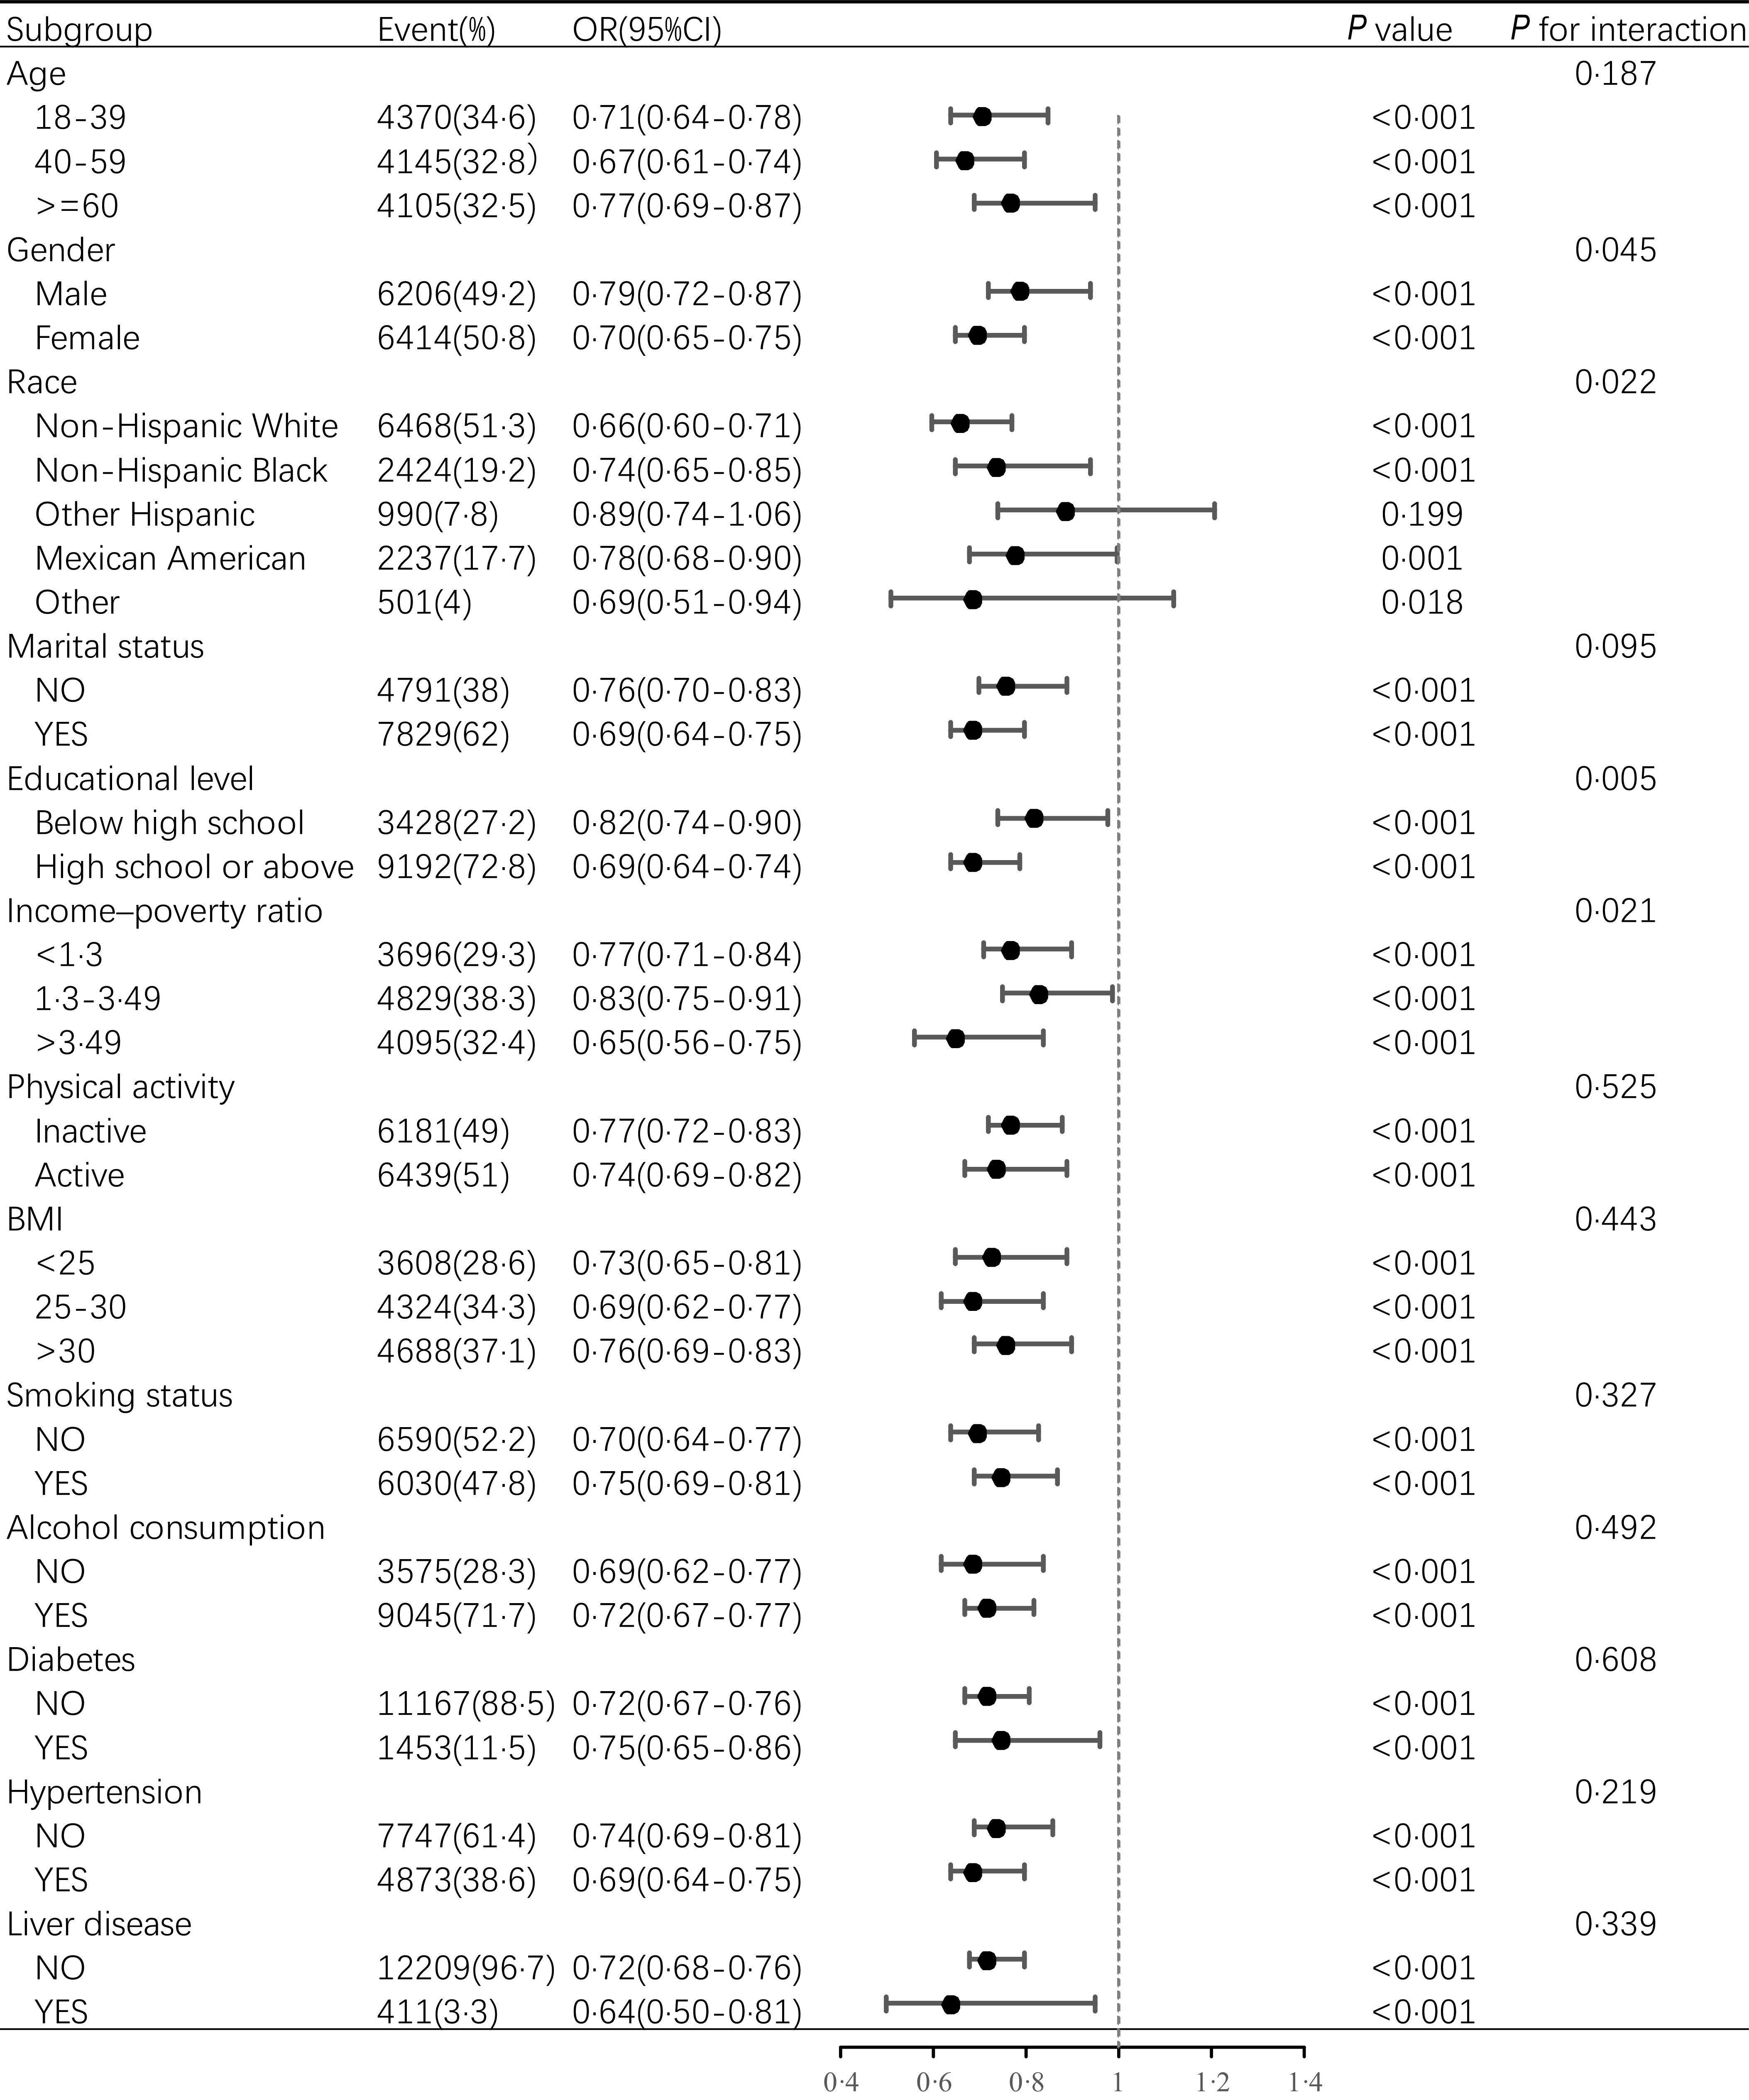
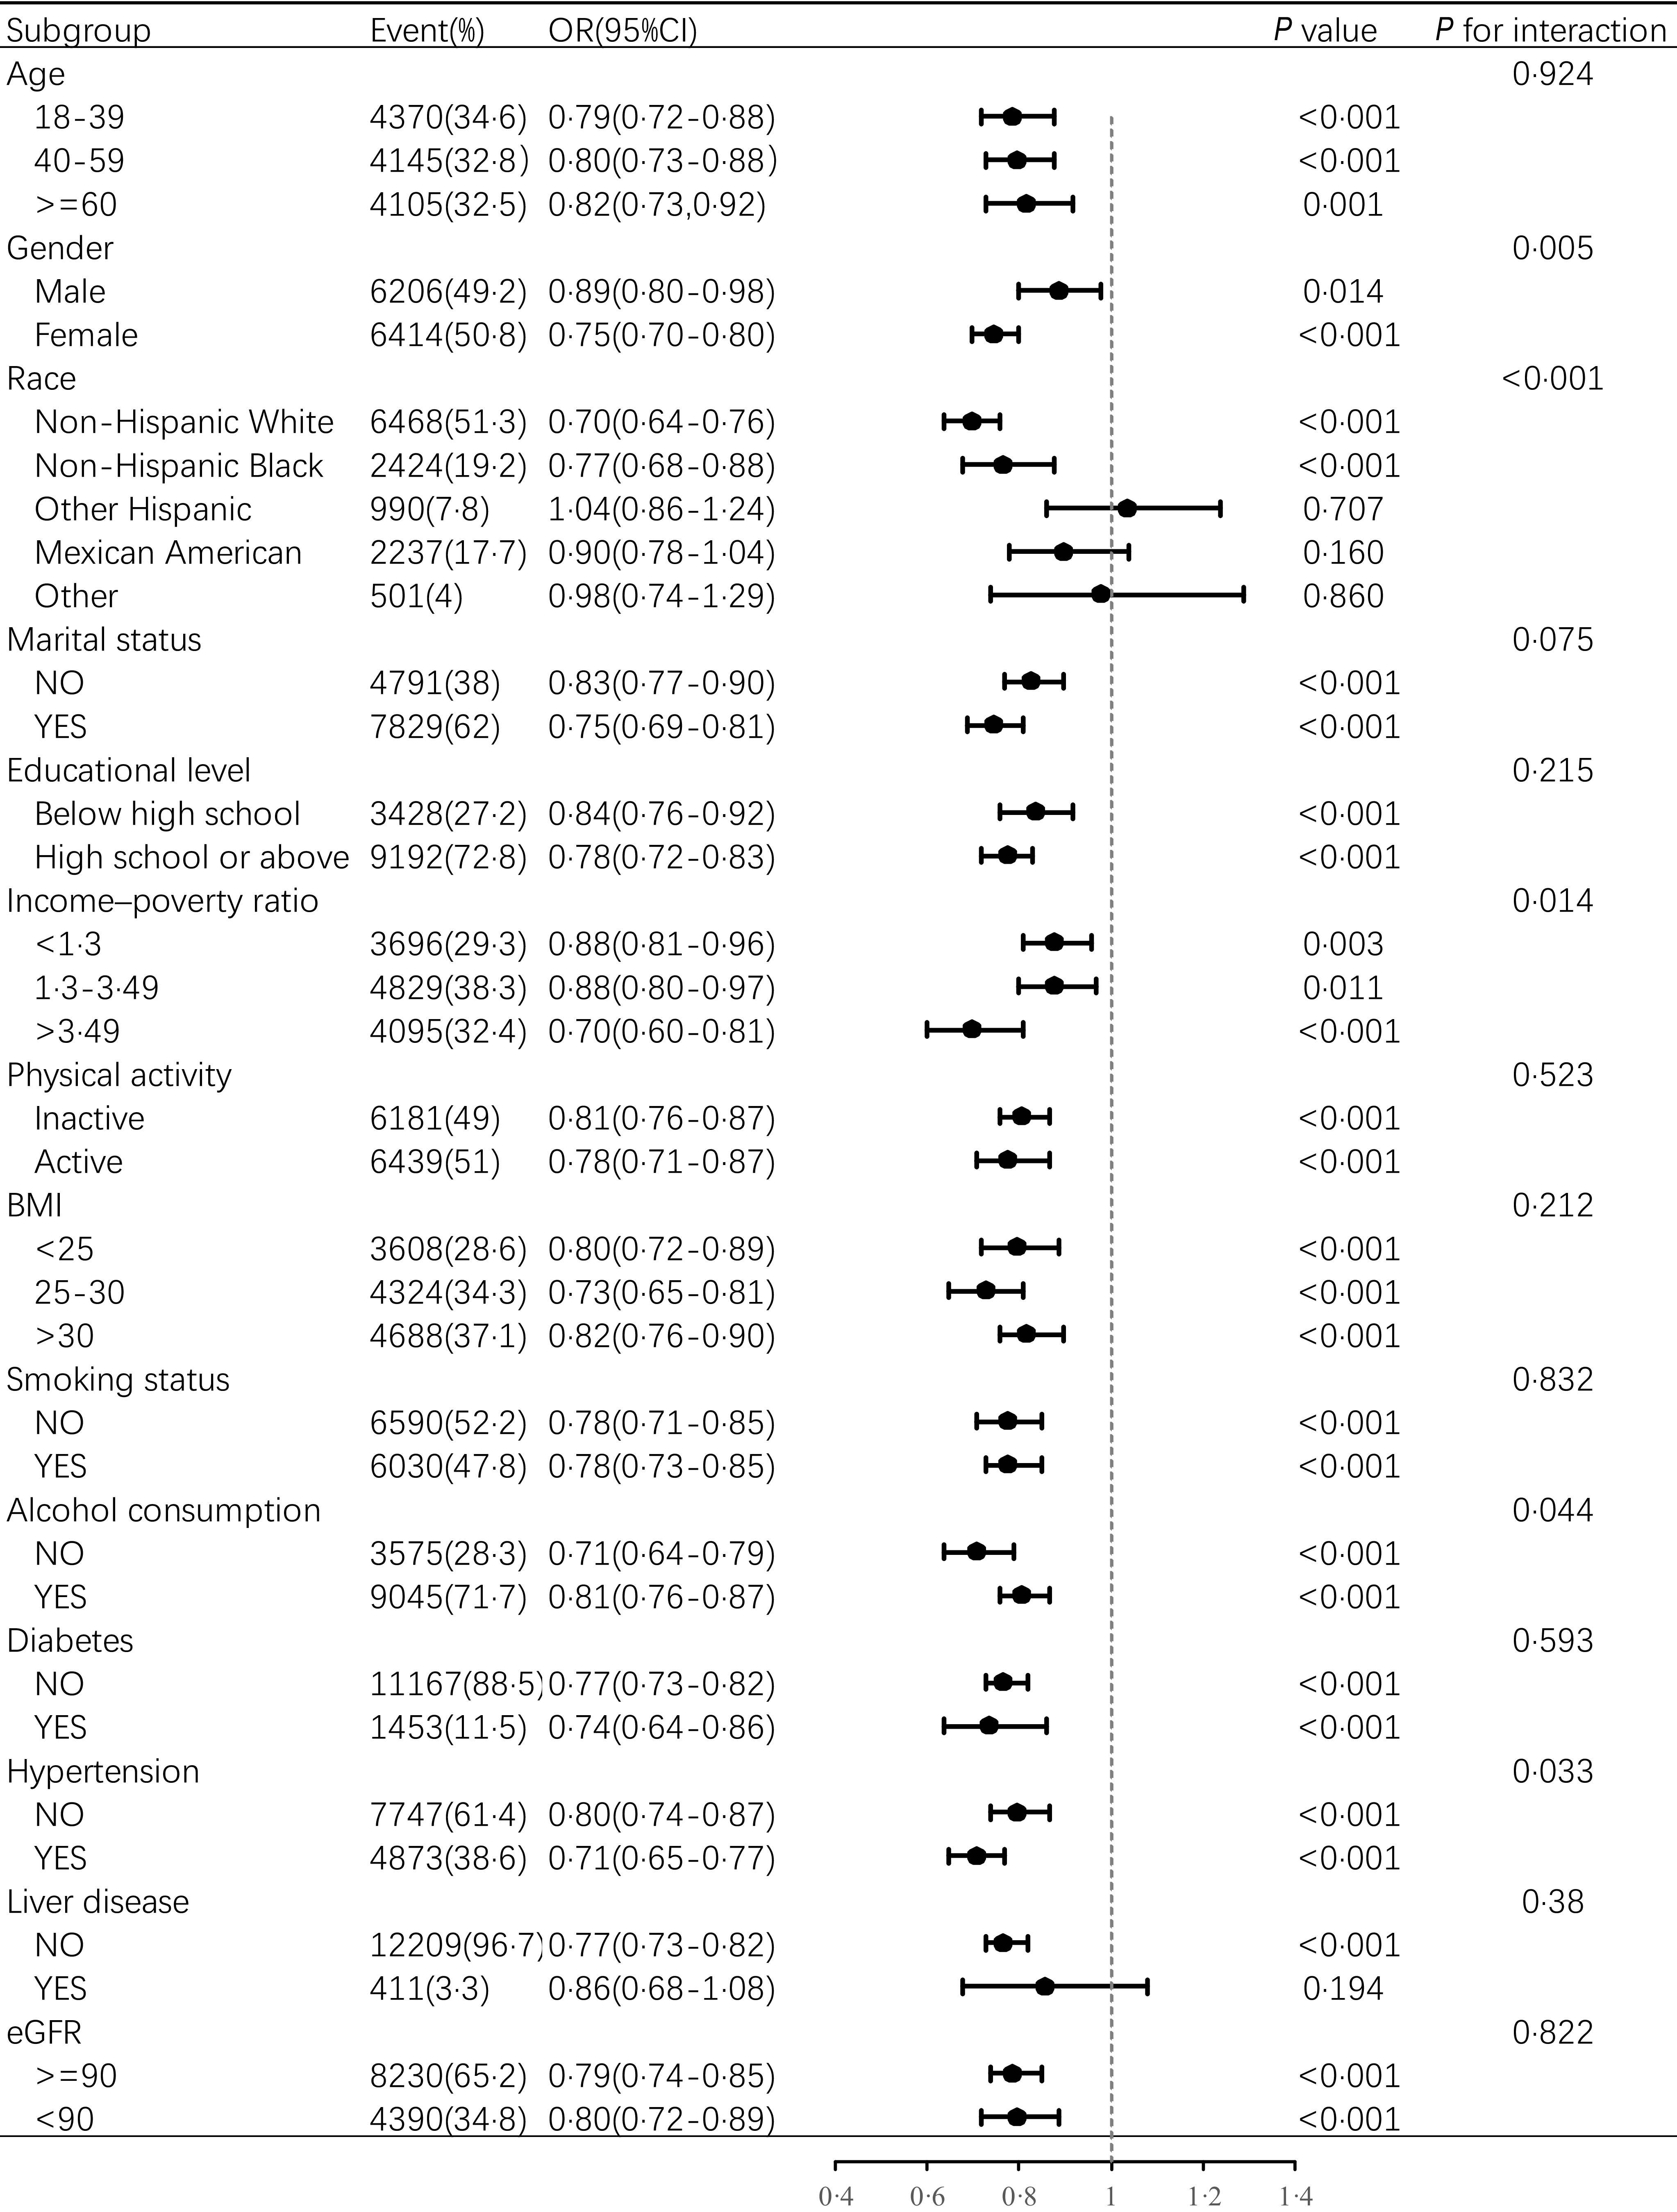
We conducted subgroup analyses to examine potential heterogeneity and effect modification. The inverse associations between both serum PLP and PA with depression remained directionally consistent across most subgroups examined. However, these associations failed to reach statistical significance in specific populations, including other Hispanic and other racial categories for both metabolites and among individuals with liver disease for PA. The protective association between serum PLP and depression was particularly robust among females, Non-Hispanic Whites, married individuals and those with poverty–income ratios exceeding 3·49 (Figure 3). Similarly, the inverse relationship between serum PA and depression was most pronounced within these same demographic subgroups (Figure 4). Interaction analyses revealed significant effect modification of the PLP–depression relationship by gender, race, educational level and poverty–income ratio (all P for interaction < 0·05). The association between serum PA and depression was significantly modified by gender, race, poverty–income ratio, alcohol consumption and hypertension status (all P for interaction < 0·05). It is noteworthy, however, that these associations were not statistically significant in all subgroups, such as among individuals of ‘Other Race’. These non-significant findings should be interpreted with caution, as they likely stem from limited statistical power due to smaller sample sizes within these specific demographics.
Stratified analyses of the association between serum PLP and depression. Except for the stratification component itself, the stratifications were adjusted for age, gender, race, marital status, education level, income–poverty ratio, physical activity, BMI, alcohol consumption, smoking status, diabetes, hypertension and liver disease. PLP, pyridoxal 5′-phosphate.

Figure 3 Long description
The table presents stratified analyses of the association between serum PLP and depression, adjusted for multiple factors. It includes 15 rows and 6 columns. The columns are labeled Subgroup, Event(%), OR(95%CI), P value, and P for interaction. The subgroups include Age, Gender, Race, Marital status, Educational level, Income-poverty ratio, Physical activity, BMI, Smoking status, Alcohol consumption, Diabetes, Hypertension, and Liver disease. Each subgroup is further divided into specific categories with corresponding Event(%), OR(95%CI), P value, and P for interaction values. For example, under Age, the categories are 18-39, 40-59, and >=60, with Event(%) values of 34.6, 32.8, and 32.5 respectively. The table provides detailed data on the odds ratios and p-values for each category, indicating the strength and significance of the association between serum PLP and depression within each subgroup.
Stratified analyses of the association between serum PA and depression. Except for the stratification component itself, the stratifications were adjusted for age, gender, race, marital status, education level, income–poverty ratio, physical activity, BMI, alcohol consumption, smoking status, diabetes, hypertension, liver disease and eGFR. eGFR, estimated glomerular filtration rate; PA, 4-pyridoxic acid.

Correlation between pyridoxal 5′-phosphate and 4-pyridoxic acid and mutually adjusted models
Serum PLP and PA were moderately positively correlated (Spearman correlation coefficient r 0·582, P < 0·001; Supplementary Figure 1). In sensitivity analyses including both PLP and PA as continuous predictors in the same multivariable logistic regression model, the inverse association between serum PLP and depression remained statistically significant (OR = 0·998, 95 % CI: 0·997–0·999, P = 0·002), whereas the association for serum PA was attenuated and became non-significant (OR = 0·999, 95 % CI: 0·999–1·001, P = 0·58; Supplementary Table 1).
Discussion
Our study revealed nonlinear inverse associations between serum vitamin B6 metabolites and depression, with distinct threshold effects for both PLP and PA. These findings are broadly consistent with, and extend, those of a recent NHANES analysis by Lu et al.(Reference Lu, Mao and Tan15) who reported that higher dietary vitamin B6 intake and higher plasma PLP quartiles were associated with a lower prevalence of depression in USA adults. Similar to their results, we observed a monotonic decrease in depression odds across PLP quartiles. By additionally modelling continuous PLP and PA concentrations using restricted cubic splines, and by incorporating PA as a second circulating biomarker rather than dietary intake, we further demonstrate that the PLP–depression association follows an L-shaped pattern with a threshold around 90·6 nmol/L, whereas PA exhibits a U-shaped relationship with depression risk. The mutual adjustment analysis indicates that the association of PLP with depression is independent of PA, while that of PA is not independent of PLP. Moreover, in contrast to previous studies(Reference Merete, Falcon and Tucker14,Reference Doll, Brown and Thurston29–Reference Arévalo, Scott and Falcón34) , our subgroup analyses identify important effect modifications by age, sex and socio-economic characteristics, thereby providing a more detailed picture of vitamin B6 metabolism and depression risk in a demographically diverse adult population. These extensions suggest that the vitamin B6–depression relationship is not only present, as suggested by other prior studies, but also metabolite specific and threshold dependent. Taken together, the quartile-based logistic regression and spline analyses provide complementary information: the quartile models summarise the overall inverse association across the concentration range that encompasses the vast majority of participants, whereas the spline models highlight that a small subset of individuals with very high PA levels deviates from this pattern, giving rise to the observed U-shaped relationship.
Several plausible mechanisms may explain the relationship between vitamin B6 status and depression. Vitamin B6 derives from both dietary sources and gut microbiota production, followed by intestinal absorption and circulates predominantly as PLP, which serves as an essential cofactor for DOPA decarboxylase and glutamate decarboxylase, enzymes crucial for the biosynthesis of serotonin, dopamine and GABA, respectively(Reference Wilson, Plecko and Mills35,Reference Calderón-Ospina and Nava-Mesa36) . Serotonin plays a central role in mood regulation, and its deficiency has long been implicated in depression pathophysiology(Reference Tahiri, Mian and Aftan37), while imbalances in dopaminergic and GABAergic neurotransmission have also been associated with depressive symptoms and related affective disturbances(Reference Wiciński, Malinowski and Puk38–Reference Luscher, Maguire and Rudolph40). Classical biochemical studies have shown that PLP availability regulates the holoenzyme content and activity of key PLP-dependent decarboxylases in brain tissue, including aromatic L-amino acid decarboxylase and glutamate decarboxylase(Reference Martin and Rimvall41,Reference Lloyd and Hornykiewicz42) . Experimental work in rodents further demonstrates that pyridoxine deficiency lowers seizure threshold and alters GABAergic signalling, whereas pharmacological vitamin B6 supplementation exerts anxiolytic- and antidepressant-like effects, in part through GABAergic and NO–sGC–cGMP pathways(Reference Walia, Garg and Garg43,Reference Maratha, Sharma and Walia44) . In non-human primates, positron emission tomography studies have indicated that pyridoxine administration can increase the rate of serotonin synthesis in the brain(Reference Hartvig, Lindner and Bjurling45). Together, these findings support a biologically plausible role for vitamin B6-dependent neurotransmitter pathways in mood regulation and are consistent with the inverse associations between vitamin B6 status and depression observed in our study.
Research has demonstrated a significant positive correlation between PLP and PA concentrations in both cerebrospinal fluid and plasma(Reference Albersen, Bosma and Luykx46), suggesting that peripheral vitamin B6 markers may reflect central nervous system status. This relationship is further supported by animal studies showing that vitamin B6 deficiency reduces PLP and dopamine concentrations in the prefrontal cortex, accompanied by decreased social behaviour(Reference Li, Luo and Hu47). Therefore, the lower serum PLP and PA levels observed in depressed individuals in our study may reflect similar reductions in the central nervous system, potentially compromising neurotransmitter synthesis involved in depression. Additionally, vitamin B6 exhibits antioxidant properties in brain tissue, with supplementation shown to decrease oxidative stress-induced memory dysfunction(Reference Nasir, Ur Rahman and Khan48) and enhance neuronal resilience to oxidative neurotoxicity by promoting glutathione synthesis(Reference Wei, Lu and Mei49). Given that oxidative stress represents a key pathogenic factor in depression(Reference Bhatt, Nagappa and Patil50,Reference Liu, Liu and Wang51) , this antioxidant function may provide another mechanism linking vitamin B6 status to depression risk. Finally, the relationship may be bidirectional, as depressed individuals often experience reduced appetite, potentially further decreasing vitamin B6 intake(Reference Kroemer, Opel and Teckentrup52).
An interesting aspect of our findings is the different non-linear patterns observed for PLP and PA. PLP is the main coenzyme form of vitamin B6 and directly participates in neurotransmitter synthesis, one-carbon metabolism and other pathways implicated in depression(Reference Hadtstein and Vrolijk53). In contrast, PA is the terminal oxidation and major urinary excretion product of vitamin B6 and has no known coenzyme or signaling roles; it is best viewed as an indicator of vitamin B6 catabolism and turnover rather than an active metabolite. Within this framework, the positive association between very high PA concentrations and depression risk in our spline models is unlikely to reflect a direct toxic or ‘adverse’ effect of PA or pyridoxine itself. Rather, elevated PA may mark states of increased vitamin B6 utilisation and breakdown, for example under conditions of inflammation or oxidative stress that accompany depression(Reference Ryan, Allers and Harkin13). The finding that the association between PLP and depression remained significant after adjusting for PA, while the association for PA was attenuated and became non-significant when adjusted for PLP, suggests that the link between vitamin B6 status and depression is more directly reflected by the level of the biologically active coenzyme, PLP. The moderate positive correlation between PLP and PA (r 0·582) indicates that PA levels are, to a considerable extent, a function of PLP availability and its subsequent catabolism. Therefore, the apparent U-shaped association between PA and depression observed in the spline model, which did not persist after accounting for PLP, may primarily reflect the complex interplay of vitamin B6 metabolism and turnover states, rather than an independent effect of PA itself. This reinforces the interpretation that PA serves best as a marker of vitamin B6 catabolism and that PLP is the central metabolite of interest in the context of depression. Over time, sustained high turnover could deplete total vitamin B6 pools, leading to low levels of both PLP and PA, which is consistent with our observation that participants in the lowest PA quartile also had elevated odds of depression. Importantly, neuropathy due to pyridoxine toxicity typically requires prolonged exposure to pharmacological doses (around 200 mg/day or higher)(Reference Levine and Saltzman54) and is considered rare in the general population; thus, it is unlikely that overt pyridoxine toxicity explains the elevated PA levels at the upper end of our distribution. Our cross-sectional data cannot determine temporal ordering, and any dynamic trajectory of PA across different stages or durations of depressive illness should therefore be regarded as speculative and hypothesis-generating, to be tested in future longitudinal studies.
Our findings carry notable implications for both clinical practice and public health. The inflection point for the PLP–depression association was identified at approximately 90·7 nmol/L, a concentration substantially higher than the conventional biochemical deficiency cut-off of 20 nmol/L(55). This discrepancy suggests that vitamin B6 levels deemed ‘adequate’ by traditional nutritional standards might be suboptimal for mental health, pointing to a potential need to re-evaluate the optimal range for neurological and psychiatric well-being(Reference Tardy, Pouteau and Marquez56). From a public health perspective, ensuring an optimal vitamin B6 status could thus be a valuable component of population-level strategies for the primary prevention of depression. This could be achieved through promoting a diversified diet rich in natural B6 sources (e.g., fish, poultry, chickpeas and potatoes) or, where dietary intake is insufficient, considering prudent food fortification or supplementation strategies(Reference Noah, Dye and Bois De Fer57,Reference Flores-Torres, Christine and Bjornevik58) . Future longitudinal studies and randomised controlled trials are needed to confirm a causal relationship and to define precise, mentally optimal target ranges for serum vitamin B6 metabolites.
In this study, we examined the associations between serum vitamin B6 metabolites (PLP and PA) and depression prevalence among USA adults. Our investigation offers several methodological strengths. First, we utilised data from NHANES, a nationally representative database with rigorous quality control procedures, enhancing the validity and generalisability of our findings. Second, we assessed vitamin B6 status using serum biomarkers rather than dietary intake estimates. This approach provides a more accurate reflection of biologically available vitamin B6, accounting for both dietary sources and gut microbiota contributions while avoiding recall biases inherent in dietary interviews. Furthermore, these metabolites were measured using LC/MS/MS methodology, the current gold standard for serum vitamin B6 quantification. Third, we employed restricted cubic spline regression to characterise the potentially nonlinear dose–response relationships between serum vitamin B6 metabolites and depression risk.
Limitations
Despite these strengths, our study has important limitations. The cross-sectional design precludes causal inference regarding the protective effect of vitamin B6 against depression. Prospective studies are needed to establish temporal relationships and potential causality. Additionally, although we adjusted for numerous potential confounders, residual confounding from unmeasured or unknown factors cannot be ruled out.
Conclusion
In conclusion, our study demonstrates nonlinear inverse associations between serum vitamin B6 metabolites and depression in USA adults, with particularly pronounced relationships among females, Non-Hispanic Whites and individuals with higher income levels. These findings suggest that maintaining adequate – but not excessive – serum vitamin B6 status is associated with a lower prevalence of depression. The distinct nonlinear patterns observed for PLP (L-shaped) and PA (U-shaped) indicate the complex relationship between vitamin B6 metabolism and mental health. However, large-scale prospective studies are needed to establish temporal relationships and causality, while large-scale prospective studies are needed to establish temporal relationships and causality, and further mechanistic work, building on existing biochemical and experimental evidence, is required to clarify how specific vitamin B6-dependent pathways influence depression pathophysiology in humans.
Supplementary material
To view supplementary material for this article, please visit https://doi.org/10.1017/S0007114526106321
Acknowledgements
The valuable data provided by the NHANES database and its participants are gratefully acknowledged.
This work was supported by the National Natural Science Foundation of China (Grant Nos. 82270570 and 32271172).
Conceptualisation, Jiangxu Mai and Xiuli Zuo; Data curation, Jiangxu Mai; Methodology, Jiangxu Mai and Yanqing Wang; Project administration, Jingxin Li; Supervision, Jingxin Li and Xiuli Zuo; Writing original draft, Jiangxu Mai and Yanqing Wang; Writing – review & editing, Jiangxu Mai and Yanqing Wang. All authors read and approved the final manuscript.
We have no potential conflicts of interest to disclose.


 Open access