


Introduction
The MultiBIGSARData project, funded by the Italian Space Agency and recently concluded, is part of the methodological field of research dedicated to the use of synthetic aperture radar (SAR) data sequences for characterization of phenomena with high spatial and temporal resolution. For the first time, using a combination of X-band (COnstellation of small Satellites for the Mediterranean basin Observation [COSMO]/SkyMed), C-band (Sentinel-1), and L-band (SAtélite Argentino de Observación COn Microondas [SAOCOM]) SAR data and optical sensors, it was possible to obtain a multifrequency, multitemporal, and multiresolution characterization of the same phenomenon. The aim of the project was to identify/adapt/develop methodologies that best combine data from different SAR and optical sensors with respect to the temporal, spatial, and spectral axes, considering the characteristics of the different sensors and thus profiting of their full potential in a synergistic way. The idea is not to combine multiple SAR and multiple optical sensors’ dataset but to jointly use one SAR sensor and one optical dataset at a time and compare the results.
MultiBigSARData has, therefore, led to the development of methodologies useful for the joint use of long sequences of multisensor SAR and optical data over time, so as to provide a useful approach for the characterization of important phenomena in numerous applications. These methodologies have been used to characterize changes (for environmental monitoring phenomena or for the characterization of natural or man-made disasters), to map land cover (crops in particular) using the temporal trend of the backscattered signal to recognize their temporal signatures in addition to their spatial and spectral ones, as shown in paper [Reference Mestre-Quereda, Lopez-Sanchez, Vicente-Guijalba, Jacob and Engdahl1]. Results referring to urban areas, reported below, highlight the possible synergies of multifrequency and multimission SAR with multispectral data. The focus on urban area monitoring is due to the fact that the continuous monitoring of urban development is now considered to be an essential preliminary step for many scientific and technical applications, such as (i) hydrological balance and access to water [Reference Praskievicz and Chang2], (ii) sustainable development planning [Reference Xing, Horner, El-Haram and Bebbington3], and (iii) resource allocation [Reference Liu and Biljecki4].
The use of satellite remote sensing for urban monitoring has many advantages. These include the ability to detect urban areas at a synoptic scale and to systematically revisit them over time [Reference Alami, Saadane, Kacimi and Chafiq5]. However, it also requires specialized tools, especially when it is performed with radar sensors. Indeed, in the technical literature, there are not many approaches that work on remotely sensed data sequences in urban areas to extract specific information on changes, such as the temporal development of new constructions (and not simply the binary extraction of change, as presented in paper [Reference Tian, Zhong, Zheng, Ma, Tan and Zhang6] which uses a deep learning approach for the change detection), the demolition of old buildings, renovation works, and so on. The main point is that changes in urban areas do not simply and always refer to changes related to the expansion (or reduction) of the extents of the built-up structures, as presented in paper [Reference Ding, Shao, Huang, Altan and Hu7], where a large-scale time-series mapping approach using training samples from the OpenStreetMap database is presented. The topic of urban change detection using SAR data was addressed in papers [Reference Yousif and Ban8] and [Reference Ban and Yousif9], which combined image processing techniques, machine learning algorithms, and interdisciplinary collaborations to address key challenges in urban remote sensing and geospatial analysis. In paper [Reference Yousif and Ban8], binary urban change maps were computed using an unsupervised change detection algorithm based on an automatic thresholding, a technique that has been successfully used for pixel-based urban change using high-resolution SAR images. In this work, change images are generated by comparing the multitemporal mean intensities using the modified ratio operator, and three thresholding algorithms, i.e., the Kittler–Illingworth algorithm, the Otsu method, and the outlier detection technique, are tested and compared to threshold the change image and generate a binary change map. The work reported in paper [Reference Ban and Yousif9] is another application of the thresholding algorithm for urban change detection applied to multitemporal spaceborne SAR data of Beijing and Shanghai. In order to compare the SAR images at different dates, a modified ratio operator that takes into account both positive and negative changes was developed to derive a change image. A generalized version of the Kittler–Illingworth minimum error thresholding algorithm was then tested to automatically classify the change image into the “change” and “no change” classes. Different probability density functions such as log-normal, generalized Gaussian, Nakagami ratio, and Weibull ratio were investigated to model the distribution of these two classes. The results show that the Kittler–Illingworth algorithm applied to the modified ratio image is very effective in detecting temporal changes in urban areas using SAR images.
Within this framework, this work does not present a new technique to monitor where and when other land covers have transformed into urban covers. These types of changes can be characterized by implementing algorithms for extracting built-up areas and then comparing results across different data acquisition times, like in paper [Reference Tewabe and Fentahun10], where land use land cover (LULC) change detection maps were computed to assess the status of Lake Tana region in Ethiopia. Instead, in this work, urban development is linked to the extraction of patterns of temporal changes and, in particular, those patterns that allow characterizing what happens within the urban area. As mentioned above, these changes are generally associated with an increase/decrease in building density (e.g., construction of more buildings in already built-up areas), renovation/demolition work (e.g., roof changes and floor increments), and possibly replacement of old buildings/infrastructure with new ones. Examples include residential blocks that are transformed into commercial areas or replacement of tiny buildings with larger or taller ones. These changes are not adequately monitored by land use change techniques nor are they perceived as a change in the extent of the urban area. Instead, these changes need to be detected and monitored directly with an appropriate approach, if possible, avoiding the built-up area extraction procedure.
By leveraging the potential linked to the use of nighttime light (NTL) data to identify and monitor urban areas [Reference Gamba and Herold11], a first attempt to exploit SAR and NTL data to detect some of these changes in urban areas was presented in paper [Reference Che and Gamba12], where an automatic procedure was proposed for extracting changes in urban extent and changes in volumetric patterns in urban areas through the joint use of Sentinel-1 data and NTL data. This procedure exploits a two-dimensional (2D) vector analysis in the joint feature space of backscattering values and NTL measurements to build clusters that allow the identification and characterization of classes with homogeneous temporal patterns within the urban extension. The results reported in this work show the potential of the approach to detect three-dimensional quantities (such as building volumes) related to urban development dynamics, but the use of NTL data implies a significant loss of spatial resolution in the final product compared to what the SAR sensor is capable of, since the optical data on night lights have a spatial resolution of 500 m. Therefore, a first line of research worth exploring was to try and understand which could be the options to capitalize on multispectral sensors with finer spatial resolution and track urban changes, possibly using both these data and night light data together with SAR for the characterization of variations within the urban perimeter.
A natural solution is to use other multispectral datasets, such as those from the Landsat and Sentinel-2 sensors, which do not possess detection capabilities at the same wavelengths as the NTL sensor but have been used for the characterization of urban areas from a different perspective [Reference Iannelli and Gamba13]. In particular, the technical literature lists for these sensors and their data many approaches with the aim of characterizing the degree of imperviousness or the degree of construction within the urban area. In this regard, many so-called construction indices have been identified. These indices are designed to use combinations of bands of these multispectral spatial sensors that allow sufficiently robust separation of urban area covers (materials) from other land covers. To this end, these indices focus on the expected spectral response of urban-type pixels and specifically consider those bands that increase the possibility of accurately discriminating urban from non-urban pixels. Therefore, a second interesting line of research was to make use of multispectral urban indices as a substitute for NTL measurements.
To select which indexes could be used, several studies reported in technical literature were considered. For example, in paper [Reference Kebede, Hailu and Suryabhagavan14], the area of Addis Ababa, the capital of Ethiopia, was used to evaluate the capacity of different indices computed from Sentinel-2 data. The work is based on the comparison of the extensions of the urban area between the extraction and an existing LULC map, using indices constructed for a series of data collected in 2016, 2018, and 2020. The best results were provided by the Normalized Built-up Area Index (NBAI), the New Built-up Index (NBI), and the Normalized Difference Built-up Index (NDBI). Similarly, paper [Reference Valdiviezo-N, Téllez-Quiñones, Salazar-Garibay and López-Caloca15] contains a collection of several indices successfully implemented with Landsat data, focusing on those that do not require thermal bands so that they can also be implemented with Sentinel-2 data. The results show that the best indices are the Band Ratio for Built-up Area, the Biophysical Composition Index, and the Combinational Build-up Index, in addition to the NBAI, NDBI, and NBI mentioned above. Finally, a comprehensive review of the above indices and their ability to extract the urban area is presented in paper [Reference Kaur and Pandey16]. In this work, a complete collection of such indices is illustrated, highlighting the advantages and disadvantages of each of them.
Datasets and test site
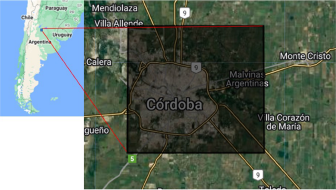
The test site for this work is the metropolitan area of Cordoba city (central Argentina), the capital of the Cordoba province and the second most populous city in Argentina. SAR data from the COSMO/SkyMed, SAOCOM, and Sentinel-1 constellations were collected and considered, together with Sentinel-2, Landsat, and NTL datasets. The position of Cordoba in Argentina is reported in Fig. 1.
The study area, highlighted by the dark polygon.
COSMO-SkyMed (CSK) is an Italian Earth-imaging constellation consisting of four medium-sized satellites (CSK-1, CSK-2, CSK-3, and CSK-4), launched between 2007 and 2010, each one equipped with a microwave high-resolution SAR operating in X-band, with ∼630 km access ground area. COSMO-SkyMed stands for “COnstellation of small Satellites for the Mediterranean basin Observation.” The mission is owned and operated by Agenzia Spaziale Italiana (ASI) and is funded by the Italian Ministry of Research and the Italian Ministry of Defense. CSK is a fully polarimetric system that can provide images acquired with HV, VH, VV, and VH polarizations.
The CSK images, recorded in Stripmap Himage mode, were downloaded from the Cosmo/SkyMed portal (https://portal.cosmo-skymed.it) as Geocoded Terrain Corrected images, after radiometric calibration and geocoding using the Shuttle Radar Topography Mission 90 m Digital Elevation Model.
The SAOCOM satellite constellation consists of two spacecraft (SAOCOM-1A and -1B) operating an L-band polarimetric SAR instrument each. The SAOCOM mission is a programme defined, managed, and operated by Comisión Nacional de Actividades Espaciales (CONAE), the Argentine Space Agency, in Buenos Aires. The SAOCOM requirements include provision of timely information to support management of natural and human-induced disasters (such as flooding, volcanic activity, and seismicity) and monitoring services for agriculture, mining, and marine applications. The aim is to obtain data with high radiometric and geometric accuracy (e.g., identification of natural resources, interferometry, and glaciology) as well as to provide high revisit frequencies (daily) to support specific operational requirements. A single satellite can cover the area of interest in 16 days. Considering the constellation, the revisit time is 8 days. The SAOCOM constellation has a maximum bandwidth of 50 MHz, it can be operated in StripMap (swath width 13–67 km) or TopSAR (swath width 109–389 km) acquisition mode, and the polarization modes can be single, dual, or quad. The SAOCOM datasets used for this work are Ground Terrain Corrected Level-1D, i.e., radiometrically calibrated, geocoded, and georeferenced using topography. The SAOCOM data are freely available on the ASI Data Hub.
The Sentinel-1 (S1) SAR sensor is the radar component of the European Copernicus programme. It operates in the C-band at a center frequency of 5.405 GHz. Using its two platforms (Sentinel-1A and -1B), the mission provides data with a revisit time of 6 or 12 days, depending on the region studied. The antennas of the radar are right-looking, and the angle of incidence can vary between 29.1° and 46°. Sentinel-1 is a dual-polarized system that can provide images acquired with VV and VH polarizations or HH and HV polarizations. The S1 images used in this work were acquired using the interferometric wide swath default operation mode, which has a swath of 250 km and a spatial resolution of 5 × 20 m (for single look). For this study, multilook level L1C intensity images were used in the Ground Range Detected format, with a pixel size of 10 × 10 m. More specifically, pre-processed Sentinel-1 SAR using a workflow derived from the SNAP toolbox was downloaded from the Google Earth Engine platform. The implemented pre-processing steps correspond to the application of the orbit file, boundary noise and thermal noise removal, radiometric calibration, and orthorectification. In the end, the calibrated and orthorectified backscatter coefficient (σ 0) is reported.
The Sentinel-2 (S2) is a mission of the European Copernicus Earth Observation Programme, consisting of two satellites, Sentinel-2A and Sentinel-2B, designed for high-resolution imaging of the Earth’s land surface for monitoring land cover change and assess biophysical parameters. The mission was launched in 2015 and has been fully operational since October 2017. It provides image time series with a free, full, and open access policy, with the following characteristics: 13 spectral bands from 0.44 to 2.2 μm, images with high spatial resolution (between 10 and 60 m depending on the spectral bands), and continuous and frequent observations. The constellation of Sentinel-2A and -2B satellites observes the Earth’s land surfaces on a 5-day repeat cycle, with a wide field of view of 290 km to capture detailed images of vegetation, soil, water cover, and coastal areas. The mission plays a critical role in land monitoring services, supporting applications such as land cover classification and the change detection, such as urbanization monitoring.
Landsat data from the United States Geological Survey are one of the best sources for mapping and monitoring land cover and the biophysical and geophysical properties of the land surface. For this study, Landsat 8 images for 2017 were used to cover the year in which Sentinel-2 images having low percentage cloud cover over Cordoba city were not available. Landsat 8 was launched in February 2013, ensuring the continuity of the Landsat programme for at least the next few decades. In particular, Landsat 8 Operational Land Imager data were used, providing visible, near-infrared (NIR), and shortwave infrared (SWIR) wavelength bands, as well as a panchromatic band. A quality assurance band is also included to indicate the presence of terrain shadowing, data artifacts, and clouds [Reference Acharya and Yang17]. Panchromatic and multispectral imagery are acquired at 15 m and 30 m resolution (wavelength from 0.433 to 1.390 μm), respectively. The Landsat 8 satellite images the entire Earth every 16 days with an 8-day offset from Landsat 7. The approximate size of the scene covered is 170 km north-south by 183 km east-west and has a large file size of about 1 GB compressed.
The harmonized NTL time-series composites created by fusing multisource NTL observations provide a long and consistent record of the nightscape for characterizing and understanding the spatiotemporal dynamics of global urbanization over a long time series. In recent decades, there has been an extensive surge in using NTL data as a proxy of human activities, such as mapping urban growth [Reference Zhou, Li, Asrar, Smith and Imhoff18]. The NTL from space offers a novel point-of-view in portraying the extent and intensity of human footprints. Since the 1970s, a succession of satellite sensors have been developed and utilized to detect NTL at both global and regional scales, including Defense Meteorological Satellite Program-Operational Linescan System, Visible Infrared Imaging Radiometer Suite (VIIRS) of Suomi-NPP satellite, Luojia-01, Jilin1-03B, as well as images taken from the International Space Station [Reference Zheng, Weng, Zhou and Dong19].
Since the goal of this research is change detection in urban areas, the analysis was performed on yearly intervals, and the datasets selected for this research span across multiple years. The overall set of data is shown in Table 1. Please note that S2 and Landsat data are jointly considered, in the sense that Landsat data have been used whenever no S2 dataset in a specific year was available.
SAR and multispectral data around the area of Cordoba, Argentina, used in this research
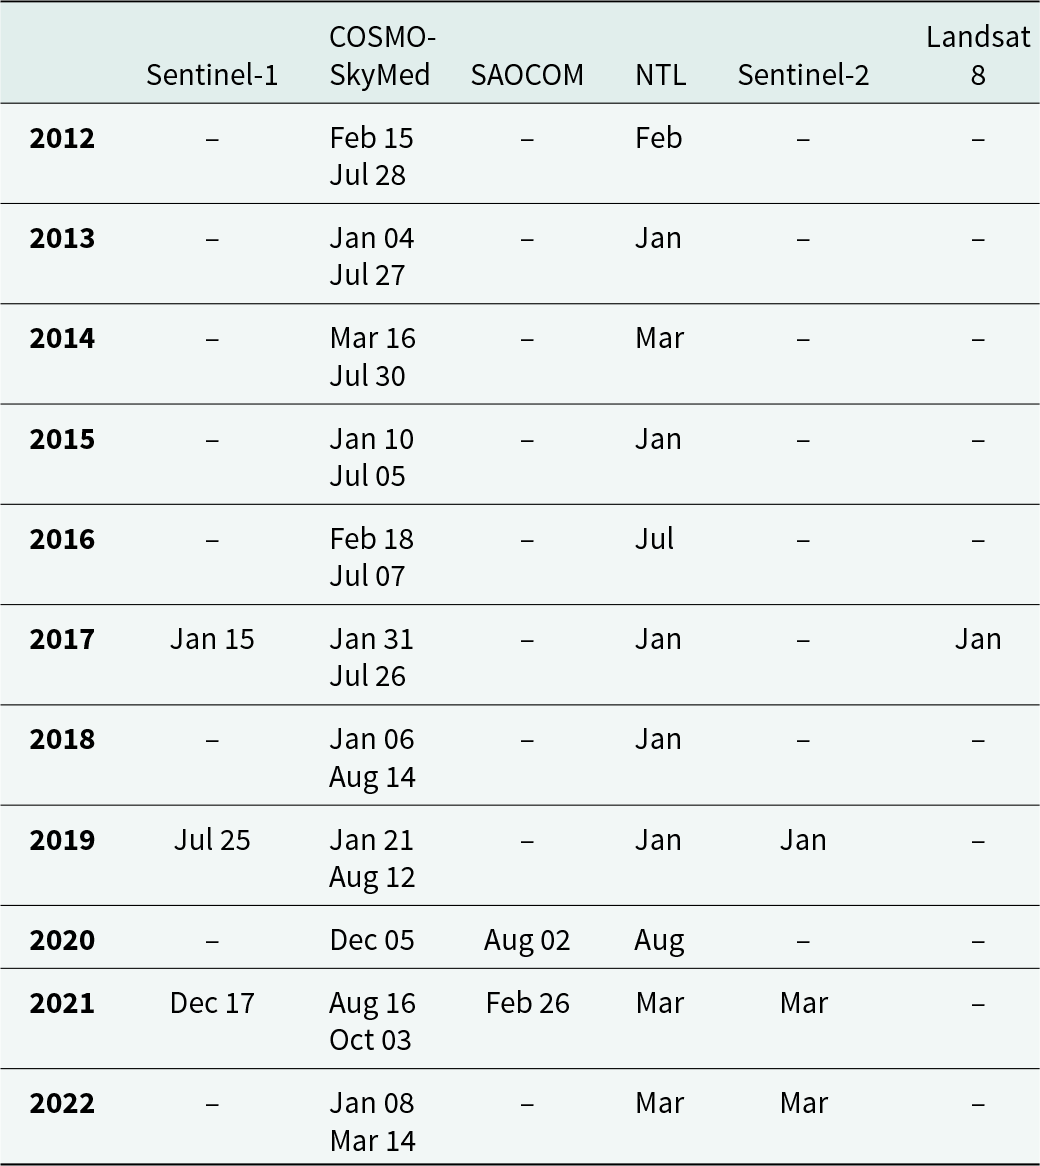
Looking at Table 1, two CSK images were considered for each year, except for year 2020, when only one CSK image is available. The CSK dataset presents this distribution in the period of interest, as only those images whose footprint covered the entire city of Cordoba were selected. Cells with a “-” mark mean no images available for that year, for that specific sensor. Instead, the cells where only the single month is indicated refer to monthly composite datasets, realized by a temporal averaging of images in a trimester, selecting the median per-pixel value. Those composites were considered for S2 and Landsat. Finally, available monthly images were considered in the case of NTL data. To validate the results of the methodology described in the next section, a few auxiliary datasets, i.e., Planetscope images at 3 m spatial resolution acquired on December 22, 2016, February 22, 2019, and April 28, 2022 were used to select around 30 polygons in areas that did not change (remained either urban or non-urban for the whole timespan) and an equivalent number of points in areas that underwent changes from one year to the other.
Methodology and results
Following what is indicated in the previous section, this research was aimed to improve with respect to the state-of-the-art and the previous research in two ways. On the one hand, the procedure in paper [Reference Che and Gamba12] was implemented using multifrequency SAR data, therefore the S1, CSK, and SAOCOM data, to compare what could be obtained using, instead of S1, different SAR systems working in different microwave bands and with different acquisition modes and spatial resolution. On the other hand, this work explored whether it is possible to substitute the original NTL data used in paper [Reference Che and Gamba12] with indexes obtained from multispectral data (S2 and Landsat) to combine the finer spatial resolution obtainable using CSK and SAOCOM with multispectral information without the limitation of spatial coarse resolution as in NTL data.
Joint temporal analysis of SAR (S1, CSK, or SAOCOM) and NTL data
The methodology in paper [Reference Che and Gamba12], graphically shown in Fig. 2, envisages, following the co-registration and calibration of the SAR data sequence, the extraction of the urban area extent by means of the method in paper [Reference Xing, Horner, El-Haram and Bebbington3] for each of the years considered, with the consequent definition of the area classified as urban in each year (called “core urban area”) and the changes in the extension of the city year by year, which identify its 2D expansion. The method in Fig. 1 implements the idea that the changes can be measured by both a change in the backscattered power and a change detected by a passive optical sensor.
Summary diagram of the analysis procedure carried out considering SAR and NTL data (where SAR means S1, CSK, or SAOCOM data).
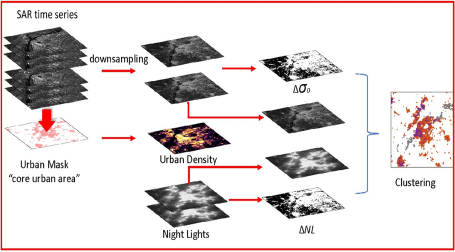
More specifically, the diagram in Fig. 1, according to paper [Reference Che and Gamba12], is a graphical representation of the processing chain, summarized into the following four steps:
(i) Urban map extraction by combining and processing two annual SAR sequences (e.g., 2012 and 2013) on the same test area. The SAR series are separately processed, then the urban extent for these 2 years is extracted and combined through a logical Boolean OR operation to produce the final urban mask.
(ii) Downsampling of the SAR images and change analysis, in which the calibrated SAR amplitude ${\sigma _0}$ is downsampled to the spatial resolution of the nighttime data (nearly 500 m in case of the VIIRS dataset). The annual downsampled SAR ${\sigma _0}$ data are then combined to obtain the $\Delta {\sigma _0}$, the change in backscattering characteristics of the urban area at the coarse spatial scale of NTL.
(iii) Change pattern calculation: after calculating the nighttime light change values
$\Delta NTL$, which is the difference of the NTL data between the final and the initial dates, $\Delta NTL$ and $\Delta {\sigma _0}$ are combined to obtain a 2D change vector analysis, as shown in Fig. 3 or Fig. 4. An urban density map is then calculated at the coarse spatial resolution of the change vector analysis. The density information is extracted from the percentage of pixels of built-up area extracted at the resolution of the SAR image within the coarse spatial resolution (500 m) used for the following joint SAR-nighttime data clustering.(iv) Clustering map: finally, the downsampled SAR
${\sigma _0}$ images, the nighttime data at the start date, and the change vector are clustered to distinguish between different temporal change patterns and initial conditions. The final clustering, arbitrarily four as the number of clusters, is shown in Fig. 5.


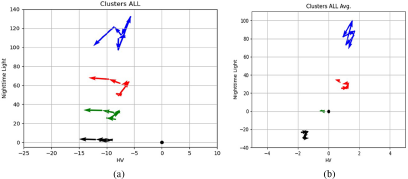
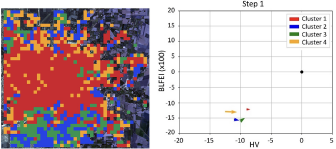
Sequences of SAR and NTL data variations for the clusters obtained for a sequence from 2012 to 2021 (some of which are identified in Figure 5): the color of the arrows identifies the cluster, the direction the flow of time, the starting point of each arrow the average value of the SAR and NTL data in the starting year, the final point of each arrow the average value of the same data in the final year. The two graphs represent the same sequence (a) without having subtracted the average value of each image, or (b) having subtracted it, to reduce the bias due to a different calibration or residual effects of geographical misalignment of the data.
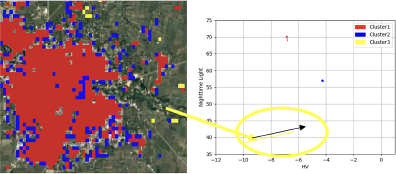
Temporal clustering methodology (three clusters) applied to SAOCOM and NTL data in the period 2002–2021: on the left the geographical extension of the identified clusters, on the right the average values of the variations of the backscattering values (x-axis) and of the NTL values (y-axis). The starting point of the arrows identifies these values in 2020, the final point those in 2021.
Visual representation of the sequence of clusters obtained by applying the proposed procedure to COSMO/SkyMed and NTL data over the city of Cordoba (Argentina) for years 2012–13, 2013–18, and 2018–19. The same color is used for clusters with similar average temporal behavior.
The main difference in the research reported here with respect to paper [Reference Che and Gamba12] is, as mentioned above, the use of different SAR datasets in input to this procedure. Unfortunately, the need to jointly analyze SAR and NTL requires subsampling of the SAR data to the much coarser spatial resolution of the NTL data. This is particularly problematic when using CSK data at 2.5 m spatial resolution (20 times finer than the 500 m spatial resolution of NTL data). Still following paper [Reference Che and Gamba12], for a given temporal sequence the four quantities corresponding to SAR  ${\sigma _0}$ for the HV cross-polarization and the NTL data at the initial year, $\Delta {\sigma _0}$ and $\Delta NTL$ are provided as input to the clustering function that groups the locations featuring the same (or similar) temporal pattern(s).
The methodology in paper [Reference Che and Gamba12] was applied to S1 data, while in this work, it is tested on CSK or SAOCOM data and compared with the results using S1 for the test area of Cordoba. In all cases, the analysis is carried out considering, for a given temporal sequence, the SAR images and NTL datasets listed in Table 1.
With regard to the CSK data, preliminary analyses made it possible to verify that by using at least two SAR images per year a result unaffected by errors due to speckle noise can be obtained. The results for years 2012–13, 2013–18, and 2018–19 are shown in the following figure.
For each of the clusters extracted from these datasets, it is possible to compute the trend of the average values of the SAR and NTL measurements for each year, thus obtaining the typical temporal pattern of each cluster, which in turn allows identifying its behavior. In the following figure, these temporal trends are represented in a 2D graph, where each arrow represents the change in a time interval (each arrow is oriented from the initial situation to the final one). A sequence of arrows of the same color, therefore, represents the temporal pattern over the years of the points that belong to the same cluster and allows us to characterize whether it is an area subject to new constructions (increase in backscattering), demolitions or renovations (decrease in backscattering), and, finally, change of use (increase or decrease in NTLs). The same figure also shows the same sequence of arrows for each cluster from which the average value over the entire image has been subtracted, to reduce the bias due to slight variations in the data (especially SAR) from image to image as a residual effect of calibration and co-registration.
However, in the case of SAOCOM data, for which available data only cover years 2020 and 2021, the results were applied only to this pair of years and allow us to highlight the creation of an area of new buildings, which translates into an increase in σ 0 and a slight increase in NTL values (black arrow highlighted in yellow because it relates to the cluster of this color). The other two clusters instead highlight areas that have essentially no variation (blue and red arrows of practically zero size).
Joint temporal analysis of SAR (S1, CSK, or SAOCOM) and S2/Landsat data
Given the limited spatial characterization of the changes obtained with the SAR + NTL approach, we subsequently focused on characterizing what is possible using the same approach but applied to the combination of SAR and multispectral sensors (S2/Landsat). Since NTL is a one band sensor, substituting it with a multispectral sensor requires to compute an index useful to characterize urban areas from multiple bands. This is nothing new because there are multiple indices in technical literature. A search was, therefore, performed to select the ones who can be applied to both S2 and Landsat data (i.e., using wavelengths that are recorded by both sensors). These indices were computed and compared in the urban test site of Cordoba, checking the results with respect to the ground truth from Planet imagery.
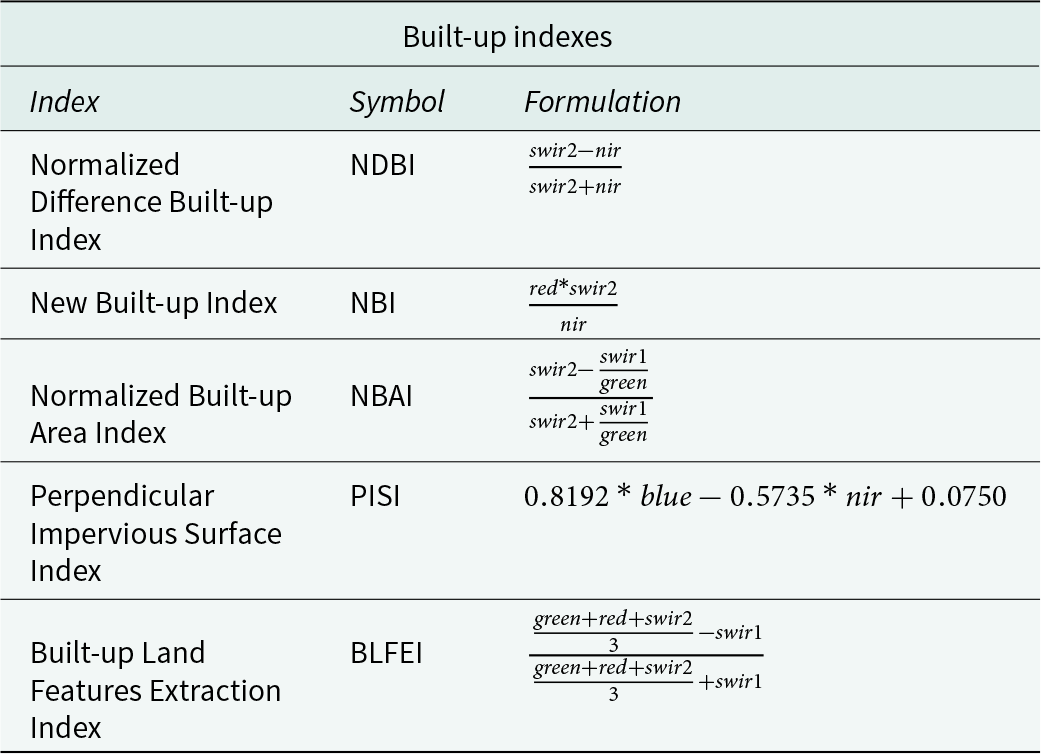
As mentioned, therefore, the selection of a short list of constructed indices was carried out considering the best results identified in the literature review. The final selection is shown in Table 2 where NDBI, NBI, and NBAI were selected based on the analysis carried out in paper [Reference Kebede, Hailu and Suryabhagavan14], while Perpendicular Impervious Surface Index (PISI) and Built-up Land Features Extraction Index (BLFEI) were taken into consideration starting from the research reported in paper [Reference Kaur and Pandey16]. Each index in this list was selected under the condition that it can be implemented using both Landsat and Sentinel-2 data and that it allows the urban area to be extracted with a sufficiently high overall accuracy.
Formulation of the different indices used to verify their effectiveness in mapping urban areas
The definitions of these selected multispectral indices are given below:
• NDBI can enhance information about built-up land from remote sensing images. The NDBI can be used to extract impervious surfaces from urban areas. It utilizes the difference and the ratio of the second SWIR (SWIR2) and NIR bands to highlight built-up areas. It is ratio-based to mitigate the effects of terrain illumination differences as well as atmospheric effects.
• NBI was proposed by observing the spectral response of different land covers in the surface reflectance value of visible red (RED), NIR, and SWIR2 bands. Since the spectral response of barren land is greater than the other land covers in the previous bands, the index is defined according to the formula in Table 2.
• NBAI was designed by paper [Reference Waqar, Mirza, Mumtaz and Hussain20] to extract bare soil and built-up area from Landsat imagery. To delineate the impervious surface, the surface reflectance value of the visible green (GREEN), first SWIR (SWIR1), and SWIR2 bands were used.
• PISI was designed as a convenient index for distinguishing between soil and built-up areas as well as between vegetation and built-up areas. The derivation of the PISI is based on the determination of the reference line according to the concept of a perpendicular index. Points above the reference line belong to vegetation or soil and points below belong to built-up areas. The PISI includes only NIR and the surface reflectance value of the visible blue band, and it can be used with a wide range of data from spaceborne sensors.
• BLFEI has been introduced for barren and built-up surfaces, excluding the use of the NIR band. Built-up areas were observed to have high reflectance values for SWIR1 and SWIR2 and low values for RED and GREEN wavelengths in the electromagnetic spectrum. This index, therefore, shows the highest values for water, followed by built-up and vegetated surfaces. The use of the entire visible (RED and GREEN) and SWIR (SWIR1 and SWIR2) bands of the electromagnetic spectrum strengthens the calculation formula of the BLFEI index. The index also allows for improved spatial detail such as airports and roads compared to other built-up area extraction indices.
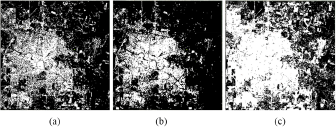
Table 3 and Fig. 6 show the results of the urban area extent extraction using different indices and the corresponding accuracy values. Note that, while the figure presents the extraction results of the urban area only for some indices, the table reports the quantitative evaluation for many more, to indicate the level of analysis that was performed before proceeding. For all indices, the numbers refer to extraction using S2 data for 2019 and 2022, but Landsat 8 data for 2017, a year for which there appear to be no S2 data with few clouds over the area of Cordoba.
Quantitative analysis (measured through the OA and k indices) of the extraction of the urban area extents for the city of Cordoba (Argentina) using indices based on multispectral data from the Sentinel-2 and Landsat 8 and considering the years 2017, 2019, and 2022 to verify the temporal consistency of the results. The comparison shoes that the best results are those obtained using the BLFEI index
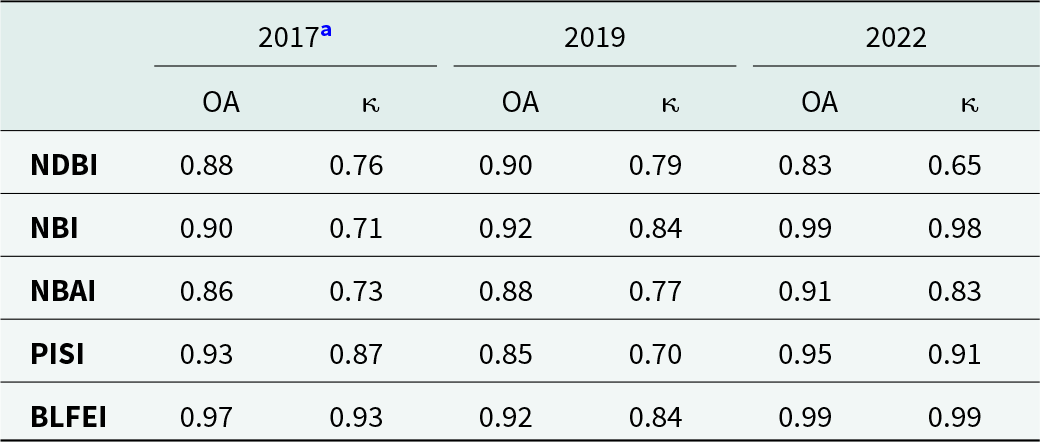
a Landsat 8 data.
Urban area extraction results for the city of Cordoba starting from S2 data in 2022 and using the (a) NDBI, (b), NBI, and (c) NBAI indices.
Once the best performing index (the BLFEI index) had been selected, the subsequent work was aimed at understanding what results could be obtained using Landsat and/or S2 multispectral data in conjunction with CSK or SAOCOM data. In this case, the approach with NTL data, whose framework is graphically represented in Fig. 2, needs to be changed into the one in Fig. 7, where “multispectral index” corresponds to BLFEI.
Summary diagram of the analysis procedure used to consider SAR data (where SAR means S1, CSK, or SAOCOM data) and the Built-up Land Features Extraction Index (BLFEI) obtained from Landsat or Sentinel-2 data.
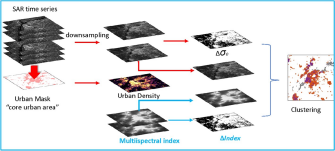
In this case, together with the permanent urban pixels during the years 2017, 2019, and 2022, the values of the BLFEI index were used starting from the analysis of the SAR data. Considering that the value of this index is indicative of a variation in the composition of the surface material and, therefore, is more correlated to the SAR data than the NTL data, in this case short-term variations are not significant, especially considering that Cordoba is not a rapidly expanding urban area. Therefore, instead of extracting a temporally detailed sequence of variations like the one reported in the previous section, the temporal framework of analysis was split into two phases, the period 2017–2019 and the period 2019–2022. For each time interval, the CSK and the BLFEI indices relating to the starting and ending dates of the period (e.g., from 2017 to 2019) are considered as input to the clustering operation. Using such data, it is possible to obtain a map of the change values for the CSK backscattering and a map of the change values of the BLFEI index on the same two dates.
The results are represented graphically in Fig. 8 for an analysis carried out at the spatial resolution of 500 m, therefore comparable to that of the result using SAR and NTL, where each arrow corresponds to the variation of the average value of the backscatter (HV polarization) and the index BLFEI from the beginning to the end of the period. The clusters are therefore distinguished by their temporal pattern in each time interval and, in this case, by the succession of two arrows representing the changes in the two considered intervals (2017–2019 and 2019–2022).
Sequences of changes in the case of four clusters extracted in the period 2017–2019 and 2019–2022 using CSK data and the BLFEI index at a spatial resolution of 500 m.
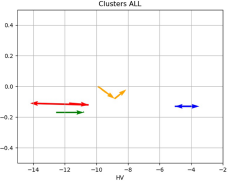
The results in Fig. 8 show that the points assigned to the yellow pattern, which also appear from the graph in the figure to represent a significant change, in fact correspond to changes in the urban fabric, for example linked to the construction of a large new area. Considering that the scale used in this preliminary analysis is 500 m, variations related to changes in a single building, or a few buildings are not detected. This indicates a direction that should be considered for future analyses, in addition to the comparison between what was obtained with these data and the previous results with nighttime lights.
Taking this into account, the same analysis was also carried out at increasingly fine spatial resolutions (from the aggregate data and therefore the result), up to 30 m. This test was performed to verify that the results with BLFEI are in line with those obtained with NTL, when working at the same spatial resolution, and that finer spatial resolutions simply refine the details that can be captured by the proposed technique.
Results obtained at 500 m spatial resolution (comparable with those using NTL data), at 200 m (to have an intermediate case) and at 30 m (the maximum available considering the use of the Landsat data), were then checked to verify their stability as the resolution varied. In other words, it was verified that spatial clusters extracted at 500, 200, and 30 m can each be considered as a spatial refinement of the previous one and not as a degradation of its quality. This comparison is graphically shown in the maps in Fig. 9.
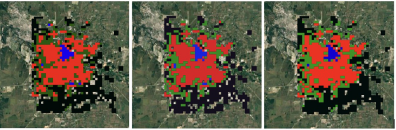
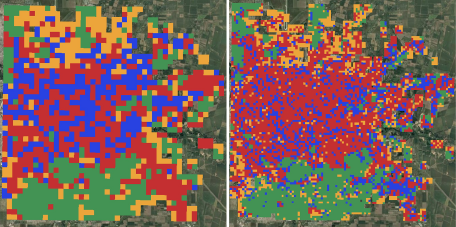
Map of the clusters obtained identified in the period 2017–2019 assuming identification of four different temporal patterns (represented by four different colors) within the urban area of Cordoba and considering different spatial resolutions: (a) 500 m (as in the case of using NTL instead of BLFEI data), (b) 200 m (intermediate case), and (c) 30 m (the maximum resolution possible considering the sensors used in this research, achievable only by considering the BLFEI values).
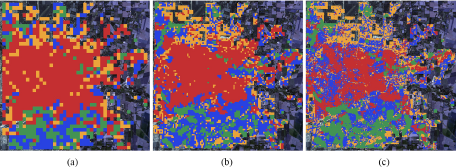
Figure 10 shows four clusters extracted using the proposed procedure. As noted in the caption, the red and green lines represent areas that are basically stable, i.e., no change. Instead, the blue and yellow lines represent areas that have undergone change and specifically two different types of change. In effect, the clustering procedure extracts temporal patterns that are different. As the approach is unsupervised, it is impossible to label these changes, but what we have found is not a binary change/no change map: it is a set of areas that did or did not change but behaved differently over time. Even the “no change” areas are divided into clusters (we can think of “unchanged residential areas” and “unchanged industrial areas,” for example).
(a) Map of the clusters identified in the period 2017–2019 at 500 m resolution using COSMO-SkyMed data together with the BLFEI index (already reported in Figure 9(a)); (b) average trends of the variations of the clusters in the plane of the BLFEI values (abscissae) and of the backscattering of the COSMO data resampled at 500 m (ordinate): it is noted that the blue and yellow clusters identify changes, while the red and green clusters are represented by arrows very similar to a single point.
Beyond a verification of the spatial similarity between clusters at different resolutions, it was also verified that the methodology is capable of distinguishing different temporal patterns, evaluating whether it is possible to extract a common trend for all points of the different clusters. Clusters with more points correspond to areas that have not changed, but it is possible to recognize that smaller clusters correspond to changes, identified through a comparison with Planet data at 3 m. An example of qualitative analysis of the results, obtained by comparison with the Planet images in the study period, is shown in Fig. 11.
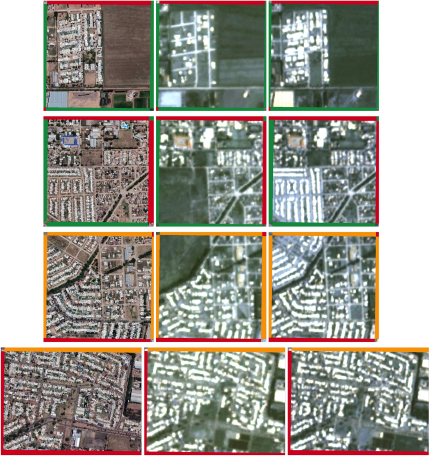
Visual analysis of the change detected by the proposed approach: each row shows VHR images of a small portion of the city of Cordoba as well as Planet images from 2017 and 2019. The selected areas correspond to some of the 500 × 500 m areas identified as belonging to the green (1st and 2nd rows) and yellow clusters (last two rows). It can easily be verified that in all cases the high-resolution images confirm that these areas have undergone changes.
Finally, this same analysis was repeated, as for the SAR and NTL case, using, instead of the CSK data in X-band, the SAOCOM data in L-band, which clustering map is in Fig. 12, and finally the Sentinel-1 data in C-band, Fig. 13. The results, although not identical, confirm that the variations in urban areas can be assessed almost equally using different microwave frequencies, as the dimensions of the buildings are in any case much larger (on average) than those of the wavelengths at the frequencies considered. This is a positive outcome of the research, as it implies that the same procedure can be applied to different sensors, allowing the monitoring of urban areas with a (combined) finer temporal analysis.
Clusters obtained using SAOCOM data and multispectral data for the 2020–2021 interval.
Clusters obtained using Sentinel-1 data and multispectral data for the 2017–2019 interval. Also note in this case the similarity between the result at 200 m spatial resolution (on the left) and that at 30 m (on the right).
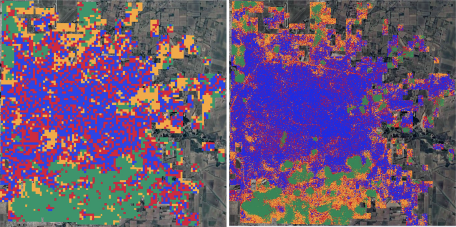
It is important to note in Fig. 12 and Fig. 13 the similarity between the result at 500 m spatial resolution (left) and the one at 200 m (right). It is equally important to note the similarity with results obtained from CSK data, shown in Fig. 5. These are not identical, due to the different sensor, data acquisition methods, and angles of view. Additionally, the difference also arises from the fact that the time interval used in this case is shorter than with the CSK data, as the SAOCOM mission began providing images in 2020.
Conclusions
This paper compares the use of temporal sequences SAR and optical images from different sensors for the task to automatically detect, using an unsupervised procedure, changes in urban areas, and discriminate among different change typologies thanks to their different temporal behaviors.
The work considers SAR data from multiple constellations, at different frequencies and spatial resolutions, as well as different multispectral sensors, i.e., NTL sensors and multispectral (RGB + NIR + SWIR) sensors. The combinations of data recorded by these different sensors show that it is always possible to extract meaningful information about urban changes, and the major constraint is spatial resolution, which, as expected, is very important for urban areas mapping.
Acknowledgements
This work has been funded by the Italian Space Agency via the MultiBigSARData project, grant n. 2021-7-U.0, CUP n. F15F21000250005.
Competing interests
The author(s) declare none.

David Marzi received the M.Sc. and Ph.D. in Electronic Engineering from the University of Pavia, Italy, both earned with honors in 2019 and 2022, respectively. His academic journey included roles as a lecturer in Remote Sensing and researcher at the same institution.
Dr. Marzi took part in several Earth Observation projects supported by important organizations like the Italian Space Agency (ASI), European Space Agency (ESA), and the EU Joint Research Centre (JRC). His research focuses on the comprehensive analysis of multitemporal, multimodal satellite data, leveraging machine learning and deep learning methodologies that are specifically employed to map vegetation land covers, monitor water bodies, and characterize organic croplands. David Marzi has authored and co-authored multiple scientific publications in the field of remote sensing, including several IEEE publications. He is also a frequent presenter at remote sensing and Earth Observation conferences.

Erith Munoz-Rios received the B.S. in Physics, M.S. in Electrical Engineering and Doctor of Engineering degrees from the University of Carabobo, Venezuela, 2007, 2012, and 2023, respectively. He also holds an M.S. degree in Remote Sensing applied to early warning to natural disasters from the National University of Cordoba and the “Gulich” Institute of the National Commission for Spatial Activities, Cordoba, Argentina (2014). He currently works as an international consultant in remote sensing for the Food and Agriculture Organization of the United Nations (FAO) providing technical support to countries in Latin-American and the Caribbean (LAC) in developing their national forest monitoring systems in the context of the UN-REDD+ program. He is mainly interested in research related to fusion of SAR and Optical data, Big Data and Data Analytics for remote sensing, and uncertainties estimations for Earth Observation satellite-derived products.

Antonietta Sorriso received the M.Sc. degree (summa cum laude) in Telecommunications Engineering and the Ph.D. degree in Information Engineering from the University of Naples “Parthenope,” Naples, Italy, in 2015 and 2019, respectively. During her Ph.D., she was a member of the MEG-BioApp Research Unit, Naples, Italy, and her research activities were mainly focused on image and signal processing techniques applied to biomedical imaging, directing her interest toward the analysis of magnetic resonance imaging (MRI) and magnetoencephalography (MEG) data. Since 2019, she is a research fellow at the Department of Industrial and Information Engineering, University of Pavia, Italy. Her research activities are in the field of SAR image processing, with particular emphasis on denoising and urban detection frameworks.

Fabio Dell’Acqua is a full professor of Remote Sensing at the University of Pavia, Italy. He graduated with honors in Electronics Engineering at the University of Pavia in 1996 and obtained his Ph.D. in Remote Sensing at the same university in 1999. In 2000, he was associate researcher at the University of Edinburgh, UK, while in 2001 he obtained a permanent position as an assistant professor at the University of Pavia, Italy. He can now claim more than 25 years of experience in Earth Observation and signal processing. He also taught remote sensing courses at various higher education establishments in Italy and abroad. His research interests focus on the use of remote sensing for agricultural applications and risk management purposes. He took part in several international research projects on these topics.

Paolo Gamba is a professor at the University of Pavia, Italy. He served as Editor-in-Chief of the IEEE Geoscience and Remote Sensing Letters from 2009 to 2013, Chair of the Data Fusion Committee of the IEEE GRSS from 2005 to 2009, and as GRSS President in 2019–2020. He is currently the Editor-in-Chief of the IEEE Geoscience and Remote Sensing Magazine. He was the Technical Chair of the biennial JURSE from 2001 to 2015 and of the 2010, 2015, and 2020 IGARSS conferences. He has been invited to give keynote lectures on several occasions about urban remote sensing and data fusion.


 Open access