

The prevalence of obesity has increased dramatically around the world in the past several decades, and Canada is no exception. Between 1985 and 2003 obesity in Canadian adults increased almost threefold, from 5·6 % to 14·7 %(Reference Katzmarzyk1, Reference Tjepkema2). This trend presents a major public health problem, as obesity is associated with many adverse health outcomes including type 2 diabetes, CVD, musculoskeletal disorders and several cancers(3, Reference Raine4).
There is consensus in the scientific community that obesity is a growing problem and is the result of an increasing energy imbalance, or too much energy (kilojoules) consumed for the amount of energy expended(3, Reference Peters, Wyatt, Donahoo and Hill5–Reference Williamson and Stewart7). The resultant ‘energy gap’ is an important concept for examining obesity because it is a quantitative measure of the potential for weight loss or gain in a population. Although researchers have recently begun to use this concept in population studies of obesity(Reference Brown, Williams, Ford, Ball and Dobson8–Reference Bleich, Cutler, Murray and Adams10), the relative contributions of physical activity v. energy intake to the energy gap now being observed in Western societies remain in dispute. Although a positive energy gap has consistently been observed in a number of studies(Reference Brown, Williams, Ford, Ball and Dobson8–Reference Swinburn, Jolley, Kremer, Salbe and Ravussin12), few authors have attempted to partition out the relative contribution of energy expenditure and energy consumption to the energy gap. This may be due to the methodological challenges of measuring population dietary intakes and physical activity levels reliably over long periods of time(Reference Goran13–Reference Katzmarzyk and Tremblay16). However, using available population-level data, Bleich et al. assessed the energy gap in thirteen developed countries, and concluded that 60 to 100 % of weight gain from the late 1970s to the early 2000s was due to dietary excess(Reference Bleich, Cutler, Murray and Adams10). In a sample of 963 children, Swinburn and colleagues concluded that high total energy intake, rather than low total energy expenditure (including low physical activity), was the main determinant of high body weight(Reference Swinburn, Jolley, Kremer, Salbe and Ravussin12).
The energy gap is also important because it demonstrates how relatively small changes in daily energy intake over time can account for large changes in weight. A modest annual 2 kg weight increase translates into an energy gap of only 185 kJ/d. Researchers have found significant weight gain with an energy gap of only 42 kJ/d(Reference Brown, Williams, Ford, Ball and Dobson8). Given the high energy density and popularity of many convenience and snack foods, achieving a positive energy gap and excessive body fat would not be difficult or implausible.
Clarity regarding the causes of the energy gap is critically important because of the significance this has for the development of public health policies and programmes to stem the rising tide of obesity in Canada and around the world. If it was determined, for example, that the major cause of the energy gap at the population level was insufficient physical activity, then it could be argued that public health programmes addressing the obesity epidemic should focus primarily on increasing the physical activity levels of the population. Conversely, if it was determined that the primary cause of the energy gap was excessive energy intake, then it could be argued that public health programmes to prevent obesity should focus on modifying the nutritional habits of the population. The present study hypothesizes that the dramatic increase in Canadian obesity rates since the mid-1980s has been primarily the result of increased food consumption, rather than decreased physical activity levels of the population.
This ecological study describes the trajectory of the energy gap in the Canadian population from 1976 to 2003, its relationship to the population prevalence of obesity, and provides estimates of the relative contributions of estimated energy availability (EEA) and estimated energy requirement (EER) to the energy gap. This is undertaken for four different scenarios based upon varying assumptions about temporal trends in per capita EER between 1976 and 2003. The study also examines changes that have occurred in Canadian food availability patterns over the study period that may be contributing to observed trends in energy availability. Study conclusions focus on the public health implications of the study results.
Experimental methods
EEA and changes in availability of food commodities for the years 1976 to 2003 were derived from Canadian food balance sheets(17). The list of commodities is too lengthy to report here; for a comprehensive list refer to Food Statistics, 2003(18). These are periodic statistics, collected annually, which give the total quantity of foodstuffs in Canada. The data are compiled using a supply-disposition method, where beginning stocks are determined on 1 January through farm surveys, production/manufacturing reports and import/export data. Ending stocks are measured on 31 December, deducting remaining stocks, exports, manufacturing uses, livestock feed and waste (loss in processing and storage) from the beginning supply(19). The per capita amount of each food item available for human consumption is derived by dividing the total quantity of food by the total population for each year. Although the reported values are adjusted for wastage at the retail, household, cooking and plate levels(19), these numbers may be an overestimation of actual consumption. Food balance sheet data have been shown to be valid, however, for estimating trends in consumption over time for foods, energy and some nutrients(Reference Serra-Majem, MacLean, Ribas, Brule, Sekula, Prattala, Garcia-Closas, Yngve, Lalonde and Petrasovits20, Reference Silventoinen, Sans, Tolonen, Monterde, Kuulasmaa, Kesteloot and Tuomilehto21). Food balance sheets were chosen as a data source for estimating changes in Canadian food consumption patterns since there has been no ongoing surveillance of Canadian dietary intakes through population-based surveys.
Estimates of obesity prevalence rates for Canadian adults (20–64 years of age) were obtained from seven national surveys conducted between 1986 and 2003(Reference Katzmarzyk1, 22, 23). All heights and weights were self-reported. Obesity was defined as BMI of 30 kg/m2 or greater. The moving average filter function in the STATA statistical software package release 9·0 (StataCorp LP, College Station, TX, USA), which uses a weighted moving average of the nearest values in a series, was used to estimate obesity prevalence values between survey years.
The annual per capita EER for the Canadian population was calculated for each year during the study period. The calculated EER used in the present study were derived from the Dietary Reference Intakes (DRI) for energy, for both Canadians and Americans, as set by the Institute of Medicine (IOM)(24). The EER is the average dietary energy required to maintain energy balance in a healthy individual of a defined age, gender, weight, height and physical activity level, and takes into account the energy requirements associated with basal energy expenditure, the thermic effect of food, and needs associated with the deposition of tissues for children and pregnant women, and secretion of milk for lactating women(24). EER levels have been modelled and published for each gender and age group at three levels of physical activity, based on reference-sized individuals(24, 25). These modelled EER calculations were applied to the entire Canadian population structure (ages 0 and up) from 1978 to 2003 on an age- and gender-specific basis(26). This method of calculating average per capita EER over time was undertaken to ensure annual population-level estimates could be compared over the study period without being biased by significant increases or decreases in the size of population groups with unique energy requirements (i.e. the elderly, adolescents). Three scenarios of EER were calculated based upon different physical activity levels (Table 1). Although Canada has a national physical activity guide(27), the recommendations do not translate into a DRI for energy; consequently the present study used the DRI and corresponding physical activity levels derived by the IOM and US Department of Health and Human Services, which are applicable to Canadians(24, 25). For each of the three estimated levels of daily per capita EER (sedentary, moderately active, active), which were assumed to hold constant across the study period, the energy gap (EGap) for each year of the study was calculated by subtracting the estimated daily per capita energy requirement (EER) from the estimated daily per capita energy available (EEA): EGap = EEA − EER.
Estimated energy requirementFootnote * scenarios and associated physical activity levels

* Based on Institute of Medicine, Dietary Reference Intakes macronutrient report, 2005(24).
The assumption of constant energy expenditure throughout the study period was used since physical activity levels appear to have changed minimally since the 1980s(Reference Harnack28, Reference Westerterp and Speakman29). Physical activity surveillance in Canada has been inconsistent, using different survey methodologies and different physical activity thresholds, making it difficult to compare physical activity levels over time(Reference Katzmarzyk and Tremblay16). Nevertheless, the existing data suggest that the proportion of inactive Canadians has decreased slightly over the study period, from 60 % in 1994 to 49 % in 2003. In 2002 only 49 % of Canadians were considered ‘active’ to the equivalent of walking for half an hour or more per day(30). This indicates that the majority of Canadians have been neither sedentary nor active during the study period, suggesting that rates fluctuating around the ‘moderately active’ level scenario are likely the closest to reality. The inactive and active scenarios, however, provide biologically plausible comparators.
To explore the implications that a decreasing trend in daily per capita EER over the study period would have on study results, the energy gap for one additional scenario (moderate physical activity level in 1976 progressing to a sedentary physical activity level by 2003) was calculated. This scenario was chosen because Canadians have increased their use of household entertainment devices during the study period, and use of these devices is linked to sedentary behaviour(Reference Katzmarzyk and Tremblay16). The scenario was computed using a time-weighted average of the moderate and sedentary scenario values for annual per capita daily EER, with 100 % of the weight given to the moderately active scenario input values in 1976 (and 0 % weighting given to the sedentary scenario input value) decreasing progressively in linear fashion to 0 % weighting of the moderately active scenario input value by 2003 (with 100 % weighting given to the sedentary scenario input value). The energy gap for this fourth scenario was calculated as above by subtracting the daily per capita EER from the daily per capita EEA.
The relationship of the four estimates of annual per capita daily EER to annual per capita daily EEA was assessed by visually plotting temporal trends. The relationships of per capita daily EEA, and the four scenario-based energy gaps, to the population prevalence of obesity were also assessed visually by plotting temporal trends, and analytically through regression analysis (Pearson’s R) using STATA release 9·0. All regression calculations were adjusted for the potential effect of serial autocorrelation in the data, using Newey West standard error correction, and were restricted to the years 1986 to 2003 (the year range for which obesity data were available).
The relative contributions of EER (proxy for physical activity) and EEA (proxy for energy consumption) to the change in the energy gap observed over the study were determined. This was accomplished by calculating the change in the annual per capita EER and annual per capita EEA between 1976 and 2003 for each of the four scenarios and dividing these into the total change in the energy gap that occurred between 1976 and 2003.
Changes in food availability patterns over the study period were determined by rank ordering food commodities from Canadian food balance sheets by changes in energy over the study period, in order to identify individual food items making the largest contributions to changes in energy available between 1976 and 2003.
Results
Table 2 summarizes the changes in the annual rates of adult obesity, annual per capita daily EEA and annual per capita daily EER, and the resulting energy gaps. As shown, the estimated average per capita EEA increased from 9837 kJ in 1976 to 11 581 kJ in 2003, an 18 % increase. Over this same time period, the average per capita daily EER for the sedentary, moderately active and active scenarios remained relatively constant, while the per capita daily EER for the moderate→sedentary scenario fell by 891 kJ. In 2003, all EER scenarios were observed to have a significant energy gap, ranging from 1737 to 3868 kJ. Between 1985 and 2003, the estimated rates of adult obesity increased from 5·6 % to 14·9 %.
Adult obesity (BMI ≥ 30 kg/m2) prevalence (1985–2003), daily per capita estimated energy availability (EEA), estimated energy requirement (EER) and energy gap (1976–2003): 3-year intervals
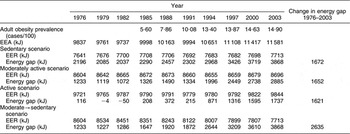
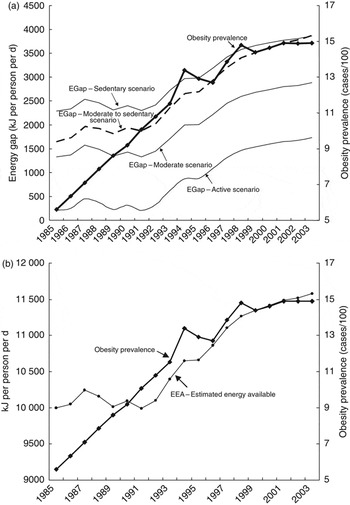
Figure 1 illustrates the widening gap between per capita EEA and the four EER scenarios between 1976 and 2003. The energy gaps for all scenarios increased during the study time frame, from 1621 kJ/d in the active scenario to 2635 kJ/d in the moderate→sedentary scenario. Figure 2a and 2b superimpose the per capita daily energy gap for all four scenarios, and the per capita daily EEA, against the adult obesity rate. As illustrated, all variables exhibited a significant upward trend over time, with an apparent positive temporal relationship between the four energy gap trend lines, per capita EEA and adult obesity. This visual impression is confirmed by the results of correlation analysis, which found strong and significant relationships between all predictor variables and obesity prevalence (Pearson R values ranged from 0·90 to 0·92, P < 0·0001).
Per capita daily estimated energy availability (EEA) and four per capita daily estimated energy requirements (EER) scenarios (1976–2003)

(a) Energy gap (EGap) for four physical activity scenarios and adult obesity (BMI ≥ 30 kg/m2) prevalence (1985–2003); (b) per capita daily estimated energy availability (EEA) and adult obesity (BMI ≥ 30 kg/m2) prevalence (1985–2003)
In the sedentary, moderately active and active scenarios very small changes in per capita daily EER were observed between 1976 and 2003 (Fig. 1). As a result, approximately 100 % of the increase in the energy gap observed in these scenarios can be attributed to an increase in energy consumption (and 0 % attributed to a change in physical activity). In the scenario where physical activity was assumed to have decreased from moderate to sedentary levels between 1976 and 2003, per capita energy requirements decreased by 891 kJ and the energy gap increased by 2635 kJ. Of this 2635 kJ increase, 67 % (1765 kJ) was due to increased EEA between 1976 and 2003, while 33 % (870 kJ) was due to a decrease in EER (decreased physical activity).
Between 1976 and 2003, the availability of most food commodities did not increase or decrease appreciably; however, a small number of food commodities did change significantly. As illustrated in Fig. 3, just seven food commodities (salad oils, wheat flour, soft drinks, shortening, rice, chicken and cheese) were responsible for increasing the per capita daily EEA by 1842 kJ over the study period, accounting for more than 80 % of the total increase in per capita EEA. Salad oils, wheat flour and soft drinks were responsible for over half the observed increase in kilojoules. The availability of five food commodities (beef, butter, fluid milk, margarine and eggs) decreased substantially over the same time, accounting for over 95 % of the total decrease in energy consumption in foods experiencing a drop between 1976 and 2003.
Major foods contributing to net per capita energy availability (1976–2003). Source: Statistics Canada, Agriculture Division(18)

Discussion
The present study has demonstrated that both per capita daily energy availability and the per capita daily energy gap in the Canadian population have increased significantly between 1976 and 2003, with the greatest increases occurring after the mid-1980s. The study has also shown that these increases are temporally related to the increase in the rates of adult obesity in Canada. Evidence also indicates that the widening energy gap is being driven primarily by increasing energy availability (proxy for energy consumption) and not by decreasing energy requirements of the population. In the three EER scenarios (sedentary, moderately active, active physical activity levels; see Table 1), which assumed a constant per capita daily EER between 1976 and 2003, 100 % of the increase in the energy gap was estimated to be due to an increase in per capita daily EEA. In the fourth scenario which assumed that individuals became more sedentary between 1976 and 2003, the majority of the increase in the energy gap (two-thirds) was still accounted for by an increase in per capita daily EEA.
These results are consistent with those from Harnack et al. and Jeffery and Harnack, which showed that energy availability in the US food supply increased by 15 % between 1970 and 1994(Reference Harnack, Jeffery and Boutelle31) and by 22 % between 1982 and 2004(Reference Jeffery and Harnack32). Results are also consistent with Bleich and colleagues, who have modelled the fraction of obesity due to energy in and energy out for a number of developed countries(Reference Bleich, Cutler, Murray and Adams10). They concluded that physical activity in Canada did not change appreciably from 1990 to 2001, and 100 % of the attributable fraction of obesity was due to energy in rather than energy out. Jeffrey and Linde also concluded that decreasing intentional energy expenditure, i.e. physical activity, is unlikely to be the primary cause of recent increases in population obesity since the majority of human energy requirements are non-modifiable, with 60–80 % of energy intake required to maintain temperature homeostasis and basic metabolic functions(Reference Jeffery and Linde33). They argue that since most industrialized populations were already relatively sedentary at the beginning of the obesity epidemic, it is unlikely that substantial decreases in intentional energy expenditure have occurred in the past 20 years(Reference Harnack28). Recent research also suggests that more than 60 min of moderate to intense physical activity is required per day to sustain modest weight loss, a goal that may not be attainable given the busy nature of modern lifestyles(Reference Jakicic, Marcus, Lang and Janney34).
Most interestingly, the current study demonstrates that a relatively small cluster of food commodities is driving increased food availability in Canada. Fats and oils are major ingredients in many sweet baked goods (e.g. pastries, doughnuts, cookies and cakes), prepared convenience foods (e.g. breaded deep-fried foods, frozen/prepared meals and side dishes, frozen pizzas/pizza pockets and salad dressings), potato chips and other salty snacks, French fries and other deep-fried fare. Shortening is used both by the processed food industry to extend the shelf-life of foods and the fast-food industry for deep-frying. Wheat flour, primarily the white refined version, is also a main ingredient in many of these foods. Increased rice consumption may be reflective of immigration patterns. In 1971, 4 % of Canadian immigrants came from Asia, where rice is a staple; by 2001 this had risen to 37 %(35). Chicken has displaced beef to some degree; it is also a popular fast-food item, frequently breaded and deep-fried. Cheese is a main ingredient in many commercially prepared foods such as pasta dishes, hand-held pizza pockets and pizza, which represent the fastest-growing sub-sector in the Canadian fast-food market(Reference Harris36). Soft drinks are a major source of simple carbohydrates in the form of high-fructose corn syrup and are a staple in the diets of many children and adults(Reference Jacobson37, Reference Rampersaud, Bailey and Kauwell38). These foods are frequently consumed synergistically, contributing to increasing per capita energy consumption.
The results of the study are consistent with the observation that Canadians are inhabiting an increasingly obesogenic food environment characterized by readily available energy-dense foods and promotion of excessive food intake(Reference Swinburn, Egger and Raza39–Reference French, Story and Jeffery41). Sales of ready-to-eat commercially prepared meals and snack foods doubled between 1990 and 2003, and these products are available at an astonishing number of outlets(42–Reference Zafiriou44). Consumption of foods prepared outside the home, either in restaurants or as takeaway fare, has increased significantly over the last two decades(45). One example of these trends has been the proliferation of the Tim Horton doughnut franchise in Canada, which grew from fifty-two restaurants in 1977 to 3359 restaurants in 2007(46). Underlying these trends are a lack of time to prepare food, women working outside the home, waning food preparation skills and aggressive promotion of low-nutrition foods, in particular to children(42, Reference Jaffe47, Reference Gantz, Schwartz, Angelini and Rideout48). These trends are predicted to continue into the future(42, 49).
Our study has a number of limitations which must be taken into account when interpreting its results. First, despite new methods to model ‘consumed’ data, food balance sheets report food amounts and energy values that may still not account for total wastage. Further, values are derived on a per capita basis using the entire Canadian population in any given year, making it impossible to estimate consumption for subsets of the population based on, for example, age or gender. Second, while estimated energy requirements used in the study were calculated using body weight, estimated energy available was not, and may result in an underestimation of the energy gap for overweight and obese Canadians, who make up a significant portion of the population. Finally, the results of this ecological study cannot be used to suggest direct causation between Canadian food consumption patterns and obesity. Data from food balance sheets are valid, however, for examining trends in energy intake over time. The data are collected in a consistent manner and provide an objective measure of food availability for a given population. Representative studies of individual food and nutrient intakes and energy requirements are warranted to further illuminate the complex aetiology of obesity in the Canadian population. Results are, however, consistent with previous studies showing similar trends in per capita energy supply and obesity in other industrialized countries(Reference Silventoinen, Sans, Tolonen, Monterde, Kuulasmaa, Kesteloot and Tuomilehto21, Reference Harnack, Jeffery and Boutelle31, Reference Jeffery and Harnack32).
The study has significant public health implications for addressing the obesity epidemic in the Canadian population. As study results suggest, the increases in obesity observed over the past several decades appear to be primarily due to increased energy consumption and minimally due to decreasing physical activity. This means that public health policy and programme decision makers must resist the argument of the food industry that increasing population obesity rates have little to do with overconsumption of their products and more to do with consumer physical inactivity (i.e. obesity is ‘about the couch and not the can’)(Reference Severson50). Obesity prevention initiatives should therefore have a strong nutritional focus with the objective of decreasing energy consumption at the population level. This does not diminish the need to promote physical activity, which has a clearly demonstrated role in the prevention and treatment of obesity and chronic illness(51, 52). Increasing physical activity, in conjunction with decreased energy intake in overweight and obese individuals, has been demonstrated to promote and maintain weight loss in addition to other health benefits(Reference Jakicic, Marcus, Gallagher, Napolitano and Lang53, Reference Lee, Folsom and Blair54). The results of the present study suggest, however, that obesity prevention efforts will have a low chance of success if they focus primarily on increasing physical activity without addressing the issue of increasing energy consumption. This will not be an easy task given the strength and trajectory of the modern food system and current consumer nutritional habits. However, public health professionals can play an important role by advocating for policies that reduce the impact of the obesogenic environment. Two comprehensive strategies have been put forth by WHO and the American Heart Association (AHA). The WHO’s global strategy on diet, physical activity and health(55) and the AHA’s population-based prevention of obesity(Reference Kumanyika, Obarzanek and Stettler56) both advocate for multi-sectoral, population-based approaches including environmental support for healthy diets through the creation of public policies that promote the availability and accessibility of low-fat, high-fibre foods which minimize the overconsumption of energy. Story and colleagues(Reference Story, Kaphingst, Robinson-O’Brien and Glanz57) have delineated a similar series of policies and environmental approaches that support healthy food and eating environments. Public health professionals also need to advocate for further research into the Canadian dietary pattern and its relationship to larger social and economic forces in order to design and implement realistic solutions urgently required to address escalating population obesity.
Acknowledgements
The work was performed at the University of Manitoba. J.S. would like to thank the Manitoba Health Research Council, Canadian Institutes of Health Research/International Centre for Infectious Diseases doctoral training programme and the University of Manitoba for financial support during the writing of this manuscript. The authors declare that they have no competing interest. Each author has had intellectual and practical contribution to this article.


