


Introduction
Weed control on amenity hard surfaces is implemented to mitigate potential damage to the structure of the surface material caused by roots; for aesthetic purposes; and for issues associated with health and safety, for example, impeding walking or visibility within transport infrastructure (Shepherd and Heather Reference Shepherd and Heather1999). Multiple methods for weed control on hard-surface areas are available; however, dependence on synthetic herbicides (particularly glyphosate) remains, driven by ease of application and low cost (Kempenaar and van Dijk Reference Kempenaar and van Dijk2006).
Glyphosate use and authorization initially received attention due its detection along with the secondary metabolite, aminomethylphosphonic acid (AMPA, CH6NO3P), in surface water and groundwater, with a key source being from hard surfaces (Kristoffersen et al. Reference Kristoffersen, Rask, Grundy, Franzen, Kempenaar, Raisio, Schroeder, Spijker, Verschwele and Zarina2008; Shepherd and Heather 1999). Detection is further reported in soil and air (Agostini et al. Reference Agostini, Dettogni, dos Reis, Stur, dos Santos, Ventorim, Garcia, Cardoso, Graceli and Louro2020; Kanissery et al. Reference Kanissery, Gairhe, Kadyampakeni, Batuman and Alferez2019). Concerns have also been raised over the impact of glyphosate on human health, particularly with respect to its carcinogenicity and mutagenicity (Panzacchi et al. Reference Panzacchi, Tibaldi, De Angelis, Falcioni, Giovannini, Gnudi and Mandrioli2025; Torretta et al. Reference Torretta, Katsoyiannis, Viotti and Rada2018), although current data does not lend itself to firm conclusions. The Pesticide Properties DataBase (PPDB 2025) reports acute oral mammalian toxicity as low (rat acute oral LD50 >2,000 mg kg⁻1), the World Health Organization (WHO) handling Classification (WHO 2020) as III (“slightly hazardous”), and the Threshold of Toxicological Concern (Cramer Class) (Cramer et al. Reference Cramer, Ford and Hall1978) as III (high). The Pesticide Action Network UK (2025) describes glyphosate as “highly hazardous.” Concerns over health and safety associated with the widespread application of herbicides in urban amenity areas have resulted in local authorities attempting to adopt alternative methods of weed control.
Approval for the continued use of glyphosate in the European Union (EU) remains until 2033 under Commission Implementing Regulation (EU) 2023/2660 of 28 November 2023, but there is no guarantee it will be approved further beyond this date. Legislative drivers of changing methods to weed control have included the Water Framework Directive (WFD) 2000/60/EC (European Parliament 2000). This required that all water bodies in each member state (MS) were classed as being “good ecological status” by 2021 with full compliance by 2027. The need to protect water courses and groundwater, concerns over health and safety coupled with a drive to prevent herbicide resistance means amenity herbicide use has become increasingly restricted within Europe (Cederlund Reference Cederlund2017; Kristoffersen et al. Reference Kristoffersen, Rask, Grundy, Franzen, Kempenaar, Raisio, Schroeder, Spijker, Verschwele and Zarina2008).
The behavior of glyphosate on hard surfaces in the amenity sector is driven by the surface runoff pathway rather than by leaching, which is more typical in agriculture. As such, the impact of the active ingredient is realized when movement across the hard surface reaches the receptor site. If this is a sensitive habitat, for example, surface water, then there is a risk of exposing fauna or flora present to glyphosate or, more importantly, AMPA entering the medium. The risk to fauna or flora is a function of the application rate, timing, and precipitation postapplication (Revitt et al. Reference Revitt, Ellis and Llewellyn2002). Okada et al. (Reference Okada, Allinson, Barral, Clarke and Allinson2020) note that glyphosate and AMPA were more frequently detected in urban (79% to 97%) compared with rural watercourses (4% to 6%) with mean glyphosate concentrations as high as 1.8 ± 2.2 μg L−1. Glyphosate can also enter the aquatic environment through wastewater treatment works discharges, combined or separate sewers, or incorrect disposal into drains, although Kempenaar et al. (Reference Kempenaar, Lotz, van der Horst, Beltman, Leemans and Bannin2007) estimate that this accounts for approximately 2% of inputs to rivers and 1% to estuaries. More than 90% of AMPA (up to 22 t yr−1) globally enters the aquatic environment from the degradation of phosphonates during wastewater treatment. There is increasing evidence of the need to moderate the application of herbicides in urban amenity areas and avoid application where there is a risk to surface water through runoff. One such method is to spatially target alternative nonchemical/zero-herbicide weed control methods as part of an integrated weed management (IWM) strategy so that the risk to non-target habitats is minimized.
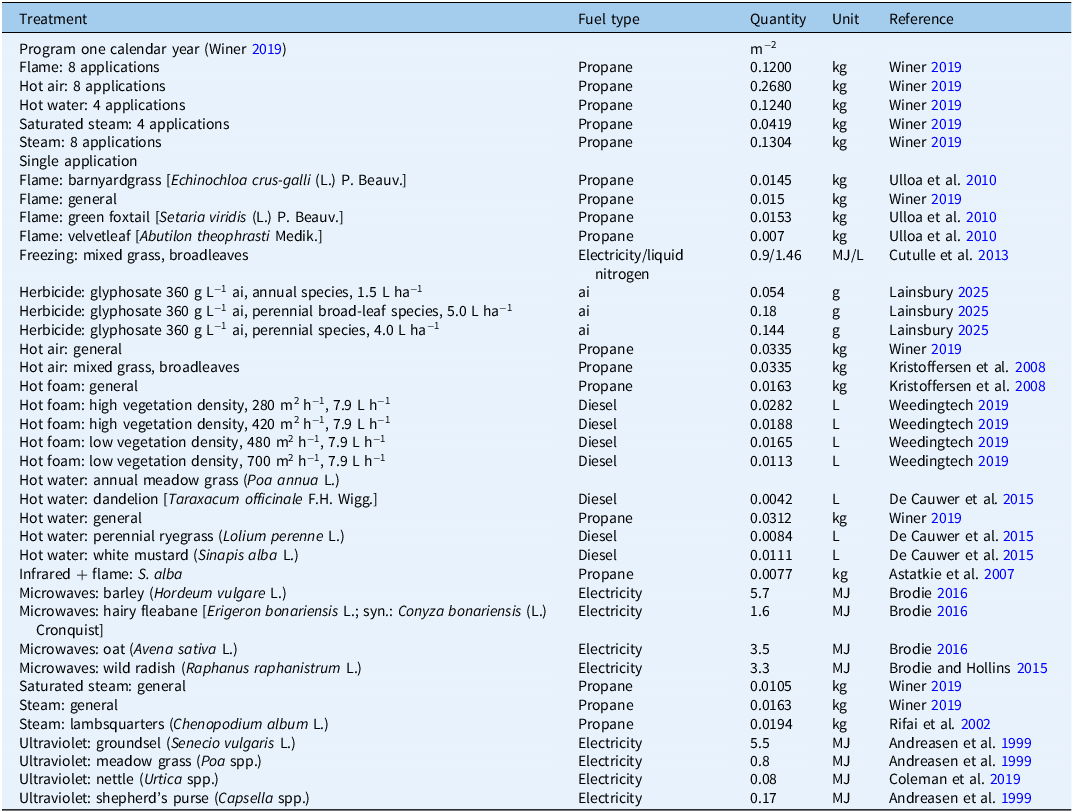
IWM applies multiple weed control methods, including preventive, monitoring, cultural, mechanical, and targeted chemical (Harker and O’Donovan Reference Harker and O’Donovan2013; Matzrafi et al. Reference Matzrafi, Blank and Lati2025). These methods are used in combination with the aim of reducing the quantity of herbicide applied rather than eliminating its use overall. A variety of zero-herbicide weed control measures exist (Antonopoulos et al. Reference Antonopoulos, Kanatas, Gazoulis, Tataridas, Ntovakos, Ntaoulis and Travlos2023; Bauer et al. Reference Bauer, Marx, Bauer, Flury, Ripken and Streit2020; Winer Reference Winer2019), their effectiveness being a function of the target weed species and its morphological characteristics, which have implications for both fuel consumption, operative hours, and cost per unit of area treated. The fuel consumption (fossil resource depletion) allocated to individual methods (Andreasen et al. Reference Andreasen, Hansen and Streibig1999; Brodie Reference Brodie2016; Brodie and Hollins Reference Brodie and Hollins2015; Brodie et al. Reference Brodie, Ryan and Lancaster2012; Coleman et al. Reference Coleman, Stead, Rigter, Xu, Johnson, Brooker and Walsh2019; Weedingtech 2019; Winer Reference Winer2019) are summarized in Table 1.
Fuel consumption per square meter attributed to different weed control methods.

Methods that consume more fuel conflict with the aims of the UK Sixth Carbon Budget to restrict UK greenhouse gas (GHG) emissions to 965 million tCO2eq in total under Article 2 of the Carbon Budget Order 2021 (GOV.UK 2021a) and demonstrate the need to identify methods or method combinations with a minimal overall environmental impact.
Life-cycle assessment (LCA) is a robust standardized method to quantify environmental impact (Guinée et al. Reference Guinée, Gorrée, Heijungs, Huppes, Kleijn, De Koning, Van Oers, Wegener Sleeswijk, Suh, Udo de Haes, De Bruijn, Van Duin, Huijbregts and Guinée2002). It was applied to a series of hard-surface weed control trials conducted in Thanet, southeast England. This study tested the hypothesis that no difference in environmental impact existed between different weed control programs while weed levels were below acceptable predefined thresholds. It aimed to: (1) quantify the inputs required by different weed control methods/combinations of methods to maintain weed levels below target thresholds; (2) determine the environmental impact of these methods/combinations of methods using an LCA methodology; and (3) identify effective weed management programs with low environmental impacts. Three weed control programs consisting of methods available for use in amenity areas were evaluated: (1) herbicide only (glyphosate), (2) IWM (maximum 50% glyphosate + mechanical and/or thermal), and (3) zero herbicide (mechanical and/or thermal only). The results are discussed in the context of minimizing the environmental impact of weed control on hard surfaces.
Materials and Methods
LCA
The LCA method of Guinée et al. (Reference Guinée, Gorrée, Heijungs, Huppes, Kleijn, De Koning, Van Oers, Wegener Sleeswijk, Suh, Udo de Haes, De Bruijn, Van Duin, Huijbregts and Guinée2002) conforming to ISO 14040:2006 (ISO 2006) (reviewed 2022), ISO/TS 14074:2022 (ISO 2022), and PAS 2050 (BSI 2011) evaluated three weed control strategies on amenity hard surfaces in Thanet, UK. The LCA consisted of four stages: (1) boundary and baseline setting; (2) emissions inventory; (3) characterization of impacts; and (4) interpretation.
Boundary and Baseline Setting
Three weed control programs were applied separately to hard surfaces (pavements/walkways) totaling 18.8 to 21.7 km in length over 3 yr within nine urban residential areas: (1) standard herbicide method, glyphosate full recommended application rate (Year 1: Roundup® Probiactive 450, 2.8 L ha−1, 450 g ai L−1; Years 2 and 3: Roundup® ProVantage, 2.25 L ha−1, 480 g ai L−1; Monsanto UK Ltd, 1020 Cambourne Business Park, Great Cambourne, Cambourne, Cambridge CB23 6DW, UK) by knapsack sprayer; (2) IWM, no more than 50% of the total glyphosate rate of that applied to the glyphosate-only treatment, together with a combination of mechanical brushing (Kersten® Weedbrush, Kersten UK Ltd, Progress House, 39 Boulton Road, Reading RG2 0NH, UK), thermal application with flame (ThermHit® 75 and ThermHit® 15, Kersten UK Ltd), and thermal by hot foam (Weedingtech® MW Series, Unit 3, Fortune Way, Triangle Business Estate, London NW10 6UF, UK); and (3) zero-herbicide regime with combinations of mechanical brushing, thermal by flame, or thermal by hot foam. Brushing, flame, and hot foam were selected as the methods most available and practical for use by local authorities at the time of the study as an alternative to glyphosate. As the study evolved, the flame and brushing methods were replaced by hot foam due to greater efficiency and bystander and operator safety. One of the three weed control methods was assigned randomly to one of the zones in each of nine urban residential blocks, resulting in nine zones for each treatment. Within each block there was a consistency in landscape, that is, type of hard surface (asphalt or slabs)/presence or absence of grass verges, to ensure that the three weed programs had the same characteristics. A fourth case study consisting of 3 km of amenity hard surfaces in Thanet, UK, applied hot foam only during September for 1 yr.
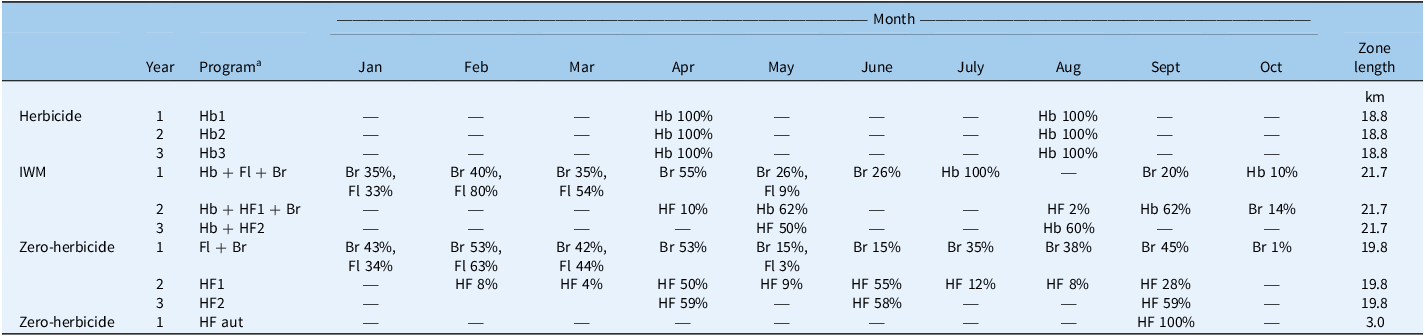
Within each treatment plot (nine zones per program), one street was chosen for detailed analysis of weed growth for each of the 3 yr evaluated. On each pavement, four sampling points were located, two on each side of the street. Areas not typical of the street were ignored (e.g., areas of slab paving repaired with tarmac). Each sampling point was chosen randomly, with quadrats positioned on the pavement at the curb edge, at the house edge (i.e., opposite the curb), in the middle of the pavement, and in the gulley (i.e., adjacent to the pavement on the road). Each quadrat was divided into 5 by 5 cm subdivisions. The curb, house edge, and gulley quadrats (1 by 0.25 m, 100 square subdivisions) were placed linearly parallel to the pavement flush with the edge. The middle of pavement quadrat (1 by 1 m, 400 square subdivisions) was randomly aligned in the center of the pavement. Weed coverage was calculated by visually determining the area of each subdivision containing live weeds and then converting these to a percent cover. This was completed at monthly intervals (February to November); a total of 3,888 quadrats per year. The percent weed cover data were angular transformed before an ANOVA statistical test was performed. All the weed species within each quadrat were identified on three occasions, representing spring, summer, and autumn. Grass weeds other than annual meadow grass (Poa annua L.), and mosses (Bryophyta) and liverworts (Marchantiophyta) were identified to family. Clover or trefoil (Trifolium spp.), cranesbills (Geranium spp.), and willowherbs (Epilobium spp.) were identified to genus. Weed coverage was also assessed visually using the weediness level classification scale (Defra 2015), summarized in Supplementary Tables S1 and S2. For all treatment areas in all zones, weed coverage was assessed at 12 different locations, 8 chosen at random across several roads and 4 coinciding with the random quadrat sampling positions, along approximately 15-m lengths of pavement. Each scenario represents a whole treatment program, that is, multiple treatments applied within a specified treatment zone to maintain weeds at or below acceptable thresholds for one calendar year. The thresholds set a maximum level of permissible weed coverage via the weediness level score table that the local authority used to determine (based on monthly monitoring) the need to apply a treatment in the IWM and zero-herbicide programs. The method of weed control, percent of the trial zone treated in response to monitoring, and the month of application are summarized Table 2.
Weed control method, month of application, and percentage of the total trial zone length treated.

a Hb, herbicide (Roundup® Probiactive 450, 2.8 L ha−1, 450 g ai L−1/Roundup® ProVantage, 2.25 L ha−1, 480 g ai L−1); Fl, flame; Br, brush; HF, hot foam; HF aut, hot foam autumn application.
Herbicide was applied as a standard treatment during April and August in the Hb program. The thermal treatments were applied from January to September; a greater number were required for the zero-herbicide program in response to weed threshold monitoring. The key timings of application for the zero-herbicide methods remained the same; the duration of the treatment and quantity applied varied between years in response to weed thresholds observed during monitoring.
The LCA functional unit was per 1 m2 and included the total area of hard surface (pavements/walkways) within a given treatment zone. Impact categories were derived from the CML database (University of Leiden 2016) and Damiani et al. (Reference Damiani, Ferrara and Ardente2022) and included fossil resource depletion/energy consumption (MJ), GHG emissions (kg CO2eq), eutrophication (kg PO4eq), acidification (kg SO2eq), abiotic resource depletion (kg Sbeq), photochemical ozone creation potential (kg C2H2eq), ozone depletion potential (ODP; kg CFC-11eq), water consumption (m3), terrestrial and aquatic ecotoxicity (kg 1,4-C₆H₄Cl₂eq), and human toxicity (CTUheq). The Pesticide Load Index (PLI) (Rainford et al. Reference Rainford, Tzilivakis, Garthwaite, Jones and Lewis2023; Tzilivakis et al. Reference Tzilivakis, Lewis, Kennedy, Ridley and Garthwaite2026) derived indices for acute and chronic exposure of fish and contact and oral exposure for honeybee (Apis mellifera), representative of aquatic and terrestrial (plant surface) habitats respectively, per kg of herbicide active ingredient applied.
Emissions Inventory
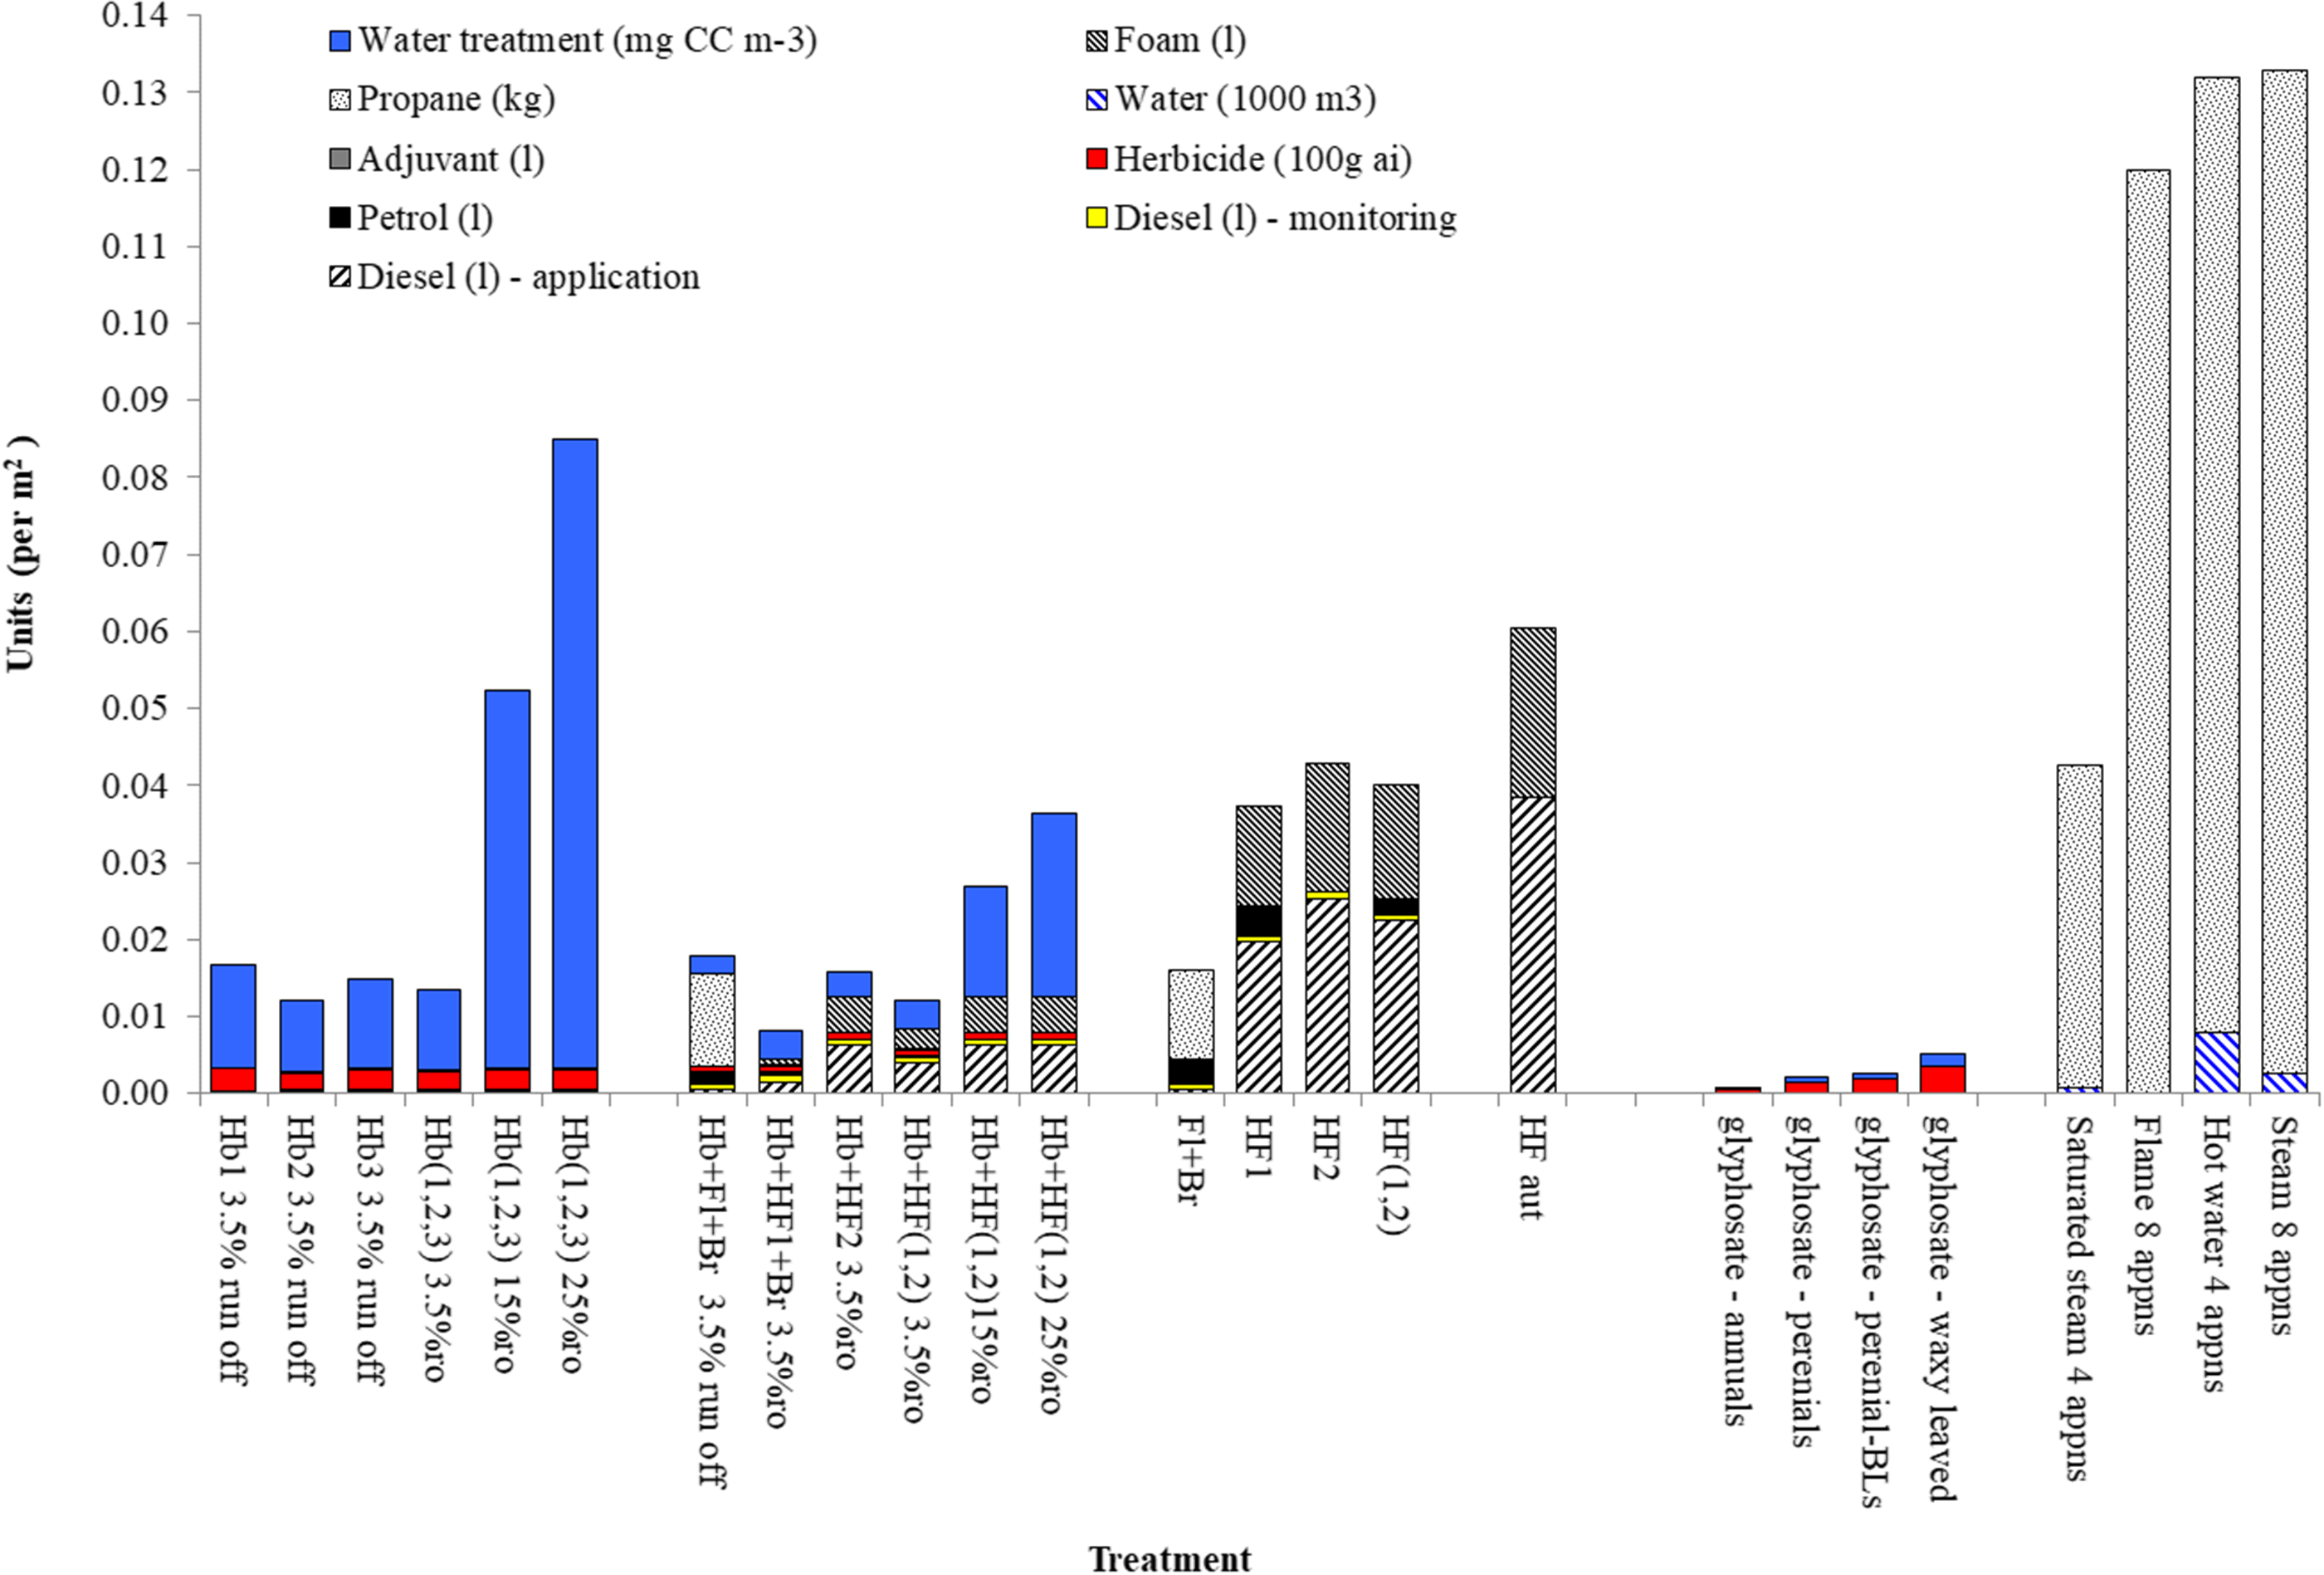
The system inputs for each method and case study (Figure 1) included fuel (diesel, petroleum, propane), water, foam (alkylpolyglycoside/decyloctylglycoside), and herbicide (glyphosate).
System inputs per square meter of hard surface (Thanet trials: herbicide only, integrated weed management (IWM), zero-herbicide, zero-herbicide (autumn)): fuel consumption (L or kg), herbicide - glyphosate (kg ai), adjuvant (L), mains water use (1,000 m3), CC, activated carbon (mg). Br, brush; Fl: flame; Hb, herbicide; HF, hot foam; HF aut, hot foam autumn application; 3.5%, 15%, and 25% removal via surface runoff of total glyphosate applied; perennial-BLS, broadleaf species. Data to the right of the dashed line represent a standard single herbicide application (excluding runoff), various weed types (Lainsbury Reference Lainsbury2025), and other thermal treatments (Winer Reference Winer2019) for comparison purposes.

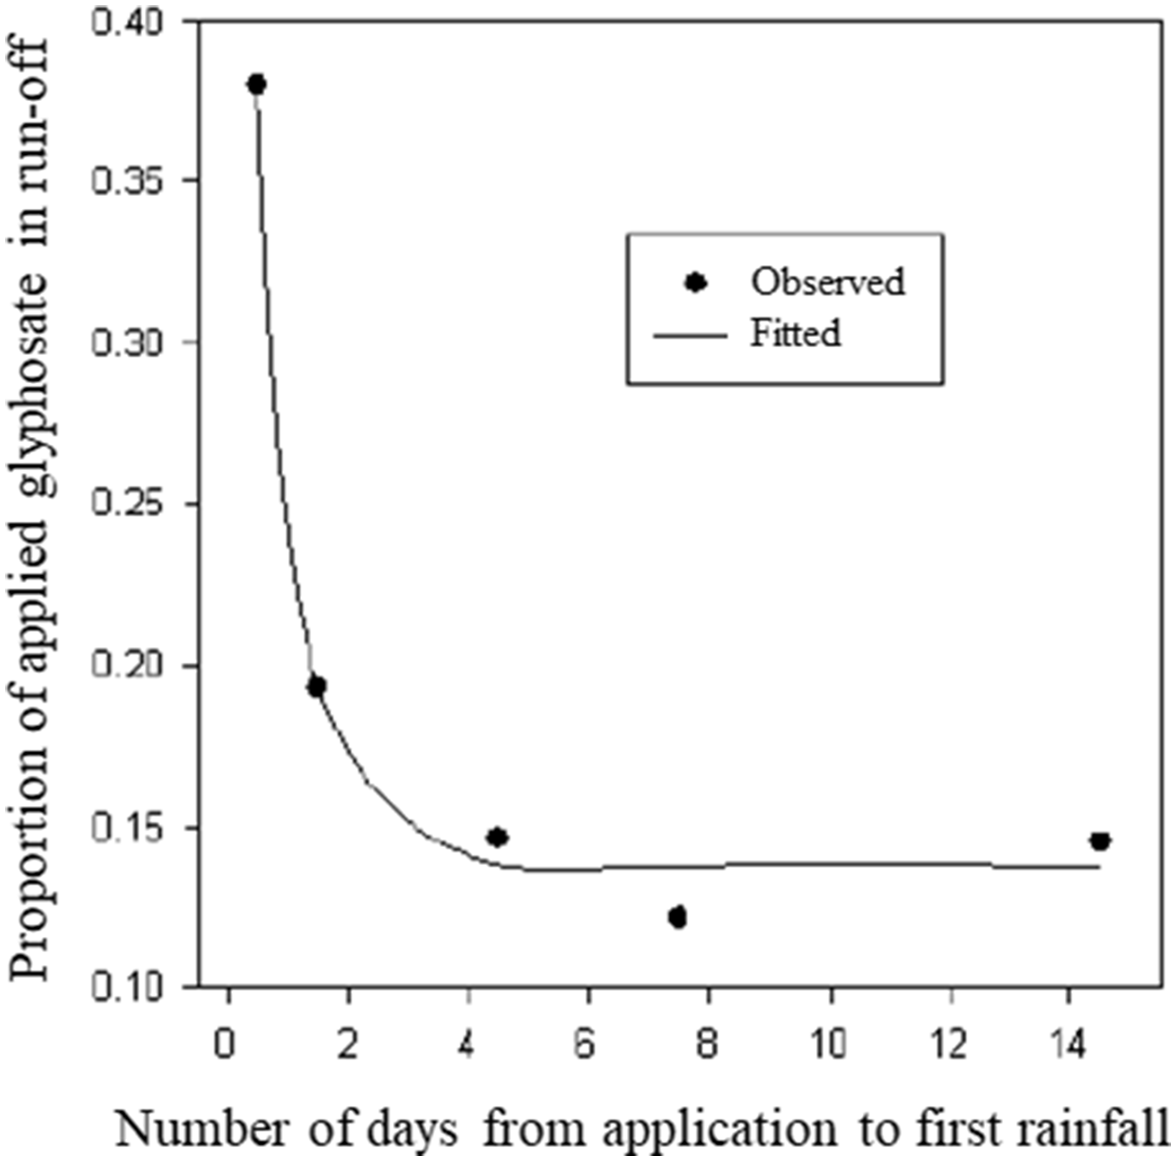
The proportion of glyphosate applied present in surface runoff in the LCA has been modeled using values derived from small-plot runoff experiments conducted at the NIAB-EMR Water Centre and in reference to the published literature. In summary, warmed tarmac was laid in 34 by 44 by 2 cm white laboratory trays with a central 2-cm-wide channel and then placed in larger trays (51 by 41 by 8 cm) to collect runoff. Fifty percent of the smaller trays were planted with P. annua, frequently found in the Thanet study, while the remaining trays had no weeds. The standard dose/rate of glyphosate used in Thanet (according to the label: Rosate 36® 360 g L−1 at 2.8 L ha−1) was applied with a hand-pump knapsack sprayer using a DT1.0 Yellow Lurmark® nozzle (Pentair Hypro EU Ltd, Unit 9, Wellington Way, Cambridge, UK CB23 7FW) at an angle of 105o and held 10 cm from the surface to give a band width of 30 cm. Treatments simulated five separate periods of rainfall (sprinkler system; 0.5, 1, 4, 7, and 14 d) after the application of glyphosate to deliver the equivalent of 2.6 mm of rainfall, the average rainfall event in Thanet. There were 30 plots (tarmac trays) in total: a randomized design with three replicates of each treatment (five timings), including a control (without weeds) (3 × 5 × 2 = 30). Runoff volume was measured by pouring the liquid from the tarmac collecting tray into a volumetric flask. The liquid was then transferred to a vial and stored at −20o C until analysis (QTS Analytical Ltd, Building 170, Kent Science Park, Abbott Drive, Sittingbourne, Kent, UK ME9 8AZ) for glyphosate and AMPA. The quantity of herbicide washed from the sprayed area after different lengths of drying time (including degradation) is summarized in Figure 2.
Proportion of glyphosate runoff after a period of drying before a rainfall event.

Linders and Stienstra (Reference Linders and Stienstra2010) report between 0% and 5.7% of the total glyphosate applied to hard surfaces as being present in runoff, with 3.5% identified at the 90th percentile. Figure 2 identifies 25% of the glyphosate applied as being present in runoff if rainfall occurs 24 h after application, the period of time stated on the product label as preferable before rainfall occurs postapplication. The percent runoff decreases to just below 15% after 4 d. The 3.5% of active ingredient applied reported by Linders and Stienstra (Reference Linders and Stienstra2010), and the 15% (Days 4 to 15) and 25% (24 h postapplication) derived from the runoff trials were used in the LCA to estimate the proportion of glyphosate active ingredient applied that may potentially enter wastewater in the herbicide and IWM treatment zones (Equation 1): ${\rm{a}}{{\rm{i}}_{{\rm{RO}}}} = \sum {{\rm{ai}}} \times \left( {\% \;{\rm{RO}}/100} \right)$
where aiRO is the quantity of glyphosate active ingredient removed by surface runoff (g), ∑ai is the total glyphosate active ingredient applied (g), and % RO is percent runoff.
A comparison with fuel required for annual multiple treatments using saturated steam, flame, hot water, and steam only (from Winer Reference Winer2019; Table 1) is included in Figure 1 for reference purposes. Winer (Reference Winer2019) does not provide water consumption figures for the hot water, steam, or saturated steam treatments, only direct fuel use. Water consumption for these treatments was estimated for the purpose of the LCA using quantities reported per application for individual weed species by Coleman et al. (Reference Coleman, Stead, Rigter, Xu, Johnson, Brooker and Walsh2019), Kolberg and Wiles (Reference Kolberg and Wiles2002), and Rifai et al. (Reference Rifai, Astatkie, Lacko-Bartosova and Gadus2002). Recommended application rates according to the product label and Lainsbury (Reference Lainsbury2025) for a single application of glyphosate (Roundup® ProVantage, 2.25 L ha−1, 480 g ai L−1) to treat annual, perennial, perennial broadleaf, and perennial waxy-leaved species were also evaluated.
Characterization of Impacts/Impact Assessment
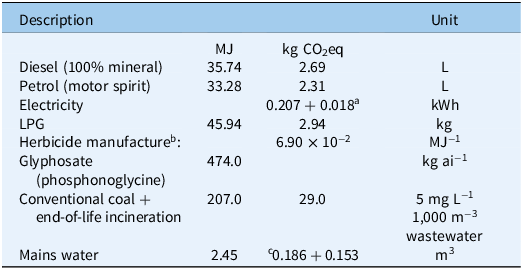
The characterization stage creates a standardized environmental impact profile for each weed management strategy per unit area (m2) using the system input data and the emission factors attributed to each input. Characterization factors are expressed on a standardized scale, for example, GHG emissions as kg CO2eq (IPCC 2023; RIVM 2016; University of Leiden 2016; Williams et al. Reference Williams, Audsley and Sandars2009). Fossil fuels are used to power machinery (e.g., brushing, heat-based systems, or vehicles to support agrochemical application) and during the manufacture of herbicides, including transportation. The energy and GHG emissions attributed to fuel consumption and mains water supply (GOV.UK 2025), and herbicide manufacture (Audsley et al. Reference Audsley, Stacey, Parsons and Williams2009; Green Reference Green and Helsel1987) are summarized in Table 3.
Energy (MJ) and greenhouse gas emission factors (kg CO2eq) allocated to fuel, products and operations.

a Transmission and distribution.
b Consumes fuels in the following proportions: electricity = 0.7112, coal = 0.0002, fuel oil = 0.2073, diesel = 0.0222, natural gas = 0.0591.
c Treatment and supply.
The GHG emissions (kg CO2eq) attributed to the manufacture of herbicide are calculated per kilogram of active ingredient as a function of energy consumption (Audsley et al. Reference Audsley, Stacey, Parsons and Williams2009; Green Reference Green and Helsel1987). The impacts calculated for previous analyses exclude externalities associated with mains water treatment to remove glyphosate due to issues with accurate data, also encountered by the Kempenaar and van Dijk (Reference Kempenaar and van Dijk2006) LCA evaluation of the Dutch SWEEP (Sustainable Weed Control on Pavements) system. The method used here adopts the method of Joseph et al. (Reference Joseph, Kaetzl, Hensgen, Schäfer and Wachendorf2020), who allocated an aggregated 55,000 comparative toxicological units for ecosystems (CTUe m3 kg−1 emitted) removal capacity to conventional coal (CC) with end-of-life incineration present at a concentration of 5 mg L−1 in 1 m3 of wastewater. It requires an energy input of 207 MJ with associated GHG emissions of 29 kgCO2eq (Joseph et al. Reference Joseph, Kaetzl, Hensgen, Schäfer and Wachendorf2020). Glyphosate has a freshwater ecotoxicity of 13.41 CTUe m3 kg−1 active ingredient (PPDB 2025), equivalent to 0.0002 of the 55,000 CTUe m3 kg−1 CC removal capacity at 5 mg L−1 in 1 m3 of wastewater.
Herbicide active ingredients have the potential to reach non-target areas either via drift or surface runoff. The standard LCA method allocates default terrestrial or aquatic ecotoxicological values as kilograms 1,4-dichlorobenzene-eq (kg 1,4-C₆H₄Cl₂eq) or CTUe for a given active ingredient to capture these impacts (Mamy et al. Reference Mamy, Gabrielle and Barriuso2010; University of Leiden 2016). For glyphosate dispersal via drift (air to freshwater), this is 0.047 and 21.93 kg 1,4-C₆H₄Cl₂eq for terrestrial and aquatic ecotoxicity, respectively. Mamy et al. (Reference Mamy, Gabrielle and Barriuso2010) derived a value of 1,400 kg 1,4-C₆H₄Cl₂eq for the direct movement of glyphosate via surface runoff into a watercourse (denoted as freshwater, i.e., rainwater to freshwater, i.e., the receptor watercourse). The 1,400 kg 1,4-C₆H₄Cl₂eq value is applied to the percentage of glyphosate removed in surface runoff, the 21.93 kg 1,4-C₆H₄Cl₂eq to the remainder. This method does not differentiate between individual biological groups or whether the impact is short (acute) or long term (chronic). This level of risk is a function of the fate and transport in the environment, level of exposure, and toxicity to receptors (Lewis et al. Reference Lewis, Tzilivakis, Warner and Green2016). Risk can only be calculated on a site-specific basis accounting for local environmental parameters. In the absence of detailed site-specific scenarios, an alternative method is to assess the potential load (or pressure) presented by different active ingredients. The formulation and application rates of glyphosate applied in the Thanet case study programs were evaluated using the PLI (Rainford et al. Reference Rainford, Tzilivakis, Garthwaite, Jones and Lewis2023; Tzilivakis et al. Reference Tzilivakis, Lewis, Kennedy, Ridley and Garthwaite2026), a modified version of a method developed by the Danish Environmental Protection Agency (Samsøe-Petersen et al. Reference Samsøe-Petersen, Bøje, Hansen, Kjølholt, Jørgensen, Kudsk and Ørum2012; Vandevoorde et al. Reference Vandevoorde, Kudsk, Agnan and Baret2025). The Danish system calculates “pesticide environmental loads,” which are then utilized within a guidance system for farmers and to inform a national pesticide tax. The indicator determines the load index for environmental fate (persistence, risk to ground and surface water, and bioaccumulation), and biological (acute and chronic exposure). As part of the characterization stage, two biodiversity groups, fish and honeybees, representative of aquatic and terrestrial (plant surface) habitats, respectively, were selected for further evaluation. The load index for a given active ingredient and biological class is calculated relative to a worst-case active ingredient reference value. The method taken here restricts this to worst-case herbicide active ingredients only (bromoxynil heptanoate, bromoxynil octanoate, quinoclamine for fish acute, fish chronic, honeybees contact/oral respectively), rather than considering all pesticide (herbicide, fungicide, insecticide) active ingredients as per the UK PLI method. The acute impact on fish is summarized in Equation 2: ${\rm{PL}}{{\rm{I}}_{\left( {{\rm{fish}}{\kern 1pt} \;{\rm{acute}}} \right)}} = \sum {\rm a i} \times \left(1/\left( {{\rm{fish}}\;{\rm{L}}{{\rm{C}}_{{\rm{50 \;}}}}_{({\rm{short}}\;{\rm{term}})}{\rm{/fish}}\;{\rm{L}}{{\rm{C}}_{{\rm{50\;}}}}_{{\rm{REF}}({\rm{short}}\;{\rm{term}})}} \right)\right)$
where ∑ai is the quantity of active ingredient applied (kg ha−1), the LC50 is the lethal concentration (mg L−1), and the LC50 REF is the LC50 of the reference active ingredient (Rainford et al. Reference Rainford, Tzilivakis, Garthwaite, Jones and Lewis2023; Tzilivakis et al. Reference Tzilivakis, Lewis, Kennedy, Ridley and Garthwaite2026). Ecotoxicity data for AMPA and glyphosate (Lewis et al. Reference Lewis, Tzilivakis, Warner and Green2016; Mamy et al. Reference Mamy, Gabrielle and Barriuso2010; PPDB 2025; University of Leiden 2016) are summarized in Supplementary Table S3. Data for alkylpolyglycoside/decyloctylglycoside (C16H32O6; hot foam in use) are derived from Kemcare Ltd Safety Data Sheet (2014). Hot foam consists of decyloctylglycoside, a non-ionic surfactant derived from glucose applied at 4.1% to 4.6% w/w with water (Kemcare Ltd 2014). The ecotoxicity of decyloctylglycoside applied diluted as specified in the foam formulation is classed as LC50 >100 mg L−1 for acute exposure to fish, and EC50 >100 mg L−1 (low toxicity/not classified as acutely toxic) for Daphnia spp. and algae with “no potential for bioaccumulation” and “predicted to degrade in soil,” that is, negligible chronic effects. An LC50 >100 mg L−1 classification according to the OECD TG203/C.1 (OECD 2025) signifies that no mortality to fish occurs at an exposure of 100 mg L−1 and that the substance is classed as “not toxic” to fish. Decyloctylglycoside is not classified as PBT (Persistent, Bioaccumulative, and Toxic) or vPvB (very Persistent and very Bioaccumulative) under Annex XIII of the REACH (EC) 1907/2006 Regulation (https://www.legislation.gov.uk/eur/2006/1907/contents).
Potential non-ecotoxicological impacts on honeybees, that is, mortality caused by direct contact with lethal heat from the thermal treatments (flame, hot water, steam, or saturated steam) or physical impact (mechanical brushing) were accounted for by a separate index. For the thermal methods that operate at >60 C (flame, hot foam, steam, or saturated steam) an index of 1.0 was allocated to direct contact with honeybees based on insect lethal temperature thresholds described by Hammond (Reference Hammond2014). An index of 0.1 was allocated to methods operating at temperatures of 50 to 60 C (hot air). Scores of zero were allocated to the honeybee oral and fish acute and chronic categories, that is, hot water or steam remaining on the plant postapplication or drifting into a watercourse has cooled below the lethal heat temperature of 60 C. Thermal or mechanical treatments applied during January and February were excluded from the assessment, as bees are not usually active. A principal components analysis (PCA) was completed using the PAleontological STatistics (PAST) v. 5.2.1 statistical software (Hammer et al. Reference Hammer, Harper and Ryan2025).
Results and Discussion
Weed Coverage and Thresholds
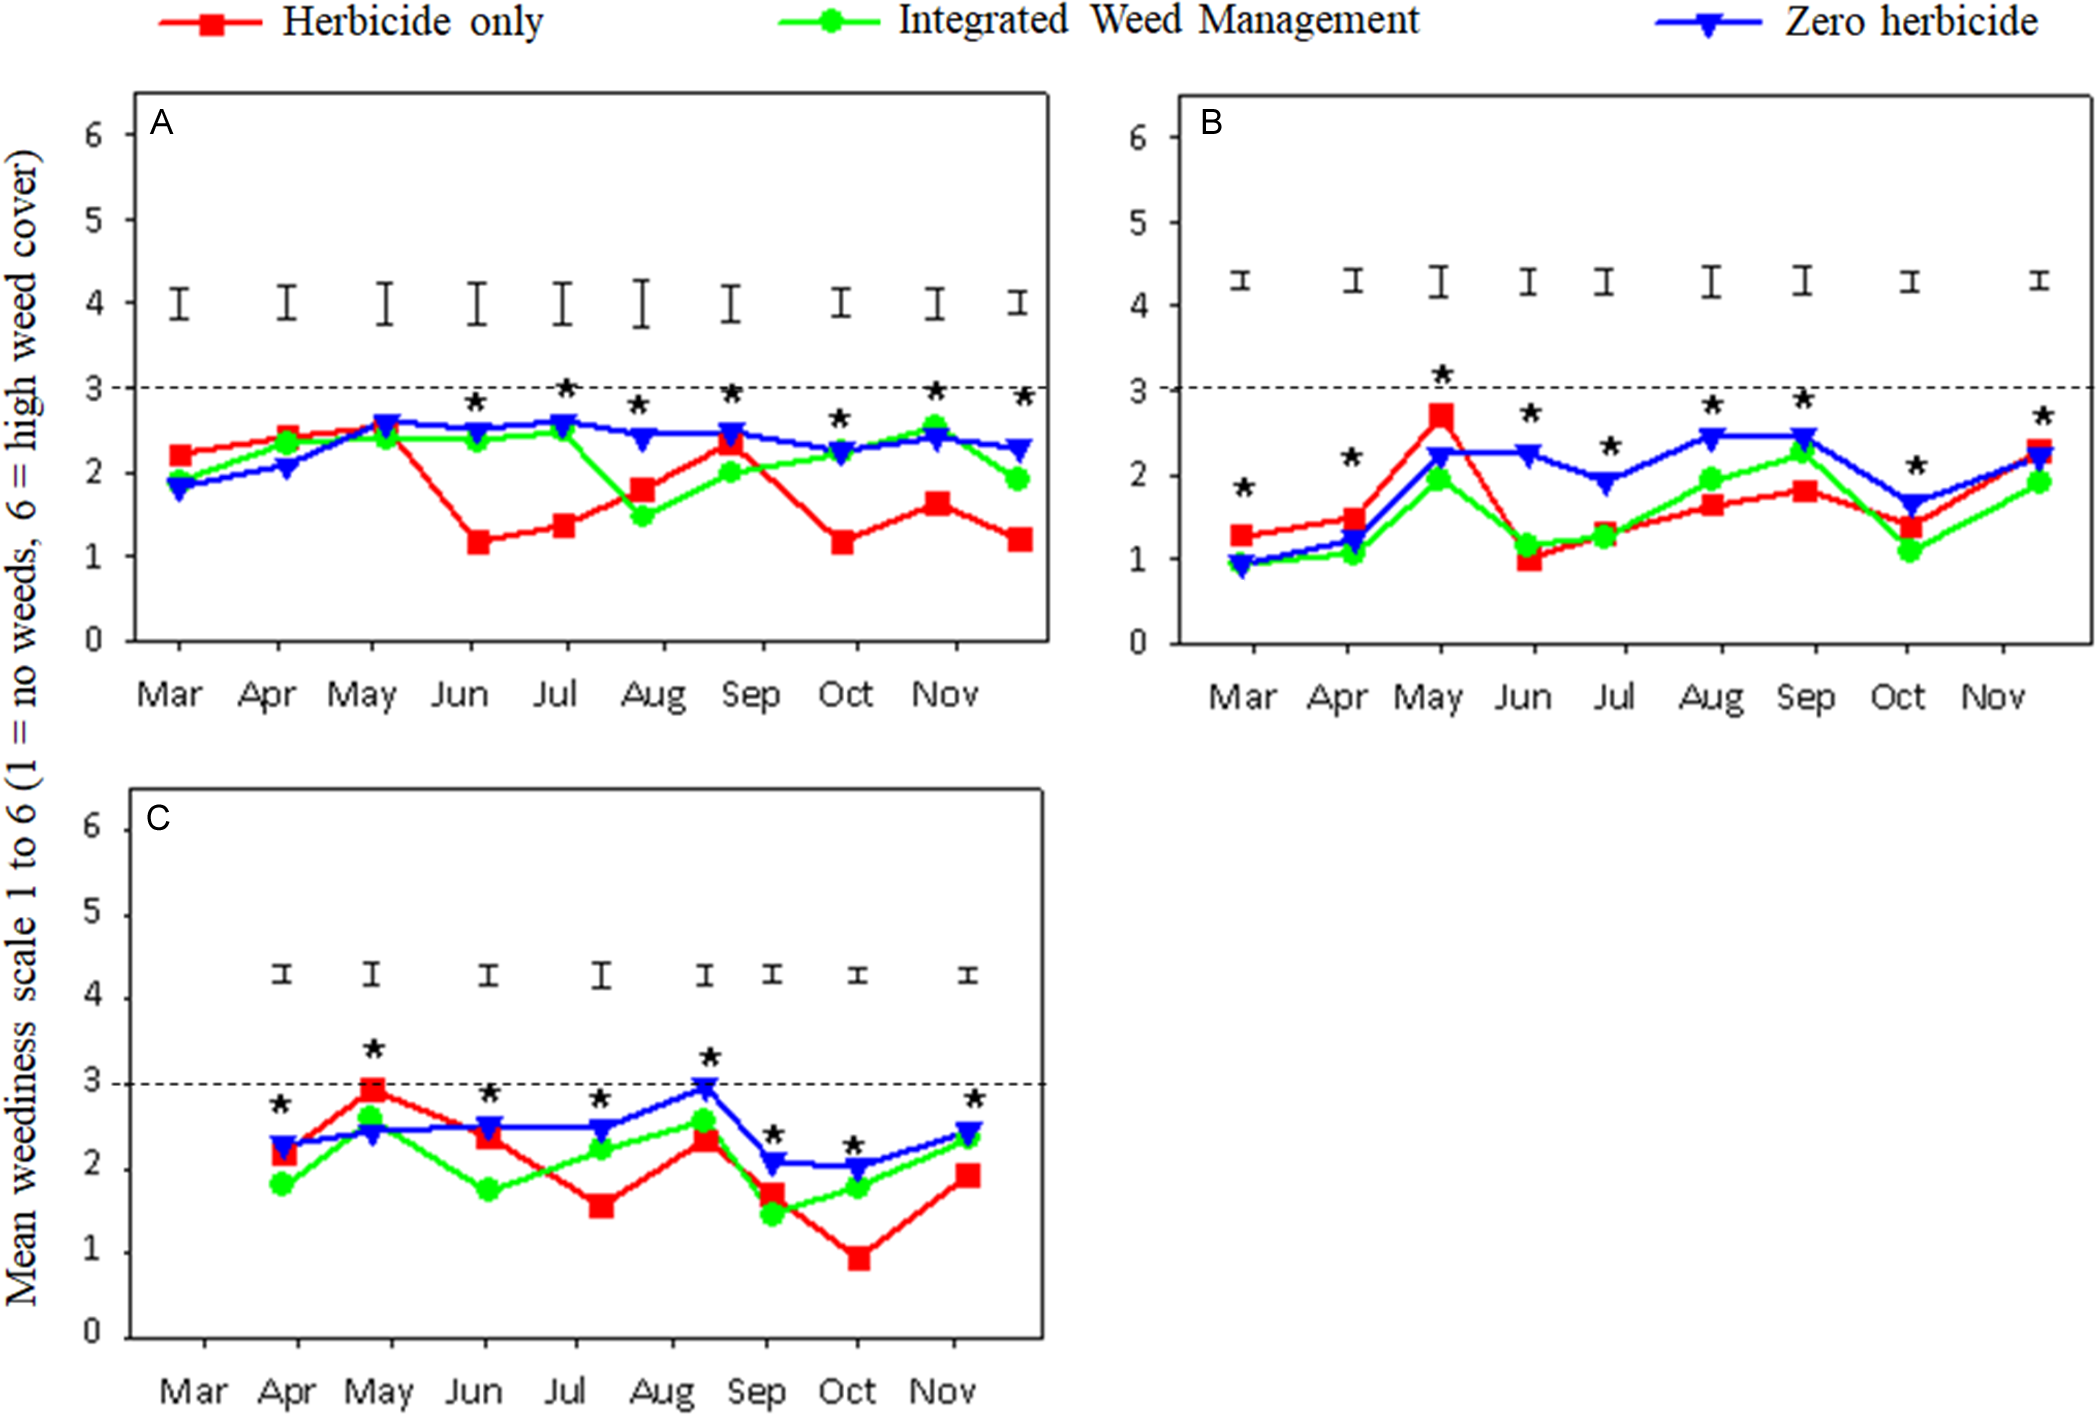
Visual assessments using the weed level scale showed that mean weed levels in all weed control regimes were maintained within the “acceptable” range (levels 1 to 3 = acceptable; levels 4 to 6 = unacceptable) (Figure 3).
Effects of different weed control methods on mean weed coverage visual classification in (A) Year 1, (B) Year 2, and (C) Year 3. Vertical bars = LSD values at P < 0.05. Significant differences between the treatments are marked with asterisks; acceptable weed level thresholds are indicated by the zone below the black dotted line.

Weed levels in the zero-herbicide regime (Figure 3C) tended to be relatively stable during all 3 yr, especially from May to November, but were consistently higher than those of the herbicide-only regime. In Year 1 weed levels in the integrated regime (Figure 3B) were periodically higher than in the herbicide-only regime (Figure 3A). The difference in weed levels between treatments using the visual weediness scores reflected those recorded using the quadrat assessment (Table 4).
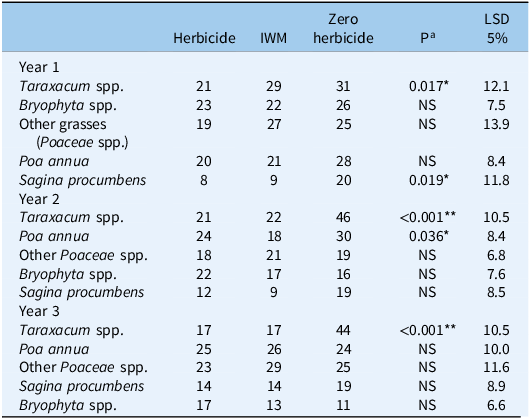
Summary of the five most frequent weed species recorded annually in each treatment (% of quadrats).

a Asterisks (* and **) denote a significant (P < 0.05) difference between treatments at the 5% and 1% levels, respectively; NS indicates not significant.
The most frequent weed species was dandelion (Taraxacum spp.), also the only species to be significantly (P < 0.05) higher in the zero-herbicide treatment compared with the herbicide and IWM treatments during all 3 yr. Procumbent pearlwort (Sagina procumbens L.) and P. annua were significantly higher in Years 1 and 2, respectively.
GHG Emissions and Fossil Resource Depletion
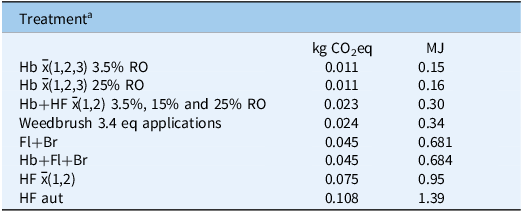
GHG emissions and fossil resource depletion correlate primarily with fossil fuel use (Figure 1; Table 3). The GHG emissions calculated in the Thanet weed control programs from the energy, fuel type, and quantity of product used are shown ranked from lowest to highest in Table 5.
Greenhouse gas emissions (kg CO2eq m−2) and fossil resource depletion (MJ m−2) attributed to direct inputs from the Thanet case study ranked from lowest to highest emissions.

a Hb, herbicide; RO, runoff; HF, hot foam; Fl, flame; Br, brushing; HF aut, hot foam autumn application; x̄(1,2,3), mean of years 1, 2 and 3.
The GHG emissions (Table 5) varied depending on the method and context in which they are used. In the Thanet trial, evaluations of GHG emissions were lowest in the herbicide (0.011 to 0.012 kg CO2eq m−2) and IWM (0.023 kg CO2eq m−2) programs, followed by mechanical brushing (0.064 kg CO2eq m−2) or hot foam (0.075 to 0.108 kg CO2eq m−2) in the zero-herbicide treatment. The zero-herbicide methods consumed greater quantities of fuel to maintain weeds below acceptable thresholds compared with glyphosate applied with a knapsack sprayer. When hot foam was applied as multiple spot treatments later in the season in combination with glyphosate in the IWM program (Hb+HF), fuel consumption decreased by a factor of 4 to 8 compared with the hot foam–only (HF) treatment. The standard herbicide (Hb) methods had the lowest fuel inputs. A detailed breakdown of GHG emissions displayed temporally are given in Figure 4.
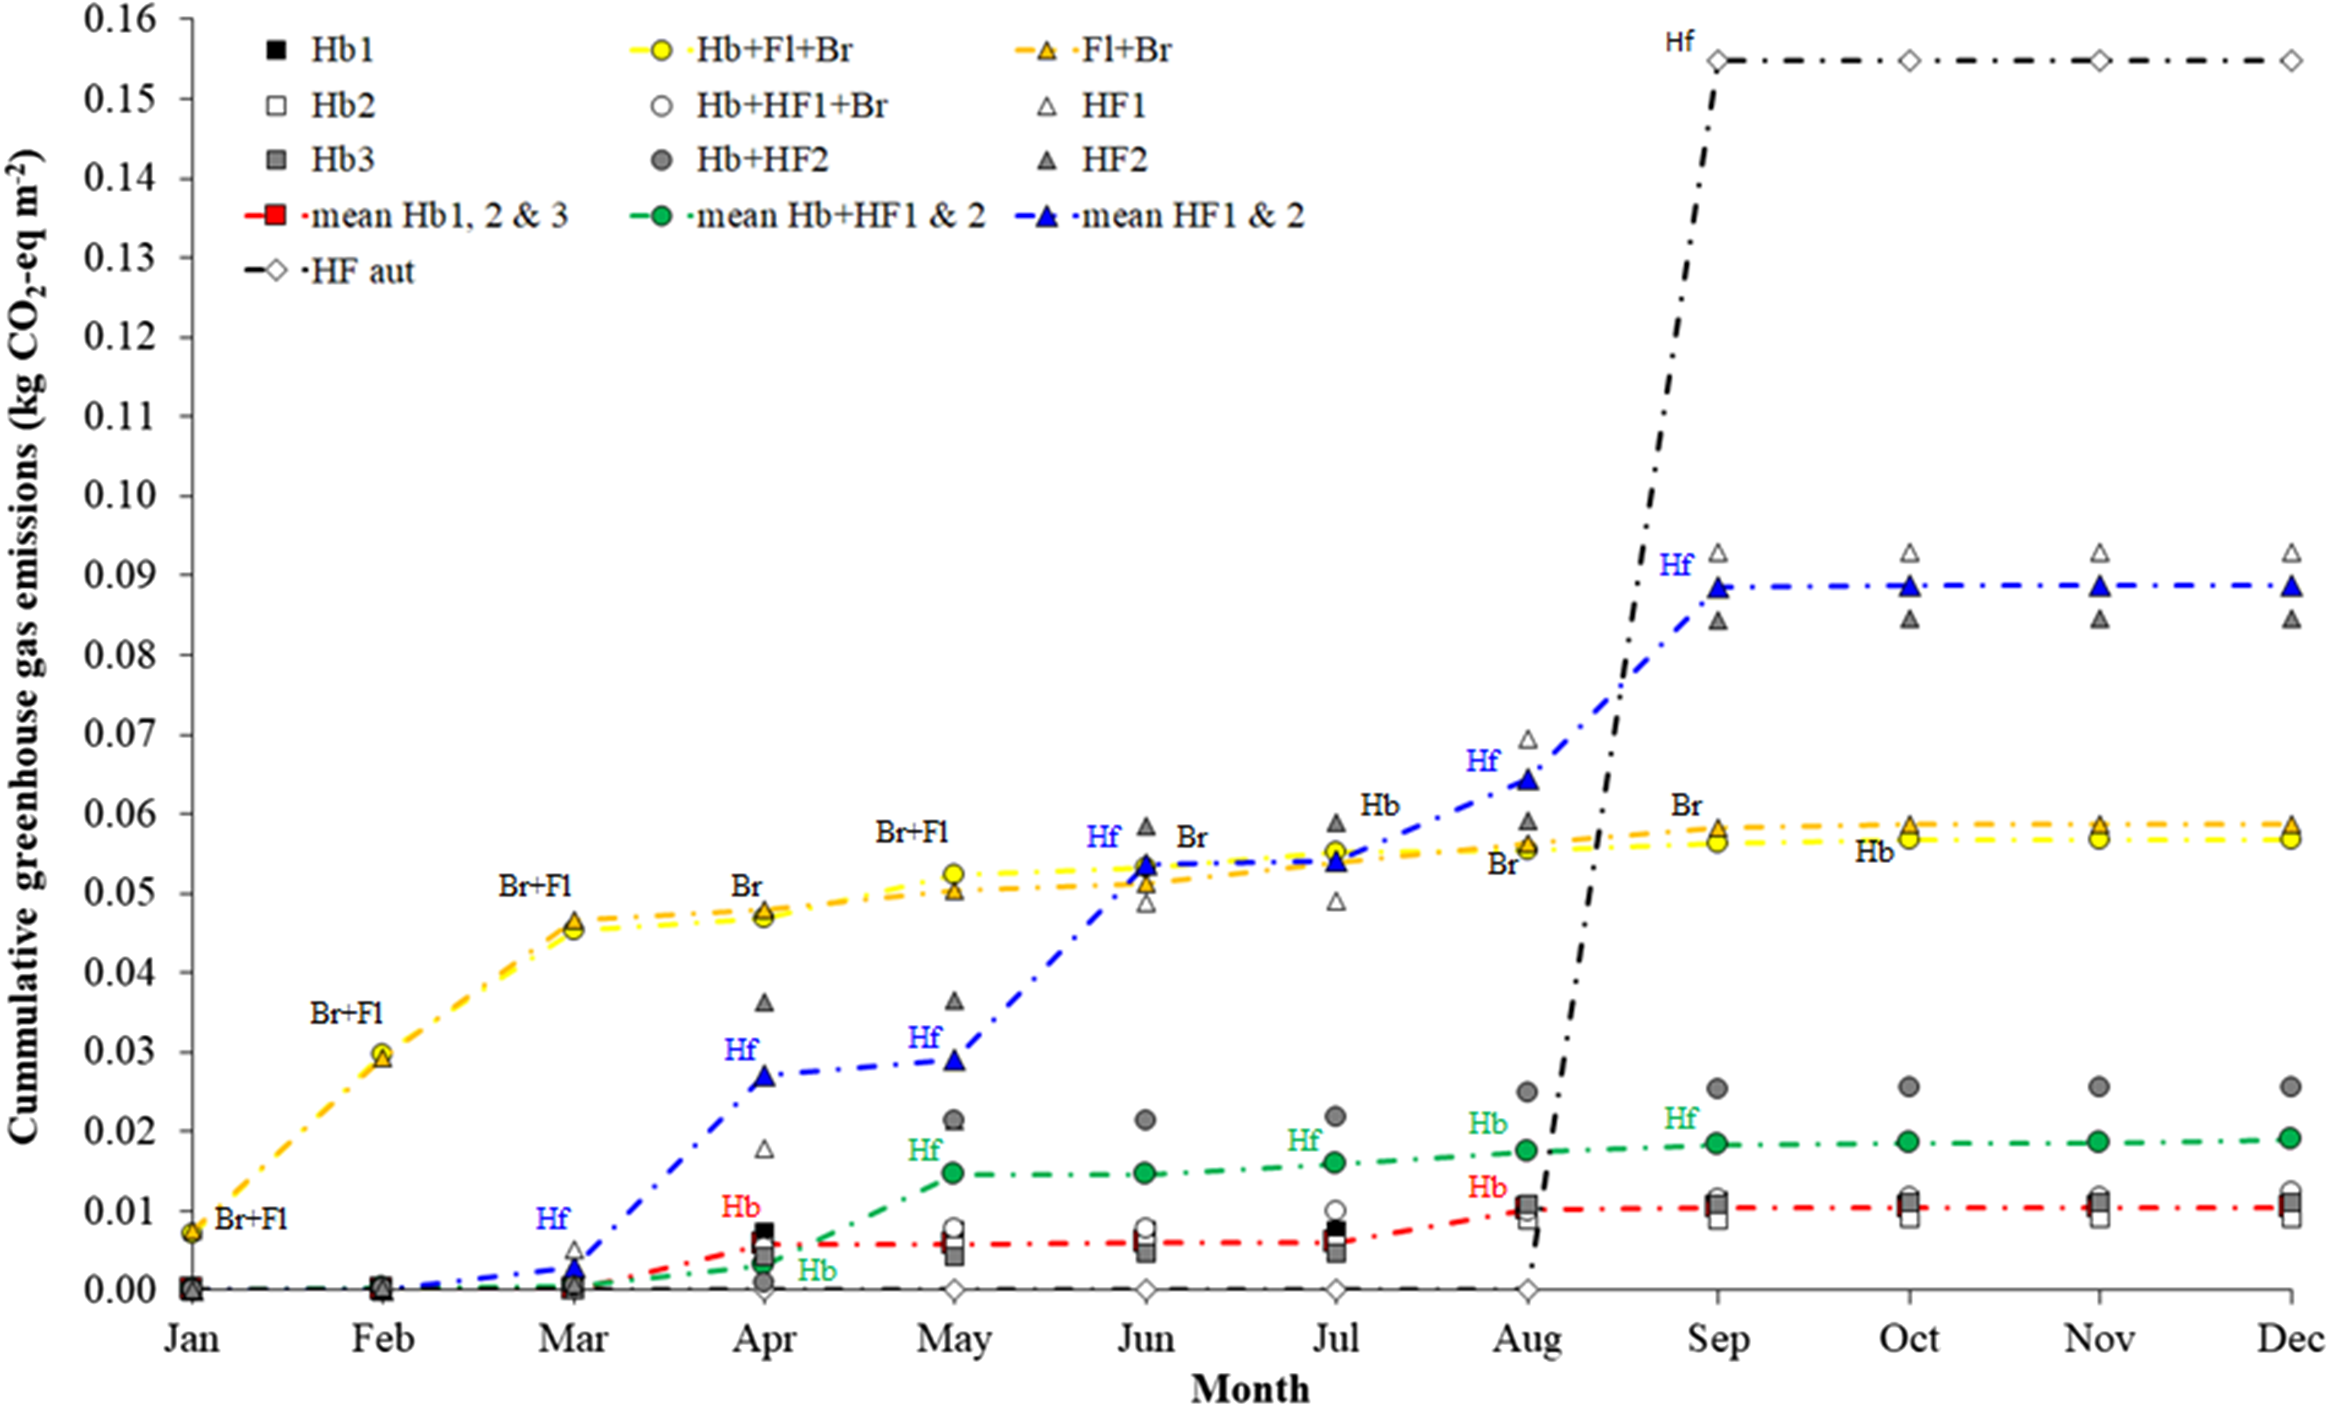
Cumulative temporal distribution of greenhouse gas emissions over 3 yr for treatments herbicide-only (Hb), integrated weed management (IWM; Hb+Fl+Br, Hb+HF1+Br, Hb+HF2), zero-herbicide (Fl+Br, HF) and Year 1 of hot foam autumn application (HFaut). Br, brush; Fl, flame; Hb, herbicide (Year 1: Roundup® Probiactive 450, 2.8 L ha−1, 450 g ai L−1; Years 2 and 3: Roundup® ProVantage, 2.25 L ha−1, 480 g ai L−1); HF, hot foam; HF aut, hot foam autumn application.

GHG emissions were lowest in the herbicide only (Hb) followed by the IWM using hot foam (Hb+HF) (Figure 4). The quantity of propane required for the flame thermal treatment in the IWM (Hb+Fl+Br) increased emissions and was comparable to the flame treatment in the zero-herbicide program (Fl+Br). Two applications of hot foam in August and September further increased GHGs in the HF-only program. A significant difference (P < 0.01) existed between treatments (one-way ANOVA, df = 8, F-value = 13.11, P = 0.0065). The zero-herbicide treatment was significantly higher (Tukey’s pairwise test) than the herbicide-only (P = 0.006) and IWM (P = 0.031) treatments. No significant difference (P = 0.339) was identified between the herbicide-only and IWM treatments. Weighted environmental impact scores for all LCA impact categories are summarized in Table 6.
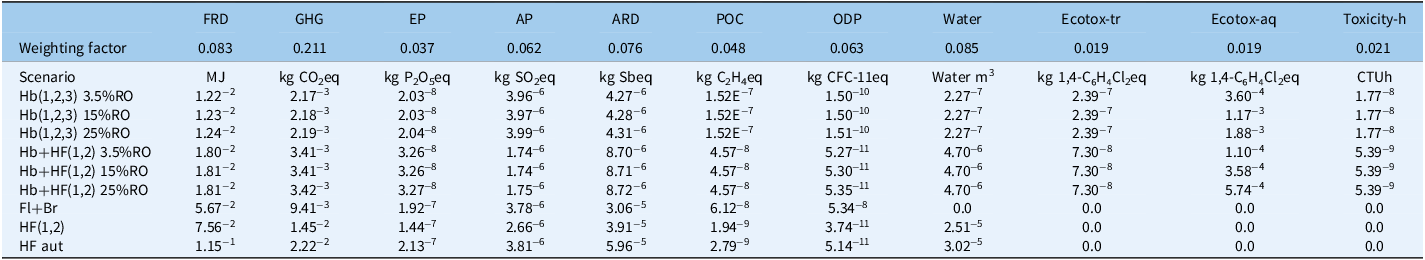
Weighted environmental impact scores (m−2) for herbicide, integrated weed management (IWM), and zero-herbicide method case studies a .

a FRD, fossil resource depletion; GHG, greenhouse gas emissions; EP eutrophication potential; AP acidification potential; ARD, abiotic resource depletion; POC, photochemical ozone creation; ODP, ozone-depletion potential; Ecotox-tr, terrestrial ecotoxicity; Ecotox-aq, aquatic ecotoxicity; Toxicity-h, human toxicity; Hb, herbicide; RO, runoff; Fl, flame; Br, brushing; HF, hot foam; HF aut, hot foam autumn application.
The calculated environmental impact scores were dominated by fossil resource depletion (1.05−2 to 1.15−1), GHG emissions (1.87−3 to 2.22−2) and aquatic ecotoxicity 0 to 4.23−4 (1.88−3 for 25% runoff) (Table 6). The remaining impact categories were of a lower magnitude (5.02−6 to 3.08−11). Aquatic ecotoxicity reflected differences in product active ingredient and application rate, with the highest for glyphosate application to control perennial waxy-leaved weed species (Table 6). The zero-herbicide programs (HF, HFaut) benefited from the further spatial targeting of treatments, in this case only the center and curbside zones of the pavement, due to a reduction in the quantity of fuel consumed. This is also evident, albeit not as pronounced, in the IWM with hot foam (Hb+HF) programs. Higher environmental impacts were calculated for the treatments using flame (Hb+Fl+Br, Fl+Br) mainly due to the quantity of propane consumed (Figure 1).
Ecotoxicity
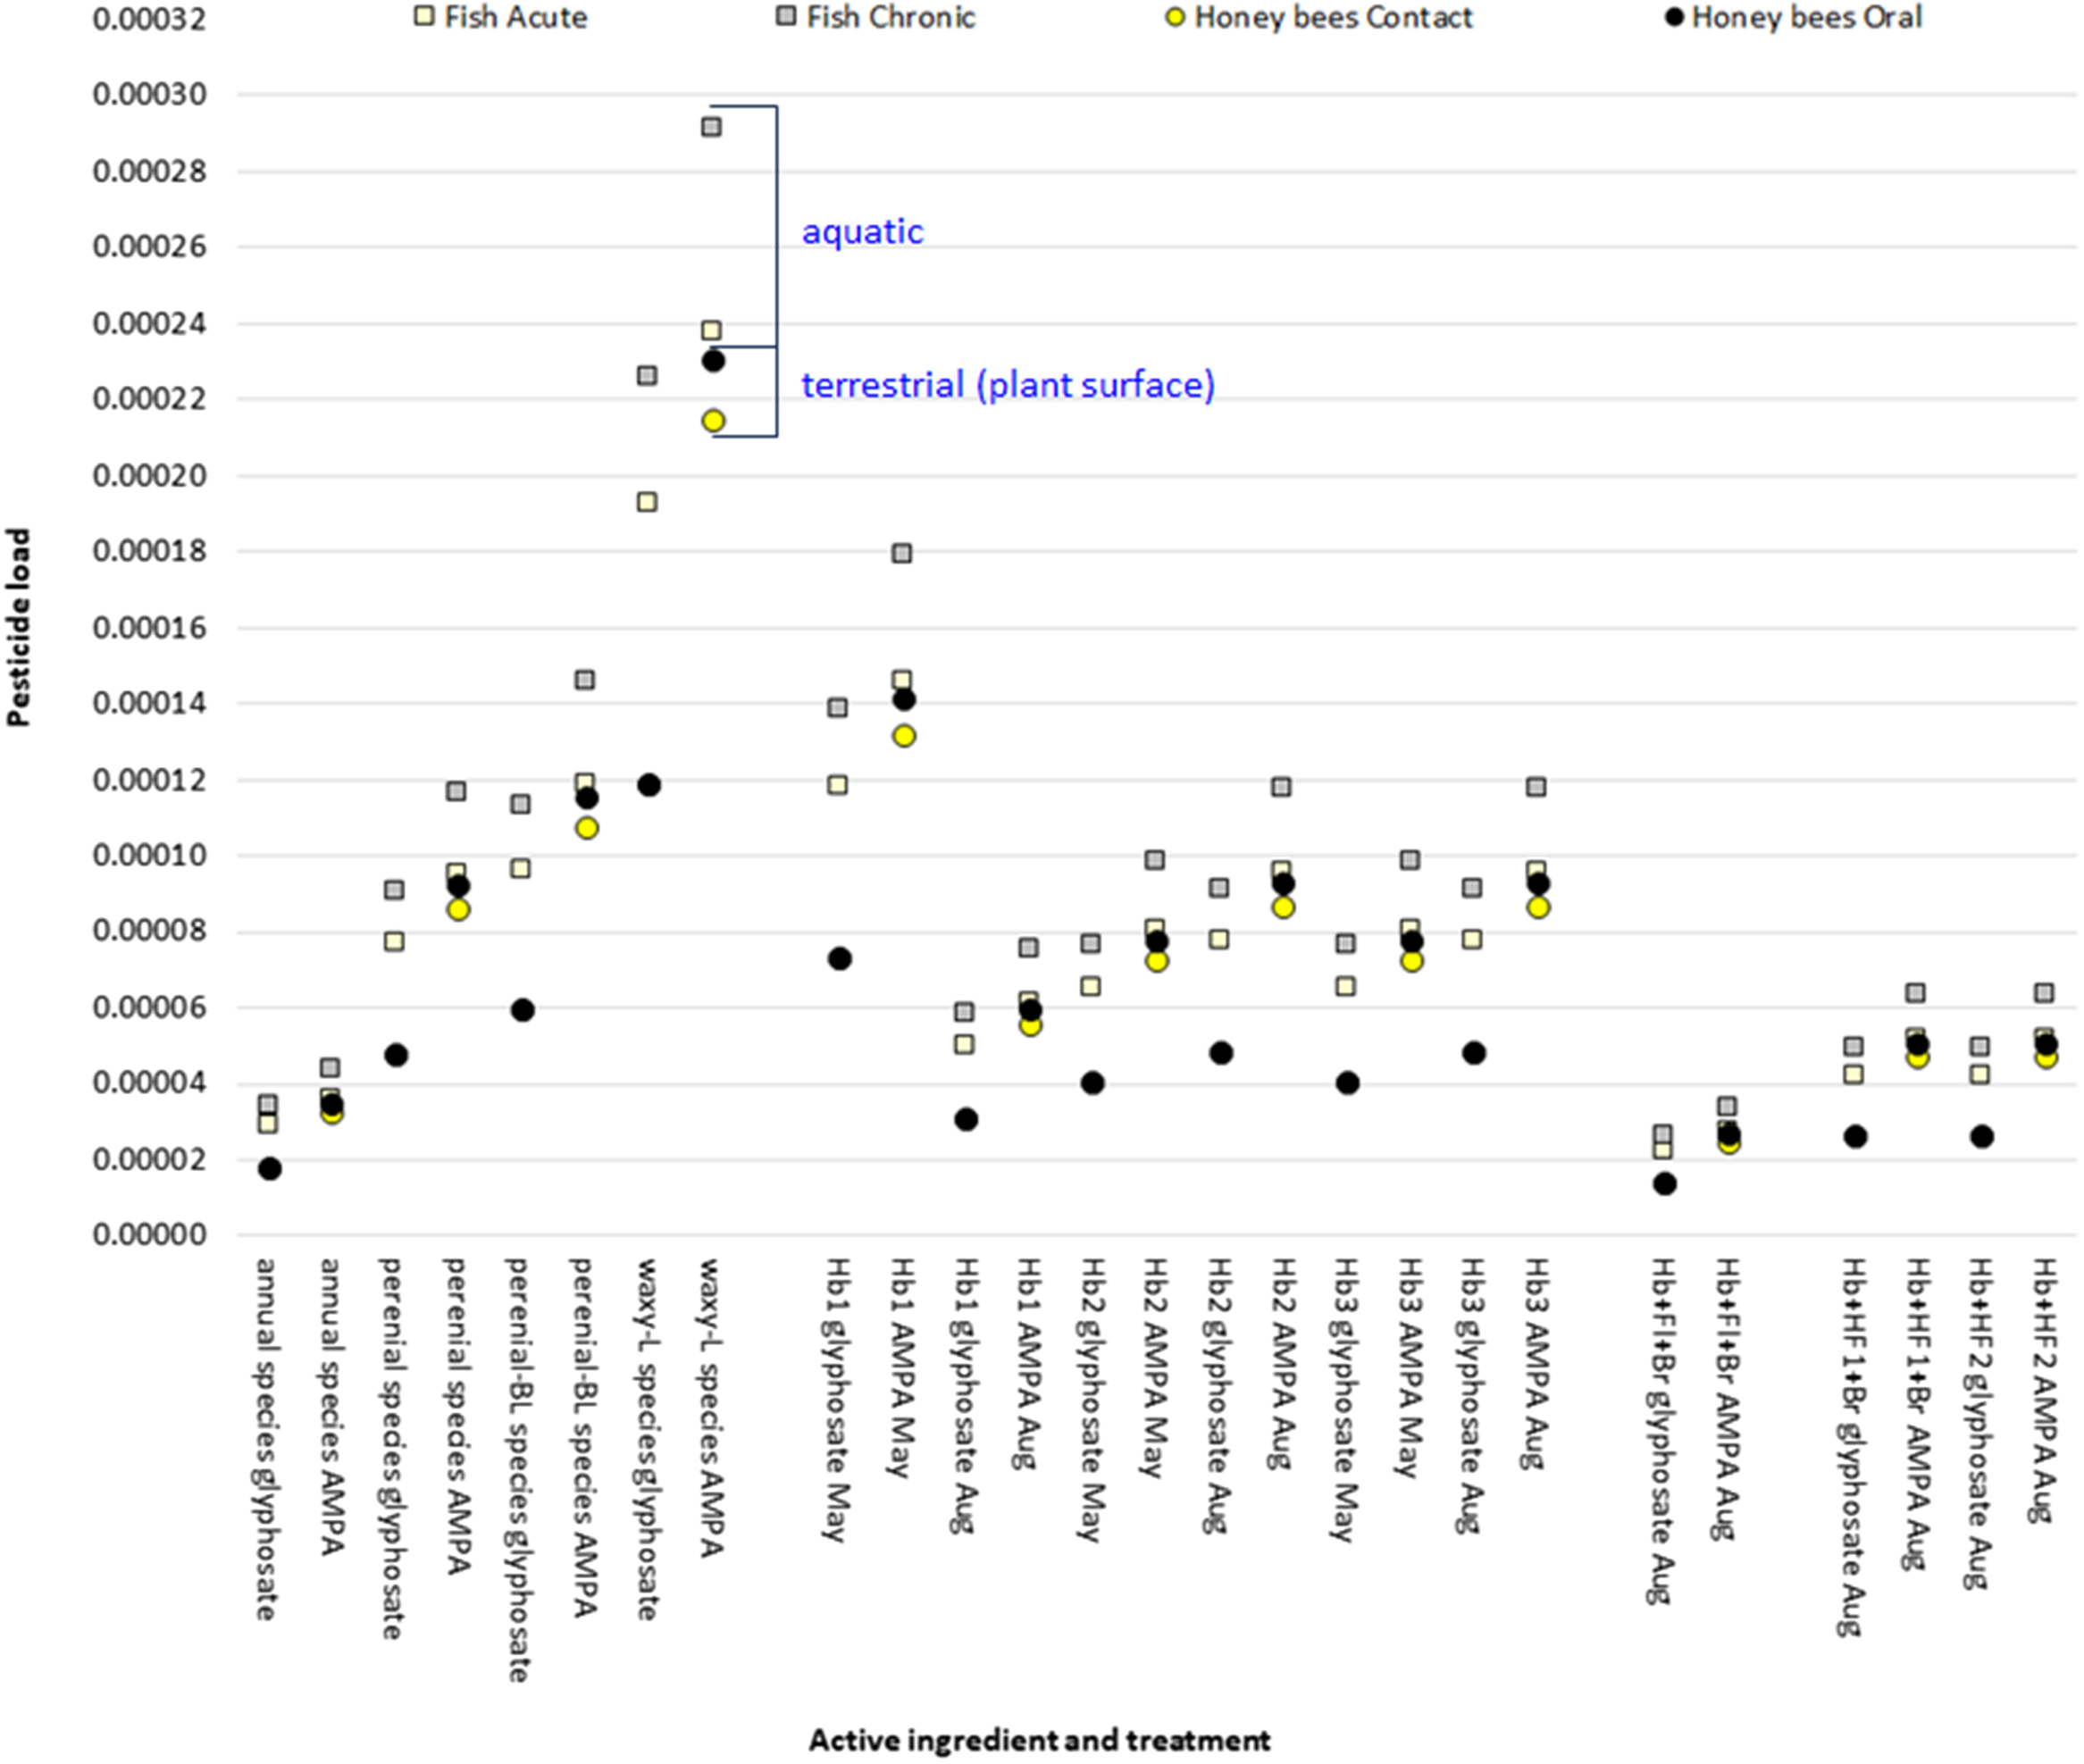
The PLI method of Rainford et al. (Reference Rainford, Tzilivakis, Garthwaite, Jones and Lewis2023) and Tzilivakis et al. (Reference Tzilivakis, Lewis, Kennedy, Ridley and Garthwaite2026) calculated indices >0.75 for AMPA for fish (chronic) (Figure 5). Indices of 0.5 to 0.75 were allocated to AMPA (fish acute) and honeybees (acute, chronic), and to glyphosate for fish (chronic, acute). Figure 5 also shows the pesticide load for approved glyphosate application rates in amenity areas (Lainsbury Reference Lainsbury2025) and those used in the herbicide and IWM case studies for honeybees and fish.
Pesticide load (m−2) for fish and honeybees for amenity approved rates (Lainsbury Reference Lainsbury2025) of a single glyphosate application (annual species add rate, perennial species add rate, perennial broadleaf species add rate) compared with the herbicide-only (Hb) and the integrated weed management (IWM) herbicide + flame + brushing (Hb+Fl+Br) and herbicide + hot foam (Hb+HF) treatments in the Thanet study; herbicide treatment Year 1: Roundup® Probiactive 450, 2.8 L ha−1, 450 g ai L−1; Years 2 and 3: Roundup® ProVantage, 2.25 L ha−1, 480 g ai L−1.

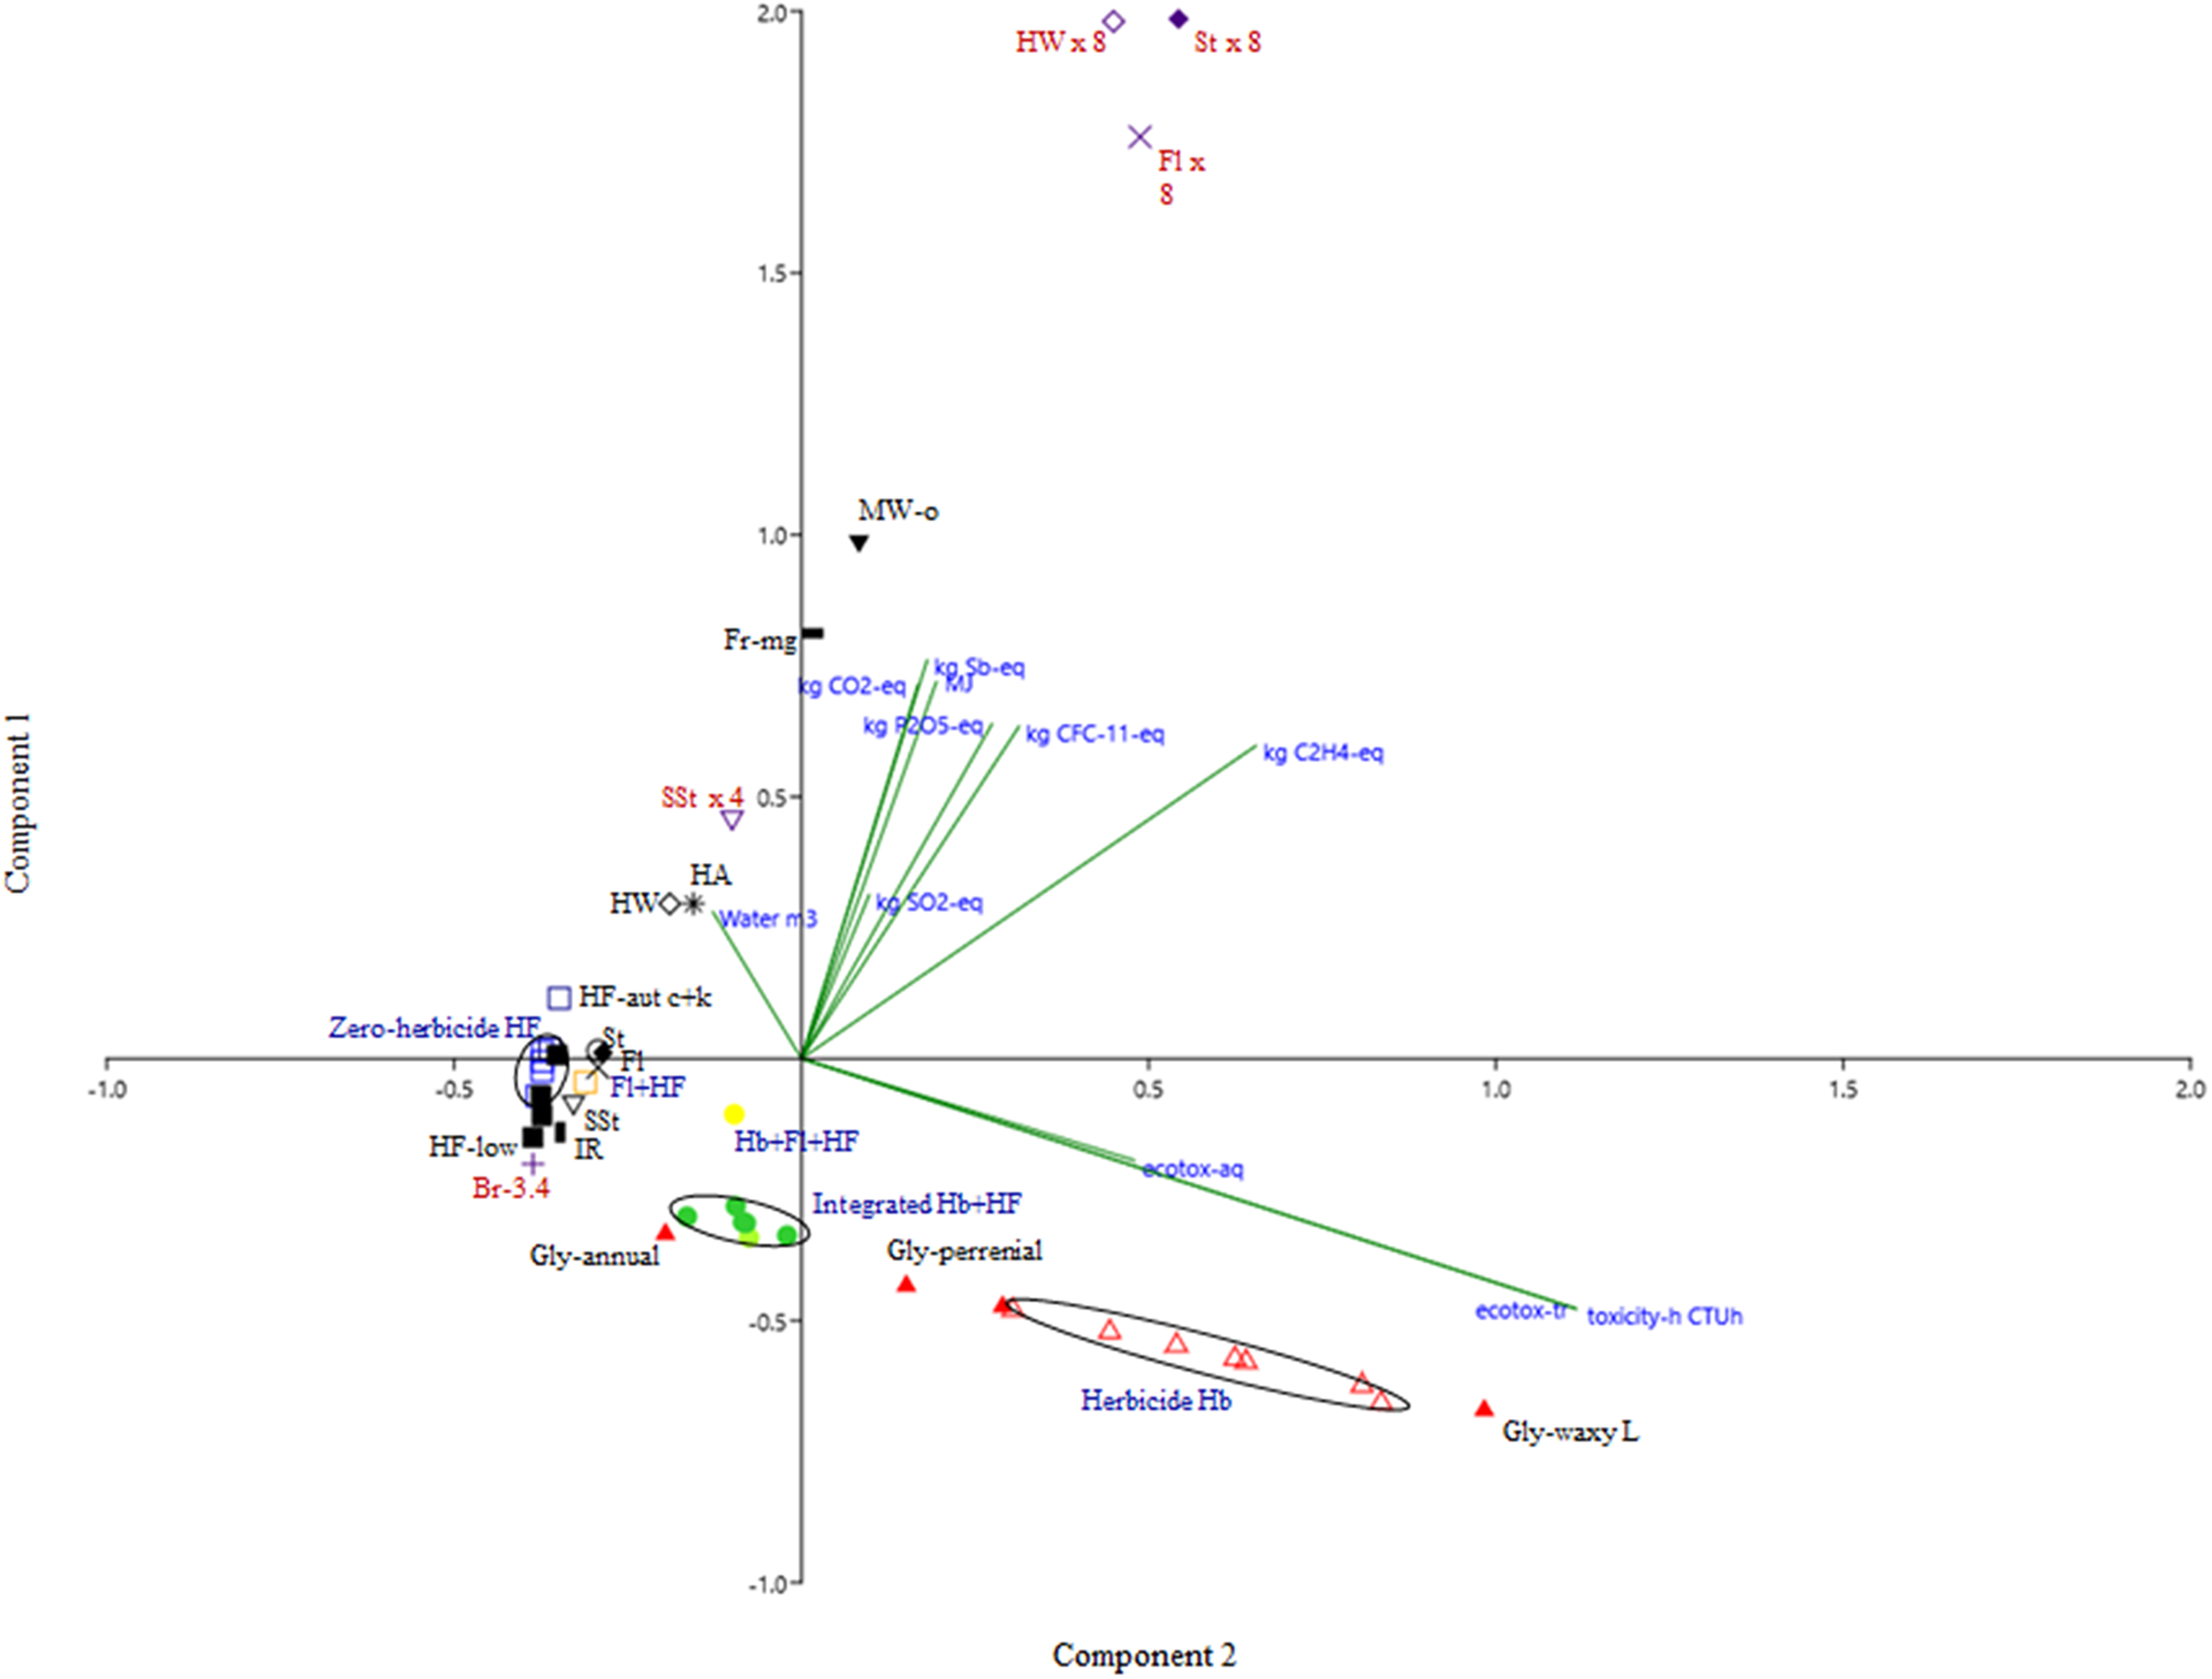
The AMPA derived from glyphosate applied to treat perennial waxy-leaved weed species (360 g ai L−1 product, 5 L product ha−1) had the highest pesticide load overall, primarily for the chronic exposure of fish. This is followed by acute exposure of fish and oral and then contact exposure in honeybees. The application rate for perennial broadleaf species (Figure 1) is comparable to the load of a single application in the herbicide-only case studies (Hb2 and Hb3). For the treatment of annual weeds (1.5 L ha−1), the load for a single application is 30% in comparison, similar to the IWM in the Thanet study. The lower pesticide load in the IWM programs (Hb+Fl+Br, Hb+HF1+Br, Hb+HF2) was due to smaller quantities of AMPA resulting from fewer glyphosate applications and a smaller application area (Table 2). In the context of other environmental impacts, the relationship between normalized environmental impacts (Equation 3), and the case studies, treatment programs reported by Winer (Reference Winer2019) and the single application of other methods summarized in Table 1 are summarized in Figure 6. ${X_{\rm normalized}} = X - {X_{\min}}/{X_{\max}} - {X_{\min}}$
Principal components analysis (PAST® Statistical Software v. 5.2.1; Hammer et al. Reference Hammer, Harper and Ryan2025) of normalized environmental impacts (green line, blue text) for one calendar year case studies (dark blue text), zero-herbicide treatment programs described in Winer (Reference Winer2019) (dark red text) and single applications of selected methods from Table 1 (black text): Br, brushing; Fl, flame; Fr, freezing; Gly, glyphosate; HA, hot air; HF, hot foam; HW, hot water; IR, infrared; MW, microwave; SSt, saturated steam; St, steam; UV, ultraviolet. Components 1 and 2 explain 60.7% and 24.5% of variation, respectively.

where X is the impact value and min and max are the minimum and maximum values for that impact respectively.
Component 1 (Figure 6) was dominated by GHG emissions and fossil resource depletion/fuel consumption on the positive axis; the hot air, flame, hot water, and steam programs (Winer Reference Winer2019) were associated primarily with this part of the axis. The herbicide and IWM programs were associated on the negative side of this axis, where ecotoxicity becomes the main variable. The hot foam and saturated steam treatments had lower fossil resource depletion relative to other thermal treatments.
Multiple methods of weed control are available for hard surfaces in amenity areas. Each has its own associated environmental impacts, primarily as a function of the type and quantity of fuel used, herbicide active ingredient, frequency of application, and the efficacy of the method. Each method or combination of methods facilitates compliance with key legislation (the WFD 2000/60/EC; Article 2 of the Carbon Budget Order 2021) in varying degrees with individual strengths and weaknesses depending on where they are used.
Of the weed management programs evaluated in the Thanet study, the Hb followed by the IWM (Hb+HF+Br/Hb+HF) programs have the lowest GHG emissions and fossil resource depletion. Zero-herbicide weed control programs and methods tend to have greater compliance with the WFD 2000/60/EC (European Parliament 2000) but require greater inputs of fuel to achieve desired levels of weed control compared with a standard herbicide regime, counter to achieving the UK Sixth Carbon Budget (GOV.UK 2021a). In general, mechanical and thermal control methods require more frequent applications to control weeds to similar levels as a standard herbicide program (Böcker et al. Reference Böcker, Britz, Möhring and Finger2019; Kempenaar et al. Reference Kempenaar, Lotz, van der Horst, Beltman, Leemans and Bannin2007; Rask and Kristoffersen Reference Rask and Kristoffersen2007; Saft and Staats Reference Saft and Staats2002; van Dijk and Kempenaar Reference van Dijk and Kempenaar2013; Vermeulen et al. Reference Vermeulen, Verwijs and Kempenaar2006; Verschwele Reference Verschwele, Mueller, Sychev, Dronin and Eulenstein2021; Winer Reference Winer2019).
Herbicide
GHG emissions attributed to herbicide use tend to be low. A single application of glyphosate ranges between 0.001 and 0.007 kg CO2eq m−2 per application depending on the weed type being targeted, with perennial broadleaf species receiving four times the quantity of active ingredient compared with annual species (Lainsbury Reference Lainsbury2025). A key environmental impact of the standard herbicide, and to a lesser degree the IWM program, is ecotoxicity from the secondary metabolite of glyphosate, AMPA. The PLI (Rainford et al. Reference Rainford, Tzilivakis, Garthwaite, Jones and Lewis2023; Tzilivakis et al. Reference Tzilivakis, Lewis, Kennedy, Ridley and Garthwaite2026) identifies risk to specific non-target groups, fish and honeybees, that have been evaluated in detail as potential receptors of exposure. They represent activity within different media: water and plant surfaces. Water is a secondary receptor, that is, the active ingredient is not applied specifically to the zone, rather the active ingredient is deposited within it via either spray drift or surface runoff from pavement surfaces. The herbicide-only program had the highest ecotoxicity score, especially where there was a risk of surface runoff. The management of runoff from hard surfaces into surface water and groundwater is complex, with a range of contributory factors, for example, local weather, surface type, and catchment size (Brown et al. Reference Brown, Hughes, Hollis and Ramwell2009; Ramwell et al. Reference Ramwell, Heather and Shepherd2002). Impervious surfaces such as concrete facilitate pesticide runoff in residential areas (GOV.UK 2021b). Sorption of herbicides onto concrete and asphalt is limited compared with soils, and the fate of applied herbicides on hard surfaces depends more on physical processes than for soils (Ramwell et al. Reference Ramwell, Heather and Shepherd2002). Sloping hard surfaces may deposit herbicide active ingredients in adjacent habitats or in surface drains. Glyphosate formulations (including their additives) and weather conditions (e.g., precipitation) may also affect the efficacy and runoff of products from hard surfaces (Brown et al. Reference Brown, Hughes, Hollis and Ramwell2009; Kortenhoff et al. Reference Kortenhoff, Kempenaar, Lotz, Beltman and den Boer2001). Accounting for site-specific factors, for example, runoff risk, will modify the environmental impact of those treatments that use herbicides. Where surface runoff is a risk, the aquatic ecotoxicity impact score will potentially increase, coupled with the requirement for activated carbon to remove the active ingredients from water during the treatment process (Joseph et al. Reference Joseph, Kaetzl, Hensgen, Schäfer and Wachendorf2020). It is acknowledged that AMPA may enter watercourses due to the application of glyphosate products approved for aquatic weed control. The focus of the Thanet study is minimizing the potential for AMPA to be present within aquatic habitats as a result of glyphosate application within the terrestrial environment. Targeting the use of non-herbicide alternatives in high-risk areas is a means to mitigate the movement of herbicide active ingredients applied to hard surfaces within amenity areas into surface waters within the urban environment. This method is possible in the IWM programs where alternative weed control methods are applied in combination with glyphosate.
Alternative non-herbicide control methods may mitigate the risk of glyphosate in surface runoff, but a factor that may be overlooked is the impact of steam, flame, or mechanical treatments on biodiversity, for example, insects present on or within the immediate vicinity of the target plant, where fatality due to direct contact with a material >60 C is likely (Hammond Reference Hammond2014). The difference between these methods and herbicide is that the acute impacts on non-target areas, that is, watercourses, due to drift or surface runoff are negligible and, unlike AMPA, the likelihood of persistence or chronic exposure is negligible. Although these methods can be used near watercourses, in locations where pollinator activity is high, for example, near wildflower strips, the application of steam or saturated steam (wet thermal) should also be avoided. The temporal targeting of such methods, that is, timing when bee activity is lower in the morning or evening (Karbassioon and Stanley Reference Karbassioon and Stanley2023) is one potential option. This would, however, conflict with the recommendations of De Cauwer et al. (Reference De Cauwer, De Keyser, Biesemans, Claerhout and Reheul2016) to use thermal treatments in the late afternoon when transpiration rates are highest and weeds are most susceptible. Application during the early evening is a potential compromise.
Mechanical
The fuel consumed for each mechanical brushing application is lower than for each thermal treatment, an observation also noted by Coleman et al. (Reference Coleman, Stead, Rigter, Xu, Johnson, Brooker and Walsh2019), albeit for agricultural situations. Weeds are removed physically using steel brushes or “weed rippers” that apply mechanical force with rotating steel brushes. This method is more effective at controlling the weeds in the curb and channel and at the inside edge of the footpath. The control of taprooted weed species may not be as effective. Mechanical brushing was applied in combination with a flame treatment in the Hb+Fl+Br and Fl+Br programs. When considered as part of a treatment program overall, the consumption of propane by the flame treatment dominated the emissions profile. An equivalent of 3.4 applications of the mechanical brush treatment were required per program, that is, the sum of the proportions of the trial area treated. Brushing was replaced with hot foam completely in Year 3 due to the more prolonged weed control of foam observed during monitoring, although GHG emissions were lower in the Hb+HF+Br treatment compared with the Hb+HF. An advantage of steel brushing is the treatment of large areas (Brixham Town Council 2019). A disadvantage is the risk of causing damage to the paved surfaces and the base of street trees and furniture (Boonen et al. Reference Boonen, Beeldens, De Cauwer, Fagot and Reheul2015; Winer Reference Winer2019). Due to the vibrations associated with operating the machinery, three operatives were needed in the Thanet trials, which increased operating costs.
Thermal
Thermal treatments utilize lethal heat or thermal shock to rupture plant cells, that is, plasmolysis (Bauer et al. Reference Bauer, Marx, Bauer, Flury, Ripken and Streit2020; Winer Reference Winer2019). The methods are classed as either “wet” (hydrothermal), where the heat is dispensed via a secondary medium (water, steam, or foam) or as “dry” (hot air or flame), where the transfer of heat is direct.
Wet
Hot water, steam, saturated steam, and hot foam are classed as wet or hydrothermal methods of weed control. Hydrothermal weed control methods are reported to gradually deplete the seedbank and reduce application costs over time (Winer Reference Winer2019), usually by the third year (Rask and Kristoffersen Reference Rask and Kristoffersen2007). This was noted in the Thanet case studies, where brushing was replaced with hot foam, a method that may represent a more long-term strategy. The introduction of hot foam also enabled weed control in areas where access was problematic to brushing or flame methods, for example, along gullies with parked vehicles. Compared with the weed control programs that used hot water or steam reported by Winer (Reference Winer2019), hot foam applied from spring onward (HF1, HF2) in the Thanet study had lower GHG emissions, correlated with lower fuel consumption.
Each zero-herbicide method is typically more suited to the control of a specific weed species or plant functional group. Species considered by de Cauwer et al. (Reference De Cauwer, Bogaert, Claerhout, Bulcke and Reheul2015) included taprooted species such as Taraxacum spp. that may be problematic to remove by zero-herbicide weed control methods, especially mechanical. Hot foam was effective at removing annual weeds, preventing regrowth of the potentially problematic P. annua prevalent in the Thanet trials. It delays but does not eliminate the growth of Taraxacum spp. Unlike other heat treatments, foam damages the plant meristem (Defra 2016); however, dormant tissues below the pavement surface may be less affected, allowing the eventual regrowth of new leaves, which requires repeated treatments. Hot water penetrates below the soil surface and transfers thermal energy to the roots, damaging growth points underground (Latsch et al. Reference Latsch, Anken, Herzog, Sauter and Moonen2017). Where Taraxacum spp. are an issue on pavements, hot water, according to Latsch et al. (Reference Latsch, Anken, Herzog, Sauter and Moonen2017), represents a potentially more effective solution, but it requires targeted application due to its high fossil resource depletion (Winer Reference Winer2019).
Other wet thermal methods available include steam, but compared with saturated steam, it is less efficient, using double the propane for a single treatment (Rifai et al. Reference Rifai, Astatkie, Lacko-Bartosova and Gadus2002; Winer Reference Winer2019), with six to eight applications needed per annum compared with four (Vermeulen et al. Reference Vermeulen, Verwijs and Kempenaar2006; Winer Reference Winer2019). Lethal heat occurs at temperatures above 60 C for plants, and thermal shock at higher temperatures is more destructive than slow heating using dry thermal methods such as hot air (Winer Reference Winer2019).
Dry
Dry thermal methods also use lethal heat to rupture plant cells but instead transfer heat directly as hot air or flame. The environmental impact of the programs that included flame treatments (Hb+Fl+Br, Fl+Br) tended to be higher due to the quantity of propane consumed per application by flame-weeding and are relatively consistent with values reported by Astatkie et al. (Reference Astatkie, Rifai, Havard, Adsett, Lacko-Bartosova and Otepka2007), Knežević and Ulloa (Reference Knežević and Ulloa2007), Ulloa et al. (Reference Ulloa, Datta and Knezevic2010), and Winer (Reference Winer2019). The mechanism of heat transfer differs compared with the hydrothermal methods. The temperature of a flame is higher, and the need to transfer energy from one medium to another is eliminated, that is, the heat transfer process is more efficient. The heat delivered may be diverted away from the target plant under windy conditions when convection is high. Dry heat treatments also do not penetrate the crown of the plants, whereas the moisture in wet heat allows for a more rapid transfer of lethal heat into plant cells (Winer Reference Winer2019). The efficiency associated with the higher temperature of the flame method is effectively countered by the more rapid transfer of heat by hydrothermal methods.
IWM
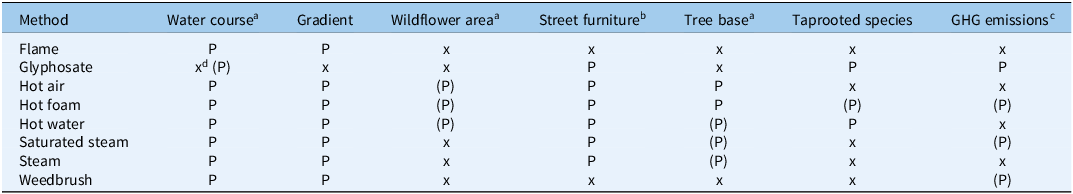
Minimizing the environmental impact of individual methods requires more weed-targeted methods using a combination of methods. Zero-herbicide weed control methods did not maintain weed levels below required thresholds compared with those that use herbicide either completely or as a component of an IWM program. Zero-herbicide methods are potentially more susceptible to inter-year variability in efficacy due to annual fluctuations in weed growing conditions, for example, temporal variation in rainfall and temperature between years (van Dijk and Kempenaar Reference van Dijk and Kempenaar2013). In response, the timing and frequency of zero-herbicide weed control interventions also varies between years and as a function of the type of weed species present during the season and its severity. It is acknowledged that such limitations potentially exist for herbicides when monitoring weed levels as part of an IWM program. A shift in the dominance of weed species or species of a given plant functional group, for example, taprooted perennial species, may occur where a single method such as mechanical brushing is used (De Cauwer et al. Reference De Cauwer, Bogaert, Claerhout, Bulcke and Reheul2015; Winer Reference Winer2019). As a result, some local authorities in the UK have either implemented or are considering implementing a reversal of their original decision not to use glyphosate (HortWeek 2024). A key reason cited includes concern over health and safety where access may be obstructed due to weed growth. It is notable, however, that where glyphosate is being reintroduced, it is used in a more targeted manner as part of an IWM method, with application limited to, for example, only weed growth where it is a potential trip hazard (HortWeek 2024). This is in response to continued monitoring as opposed to a prophylactic application at specified times of the year. The targeted use of glyphosate has a potential role in effective urban weed management as part of an IWM method, but its application is not suitable everywhere. Likewise, mechanical or thermal methods are not suitable in all locations, namely, where street furniture or parked vehicles are present due to the risk of causing physical damage (Boonen et al. Reference Boonen, Beeldens, De Cauwer, Fagot and Reheul2015; Winer Reference Winer2019). Key methods and their potential advantages/limitations within urban environments are summarized in Table 7.
Compatibility of weed control methods with urban environmental parameters: P = suitable, (P) = with caution/partial efficacy, x = not suitable.

a 1-m zone.
b 0.5-m zone.
c GHG, greenhouse gas emissions.
d Glyphosate product approved for weed control in aquatic environments subject to Environment Agency approval.
The application of a standard glyphosate formulation is not suitable within 1 m of a sensitive habitat feature (Lainsbury Reference Lainsbury2025). Alternative glyphosate products suitable for the control of aquatic weeds are also available subject to approval by the Environment Agency (Environment Agency 2017). Such products differ in, for example, the type of adjuvant applied in combination with glyphosate. The presence of AMPA in aquatic systems may potentially result from the use of such products in addition to the standard glyphosate formulations applied to amenity hard surfaces that are the focus of the Thanet study. Likewise, the mechanism of thermal delivery impacts the level of risk to non-target beneficial species such as pollinating insects or natural predators, for example, ground beetles (Carabidae). Steam and saturated steam that form aerosols in the vicinity of the target plant (Winer Reference Winer2019) may not be suitable methods in areas where pollinator or ground beetle activity is likely. Hot foam and hot water, while having the potential to cause insect mortality, are delivered more directly to the immediate zone of the plant surface and are classed as “apply with caution” within zones adjacent to wildflower areas.
IWM uses multiple methods with associated advantages and disadvantages. An ideal hard-surface weed control method will have low ecotoxicity and consume small amounts of fuel when implemented over large areas. The flexibility to apply glyphosate as multiple applications while maintaining the overall quantity applied to below 50% of that in a standard herbicide program within a growing season has potentially one of the lowest environmental impacts overall, especially where surface runoff is a risk. In reference to the factors in Table 7, targeted glyphosate application may be a more viable option to control problematic weed species that would otherwise need multiple thermal or mechanical treatments, consuming large quantities of fuel in the process. Where sensitive habitat features are present, the IWM method has the flexibility of enabling alternative methods to be used. Aquatic ecotoxicity, primarily due to AMPA, will potentially decrease if non-herbicide methods are used adjacent to watercourses, especially where a gradient is present. The Dutch SWEEP decision support system (Kempenaar and van Dijk Reference Kempenaar and van Dijk2006) provides guidelines on how to minimize the environmental impacts associated with herbicide ecotoxicity. The main principles are targeted herbicide application that avoids hard surfaces within 1-m zones of surface waters or in a 1-m zone around gully pots. Further refinements include no spraying when the probability of rain >40% and >1 mm to reduce the risk of surface runoff. In zones near wildflower areas where the likelihood of insect activity is high, some non-herbicide methods, for example, steam that creates an aerosol (Winer Reference Winer2019), would be better avoided, with hot foam providing a more direct targeted method that contains the thermal process within a zone close to the surface of the target plant. The fossil fuel consumed by zero-herbicide methods is largely dependent on the type and number of management operations that take place, which are method, site, and weed species dependent. Accurate recordkeeping, continual monitoring of weed populations, and timely action before weed threshold levels are reached were key to the success of the IWM method in the Thanet study. Recordkeeping allows the optimal targeting of control methods to minimize the environmental impact and maximize efficacy. It allows the creation of a treatment profile for individual treatment zones where weed species and local environmental parameters are documented to formulate the appropriate spatial targeting of individual methods. Such zones can be mapped and reviewed continually. Other potential methods for use in an IWM program include biological control (Dar et al. Reference Dar, Zahir, Ahmad, Hussain, Jaffar and Kremer2024; Paynter Reference Paynter2024), although their efficacy in urban environments is yet to be determined. Looking further ahead, the use of robotics and artificial intelligence are reported as pilot studies by Balabantaray et al. (Reference Balabantaray, Behera, Liew, Chamara, Singh, Jhala and Pitla2024). Artificial intelligence has the potential to identify and then target weeds by individual species, modifying the method or adjusting the application rate in response to their life-history strategies.
No single method or complete weed control program is without environmental impacts; the non-herbicide methods require greater inputs of fuel that result in greater emissions of GHGs compared with the application of herbicide. Herbicide uses lower quantities of fuel, but has higher environmental impacts associated with terrestrial and aquatic ecotoxicity. All methods are subject to practical limitations. Each method and treatment program requires consideration of all environmental impacts, the type of weed being treated, and local environmental parameters. Zero-herbicide methods may be more susceptible to inter-year variability in weed control efficacy due to annual fluctuations in the quantity and timing of rainfall. The IWM program that combines multiple methods has the flexibility to minimize impacts if individual methods are targeted optimally in response to these factors. Weed control using IWM can be as effective as a herbicide-only regime providing that herbicide application is targeted to the more persistent weeds, and the choice of non-chemical control techniques allows access to more difficult to reach areas. Glyphosate may be the best option to control problematic weed species that would otherwise consume large quantities of fuel if thermal or mechanical methods are used. Other herbicide active ingredients are available and ideally should be used in rotation depending on the weed species and location and in combination with non-herbicide methods to delay the potential development of weed resistance. Aquatic ecotoxicity may be minimized if non-herbicide methods are used adjacent to watercourses, although some ideally should be avoided where the likelihood of beneficial insect activity is high. Accounting for spatial and temporal variation in efficacy and environmental risk combined with accurate recordkeeping allows a unique weed control profile for individual treatment zones to be formulated. This allows the optimal targeting of treatments in the future.
Supplementary material
To view supplementary material for this article, please visit https://doi.org/10.1017/wsc.2026.10119
Acknowledgments
The authors are grateful to the technical staff at NIAB-EMR for assistance with fieldwork, Kent County Council UK, and the weed trial contractors (Languard Ltd, UK).
Funding statement
The Thanet weed control trials were funded by the Department for Environment, Food and Rural Affairs (Defra) UK under project code PS2802.
Competing interests
The authors declare no conflicts of interest.


 Open access