


People often work to have their views of the world implemented with an intensity and effort that goes beyond what can be rationalised by their material or private interests. Understanding this type of effort is central to political science as it plays an important role in activities such as participation in civil society, revolutions and voting. However, the preferences of the people affected by these political activities often vary and prescribe mutually excluding policies. How does people’s motivation to implement their views relate to whether these views are shared by those affected by their actions?
Motivation to implement one’s views can be closely related to the views of the affected. People could believe that the affected share their view and wish for the affected to live in a world in accordance with these views. We define this motivation as non-paternalist: positively dependent on the views of the affected. Alternatively, the motivation can be unrelated to the views of the affected. People could wish to align the world with their own views, or to simply express their views. We define this motivation as paternalist: independent of the views of the affected. Footnote 1
To test for non-paternalist motivation, we study willingness to implement redistribution upon others in an incentivised online experiment. We investigate how participants’ motivation is related to whether the affected share the decision-maker’s view of whether it is fair to redistribute. Footnote 2 For a person with non-paternalistic motivation, a willingness to impose redistribution is given by how many in an affected group she believes find redistribution fair. However, if she has a purely paternalistic motivation for implementing redistribution, there is no reason to expect that the share of individuals sharing her view will affect her decision.
We recruited participants with IP addresses registered in the USA on Amazon MTurk platform during the summer of 2017. We randomly assign participants to one of two roles: spectators, who make decisions for which they have no private incentives, or workers, who complete tasks for payment. We then study the spectators willingness to pay to have the workers’ payment distributed in the way the spectators find fair. If spectators have a non-paternalist motivation, we should expect to observe the following: (I) If a spectator receives information that fewer workers than she expects share her view, then this information should reduce the spectator’s motivation to implement her view. Furthermore, assuming that beliefs and preferences are uncorrelated, we should also expect: (II) Spectators believing that more workers share their fairness view should be more likely to be willing to implement their view upon the workers. Footnote 3
We first ask what spectators perceive to be a fair way to distribute income in the following scenario: A pair of workers are assigned the task of identifying which letter is next a number on a list. Each worker is assigned a separate independently randomly drawn price between one and ten cents per correctly identified number–letter combination. The distribution alternatives are either full redistribution, where workers earn a payment equal to their combined earnings divided by two, or no redistribution, such that workers are paid their individual earnings. The spectators are then told that some workers have completed this task and asked how many of the workers they believe share their fairness view. They are then assigned a pair of workers who has completed a task identical to the one in the scenario. The spectators are given a choice to pay two cents to implement the option they report to be fair upon their pair of workers. Footnote 4 If they do not pay, the distribution option they find to be the least fair is implemented upon the workers.
In the treatment session, spectators are informed about the true prevalence of their fairness view among the workers. The information is given after the spectators reported their expected prevalence but before deciding whether to pay to implement the distribution alternative they find fair. This information is given to see if the number of workers sharing the spectator’s fairness view is relevant information to the spectator’s decision of whether to implement. Footnote 5
The data support two findings. Footnote 6 First, we find spectators’ willingness to implement what they consider to be a fair distribution completely uncorrelated with their perception of how many share their fairness view among the workers. This can be seen from Figure 1. The lack of correlation can also be seen from the pairwise comparison of the prevalence estimates of participants implementing or not implementing in the column of Table 1 labelled “Prevalence estimate”. Regression model (1) in Table 2 confirms this impression. Footnote 7
Histograms of Spectators’ Implementation Rates and Prevalence Estimates of Workers’ Fairness Views.
NOTES: The bottom (blue) bars represent the portion of spectators who are willing to pay to implement their redistribution preference, while the top (magenta) bars are spectators choosing not to implement their preferred redistribution. The total bars show spectators with a prevalence estimate within the bin on the horizontal line. The dotted vertical lines depict the true prevalence of redistribution preferences among the workers. If spectators had non-paternalist motivation it would lead to the following differences: (I) Fewer spectators in the information treatment group should choose to implement among the spectators estimating that more workers than actually shared their fairness view. This should lead to relatively less spectators implementing in the areas to the right of the dotted vertical lines of distributions of the treatment group. (II) Implementation rates should be higher for spectators estimating that fewer workers than actually shared their view. This should lead to more spectators implementing in the areas to the left of the dotted vertical lines of the distributions of the treatment group. The change in distributions should increase with the distance from the dotted vertical line. The Kolmogorov–Smirnov test of distributional equality, presented in Appendix B.5, confirms the visual impression from the graphs: there is no evidence that the implementation rates distributions of the information treatment and control groups are not from the same distribution.

Descriptive Statistics

NOTES: The column labelled Treatment Group divides spectators into categories according to whether they received the information treatment or not. The column labelled Fairness View divides spectators into categories according to whether they found redistribution or no redistribution fair. The column labelled Number of Spectators shows the number of spectators having different fairness views for the different categories. The column labelled Implemented or Not divides spectators into categories according to whether they implemented or not. The column labelled Percentage of Spectators shows the percentage of spectators implementing their fairness view upon the workers for each row category. The column labelled Prevalence Estimate shows spectators average estimate of how many workers they believe share their fairness view for each row category. The column labelled True Prevalence shows the true prevalence of the two redistribution options among the workers.
Regression Analysis of Effect of High Prevalence Estimate, Treatment Effect, and Difference-in-Difference Model Including Both
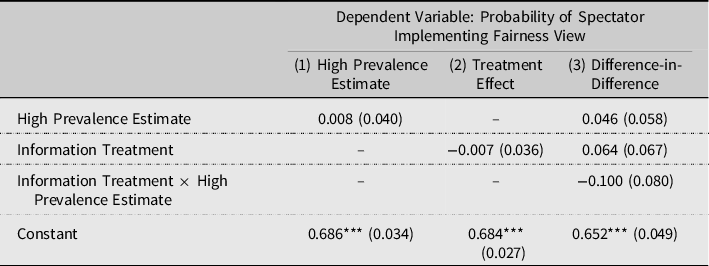
NOTES: *p < 0.1; **p < 0.05; ***p < 0.01. Standard errors in parentheses. “High Prevalence Estimate” represents a binary variable, which equals 1, if the spectator’s estimated prevalence of her fairness view was higher than the actual prevalence of her view among the worker participants. “Information Treatment” represents a binary variable, which equals 1, if the spectator was part of the group that was informed about the true prevalence before choosing to implement the redistribution option they found fair. The interaction term, “Information Treatment × High Prevalence Estimate”, is the product of the two aforementioned binary variables. All the regression models are estimated on the full 672 observation sample using Ordinary Least Square regression.
Second, we find that although participants overestimate the prevalence of their fairness view among the workers, there is no evidence that being informed about the true prevalence affects their decision of whether to implement. Footnote 8 The absence of any treatment effect is confirmed by Regression model (2) in Table 2. It shows that the willingness to implement does not significantly vary across the treatment and control groups. Being informed about the true prevalence had no effect for spectators finding redistribution or no redistribution fair, irrespective of finding their view to be shared by either a majority or a minority of the workers. Footnote 9 There was not any evidence of interaction effects between spectators having high prevalence estimates and getting the information that one’s fairness view was shared by fewer workers than expected. Footnote 10
Both findings, the absence of any treatment effect and the lack of correlation, were surprising and were the opposite of the pre-specified hypotheses in the pre-analysis plan (Chen and Schøyen, Reference Chen and Schøyen2017). Generally, the data indicate that the spectators’ motivation for implementing their preferred redistribution was independent of the fairness views of those affected. The low implementation price of two cents left little room for willingness to pay to be affected by the prevalence information without observing a change in the number of spectators choosing to implement. The absence of any effect of being informed about the true prevalence of fairness views, combined with the overestimation of prevalence, provides causal evidence suggesting that any non-paternalistic motivation is not important among the spectators. The appropriate caveats need to be made when interpreting the data as support for paternalist motivation, as the cost of implementation was fixed and low. The spectators’ implementation behaviour can be motivated in a number of ways, and further study is needed to establish what drives the willingness to implement one’s views on groups. Possible motivations for this behaviour are a notion of how redistribution ought to be, or a purely expressive behaviour of one’s fairness view.
Acknowledgements
We are grateful to the FAIR Centre, Department of Economics, Norwegian School of Economics (NHH) for organisational support in conducting the experiment. The authors would like to thank Bertil Tungodden for excellent comments and encouragement. We would also like to thank Mathias Philip Ekström, Eirik Andre Strømland, Ole-Andreas Elvik Næss, Andrea Mannberg, Jonas Tungodden and seminar participants at NHH, Xi’an Jiaotong University, and the 2017 Norwegian Meeting of Economists for their comments. Schøyen gratefully acknowledges the warm hospitality at Hitosubashi University’s Institute of Economic Research where part of this work was done.
Supplementary material
To view supplementary material including appendices for this article, please visit https://doi.org/10.1017/XPS.2021.12
Data availability statement
Support for this research was provided by the Research Council of Norway (grant no. 262636 and 262675). In addition, the Japan Society for Promotion of Science provided financial support to Schøyen, as an International Research Fellow. The data, code and any additional materials required to replicate all analyses in this article are available at the Journal of Experimental Political Science Dataverse within the Harvard Dataverse Network, at https://doi.org/10.7910/DVN/VPLWKF.
Conflicts of interest
The authors have no conflicts of interest.


 Open access