Introduction
Metamorphic rocks record evidence of change in pressure (P) and temperature (T) with time (t), commonly expressed as a P–T–t path, which represents the record of heating and cooling during burial and exhumation derived from mineral assemblages and compositions combined with geochronology (e.g. Brown, Reference Brown1993, Reference Brown2001). In effect, the P–T–t path records the changing spectrum of transient geotherms characteristic of a particular tectonic setting (England and Richardson, Reference England and Richardson1977; Richardson and England, Reference Richardson and England1979; England, Reference England1987). Different settings are characterised by different ranges of transient geotherms and register different metamorphic imprints in the rock record as a result (Brown, Reference Brown2007, Reference Brown2014; Brown and Johnson, Reference Brown and Johnson2018). By inverting the mineralogical and compositional information encoded in metamorphic rocks, we constrain the thermal evolution of Earth's crust.
Earth's radiogenic heat production has declined by >75% since the Hadean (Artemieva et al., Reference Artemieva, Thybo, Jakobsen, Sørensen and Nielsen2017) while mantle potential temperature (T P—the temperature the mantle would have at the surface if it were decompressed along an adiabat without undergoing melting) may have declined by ~200–300°C since c. 3.0 Ga (Herzberg et al., Reference Herzberg, Condie and Korenaga2010). Although uncertain, the ΔT P (the difference between the T P of the mantle at the present day and at some point in time in the past) at the start of mantle convection—after crystallisation of the last magma ocean—may have been ~200°C warmer than at present (Labrosse and Jaupart, Reference Labrosse and Jaupart2007). Whether or not the mantle was warming during the early Archean, the higher ΔT P implies extensive melting and alternating growth and foundering of the lithosphere (Johnson et al., Reference Johnson, Brown, Kaus and VanTongeren2014; Sizova et al., Reference Sizova, Gerya, Stüwe and Brown2015). Modelling the evolution of mantle T P for different geodynamic modes (Fig. 1) shows that either a plate tectonic regime with constant surface heat flow and low present-day Urey ratio or a switch in heat-flow scaling at relatively low present-day Urey ratio from a stagnant lid regime (a regime with an upper stagnant layer on top of the convecting mantle; lower heat flow) to a plate tectonics regime (higher heat flow) at 3 Ga or 2 Ga, but not at 1 Ga, replicate petrological estimates of the mantle T P (from Herzberg et al. (Reference Herzberg, Condie and Korenaga2010), using the modified ages of Johnson et al. (Reference Johnson, Brown, Kaus and VanTongeren2014); figures modified after Korenaga, Reference Korenaga2013, Reference Korenaga2017). Thus, whatever the geodynamic mode in the Archean, plate tectonics can explain the evolution of mantle T P since the mid-Paleoproterozoic.
The evolution of mantle potential temperature (T P) modelled with (a) constant surface heat flow and low present-day Urey ratio of 0.22 (after Korenaga, Reference Korenaga2017) and (b) with a switch in heat-flow scaling and relatively low present-day Urey ratio of 0.35 from stagnant lid (lower heat flow) to plate tectonics (higher heat flow) at 3 Ga, 2 Ga or 1 Ga (modified after Korenaga, Reference Korenaga2013). The T P data are taken from Herzberg et al. (Reference Herzberg, Condie and Korenaga2010), using the modified ages of Johnson et al. (Reference Johnson, Brown, Kaus and VanTongeren2014).
The thermal history of the crust is preserved in the metamorphic rock record (Brown and Johnson, Reference Brown and Johnson2018), where metamorphism is due to heat generated by radioactive decay and viscous dissipation, and heat influx from the mantle. At the present day, different plate tectonic settings exhibit contrasts in heat flow that are registered as differing metamorphic facies series in distinct crustal terranes (Miyashiro, Reference Miyashiro1961), although how far back in time these relationships are reliable is unclear. Furthermore, the thermal effects of the formation and breakup of supercontinents since the beginning of the Proterozoic are poorly characterised.
In 1987 Stephen Jay Gould introduced us to a powerful pair of lasting metaphors—time's arrow and time's cycle—by which the community has tried to understand the concept of deep time. In his words “time's arrow is the intelligibility of distinct and irreversible events, while time's cycle is the intelligibility of timeless order and lawlike structure” (Gould, Reference Gould1987, p. 15–16). However, the arrow and the cycle “do not blend, but dwell together in tension and fruitful interaction” (Gould, Reference Gould1987, p. 200). It should already be clear that the secular decline in heat production and in mantle T P since 3.0 Ga are examples of time's arrow, whereas the cyclic formation and breakup of the supercontinents represents an example of time's cycle.
In this article, we discuss how these two concepts apply to the crustal record of metamorphism as a proxy for the heat budget of the crust through time, with particular reference to granulite facies metamorphism and geodynamics. First, we evaluate the metamorphic rock record by compiling T, P, thermobaric ratio (T/P) and age (t) of metamorphism for 564 localities from the Cenozoic to the Eoarchean, although before the Neoarchean data are sparse (dataset updated 28 February 2018; Brown and Johnson, Reference Brown and Johnson2019).
It is essential to understand what these data represent, as metamorphism is a dynamic process that varies in space and time even within a single orogenic belt. Ideally, each datum records a point on a transient geotherm crossed during an evolution from cooler to warmer geotherms (decompression with heating; clockwise P–T–t path (CW)) or warmer to cooler geotherms (compression with cooling; counter-clockwise P–T–t path (CCW)). The mineral assemblage, mode and composition, and ‘age’ of metamorphism become fixed at some point along the P–T–t path, but not necessarily at the same point! P max and T max normally do not coincide, so along CW P–T–t paths P max generally occurs before T max (Fig. 2). However, along CCW P–T–t paths T max generally occurs before P max. A derived P–T datum is commonly inferred to record ‘peak’ conditions, but may record conditions close to P max or T max (Fig. 2). Historically, ages have been inferred to record the timing of ‘peak’ P–T, but more commonly they record a time along the late prograde or early retrograde path, although the difference may not be significant in this type of analysis, in particular for localities of Precambrian age. Importantly, during the past decade our ability to link ages derived from both rock-forming and accessory minerals with P–T has improved significantly (Baxter and Scherer, Reference Baxter and Scherer2013; Engi et al., Reference Engi, Lanari and Kohn2017). By careful selection of data, we expect to minimise errors related to the necessary assumption of synchroneity among T, P and t.
The thermal consequences of thickening continental crust by instantaneous thrusting at a depth of 24 km (modified after fig. 22.8 of Philpotts and Ague, Reference Philpotts and Ague2009; thermal properties of the rocks as given by those authors with an erosion rate of 0.4 m per 1000 years). The geotherms (shown in red from 0 to 40 Ma) and the P–T paths (dashed blue lines at depths from 25 to 50 km) evolve with time (i.e. the geotherms are transient and not steady state), and P max does not coincide with T max. The thick black line through T max for the nested P–T paths is the metamorphic field gradient or piezothermic array, which lies in the kyanite stability field.
The metamorphic record
To evaluate the metamorphic rock record, we first examine the bivariate distribution of T versus P, which enables us to distinguish various types of metamorphism on the basis of thermobaric ratio (T/P). Thermobaric ratio is a more useful parameter than T or P because on contemporary Earth each type of metamorphism is associated with a particular plate tectonic setting, as discussed below. Insofar as metamorphic P can be translated to depth, the thermobaric ratio (T/P ~ T/z) can be viewed as a proxy for the transient geothermal gradient recorded by a metamorphic rock at the metamorphic peak. To highlight this relationship, discussions of earlier versions of this dataset (Brown, Reference Brown2006, Reference Brown2007, Reference Brown2014; Brown and Johnson, Reference Brown and Johnson2018) used the term ‘apparent thermal gradient’. However, after discussion with Sumit Chakraborty (personal communication, January 2019) we now prefer the term thermobaric ratio to avoid any possible confusion with the true geothermal gradient or the geotherm or the metamorphic field gradient. In addition, we consider T, P and T/P versus age (t), which permits us to assess secular change, and we plot the probability density function (PDF) of age, which allows us to determine cyclic variations.
Although we use the thermobaric ratio as a proxy for the transient geotherm recorded by a metamorphic rock at the peak of metamorphism, it is important to emphasise the distinction between the thermobaric ratio (the apparent thermal gradient as we have used it previously) and the range of transient geotherms as an orogen evolves, the P–T–t path as a metamorphic rock is buried and exhumed, and the polychronic metamorphic field gradient or piezothermic array defined by several metamorphic rocks with nested P–T–t paths (Brown, Reference Brown2001). These relationships are shown in P–T space in Fig. 2. Note that the apparent thermal gradient that would be defined by the thermobaric ratio (i.e. the slope of T/P, for example at T max) is not coincident with any of the transient geotherms, because the geotherms are nonlinear and are commonly convex to the T axis in P–T space (Fig. 2). Similarly, if the P–T datum records a singular point on a P–T–t path that is defined by the locus of an infinite number of P–T points each representing a specific transient geotherm crossed during an evolution from colder to warmer geotherms or vice versa, then the P–T datum also records a singular point on a specific geotherm at an instant in time. Again, the apparent thermal gradient defined by the thermobaric ratio is not coincident with any transient geotherm, and the P–T–t path crosses both the geotherm and the apparent thermal gradient at a high angle. By contrast, the metamorphic field gradient or piezothermic array represents the locus of T max values for a set of nested P–T–t paths (Fig. 2), with each path corresponding to a different initial depth and each T max being recorded at a different point in time (England and Richardson, Reference England and Richardson1977; Richardson and England, Reference Richardson and England1979). As the metamorphic field gradient, or piezothermic array, is polychronic and generally non-linear, commonly concave towards the T axis in P–T space, it does not coincide with either the transient geotherms or the apparent thermal gradient defined by the thermobaric ratio.
Although it is an imperfect representation of dynamic processes, we emphasise that the thermobaric ratio allows us to link quantitative data from metamorphic rocks to different tectonic settings on modern Earth and to assess how the tectonic processes of Earth might have changed through time. Other useful ways to investigate metamorphism and tectonics include comparisons between the retrograde P–T–t paths, which can be used to distinguish metamorphism terminated by erosion from that terminated by extension (England, Reference England1987), and variations in length scales, time scales and rates, which can be used to assess, for example, mechanisms of exhumation (Willigers et al., Reference Willigers, van Gool, Wijbrans, Krogstad and Mezger2002; Kylander-Clark et al., Reference Kylander-Clark, Hacker and Mattinson2012; Harley, Reference Harley2016).
Pressure, temperature and age data
The ideas expressed here represent the latest report of an ongoing project to evaluate secular change in metamorphism in relation to possible changes in geodynamic mode on Earth. At the beginning, Brown (Reference Brown2007) grouped an initial dataset of metamorphic rocks from 144 localities into three based on the rock types, as follows: granulites and ultrahigh-temperature (UHT) metamorphic rocks (G-UHT, n = 16 and 30, respectively); medium-temperature (MT) eclogites and high-pressure (HP) granulites (E-HPG, n = 42); and, lawsonite blueschists and lawsonite eclogites (HP), and ultrahigh pressure (UHP) metamorphic rocks (HP-UHP, n = 26 and 30, respectively). Each of these groups defined a range of apparent thermal gradients. Subsequently, with the expansion of the dataset to 456 localities and the inclusion of rock types such as metapelitic migmatites and garnet amphibolites that were not covered by the original definitions, Brown and Johnson (Reference Brown and Johnson2018) renamed the three types of metamorphism in terms of their range of apparent thermal gradients. However, as discussed above, we now prefer the term thermobaric ratio to avoid any possible confusion with geothermal gradients or geotherms.
This study is based on an extensive review of literature data up to the end of February 2018 (Brown and Johnson, Reference Brown and Johnson2019). We have restricted the dataset to crustal protoliths, so we do not include data from orogenic peridotites. Also, we exclude occurrences of ultrahigh-pressure minerals in chromitites associated with ophiolitic complexes and in mantle xenoliths. The principal outputs that we use are quantitative estimates of pressure (P) and temperature (T), which we combine with geochronology to determine the age (t) of each P–T datum. Thus, the first requirement for inclusion in the dataset is that all three of P, T and t are available for a particular sample or locality. Next our analysis relies on two important features of high-temperature and high-pressure metamorphic rocks. First, that the close-to-peak mineral assemblages are robust recorders of P and T. At higher temperatures, prograde dehydration and melt loss produce mineral assemblages that are difficult to retrogress or overprint without fluid influx. For this reason, the initial studies were limited to rocks equilibrated under conditions of relatively high temperature, such as granulites and eclogites (Brown, Reference Brown2007, Reference Brown2014). Thus, for granulite facies metamorphism at P < 1 GPa, a minimum temperature for inclusion was set at 700°C, whereas for higher pressure metamorphism at T < 700°C a minimum pressure of 1 GPa was applied to ensure a reasonable minimum temperature and the likelihood of an equilibrated peak mineral assemblage.
However, we are cognisant that as methods improve progressively lower-grade metamorphic rocks may be incorporated in the dataset, providing a reliable age for the peak metamorphism is also available. Thus, in the current dataset we include in the high T/P type seven localities with T <700°C, in the intermediate T/P type eleven localities with P of 0.8–1.0 GPa, and in the low T/P type one locality with P <1.0 GPa. In the high T/P type we include two localities from well-known regional-scale UHT contact-metamorphic aureoles (Rogaland in southern Norway and Makhavinekh Lake in eastern Canada). Additionally, we are cognisant that in rocks overprinted during exhumation, close-to-peak phase assemblages are commonly preserved as inclusions in rock-forming or accessory minerals, which has proved to be important for retrieving reliable information from UHP metamorphic rocks.
In Fig. 3a, we show conditions of ‘peak’ metamorphism for the enlarged dataset of 564 localities used in this study (Brown and Johnson, Reference Brown and Johnson2019) grouped into three types, with representative apparent thermal gradients and the normal geotherm from Stüwe (Reference Stüwe2007). The normal geotherm is the stable geotherm for thermally equilibrated lithosphere calculated to pass through 500°C at 35 km depth and 1200°C at 120 km depth. Active orogens are not characterised by stable geotherms, but by transient geotherms valid for a particular point in time (Fig. 2).
Conditions of ‘peak’ metamorphism for 564 localities with robust pressure (P), temperature (T) and age (t) grouped by type (a), with the ‘normal’ geotherm from Stüwe (2007; thick translucent white line) and representative apparent thermal gradients (thin dashed lines). The three types of metamorphism shown in (a) are low T/P metamorphism in blue (n = 189), intermediate T/P metamorphism in orange (n = 152) and high T/P metamorphism in red (n = 223). In (b), all data, in (c) data <850 Ma in age and in (d) data ≥850 Ma in age are contoured for density. Note, the ‘normal’ geotherm only applies to the tectonic regime since 850 Ma. Before that time the average crustal geotherm must have been hotter since all the data plot below the ‘normal’ geotherm.
Following Brown and Johnson (Reference Brown and Johnson2018), we distinguish three types of metamorphism as follows: high T/P type (T/P >775°C/GPa; n = 223; red dots), including common and UHT granulites; intermediate T/P type (T/P between 775 and 375°C/GPa; n = 152; orange dots), including HP granulites and MT to high-temperature (HT) eclogites; and, low T/P type (T/P <375°C/GPa; n = 189; blue dots), including blueschists, low-temperature (LT) eclogites and UHP metamorphic rocks. For high T/P metamorphism, the mean temperature is 848 ± 112 (1σ) °C, the mean pressure is 0.80 ± 0.18 (1σ) GPa and the mean T/P is 1106 ± 245 (1σ)°C/GPa. For intermediate T/P metamorphism, the mean temperature is 793 ± 106 (1σ) °C, the mean pressure is 1.43 ± 0.36 (1σ) GPa and the mean T/P is 578 ± 116 (1σ) °C/GPa. For low T/P metamorphism, the mean temperature is 631 ± 145 (1σ) °C, the mean pressure is 2.64 ± 1.0 (1σ) GPa and the mean T/P is 254 ± 60 (1σ) °C/GPa.
On the contemporary Earth, each of these types of metamorphism is associated with a distinct plate tectonic setting. Low T/P metamorphism, composed of dominantly blueschists and LT eclogites, and UHP (coesite and/or diamond-bearing) eclogites, is associated with subduction and occurs in accretionary orogens and along sutures in collisional orogens. This type of metamorphism may record variable P–T–t paths, either CW or CCW. Intermediate T/P metamorphism, composed of dominantly HP granulites and MT/HT eclogites, is associated with mountain belts in collisional orogens. This type of metamorphism generally records CW P–T–t paths. High T/P metamorphism, composed of dominantly migmatites, common granulites and UHT granulites, is associated with orogenic hinterlands, such as plateaus, which are generally associated with high heat production due to thickened crust but low erosion rates that generally generate CW P–T–t paths. Alternatively, high T/P metamorphism occurs in arcs and backarcs, where post-extension thickening and thermal decay generally generate CCW P–T paths. Care should be exercised in extrapolating these relationships back in time. However, we do not agree that thermobaric ratios cannot be used to discriminate different types of orogenic settings as argued by Nicoli et al. (Reference Nicoli, Moyen and Stevens2016), as we show below, at least as far back as the mid-Paleoproterozoic.
In Fig. 3b we show a contoured plot of all 564 localities. It is important to remember that the classical distinction between granulites and high-pressure granulites is based on the mineral assemblages in basic and pelitic compositions. Classically, granulites are defined by the mineral assemblage orthopyroxene–clinopyroxene–plagioclase–quartz ± hornblende ± garnet in basic rocks; co-existing pelites and felsic rocks are characterised by sillimanite + K-feldspar-bearing assemblages (Turner, Reference Turner1968). By contrast, high-pressure granulites are characterised by the key mineral associations of garnet–clinopyroxene–plagioclase–quartz in basic rocks and kyanite–K-feldspar in metapelites and felsic rocks, and are typically orthopyroxene-free (O'Brien and Rötzler, Reference O'Brien and Rötzler2003). However, given the uncertainty over the P–T conditions of the phase assemblage transitions in basic rocks (Pattison, Reference Pattison2003), Brown (Reference Brown2007) used the sillimanite-to-kyanite phase boundary as the upper pressure limit for G-UHT metamorphism, although this is somewhat arbitrary in the sense that it is not linked explicitly to tectonic setting. Returning to Fig. 3b, the contours are clearly related to the density of the data, but the figure nonetheless demonstrates the bimodal distribution of higher and lower thermobaric ratio types of metamorphism. This is further emphasised when the data are divided by age at 850 Ma (Figs 3c,d). Figure 3c demonstrates that the bimodality is essentially a feature of the modern plate tectonic regime (Brown, Reference Brown2006), and that the ‘normal’ geotherm is only useful as a reference and only in this regime—the ‘normal’ geotherm has no relevance for most of the Precambrian (Fig. 3d).
Secular change in temperature, pressure and thermobaric ratio of metamorphism are shown in Figs 4, 5 and 6, respectively, with the individual data in the upper panel and a contoured plot of these data in the lower panel in each case. For temperature, the data have a wide range at any age, but the contoured plot shows that temperatures of metamorphism were dominantly in the range 800–950°C until the mid-Neoproterozoic, when the widespread appearance of low T/P metamorphism drives temperatures to lower values and creates twice the range of values globally compared to the Archean and Paleoproterozoic (Fig. 4). For high and intermediate T/P metamorphism, a polynomial curve has been fit to the data showing that temperatures reached a peak in the Proterozoic.
Metamorphic temperature for 564 localities grouped by type and plotted against age. In the upper panel, the three types of metamorphism are high T/P in red, intermediate T/P in orange and low T/P in blue. In the lower panel, the data are contoured for density. The abbreviations in the top row are: C – Cenozoic; M – Mesozoic; P – Paleozoic; NP – Neoproterozoic; MP – Mesoproterozoic; PP – Paleoproterzoic; NA – Neoarchean; MA – Mesoarchean; PA – Paleoproterozoic; and EA – Eoarchean; and; the abbreviations in the second row are E – Ediacaran; C – Cryogenian; To – Tonian; Ste – Stenian; Ec – Ectasian; Ca – Calymmian; Sta – Statherian; Or – Orosirian; Rh – Rhyacian; and Si – Siderian.
Metamorphic pressure for 564 localities grouped by type plotted against age. In the upper panel, the three types of metamorphism are high T/P in red, intermediate T/P in orange and low T/P in blue. In the lower panel, the data are contoured for density. Abbreviations are defined in the caption to Fig. 4.
Metamorphic thermobaric ratios (T/P) for 564 localities grouped by type plotted against age. In the upper panel, the three types of metamorphism are high T/P in red, intermediate T/P in orange and low T/P in blue. In the lower panel, the data are contoured for density. Abbreviations are defined in the caption to Fig. 4.
For pressure, the range for high T/P metamorphism remains narrow through time with a mean value in each Era that is similar (Fig. 5). By contrast, for intermediate T/P metamorphism the polynomial fit to the data shows that mean pressure rises by ~0.25 GPa from the Neoarchean to a peak in the Neoproterozoic as the range of values increases (Fig. 5). The contoured plot emphasises the bimodality in pressure of metamorphism that characterises the modern plate tectonic regime (Fig. 5), reflecting subduction (higher P) and collision (lower P). The widespread appearance of low T/P metamorphism in the Cryogenian drives pressures to much higher values with decreasing age, in which the range of values globally is some three times that recorded in the Archean.
For thermobaric ratio (T/P), the values for intermediate T/P metamorphism decline slightly through time, as shown by the linear fit to the data (Fig. 6), whereas those for high T/P metamorphism rise to a peak in the Mesoproterozoic (Fig. 6). The thermobaric ratio for low T/P metamorphism does not change significantly.
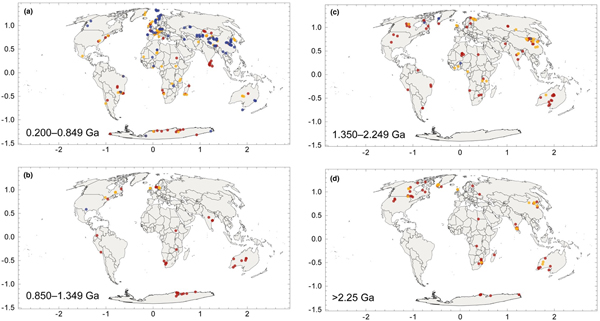
The distribution of ages of metamorphism is shown in Fig. 7. The pattern is similar to the distribution of ages of magmatic and detrital zircons from crustal rocks in general (Puetz et al., Reference Puetz, Ganade, Zimmermann and Borchardt2018). These distributions are commonly related to the supercontinent cycle. The modern plate tectonic era, based on the age of the oldest oceanic lithosphere on Earth, extends back to c. 0.2 Ga. Before this we have to rely on evidence of plate tectonic processes preserved in the continents. Although not completely representative, the geographical distribution of low, intermediate and high T/P metamorphic rocks older than 0.2 Ga is shown in Fig. 8. The interval 0.200–0.849 Ga highlights the widespread appearance and/or preservation of low T/P metamorphism dominantly in the Paleozoic orogenic belts of Europe and Central Asia, in stark contrast to the almost complete absence of low T/P metamorphism in the older intervals that preserve dominantly intermediate and high T/P metamorphism. A discussion of why blueschists in particular are largely absent from the rock record prior to the late Neoproterozoic is outside the scope of this article, which is focussed on granulites. The interested reader can find a detailed discussion of this topic in Brown and Johnson (2019). It is also notable that low T/P and high T/P metamorphism are mutually exclusive.
Histogram and probability density function (PDF) curve for the age of metamorphism for the 564 localities used in this study.
Maps to show the geographic distribution of low, intermediate and high T/P metamorphic rocks: (a) 0.200 to 0.849 Ga; (b) 0.850 to 1.349 Ga; (c) 1.350 to 2.249 Ga; and (d) >2.250 Ga.
Extreme metamorphism
By definition, ultrahigh temperature (UHT) metamorphism of crustal rocks occurs at peak temperatures that exceed 900°C (Harley, Reference Harley, Treloar and O'Brien1998), which is recognised either by robust thermobarometry or by the presence of a diagnostic mineral assemblage in an appropriate bulk composition and oxidation state, such as assemblages with orthopyroxene + sillimanite + quartz, sapphirine + quartz, spinel + quartz or osumilite (Kelsey and Hand, Reference Kelsey and Hand2015), generally at pressure conditions of sillimanite stability in metapelites (Brown, Reference Brown2007). An example of a migmatitic osumilite-bearing metapelite from the classic location at Vikesdal in Norway is shown in Fig. 9. By contrast, ultrahigh-pressure (UHP) metamorphism of crustal rocks occurs at pressures that exceed the stability field of quartz, recognised either by the presence of coesite or diamond, or by equivalent P–T conditions determined using robust thermobarometry (Chopin, Reference Chopin2003).
An example of a migmatitic osumilite-bearing metapelite from Vikesdal, Norway (photo credit: Chris Clark, Curtin University). Melanosomes are composed of orthopyroxene, osumilite (lilac colour), spinel, local interstitial quartz, sporadic garnet and intergrown cordierite and K-feldspar, whereas leucosomes are composed of quartz, perthitic alkali feldspar and rare plagioclase; ilmenite, magnetite and zircon are present in both melanosome and leucosome.
Notwithstanding the benefit to petrology of highlighting UHT and UHP metamorphism during the past 35 years, including the importance of producing orthopyroxene + sillimanite at the expense of biotite in metapelites (Harley, Reference Harley, Treloar and O'Brien1998) and the simplicity of a polymorphic phase transition (quartz to coesite) that makes the presence of one phase, whatever its grain size or abundance, an immediate indicator of the minimum pressure attained (Chopin, Reference Chopin2003), we may ask whether distinguishing these extreme types of metamorphism remains useful, by which we mean: do these two types of metamorphism record a significant geodynamic process? In the first case the range of T/P below or above 900°C is similar and in the second case the range of T/P below or above the quartz to coesite inversion is similar, which indicates no change in thermal regime in either case. Thus, whether the temperature of metamorphism was slightly lower than or higher than 900°C, and whether or not the pressure was just greater than the inversion of quartz to coesite, are not diagnostic of any change in geodynamics.
Therefore, we propose moving the emphasis away from chasing the extremes and concentrating our efforts on understanding the processes that led to such extreme metamorphic conditions, particularly with respect to UHT metamorphism (Harley Reference Harley2016; Kelsey and Hand, Reference Kelsey and Hand2015). Using T/P ends the arbitrary separation of UHT and UHP metamorphism from the rest of regional metamorphism and eliminates the chase for the highest P or T (“the principle of maximum astonishment” (R. Powell, personal communication)). For example, consider the Napier Complex, Antarctica, which records T max > 1100°C at P of ~1.1 GPa and a CW P–T path (e.g. Mitchell and Harley, Reference Mitchell and Harley2017). These data yield T/P of >1000°C/GPa. However, compare this with the Eastern Ghats Province, India, which records T max ≥ 1000°C at P of ~0.7 GPa and T ~900°C at P max of ~0.8 GPa, and a CCW P–T path. These data yield T/P of >1400 and 1125°C/GPa, respectively (e.g. Korhonen et al., Reference Korhonen, Clark, Brown and Taylor2014). Both areas record high dT/dP metamorphism. However, the important issue is not which is the more extreme—in different ways, each is extreme—but rather how they are different in terms of tectonic setting, the time each terrain spent above T 900 or T 800 (e.g. Harley, Reference Harley2016) and the questions each poses in relation to generating the heat required! Similarly, the difference in P max between 2.5 GPa (quartz stability at average temperatures for low dT/dP metamorphic rocks) and 2.8 GPa (coesite stability at average temperatures for low dT/dP metamorphic rocks) is insignificant in comparison with the widespread absence of these rocks prior to the Cryogenian.
The metamorphic record and time's arrow
In this section we address secular change in the metamorphic record—time's arrow. There are two dramatic changes recorded by the metamorphic record. First, at the beginning of the Neoarchean there is an appreciable increase in the number of localities that preserve high and intermediate T/P metamorphism (Figs 6, 8). This change has been interpreted to record the widespread emergence of dual thermal regimes and the development of paired metamorphic belts, which is the hallmark of subduction at convergent plate margins (Brown, Reference Brown2006). Second, during the Neoproterozoic, there is a sudden and striking drop in the thermobaric ratios with the widespread appearance of low T/P metamorphism in the rock record, mostly preserved in sutures associated with late Neoproterozoic and Phanerozoic collisional orogens (Figs 6, 8). This change has been interpreted to record an evolution to deeper slab breakoff since the Neoproterozoic and colder collisional orogenesis related to secular cooling of the mantle (van Hunen and Allen, Reference van Hunen and Allen2011; Sizova et al., Reference Sizova, Gerya and Brown2014; Chowdhury et al., Reference Chowdhury, Gerya and Chakraborty2017). Furthermore, we may expect that secular cooling of the mantle will affect the rates of tectonic processes through time and across time scales. It is therefore no surprise that the Neoproterozoic also represents a time when cooling rates of orogens appears to have increased and the size of high T/P metamorphic terrains appears to have decreased in area by an order of magnitude (Willigers et al., Reference Willigers, van Gool, Wijbrans, Krogstad and Mezger2002). With the enormous increase in geochronological and thermochronological data in addition to the more robust P–T data that are now available, rates of tectonic processes through time and across time scales is an important topic to revisit. This should be extended to rates of burial, as suggested by the recent study of Nicoli et al. (Reference Nicoli, Moyen and Stevens2016).
As Miyashiro (1961) described for Japan and other parts of the circum-Pacific region, “a metamorphic belt of the andalusite–sillimanite type and/or low-pressure intermediate group (corresponding to the high dT/dP type of this study) and another metamorphic belt of the jadeite–glaucophane type and/or high-pressure intermediate group (corresponding to the low dT/dP type of this study) run side by side, forming a pair. The latter belt is always on the Pacific Ocean side. They were probably formed in different phases of the same cycle of orogeny.” Missing from this statement is the kyanite–sillimanite type (corresponding to the intermediate T/P metamorphism of Brown and Johnson, Reference Brown and Johnson2018), which was something of an enigma to Miyashiro, who was limited by both the small number of studies of metamorphic belts and the lack of a paradigm such as plate tectonics at that time. Nonetheless, he fully appreciated secular change even if the timescale is now expanded by the much larger number of data. He wrote “we may conclude that regional metamorphism of the andalusite–sillimanite type and low-pressure intermediate group took place widely from Precambrian through Mesozoic time, whereas that of the kyanite–sillimanite type was common in Palaeozoic time, and that of the jadeite–glaucophane type became common in Mesozoic time.” Miyashiro was also aware that his kyanite–sillimanite type was commonly co-located with the andalusite–sillimanite type or low-pressure intermediate group.
Here we follow Brown (Reference Brown2006) and equate the occurrence of both intermediate and high T/P metamorphism since the Neoarchean with the onset of a distinct Proterozoic plate tectonic regime, which evolved during a Neoproterozoic transition to the modern plate tectonic regime, characterised by low T/P metamorphism recording the suture, intermediate T/P metamorphism in the orogen or collision zone and high T/P metamorphism in the orogenic hinterland. Shallower slab breakoff and a warmer style of collisional orogenesis prior to the Neoproterozoic has implications for the nature of paired metamorphism. Intermediate T/P metamorphism still records collisional orogenesis, but limited by slab breakoff, and high T/P metamorphism still occurs in the hinterland, where it records post-collision extension of the overriding plate (Sizova et al., Reference Sizova, Gerya and Brown2014; Chowdhury et al., Reference Chowdhury, Gerya and Chakraborty2017; Perchuk et al., Reference Perchuk, Safonov, Smit, van Reenen, Zakharov and Gerya2018), but low T/P metamorphism is mostly absent. Thus, paired metamorphic belts in the Proterozoic comprise the equivalent of Miyashiro's kyanite–sillimanite type with his andalusite–sillimanite type or low-pressure intermediate group.
In addition to two dramatic changes, there is also continuous secular change in pressure, temperature and thermobaric ratios of metamorphism. First, the pressure of intermediate T/P metamorphism has on average increased by ~0.25 GPa from the Archean to the Neoproterozoic (Fig. 5). As might be expected, this increase of pressure through time is consistent with the prediction by Rey and Coltice (Reference Rey and Coltice2008) that elevation of collisional orogens is expected to have increased through the Proterozoic. This occurs because the rheology of rocks is exponentially sensitive to temperature, so that the secular cooling of the Earth led to a rapid strengthening and emergence of the continental lithosphere in the Neoarchean.
Second, neither the temperature nor the thermobaric ratios recorded by high T/P metamorphism is significantly different in the Neoarchean and the Mesozoic (Figs 4, 6), in spite of the decrease in mantle potential temperature since the Neoarchean (Herzberg et al., Reference Herzberg, Condie and Korenaga2010; Korenaga, Reference Korenaga2013). The thermobaric ratios for high T/P metamorphism increase from ~1000°C/GPa at the beginning of the Neoarchean to ~1300°C/GPa in the Mesoproterozoic before declining to ~1000°C/GPa again by the beginning of the Mesozoic (Fig. 6). The Mesoproterozoic high in both T and T/P is discussed further under time's cycle. Contemporaneously, the thermobaric ratios for intermediate T/P metamorphism declined from ~700 to ~500°C/GPa from the Neoarchean Era to the Tonian Period (Fig. 6). These features are seen more clearly in Fig. 10, which shows the moving means of the thermobaric ratios (T/P) for the three types of metamorphism together with their one standard-deviation envelopes. The moving mean is a method to analyse data by creating a series of means of different subsets of the full data set. In this case the moving mean for the high and intermediate T/P metamorphism is calculated every 1 m.y. within a moving 300 m.y. window, whereas that for the low T/P metamorphism is calculated every 1 m.y. within a moving 100 m.y. window.
In the upper panel, moving means (with one sigma uncertainty) of the thermobaric ratios (T/P) for high and intermediate T/P metamorphism calculated every 1 m.y. within a moving 300 m.y. window, and for low T/P metamorphism calculated every 1 m.y. within a moving 100 m.y. window. In the lower panel, T/P data for localities older than 850 Ma are contoured for density to show the development of bimodality from the Archean through the Proterozoic. Abbreviations are defined in the caption to Fig. 4.
Noting that the concentrations of the heat-producing elements in fine-grained metasedimentary rocks have not decreased since the Paleoproterozoic (Taylor and McLennan, Reference Taylor and McLennan1985) and radiogenic heat production from granites has remained constant through time (Artemieva et al., Reference Artemieva, Thybo, Jakobsen, Sørensen and Nielsen2017), but mantle potential temperatures have decreased since the Neoarchean (Herzberg et al., Reference Herzberg, Condie and Korenaga2010), it might be expected that higher metamorphic temperatures would have been achieved in the Neoarchean compared with the Phanerozoic. However, maximum temperatures of crustal metamorphism are probably buffered by melting (Stüwe, Reference Stüwe1995; Schorn et al., Reference Schorn, Diener, Powell and Stüwe2018), consistent with the postulate by Jaupart and Mareschal (Reference Jaupart and Mareschal2015) and Jaupart et al. (Reference Jaupart, Mareschal and Iarotsky2016) that the post-orogenic thermal evolution and stabilisation of Archean cratons occurred by intracrustal differentiation driven by high radiogenic heat production that raised lower crustal temperatures to 800–900°C, but without significant crustal thickening. Also, if we accept that the increase in pressure of intermediate T/P metamorphism indicates a change in the style of collisional orogenesis with decreasing age, then the absence of significant secular variation in the mean temperature and thermobaric ratios of high T/P metamorphism requires explanation. Consistent with the secular decline in mantle T P, this observation may indicate a decrease in the proportion of mantle heat versus radiogenic heat in the generation of high T/P metamorphism as the lithosphere stiffened and orogens became thicker with decreasing age (Yakymchuk and Brown, Reference Yakymchuk and Brown2019).
Lastly, the T/P data for the period from 4.0 Ga to 0.85 Ga are contoured in Fig. 10. This figure emphasises the evolution of high and intermediate T/P metamorphism towards bimodality by the Paleoproterozoic, as shown by the separation into two clusters of data in the Orosirian in Fig. 10. Referring back to Fig. 1, the arithmetic mean of T/P for high T/P metamorphism (1106 ± 245 (1σ)) is consistent with constant surface heat flow since the Neoarchean, which indicates a plate tectonic regime was operating on Earth since that time, whether or not it was preceded by a stagnant lid regime. However, at the present day there is a range of mantle T P of ~120°C (Herzberg et al., Reference Herzberg, Asimow, Arndt, Niu, Lesher, Fitton, Cheadle and Saunders2007). Assuming a similar range in the past, as suggested by the data shown in Fig. 1, then different styles of Proterozoic metamorphic belt might be anticipated according to the variation in mantle T P.
This prediction has been investigated by Sizova et al. (2014; see also Chowdhury et al., Reference Chowdhury, Gerya and Chakraborty2017; Perchuk et al., 2018) in a series of experiments run using a 2-D petrological–thermomechanical numerical model in which the collision of spontaneously moving continental plates was simulated using increasingly higher values of ambient upper-mantle temperature and radiogenic heat production than those typical at the present day. Conditions appropriate for high T/P metamorphism are predicted in experiments with elevated crustal heat production, ambient upper mantle temperatures >80°C warmer than the present day, thicker lithosphere and a greater density contrast between mantle lithosphere and asthenospheric mantle. These experiments may resolve the long-standing debate over the tectonic settings in which high T/P metamorphism might be generated, a topic that was recently reviewed in detail by Kelsey and Hand (Reference Kelsey and Hand2015).
In experiments with a warmer mantle that lead to a truncated hot collision, the continental crust is not subducted to mantle depths and low T/P metamorphism does not develop due to shallow slab breakoff. Under these conditions, after collision the continental plates diverge from each other, leading to decompression melting in the underlying mantle. Syn-extensional volcanism leads to infilling of a developing extensional basin and high-temperature conditions in the crust beneath are maintained by magma underplating. This type of deep hot crustal environment is typical for some long-lived Precambrian plutono-metamorphic orogens, and may be appropriate for example in the case of the Neoarchaean Minto block in the northern Superior province of Canada (e.g. Bedard, Reference Bedard2003). It may also be an appropriate model for the evolution of the late Mesoproterozoic Musgrave province in central Australia, but the location of the Province at the nexus of three cratons also permits an intracontinental delamination model (e.g. Smithies et al., Reference Smithies, Howard, Evins, Kirkland, Kelsey, Hand, Wingate, Collins and Belousova2011; Walsh et al., Reference Walsh, Kelsey, Kirkland, Hand, Smithies, Clark and Howard2014; Gorczyk et al., Reference Gorczyk, Smithies, Korhonen, Howard and Gromard2015).
Some Proterozoic orogens record post-extension thickening to generate CCW metamorphic P–T paths followed by slow close-to-isobaric retrograde cooling, such as occurred in the Paleoproterozoic Khondalite belt in the North China craton (e.g. Santosh et al., Reference Santosh, Liu, Tsunogae and Li2012) and the late Mesoproterozoic–early Neoproterozoic Eastern Ghats Province–Rayner Province of India and East Antarctica (e.g. Korhonen et al., Reference Korhonen, Brown, Clark and Bhattacharya2013, Reference Korhonen, Clark, Brown and Taylor2014; see also Mitchell et al., Reference Mitchell, Johnson, Clark, Gupta, Brown, Harley and Taylor2018), while other Proterozoic orogens record more complex metamorphic P–T paths, such as recorded in the Central Indian Tectonic Zone (Bhowmik and Chakraborty, Reference Bhowmik and Chakraborty2017). These orogens might form by renewed convergence and thickening of the extensional basin formed by truncated hot collision (Sizova et al., Reference Sizova, Gerya and Brown2014). The extensional basins in the experiments of Sizova et al. (Reference Sizova, Gerya and Brown2014) are 150–400 km wide prior to renewed convergence, which supports the postulate that wide orogenic plateaux, albeit with subdued or negative topography, may be required to facilitate long-lived high T/P metamorphism (Chardon et al., Reference Chardon, Gapais and Cagnard2009; Clark et al., Reference Clark, Fitzsimons, Healy and Harley2011; Kelsey and Hand, Reference Kelsey and Hand2015). However, given an expectation of shallow slab breakoff from the Neoarchean to the Neoproterozoic (van Hunen and Allen, Reference van Hunen and Allen2011; Sizova et al., Reference Sizova, Gerya and Brown2014), ridge subduction as a primary driver of high T/P metamorphism seems unlikely.
Other Proterozoic orogens are characterised by high T/P metamorphism with CW looping P–T–t paths and extensive granite magmatism sourced from supracrustal and plutonic rocks (syn-orogenic) and the sub-continental lithospheric mantle (post-orogenic). These orogens are similar to two-sided hot collision in the numerical experiments of Sizova et al. (Reference Sizova, Gerya and Brown2014). Examples include the Paleoproterozoic orogen of the southwestern United States, comprising the Mojave, Yavapai and Mazatzal provinces (e.g. Karlstrom and Williams, Reference Karlstrom, Williams, Brown and Rushmer2006; Dumond et al., Reference Dumond, Mahan, Williams and Karlstrom2007), the Paleoproterozoic Svecofennides of southern Finland (e.g. Korja et al., Reference Korja, Lahtinen, Nironen, Gee and Stephenson2006; Cagnard et al., Reference Cagnard, Gapais and Barbey2007; Kukkonen and Lauri, Reference Kukkonen and Lauri2009) and the late Mesoproterozoic Namaqua orogen in Namibia (Robb et al., Reference Robb, Armstrong and Waters1999; Dewey et al., Reference Dewey, Robb and Van Schalkwyk2006; Diener et al., Reference Diener, White, Link, Dreyer and Moodley2013; Diener, Reference Diener2014).
There are also Proterozoic orogens where the collision style was similar to large Phanerozoic orogens, but without the generation of extreme pressures at low T/P conditions, perhaps identifying locations where ambient mantle temperature was lower, such as the Paleoproterozoic Trans–Hudson (St-Onge et al., Reference St-Onge, Searle and Wodicka2006) and Mesoproterozoic Grenville (Rivers, Reference Rivers2015; Rivers et al., Reference Rivers, Culshaw, Hynes, Indares, Jamieson, Martignole, Percival, Cook and Clowes2012) orogens of North America. For example, consider the Trans–Hudson orogen where recently Weller and St-Onge (Reference Weller and St-Onge2017) have used phase equilibria modelling and in situ U–Pb monazite dating to show that the P–T conditions and thermobaric ratios of metamorphism, and the relative timing of low T/P metamorphism are comparable in both orogens. From this comparison these authors infer that modern-day plate tectonic processes featuring deep continental subduction occurred in the Paleoproterozoic (e.g. Fig. 6).
The metamorphic record and time's cycle
Using temporal variations in the P of intermediate T/P metamorphic rocks, the T and T/P of high T/P metamorphic rocks, and the clustering of ages of metamorphism, we identify multiple geodynamic cycles since c. 3.0 Ga superimposed on secular cooling on the mantle (Fig. 11). Cyclicity in the metamorphic rock record begins in the Neoarchean, as shown by the distribution of ages of metamorphism (Fig. 7), which is similar to the distribution of ages of magmatic and detrital zircons (Puetz et al., Reference Puetz, Ganade, Zimmermann and Borchardt2018). The age distribution of pre-Neoarchean tonalite–trondhjemite–granodiorite suites (Johnson et al., Reference Johnson, Kirkland, Gardiner, Brown, Smithies and Santosh2019) and scarce pre-Neoarchean metamorphic rocks is similar, suggesting similar survival rates of both prior to the dramatic increase in preservation in the Neoarchean (Hawkesworth et al., Reference Hawkesworth, Cawood, Kemp, Storey and Dhuime2009). However, the limited occurrence of high T/P metamorphism and absence of eclogite before the late Mesoarchean suggest that suitable tectonic environments to generate and/or preserve these types of metamorphism may not have been widely available before then. Whether this limited record of metamorphism reflects transient subduction (Sizova et al., Reference Sizova, Gerya, Stüwe and Brown2015) and an early style of intermittent plate tectonics (van Hunen and Moyen, Reference van Hunen and Moyen2012) or was produced in a stagnant lid tectono-magmatic regime (Sizova et al., 2015) is unclear since the P–T data do not discriminate these alternatives (Sizova et al., Reference Sizova, Gerya, Brown and Stüwe2018).
(a) Best fit line and moving mean (calculated every 1 m.y. within a moving 300 m.y. window) of pressure against age for high and intermediate T/P metamorphism (note that the troughs in the moving mean reflect the absence of intermediate T/P metamorphic data and the limited number of high T/P metamorphic data in the late Tonian, Ectasian–Calymmian and Rhyacian–Siderian); Arithmetic and moving means (calculated every 1 m.y. within a moving 300 m.y. window) of temperature (b) and thermobaric ratios (c) against age for high T/P metamorphism (note that the troughs in the moving mean of T reflect the limited number of high T/P metamorphic data in the late Tonian, Ectasian–Calymmian and Rhyacian–Siderian); and (d) PDF for the age distribution of metamorphism for all 564 data (from Fig. 6). Three geodynamic cycles are separated by the two vertical grey bands, as discussed in the text. Abbreviations are defined in the caption to Fig. 4.
The transition to a first cycle was marked by: (1) the synchronous widespread appearance and/or survival of intermediate T/P and high T/P metamorphism in the Neoarchean; (2) the widespread appearance and/or survival of voluminous zircon-bearing magmatic rocks; and, (3) the beginning of cyclicity in both the metamorphic and magmatic age records. During the Phanerozoic, paired metamorphic belts with different thermobaric ratios and voluminous zircon-bearing magmatic rocks are thought to be characteristic of convergent plate margins and subduction of ocean lithosphere (Brown, Reference Brown2006; Brown and Johnson, Reference Brown and Johnson2018). Plausibly, these observations may indicate the emergence of globally continuous subduction, associated with lateral plate motions, the development of ‘continental margin’ arcs and the formation of ‘paired’ metamorphic belts, and the preservation of these convergent margin rocks in collisional sutures associated with the formation of protocontinents—the supercratons of Bleeker (Reference Bleeker2003). It appears that stable rather than transient or intermittent subduction and the emergence of a sustainable network of plate boundaries may have become possible only after the balance between heat production and heat loss changed in favour of secular cooling. Whether subduction was reduced during the Proterozoic is uncertain, but this has been postulated for the interval 2.3–2.2 Ga (Spencer et al., Reference Spencer, Murphy, Kirkland, Liu and Mitchell2018). Indeed, these authors further posit that this Palaeoproterozoic tectono-magmatic lull marked the transition to modern plate tectonics and the supercontinent cycle. Certainly, the data shown in Fig. 10 demonstrate that the bimodality in metamorphic thermal regimes considered characteristic of plate tectonics (Brown, Reference Brown2006) has been registered in the metamorphic rock record since the Paleoproterozoic.
The transition to a second cycle is marked by the fragmentation of the protocontinents into cratons and their subsequent accretion into the supercontinent Columbia during the Paleoproterozoic. The Proterozoic tectonic regime was characterised by stability from the formation of Columbia to the breakup of Rodinia, and collision was generally warm rather than cold due to shallow slab breakoff (van Hunen and Allen, Reference van Hunen and Allen2011; Sizova et al., Reference Sizova, Gerya and Brown2014). This cycle represented a period of relative tectonic and environmental stability (the “boring billion” (Holland, Reference Holland2006) or “Earth's middle age” (Cawood and Hawkesworth, Reference Cawood and Hawkesworth2014)) and perhaps, at least for part of the cycle, reduced subduction. Reduced subduction is suggested by the lower volume of preserved continental crust per unit time in the Mesoproterozoic Era compared with older and younger eras (Brown and Johnson, Reference Brown and Johnson2018). During this cycle, there is a paucity of passive margins (Bradley, Reference Bradley2008). When plotted against the age of initiation, the longevity of ancient passive margins shows two cycles of declining lifespan (Bradley, Reference Bradley2008), with a break during much of the boring billion consistent with tectonic stability.
The moving means of both T and T/P of high T/P metamorphism exceed the arithmetic means of T and T/P during most of the Proterozoic (Fig. 11b, c), reflecting insulation of the mantle beneath the quasi-integrated lithosphere of Columbia (Pisarevsky et al., Reference Pisarevsky, Elming, Pesonen and Li2014), although the amalgamation of Columbia was a protracted event that occurred over a period of some 600 Ma. Supercontinents are intrinsically unstable due to the insulating effect on the underlying ambient mantle (Lenardic, Reference Lenardic2017). In the case of Columbia, the East Gondwana cratons split away and returned during the late Mesoproterozoic during a limited geographical reorganisation to form Rodinia (Pisarevsky et al., Reference Pisarevsky, Elming, Pesonen and Li2014; Wen et al., Reference Wen, Evans, Wang, Li and Jing2018; Mulder et al., Reference Mulder, Karlstrom, Halpin, Merdith, Spencer, Berry and McDonald2018).
Hotter mantle during the Proterozoic is supported by the temporality of massif-type anorthosites, which are the most volumetrically abundant of terrestrial varieties (Ashwal, Reference Ashwal2010). Massif-type anorthosites are almost entirely restricted in age to the Proterozoic Eon, although most of the volume (taking area as a proxy for volume) was emplaced during the Mesoproterozoic (Ashwal, Reference Ashwal2010; Ashwal and Bybee, Reference Ashwal and Bybee2017, fig. 12). Anorthosite petrogenesis is most readily explained in a convergent plate setting (Ashwal and Bybee, Reference Ashwal and Bybee2017). The appearance of massif-type anorthosites in the Paleoproterozoic may reflect increased lithosphere strength and crustal thickness (Rey and Coltice, Reference Rey and Coltice2008). This allowed ponding and slow crystallisation of basaltic magma at the Moho, as required for the accumulation of buoyant plagioclase at the top of deep-seated magma chambers, and as suggested by the ages of comagmatic, cumulate high-Al Opx megacrysts (Bybee et al., Reference Bybee, Ashwal, Shirey and Horan2014a,Reference Bybee, Ashwal, Shirey, Horan, Mock and Andersenb). This stage was followed by an extended period of emplacement, whereby magmatism in individual massifs commonly lasted up to 100 m.y. (Charlier et al., Reference Charlier, Duchesne, Vander Auwera, Storme, Maquil and Longhi2010; Ashwal and Bybee, Reference Ashwal and Bybee2017). Many anorthosites are spatially and temporally related to the convergent margin along the Laurentia–Baltica side of the Columbia–Rodinia supercontinent—an example of a ‘Goldilocks period’ in the Earth history when the combination of amalgamated continental lithosphere, high ambient mantle temperature and location of the active margin produced conditions that were ‘just right’. The disappearance of anorthosite massifs in the Neoproterozoic probably relates to the breakup of Rodinia.
(a) Histogram and probability curve for the age of massif type anorthosites. (b) Area versus age for massif type anorthosites. Data are from Ashwal and Bybee (Reference Ashwal and Bybee2017). Abbreviations are defined in the caption to Fig. 4.
The start of the third cycle was synchronous with the transition from Rodinia to Pannotia (Nance and Murphy, Reference Nance and Murphy2019). It is marked by a steep decline in the thermobaric ratios of high T/P metamorphism to their lowest value, although temperature remains relatively high, and the appearance of low T/P metamorphism in the rock record at the end of the Tonian, registering a change to deeper slab breakoff and cold collision. The generation, preservation and exhumation of widespread low T/P metamorphic rocks is a characteristic of orogenesis in the modern tectonic regime, but this only became possible once the temperature of ambient mantle had decreased to <100°C warmer than the present day average mantle T P, generally after c. 1.0 Ga (Sizova et al., Reference Sizova, Gerya and Brown2014). Both T and T/P of high T/P metamorphism were relatively high from the Cryogenian to the Silurian, reflecting insulation of the mantle beneath Gondwana during the Pan-African thermal event before Gondwana sutured with Laurussia to form the short-lived Pangea. The decline in T and T/P of high T/P metamorphism from the Devonian to the Jurassic and the breakup of Pangea may indicate a transition to a fourth cycle.
Conclusions and implications
(1) The limited occurrence of high and intermediate T/P metamorphism before the late Mesoarchean suggests that suitable tectonic environments to generate and/or preserve these types of metamorphism were not widely available before that time. Whether this limited record of metamorphism reflects transient subduction and an early style of intermittent plate tectonics or was produced in a stagnant lid tectono-magmatic regime is ambiguous.
(2) The widespread appearance/preservation of high T/P metamorphism in the Neoarchean, and low T/P metamorphism in the late Neoproterozoic identify significant changes in the global geodynamic regime.
(3) It is likely that widespread subduction and the generation of a network of plate boundaries in a mobile-lid tectonic regime emerged on Earth during the late Mesoarchean as the balance between heat production and heat loss changed in favour of secular cooling—this is time's arrow (Gould, Reference Gould1987). This is inferred to have been a globally linked system by the early Paleoproterozoic, but whether it remained continuous to the present day is an unanswered question.
(4) During the Neoarchean and Proterozoic, intermediate and high T/P metamorphism, characterised by HP granulites and MT/HT eclogites, and common and UHT granulites, respectively, identify belts of plate convergence where collisional orogenesis and overriding plate extension generated these contrasting thermal environments in a Proterozoic plate tectonic regime.
(5) A clear duality of metamorphic thermal regimes, which is considered characteristic of plate tectonics, has been registered in the metamorphic rock record since the Paleoproterozoic.
(6) The pressure of intermediate T/P metamorphism has on average increased by ~0.25 GPa from the Archean to the Neoproterozoic, consistent with the predicted increase in elevation of collisional orogens.
(7) Much of the Proterozoic is characterised by relative geodynamic and environmental stability, and higher than average thermobaric ratios for high T/P metamorphism, from the start of the formation of Columbia to the end of the breakup of Rodinia. This period is the second of three geodynamic cycles—pre-Columbia, the boring billion and post-Rodinia—that make up time's cycle (Gould, Reference Gould1987).
(8) As secular cooling led to ambient mantle temperature dropping below 100°C warmer than the average mantle T P at the present day, slab breakoff occurred at greater depth enabling subduction of continental lithosphere and the generation, preservation and exhumation of low T/P metamorphic rocks.
Author ORCIDs
Michael Brown, 0000-0003-2187-616X; Tim Johnson, 0000-0001-8704-4396
Acknowledgements
Michael Brown thanks the Mineralogical Society of Great Britain and Ireland for both the invitation and support for travel to present the 51st Hallimond Lecture at the 5th Granulites and Granulites Conference in Ullapool, Scotland. Tim Johnson thanks K. Murphy and R. Rajendra for their help in organising that conference. Both authors thank Robert Holder and Daniel Viete for ongoing discussion, and Sumit Chakraborty and Peter Treloar for helpful reviews; we also thank Sumit for his discussion of apparent thermal gradients versus thermobaric ratios.