Overweight and obesity are associated with increased risks of morbidity and mortality related to CVD, diabetes, kidney diseases and certain cancers( Reference Flegal, Graubard and Williamson 1 ). In recent decades, the prevalence of both overweight and obesity has been increasing steadily in all age groups worldwide( Reference Zhang, Huang and Yu 2 ). One of the natural and biological causes of weight recycling in women is pregnancy. Pregnancy is a period in most women’s lives when substantial weight is gained, considerably altering their future weight-gain trajectory( Reference Harris and Ellison 3 ). The obesity epidemic has demonstrated that weight gain from pregnancy may lead to obesity development( Reference Williamson, Madans and Pamuk 4 ). Approximately 10 % to 15 % of women retain the weight they gain during pregnancy on a long-term basis and a number of these ultimately become obese( Reference Williamson, Madans and Pamuk 4 ). Thus, the pregnancy–postpartum period is critical because it can significantly affect long-term weight management and predispose women to chronic diseases later in life.
Pre-pregnancy BMI, gestational weight gain (GWG) and postpartum weight retention (PPWR) are not only nutritional problems but may also be related to activity, genetic and psychological factors faced by women of childbearing age. According to a review by Gunderson and Abrams, PPWR is presumably due to a combination of several factors, such as dietary intake, lack of physical activity, lactation, smoking status, pre-pregnancy BMI, GWG and parity, and is associated with increased risks of long-term obesity for women( Reference Gunderson and Abrams 5 ). Among these factors, pre-pregnancy BMI and GWG are the major ones( Reference Lederman, Alfasi and Deckelbaum 6 ). Since the US Institute of Medicine (IOM) published its guidelines for a healthy GWG in 1990, which were updated in 2009, GWG categorization into ‘inadequate’, ‘adequate’ and ‘excess’ has been a commonly used method for predicting PPWR and obesity over short and long terms( Reference Lowell and Miller 7 – Reference Maddah and Nikooyeh 15 ). Numerous studies have supported the suitability of GWG guidelines for positive pregnancy outcomes( Reference Lowell and Miller 7 – Reference Maddah and Nikooyeh 15 ). However, the postpartum duration in these studies ranged from 0·5 month to 21 years, and the associations between GWG categories and PPWR were found to vary significantly( Reference Lowell and Miller 7 – Reference Maddah and Nikooyeh 15 ). Therefore, it is necessary to clarify whether the extent of the association between GWG categories and PPWR is different over the longer term compared with shorter periods of time. In addition, a number of studies have reported a direct association between pre-pregnancy BMI and PPWR, whereas others studies have found no such association( Reference Gould Rothberg, Magriples and Kershaw 16 – Reference Begum, Colman and McCargar 19 ).
The associations among pre-pregnancy BMI, GWG and PPWR should be determined because the validation of such associations can potentially guide targeted intervention efforts for preventing obesity in women. In the present study, we performed a systematic literature research and meta-analysis to determine the effects of GWG in accordance with the IOM guidelines and of pre-pregnancy BMI in accordance with the WHO classification on PPWR. Moreover, we examined whether weight increase during pregnancy, rather than the pre-pregnancy BMI, determines the shorter- or longer-term PPWR.
Experimental methods
Literature search
We followed the Meta-analysis of Observational Studies in Epidemiology (MOOSE) guidelines for the conduct of systematic reviews and meta-analyses of observational studies( Reference Stroup, Berlin and Morton 20 ). Various databases, namely PubMed (updated up to September 2013), Cochrane Controlled Trials Register, EMBASE (1985 to September 2013), Science Citation Index Expanded, Current Contents Connects (1998 to 2013) and Biosis Previews (1926 to 2013), were used to search articles (in English) that described observational studies of the influence of pre-pregnancy BMI or GWG on PPWR. Titles, abstracts and subject headings in the databases were searched using the following Boolean phrases: (‘Pregnant’ OR ‘Pregnancy’ OR ‘Prenatal’ OR ‘Gestation’ OR ‘Gravidity’) AND (‘Postpartum’ OR ‘Post-partum’ OR ‘Post partum’ OR ‘Post pregnancy’ OR ‘Post-natal’ OR ‘After delivery’ OR ‘After birth’ OR ‘After childbirth’) AND (‘Weight gain’ OR ‘Weight increase’ OR ‘Weight gains’ OR ‘Weight gained’ OR ‘Gained weight’ OR ‘Weight growth’ OR ‘GWG’ OR ‘BMI’) AND (‘Retention’ OR ‘Retain weight’ OR ‘Maintain weight’ OR ‘Keep weight’ OR ‘Stabilization’ OR ‘Sustain weight’ OR ‘Upload weight’ OR ‘PPWR’). In addition, a manual search of reference lists of relevant and related articles was conducted to ensure a complete collection. Moreover, authors of articles were contacted via email when the required data were only partially reported in the published articles to ensure that all necessary data were included.
Study selection
Studies were selected for analysis if they met all of the following a priori defined inclusion criteria: (i) published in English; (ii) focused on healthy women; (iii) singleton pregnancies; (iv) delivery at term is reported; (v) GWG is classified as above, within or below the IOM recommendation or with very similar cut-off values, and pre-pregnancy BMI is classified as underweight (<18·5 kg/m2), normal weight (18·5–24·9 kg/m2), overweight (25·0–29·9 kg/m2) or obese (≥30·0 kg/m2), in accordance with WHO classifications; (vi) PPWR is documented as a continuous variable or an odds ratio between GWG above and within the recommendations; and (vii) PPWR is documented at 4 weeks postpartum and/or later. If the study sample overlapped with that in another article, or if two articles described aspects of the same study, only the publication with the largest sample was used. If a study reported different postpartum time points, these were all included in the meta-analysis.
Data extraction and quality assessment
The data from original articles were independently abstracted by two reviewers who used a standardized data collection form. Any disagreement between the two reviewers was resolved through discussion with the third reviewer. The following data were collected: (i) first author and publication year; (ii) population information, including country, sample size, gestational age, healthy status and pre-pregnancy BMI; (iii) study characteristics, including study design, definition of GWG and PPWR, and postpartum time; and (iv) information about the outcome, such as PPWR or odds ratio.
Methodological quality of studies was evaluated using the Newcastle–Ottawa Scale for assessing cohort studies used in meta-analyses( Reference Wells, Shea and O’Connell 21 ). A star was assigned where follow-up was a minimum of 1 year and where the loss to follow-up had been estimated for the study and reported in the article and where loss was less than 25 %. In addition, we conducted meta-regression analyses to assess specific aspects of quality such as time postpartum.
Statistical analysis
The differences in the mean PPWR of women whose GWG was below or above the recommended values minus the mean PPWR of women who gained weight within the recommended values were used to calculate the mean net change for each subgroup. Each study was weighted by its inverse variance. Weighted mean differences and the corresponding 95 % confidence intervals were calculated using a random-effects model for all cases. The heterogeneity of different sizes across trials was tested by means of Q statistics, in which statistical significance was established at P<0·10. We also calculated the I 2 statistic, which described the proportion of the total variation that is caused by heterogeneity. Sensitivity analysis was conducted to investigate the influence of a single trial on the overall effect; this effect was estimated by omitting one study in each turn. Moreover, we performed sensitivity analyses excluding studies with self-reported GWG/PPWR or without clear definitions of GWG and PPWR or using the 1990 IOM guidelines. In addition, studies were stratified into five different categories according to the time postpartum (1–3 months, 3–6 months, 6–12 months, 12–36 months and ≥15 years) or into two different categories according to the different IOM recommendations (IOM 1990 criteria and IOM 2009 criteria) to perform subgroup analysis. Furthermore, we conducted meta-regression analyses to assess whether PPWR differences were related to the time postpartum. Publication bias was assessed with funnel plots, which plotted the standard error of the studies against their corresponding size differences. In addition, Egger’s linear regression test and Begg’s rank correlation test were conducted to detect publication bias. All the analyses were conducted in the statistical software package STATA version 9·2. P<0·05 was considered statistically significant, unless otherwise specified.
Results
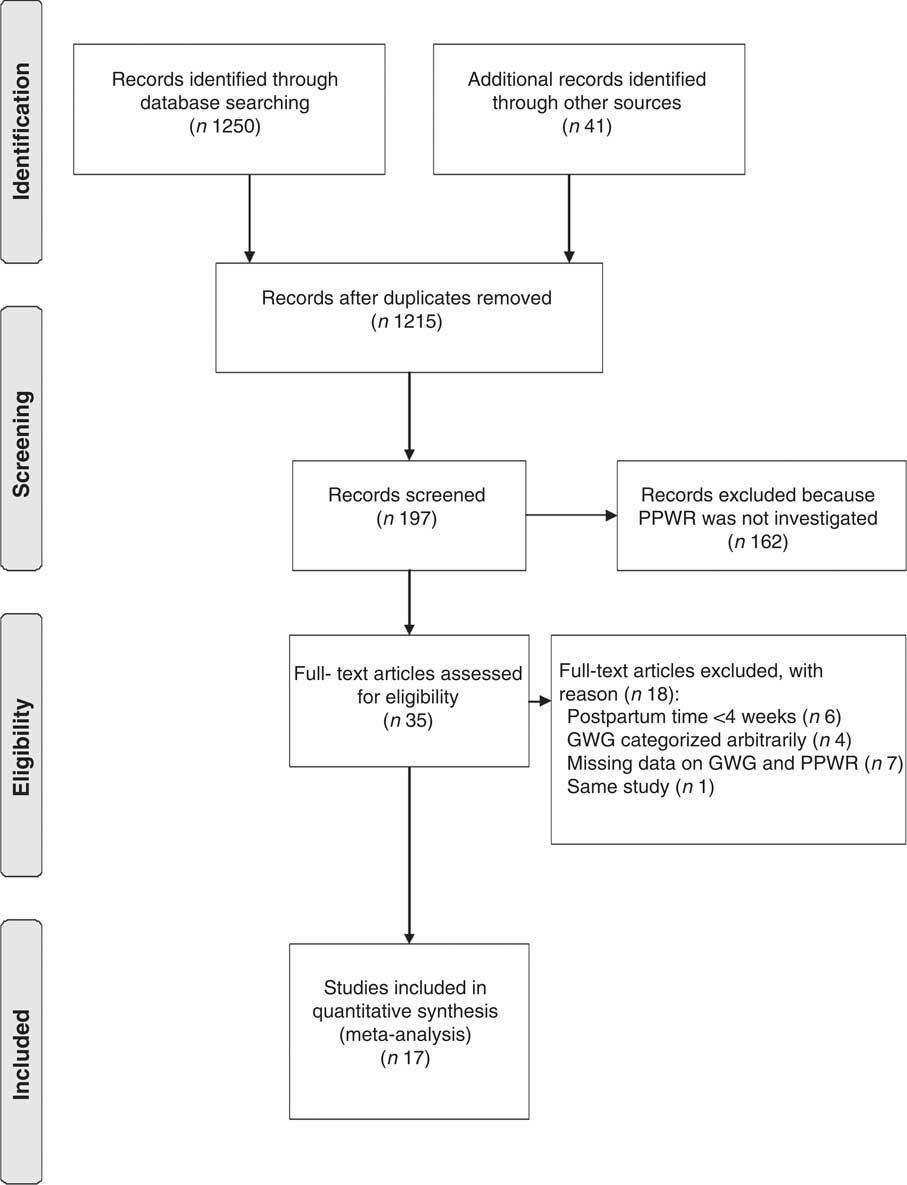
The trial flowchart is illustrated in Fig. 1. Electronic and manual literature searches yielded 1291 results, of which seventy-six articles were excluded because of duplication. A total of 1018 articles were excluded after the preliminary screening performed by going through the titles and abstracts. A total of 162 articles were further excluded on the basis of the inclusion criteria. Thus, thirty-five full-text articles were screened for detailed evaluation, among which seventeen studies were excluded because of having too short a follow-up time (<4 weeks; six studies), the arbitrary categorization of GWG (four studies) and missing data on GWG and PPWR (seven studies). Two studies described the aspects of the same study, but only the study reporting the PPWR was used( Reference Kac, Benicio and Velasquez-Melendez 14 , Reference Kac, Benicio and Velasquez-Melendez 22 ). Thus, seventeen studies, two of which were obtained from reference lists, were included in the present meta-analysis( Reference Lowell and Miller 7 – Reference Begum, Colman and McCargar 19 , Reference Scholl, Hediger and Schall 23 – Reference Oken, Kleinman and Belfort 26 ).
Flowchart illustrating the selection process for articles included in the present meta-analysis (PPWR, postpartum weight retention; GWG, gestational weight gain)
The characteristics of the included trials are shown in Table 1. Four studies were conducted in Europe, eight studies were conducted in North America, three studies were conducted in Asia, one study was conducted in Brazil and one study was conducted in Australia. Socio-economic status among the studies was considered homogeneous, except for one study that explicitly included low-income women. None of these studies was confined to either under- or overweight women. Women had to be older than 18 years in all except four studies. Two studies reported parity ≥1 as an inclusion criterion. Mean pre-pregnancy BMI was in the range of 21·7 to 26·4 kg/m2. An explicit definition for both GWG and PPWR was reported by eleven authors. Maternal pre-pregnancy weight was measured only in one study, whereas the other studies used self-reported pre-pregnancy weight and/or GWG, which may be a source of information bias. Postpartum body weight was measured by the study team in most, but not all, of the studies.
Main characteristics of the studies included in the present meta-analysis
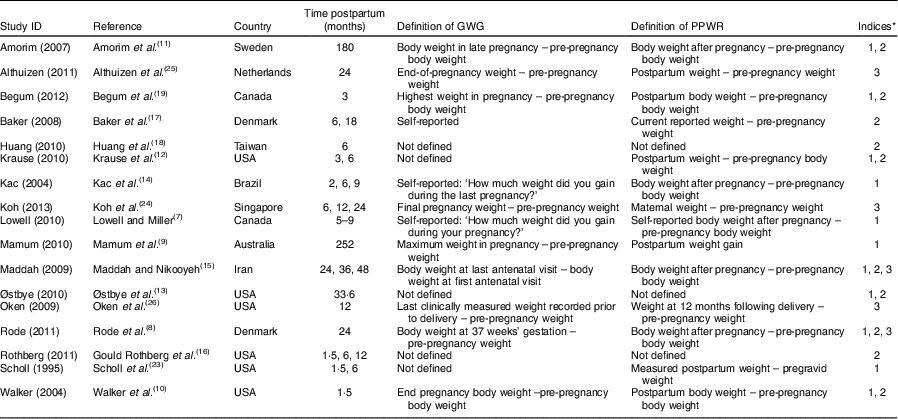
GWG, gestational weight gain; PPWR, postpartum weight retention.
* 1, PPWR of different GWG categories; 2, PPWR of different pre-pregnancy BMI groups; 3, OR of PPWR ≥5 kg between GWG above recommendation and GWG within recommendation.
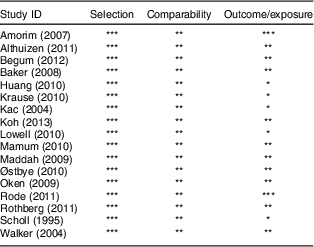
The quality of studies included in meta-analyses was assessed by applying the Newcastle–Ottawa scale for cohort studies. Table 2 presents the scores assigned to each included study. All of the studies had a score of 6 or more (stars) and were higher-scoring studies. The mean score was about 7. Because PPWR as outcome of interest was present at the start of all of the included studies, all of the included studies were not assigned a score for outcome. In addition, studies that had inadequate follow-up time and either did not report losses to follow-up or loss was more than 25 % were also not assigned a score.
Quality assessment of studies included in the present meta-analysis using the Newcastle–Ottawa Scale
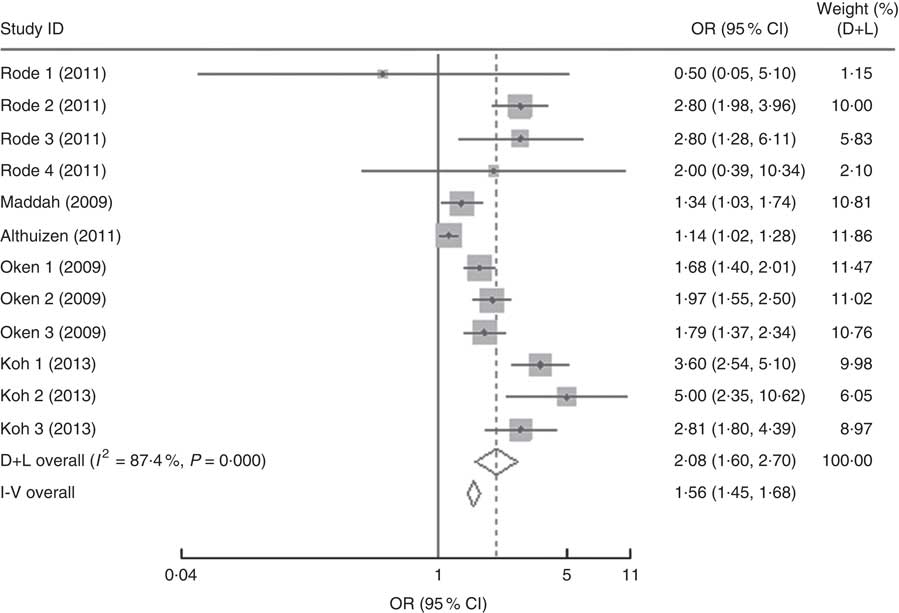
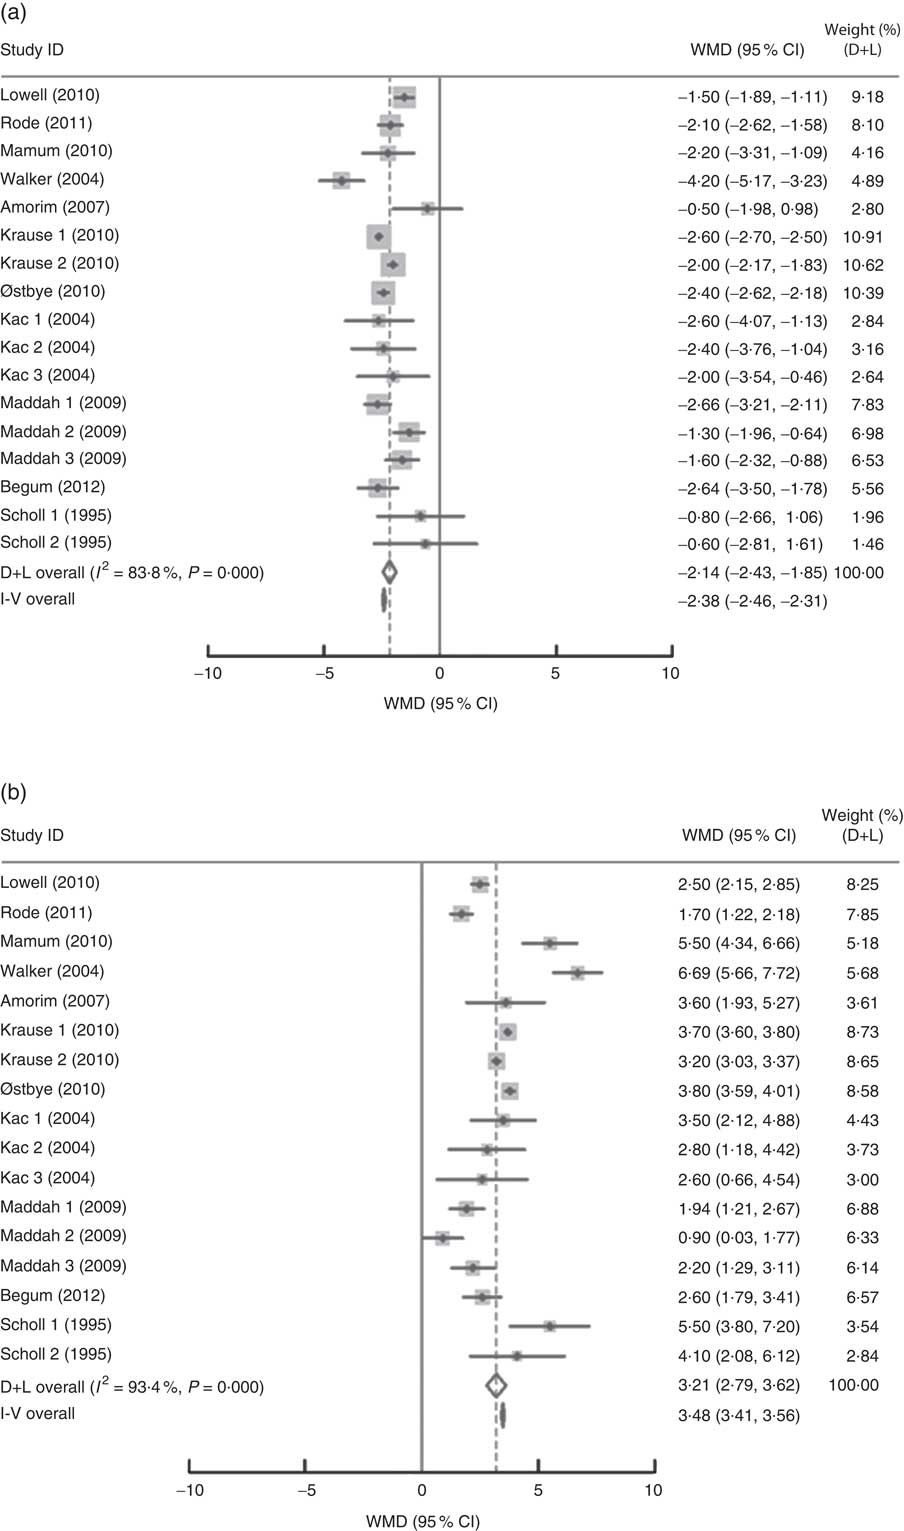
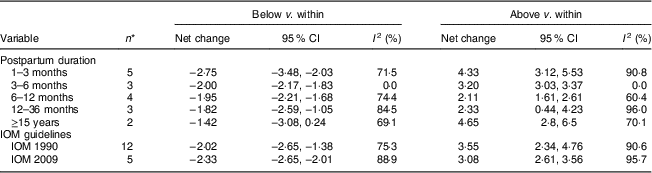
In the present research, eleven studies, which involved 67 853 women, analysed PPWR at different time points from 1 month to 21 years. Six of the studies reported GWG as recommended by the IOM in 1990, whereas four studies used the updated recommendations from 2009. One study applied the Canadian GWG recommendations of 1999, which are similar to the 1990 IOM guidelines. Compared with women who gained weight within the recommended values, those with GWG below the IOM criteria retained approximately 2 kg less (−2·14 kg; 95 % CI −2·43, −1·85 kg) weight (Fig. 2). When postpartum time spans were stratified into 1–3 months, 3–6 months, 6–12 months, 12–36 months and ≥15 years, the association faded over time and became insignificant (−1·42 kg; 95 % CI −3·08, 0·24 kg) after ≥15 years (Table 3). We next performed meta-regression analysis to assess whether PPWR differences were related to the time postpartum. Although there was no significant impact, there was a trend towards gradual reduction in PPWR differences with the extension of time (P=0·08). Compared with women who had adequate GWG, those with excess GWG retained an additional 3·21 kg (95 % CI 2·79, 3·62 kg) weight (Fig. 2). Subgroup analysis with respect to postpartum time spans revealed that, in contrast to PPWR in women with adequate GWG, PPWR in women with excess GWG showed a U-shaped trend; that is, a decline during the early postpartum period (year 1; from 4·33 kg at 3 months to 2·11 kg at 1 year) and then an increase in the follow-up period (from 2·11 kg at 1 year to 4·65 kg at ≥15 years). Sensitivity analyses excluding studies with self-reported GWG/PPWR or without clear definitions of GWG and PPWR did not find any significant differences (data not shown). The exclusion of studies that used the 1990 IOM guidelines in sensitivity analysis did not substantially change the findings (Table 3). In addition, sensitivity analyses with each study removed individually suggested that no study individually altered the pooled results of PPWR significantly. Five studies provided the odds ratio of a weight increase in PPWR of at least 5 kg in women with excessive GWG and in women with adequate GWG. We combined these odds ratio values and the summarized result showed a significant relationship between excessive GWG and higher PPWR risks (OR=2·08; 95 % CI 1·60, 2·70; Fig. 3).
Pooled estimates for the weighted mean differences (WMD, kg) of postpartum weight retention between women who gained below (a) or above (b) and within the Institute of Medicine recommendation for gestational weight gain. The study-specific WMD and 95 % CI are represented by the grey square and horizontal line, respectively; the size of the data marker (grey square) is proportional to the weight of the study in the meta-analysis. The centre of the open diamond presents the pooled WMD and its width represents the pooled 95 % CI
Forest plot of the studies on the risk of postpartum weight retention of ≥5 kg for the women with excessive gestational weight gain (GWG) v. the women with adequate GWG. The study-specific OR and 95 % CI are represented by the grey square and horizontal line, respectively; the size of the data marker (grey square) is proportional to the weight of the study in the meta-analysis (note: weights are from random-effects analysis). The centre of the open diamond presents the pooled OR and its width represents the pooled 95 % CI

Subgroup analyses of postpartum weight retention stratified by postpartum duration and US Institute of Medicine (IOM) guidelines
* Number of comparisons.
In the present research, ten studies, which involved 116 735 women, analysed the PPWR at different pre-pregnancy BMI from 1 month to 15 years. Mean PPWR decreased with increasing BMI group. Compared with normal-weight women, underweight women retained an additional 0·54 kg (95 % CI 0·06, 1·02 kg) weight; whereas overweight and obese women had significantly lower PPWR of −0·81 kg (95 % CI −1·23, −0·39 kg) and −2·34 kg (95 % CI −3·28, −1·40 kg), respectively (Fig. 4 ). Subgroup analysis with respect to postpartum time spans did not show any significant differences between the short- and long-term effects of pre-pregnancy BMI on PPWR. Sensitivity analyses with each study removed individually suggested that no study individually altered the pooled results of PPWR significantly.
(Continued on following page)
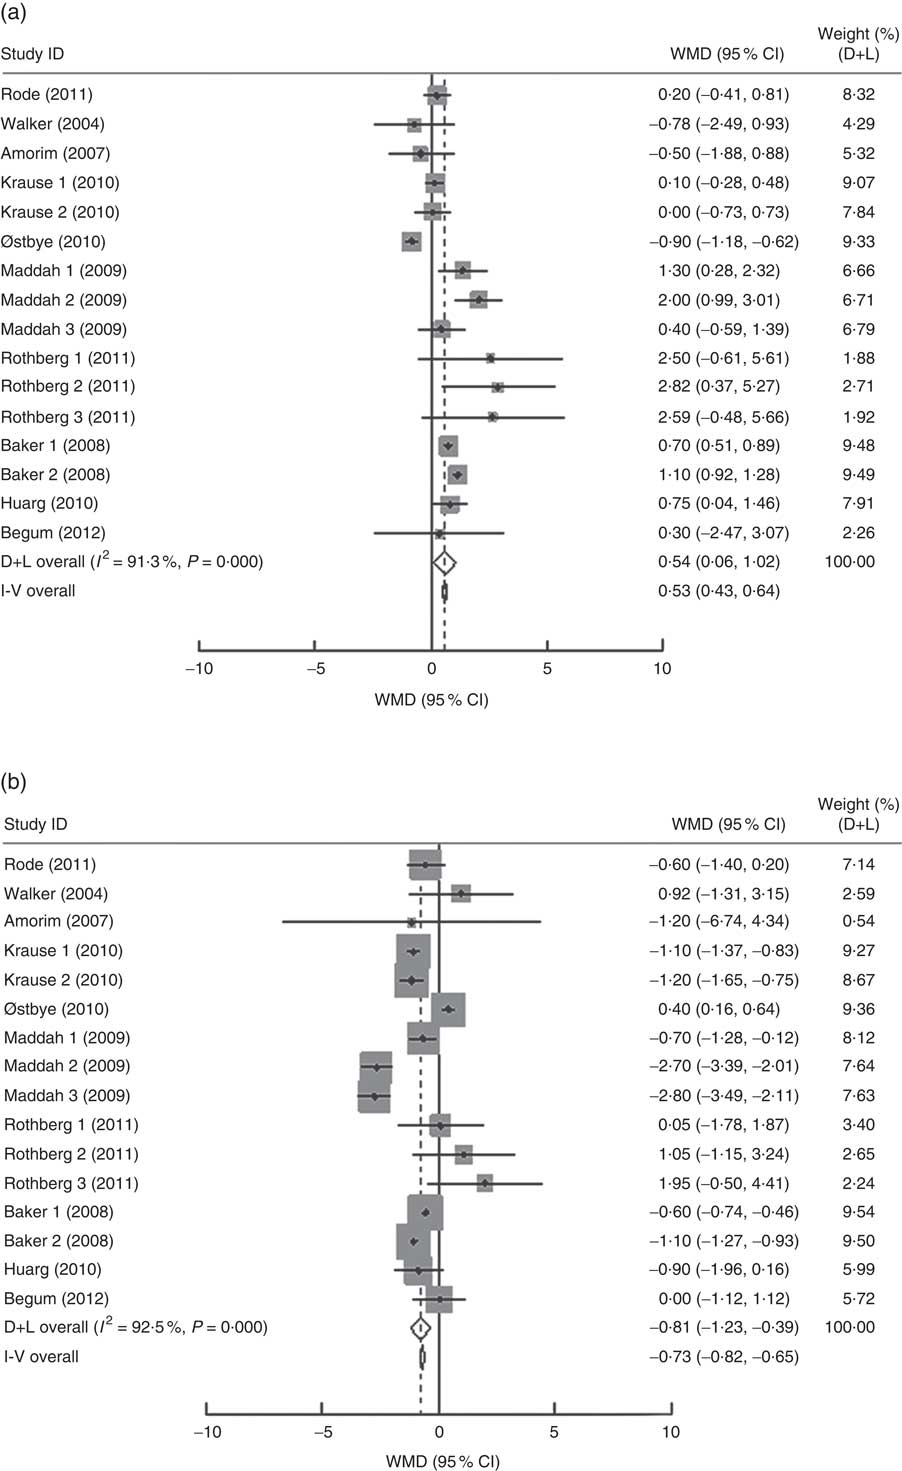
(Continued from previous page) Pooled estimates for the weighted mean differences (WMD, kg) of postpartum weight retention between women whose pre-pregnancy BMI was less than 18·5 kg/m2 (a), 25·0–29·9 kg/m2 (b) or ≥30·0 kg/m2 (c) and women whose pre-pregnancy BMI was 18·5–24·9 kg/m2. The study-specific WMD and 95 % CI are represented by the grey square and horizontal line, respectively; the size of the data marker (grey square) is proportional to the weight of the study in the meta-analysis. The centre of the open diamond presents the pooled WMD and its width represents the pooled 95 % CI
Potential publication bias was detected using funnel plots, Egger’s test and Begg’s test. The funnel plots showed a symmetric distribution of PPWR around the summary estimate and thus did not indicate any publication bias (data not shown). Egger’s and Begg’s tests yielded results that were similar to that of the funnel plots: inadequate v. adequate (Egger P=0·134; Begg P=0·869), excessive v. adequate (Egger P=0·312; Begg P=0·323), underweight v. normal weight (Egger P=0·901; Begg P=0·787), overweight v. normal weight (Egger P=0·858; Begg P=0·242) and obese v. normal weight (Egger P=0·739; Begg P=0·1). In addition, the funnel plot showing the relationship between the odds ratio and the standard error of the logarithmic odds ratio suggested no evidence of publication bias.
Discussion
The current review presents an update of the meta-analysis by Nehring et al. that compared the effects of GWG in accordance with the IOM guidelines on PPWR( Reference Nehring, Schmoll and Beyerlein 27 ). Moreover, we determined the effects of pre-pregnancy BMI in accordance with the WHO classification on PPWR and examined whether weight increase during pregnancy, rather than the pre-pregnancy BMI, determines the shorter- or longer-term PPWR for the first time. In the present research, meta-analysis on the influence of GWG on PPWR showed that excessive GWG can significantly increase higher PPWR risks (OR=2·08, 95 % CI 1·60, 2·70). In addition, the results suggested that mean PPWR decreased with increasing BMI group.
Subgroup analysis of postpartum follow-up time revealed that the association between inadequate GWG and PPWR faded over time and became insignificant (−1·42 kg; 95 % CI −3·08, 0·24 kg) after ≥15 years. This result supports the findings of the other meta-analysis, which reported that the effect size of this association appeared to decrease over postpartum time, ultimately becoming statistically insignificant after 15 years postpartum( Reference Nehring, Schmoll and Beyerlein 27 ). In another meta-analysis, Mannan et al. reported that the difference in PPWR in women with inadequate GWG persisted for a long time, and meta-analysis of those studies conducted after 15 years postpartum suggested consistency, albeit slightly decreased effect size (−1·53 kg; 95 % CI −2·53, −0·54 kg), but remained statistically significant( Reference Mannan, Doi and Mamun 28 ). Although the underlying mechanisms of association between GWG and PPWR are unknown, the present meta-analyses and the previous studies suggest that inadequate GWG affected PPWR, which decreased over postpartum time( Reference Kac, Benicio and Velasquez-Melendez 22 , Reference Mannan, Doi and Mamun 28 ). However, the potential beneficial effect of inadequate GWG on PPWR should be balanced against the potential risks of inadequate GWG for underweight women because underweight women would probably benefit from weight gain. Previous studies reported that nearly 35 % of underweight women gained less weight than the recommended values. These women already had low BMI; therefore, inadequate weight gain increased the risk of complications, such as osteoporosis, preterm delivery and having a low-birth-weight infant( Reference Wise, Palmer and Heffner 29 ).
For women with excess GWG, stratification of postpartum time spans showed a U-shaped trend for this additional weight retention, being higher at the early postpartum, then declining by 1 year postpartum and then increasing again by 21 years postpartum. However, this result should be viewed with caution because it is based on the results of only two studies at 1–3 years postpartum( Reference Østbye, Krause and Swamy 13 , Reference Maddah and Nikooyeh 15 ) and two studies at more than 15 years postpartum( Reference Mamun, Kinarivala and O’Callaghan 9 , Reference Amorim, Rossner and Neovius 11 ). In addition, information on the time period between 3 and 15 years is unavailable. Mannan et al. also found a U-shaped trend for this additional weight retention, being higher at the early years postpartum, then declining by 8·5 years postpartum and then increasing again by 21 years postpartum( Reference Mannan, Doi and Mamun 28 ). The present research and the previous studies suggest that women who gained excess weight during pregnancy tended to have a greater PPWR in the long term. In the long term, these women are at greater risks of having an increased BMI and becoming overweight or obese postpartum.
Meta-analyses on GWG and PPWR in the present review were limited to studies that measured GWG in relation to IOM categories, which included pre-pregnancy BMI and can assess GWG independently of pre-pregnancy BMI. The effect of high and low GWG stratified by pre-pregnancy BMI on PPWR would be interesting to analyse. Unfortunately, only four of the included studies provided additional data on GWG stratified by pre-pregnancy BMI. Two studies suggested a marginally higher effect of high GWG on PPWR in mothers in a high-weight category( Reference Lowell and Miller 7 , Reference Kac, Benicio and Velasquez-Melendez 14 ). The other two studies reported that when stratified by pre-pregnancy BMI and total weight gain adherence, only women with pre-pregnancy BMI in the normal or overweight ranges who gained a total weight that was greater than the recommended value retained more weight in the postpartum period than the women who met the total weight gain recommendations( Reference Rode, Kjaergaard and Ottesen 8 , Reference Begum, Colman and McCargar 19 ). Begum et al. reported that 80 % of the women with a BMI in the overweight or obese group gained a total weight that was greater than the recommended value, indicating that higher pre-pregnancy BMI is a significant predictor of excessive weight gain during pregnancy( Reference Begum, Colman and McCargar 19 ). These results suggest that tools and intervention programmes have been developed to promote healthy weight gain for pregnant women; however, greater efforts should be exerted on women with high pre-pregnancy BMI.
The limitations of the present study should be considered. There exist a number of known determinants for PPWR, such as breast-feeding( Reference Krause, Lovelady and Peterson 12 , Reference Østbye, Krause and Swamy 13 ), diet, physical activity and other lifestyle factors( Reference Herring, Rich-Edwards and Oken 30 , Reference Oken, Taveras and Popoola 31 ). It is unclear whether these potential confounders might be more relevant because adjustment for confounding was attempted in only one of these studies. Therefore, we cannot exclude residual confounding of original studies in the meta-analysis. The present investigation was also limited by the low number of long-term studies, which weakened the reliability of long-term outcomes.
Conclusion
The meta-analysis results indicated that weight gain in pregnancy can lead to short- and long-term postpartum weight imbalance. These data support the recommendations of the US IOM regarding the importance of adequate weight gain avoiding short- and long-term high PPWR. The substantial association between excess GWG and PPWR indicates that high-quality confirmatory studies and studies on interventions based on diet and physical activity are clearly needed to address the issue of excess weight gain during pregnancy.
Acknowledgements
Financial support: This research project was sponsored by Nestlé Research Center. This research project was a collaborative work between Peking University and Nestlé. The views and opinions expressed in this manuscript are those of the authors and do not necessarily reflect the opinions and recommendations of Nestlé. Conflict of interest: None. Authorship: K.R., D.M., X.H., X.Q., J.W. and P.W. participated in the design of the manuscript. K.R., D.M., I.M.Y.S., K.Y. and Y.N. participated in performing the research and statistical analysis. All authors read and approved the final manuscript. Ethics of human subject participation: Ethical approval was not required.