


Introduction
Varied luminescence signals from quartz and feldspar are used for luminescence dating. These signals are obtained through multiple combinations of optical and thermal stimulations. Natural sediments are a mixture of minerals and applications of luminescence dating to rock slices and fine grains (4–11 μm) require the tedium of physical, chemical, and optical isolation of luminescence signals from specific mineral phases. This is challenging when the sample amount is small or the grain sizes are small to permit ease of mineral separation.
For coarse grains, dating protocols rely on the separation of a single mineral type such that luminescence from other minerals is either eliminated through chemical procedures and/or minimised through measurement protocols with mineral specific stimulation sequences and optical windows for luminescence detection. Blue/Green light stimulated luminescence (BLSL/GLSL) from feldspar grains and from inclusions contaminate BLSL of quartz. Therefore, efforts are needed to separate pure quartz and, if needed, minimise feldspar contamination to BLSL of quartz through the use of appropriate optical windows (Banerjee et al., Reference Banerjee, Murray, Bøtter-Jensen and Lang2001; Jain and Singhvi, Reference Jain and Singhvi2001; Wallinga et al., Reference Wallinga, Murray and Bøtter-Jensen2002) or through time-resolved luminescence measurements (Denby et al., Reference Denby, Bøtter-Jensen, Murray, Thomsen and Moska2006; Thomsen et al., Reference Thomsen, Jain, Murray, Denby, Roy and Bøtter-Jensen2008a; Ankjærgaard et al., Reference Ankjærgaard, Jain, Thomsen and Murray2010). Infrared stimulated luminescence (IRSL) prebleach to isolate quartz BLSL/GLSL is also used (Jain and Singhvi, Reference Jain and Singhvi2001; Roberts and Wintle, Reference Roberts and Wintle2003; Roberts, Reference Roberts2007; Qin et al., Reference Qin, Chen and Li2021).
In contrast, the presence of traces of quartz in feldspar separates is ignored, as IRSL measured at low temperatures only arises from feldspars (Hütt et al., Reference Hütt, Jaek and Tchonka1988) and the luminescence sensitivity of quartz is significantly lower than feldspars. Optical dating using feldspar grains includes IRSL (Wallinga et al., Reference Wallinga, Murray and Wintle2000) and its variants such as post-IR IRSL (pIRIRSL; Buylaert et al., Reference Buylaert, Murray, Thomsen and Jain2009, Reference Buylaert, Thiel, Murray, Vandenberghe, Yi and Lu2011, Reference Buylaert, Jain, Murray, Thomsen, Thiel and Sohbati2012), multiple elevated temperature pIRIR (Li and Li, Reference Li and Li2011), post-violet IRSL (pVIRSL; Devi et al., Reference Devi, Chauhan, Rajapara, Joshi and Singhvi2022), redistributed IRSL (Morthekai et al., Reference Morthekai, Chauhan, Jain, Shukla, Rajapara, Krishnan, Sant, Patnaik, Reddy and Singhvi2015) and IR photoluminescence (Prasad et al., Reference Prasad, Poolton, Kook and Jain2017; Kumar et al., Reference Kumar, Kook and Jain2021). Earlier studies on samples of mixed mineralogy and without any sample separation indicated deviations of estimated ages from expected ages, which is attributed to mixed signals, variable grain sizes, and lack of standardised protocols (Kook et al., Reference Kook, Murray, Lapp, Denby, Ankjærgaard, Thomsen, Jain, Choi and Kim2011; Stone et al., Reference Stone, Bateman and Thomas2015; Munyikwa et al., Reference Munyikwa, Kinnaird and Sanderson2021).
Besides coarse grains (>90 μm), fine grains (4–11 μm) of mixed mineralogy are also used for estimating ages. Zimmerman (Reference Zimmerman1971) developed the use of fine polymineral grains for luminescence dating of fired pottery and provided an understanding of alpha efficiency, aspects of which were later refined by Bowman and Huntley (Reference Bowman and Huntley1984) and Singhvi and Aitken, (Reference Singhvi and Aitken1978). Procedures to separate fine grains of quartz using silica-saturated hydrofluorosilicic acid have been developed (Berger et al., Reference Berger, Mulhern and Huntley1980; Mejdahl and Christiansen, Reference Mejdahl and Christiansen1994) but these methods have not been used routinely due to lengthy and cumbersome chemical processing.
Devi et al. (Reference Devi, Chauhan, Rajapara, Joshi and Singhvi2022) reported the pVIRSL signal from feldspar. This is an IRSL signal after a violet stimulation of potassium-rich feldspar (K-feldspar), and has a near-zero athermal fading. A single-aliquot regeneration-dose protocol using pVIRSL (pVIR-SAR) was developed, which provided ages consistent with available controls (Devi et al., Reference Devi, Chauhan and Singhvi2024). Violet stimulation bleaches the luminescence of quartz and simultaneously photo-transfers charges from deep traps to IR traps of feldspar, which are then probed using IR stimulation. This suggests selective detection of the feldspar luminescence in polymineral samples without contamination by luminescence from other minerals. The present study tests this hypothesis and measures equivalent dose results using the pVIR-SAR protocol on mixed-mineralogy (polymineral) fine- and coarse-grain samples. The work compares the obtained results with BLSL dating of quartz (Murray and Wintle, Reference Murray and Wintle2000), IRSL at 50°C (Wallinga et al., Reference Wallinga, Murray and Wintle2000), and pIRIRSL at 290°C from feldspar (Buylaert et al., Reference Buylaert, Murray, Thomsen and Jain2009). Further, data on the bleachability of pVIRSL under daylight exposure, its athermal fading rates, and alpha efficiencies are reported and compared with IRSL and pIRIRSL signals.
Samples and experimental setup
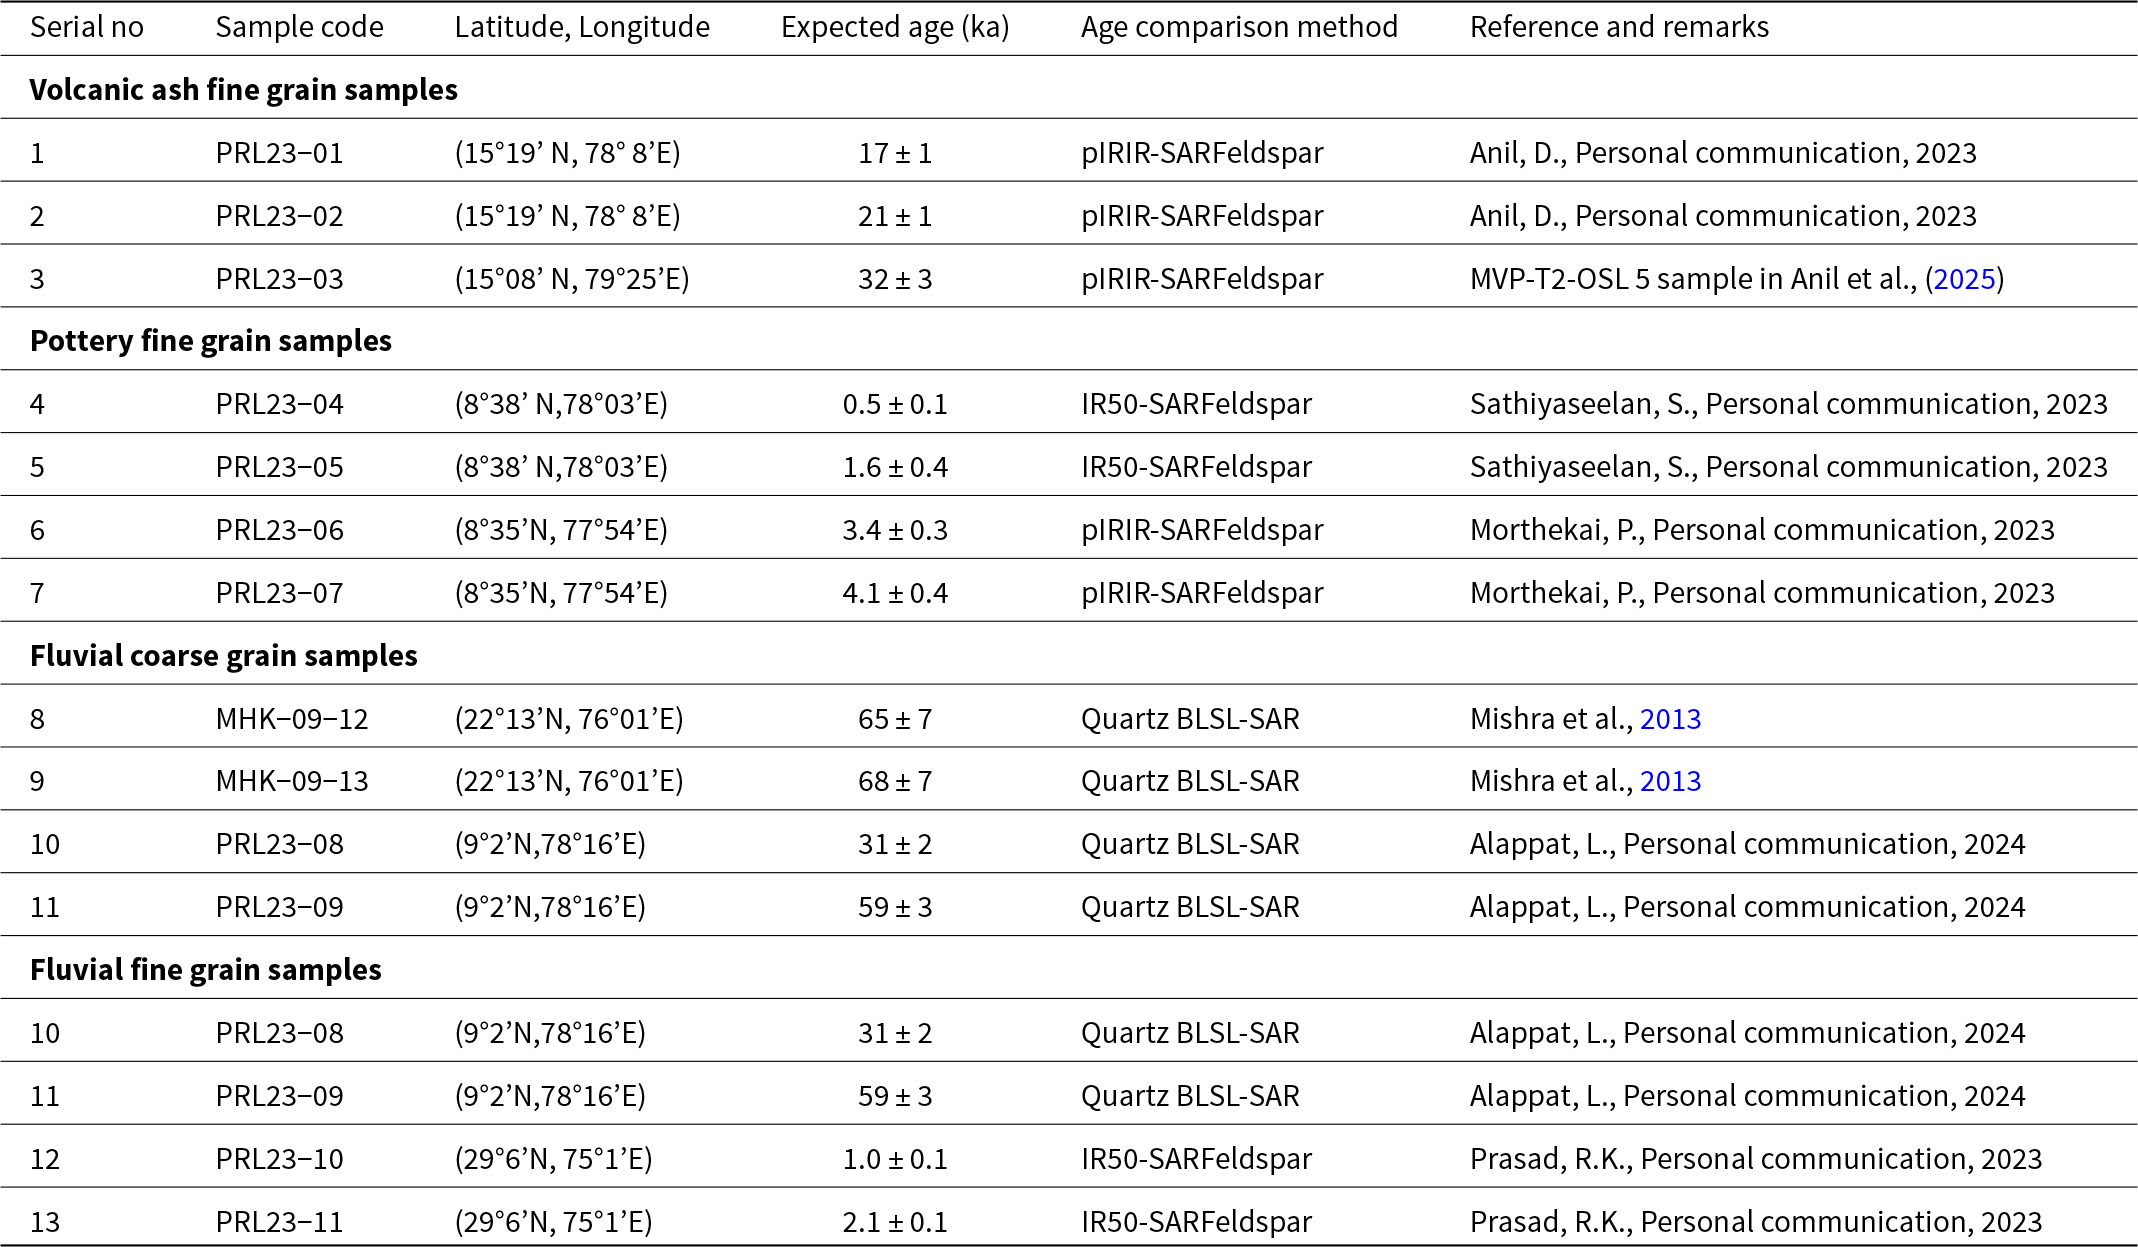
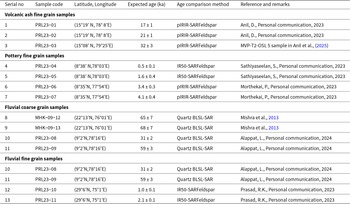
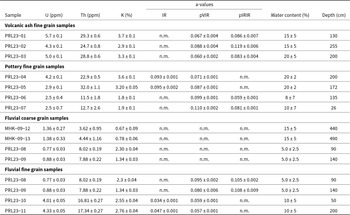
Table 1 details 13 samples with independently estimated depositional ages used in the study. These samples are from diverse locations and depositional histories and include samples from three volcanic ash deposits, four pottery artefacts, and six fluvial sediments, with luminescence ages in the range of 500 yr to 68 ka (Table 1). PRL23-01, -02 and -03 are volcanic ash samples and of these PRL23-03 has age controls from ages of sediments above and below the ash layer (Anil et al., Reference Anil, Devi, Sukumaran, Lakshmi, Deenadayalan, Kumar and Chauhan2025). PRL23-04 and -05 are pottery samples from southern India. PRL23-06 and -07 are hollow Iron Age urns and the X-ray diffraction data for these two samples show the presence of sanidine (Morthekai, P., personal communication, 2023). PRL23-08 and -09 are fluvial samples from Tamil Nadu with BLSL ages as controls and for these, both fine-grain and coarse-grain samples are analysed. PRL23-10 and -11 are fine-grain fluvial samples from a single stratigraphic unit (Prasad, R.K., Personal communication, 2023). Samples MHK-09-12 and -13 are fluvial sediments from Mehtakheri, with age controls based on BLSL of quartz (Mishra et al., Reference Mishra, Chauhan and Singhvi2013).
List of samples along with geological location and age controls.
The volcanic ash and pottery artefacts are fine-grained and therefore are suitable only for polymineral fine-grain measurements. The sediment samples are collected using specially designed sampling steel tubes (Chandel et al., Reference Chandel, Patel, Vaghela and Ubale2006) and opened under subdued red light (λ> 630 nm). The top and bottom ∼3 cm portion of the sample in the pipe is used for radioactivity and moisture content measurements. Sediment in the interior of the tube is used for luminescence measurements. For pottery samples, the outer few millimetres of daylight-exposed surface are removed and this fraction and the nearby sediments are used for dose rate measurements. The interior is used for the equivalent dose estimation. All coarse- and fine-grain samples are treated with 1N hydrochloric acid (HCl) and 30% hydrogen peroxide to remove the carbonates and organic matter, respectively. Fine-grain samples are then treated with 0.01 N sodium oxalate solution for deflocculation. The desired grain size of 4–11 µm is obtained using Stokes’ law (Zimmerman, Reference Zimmerman1971). Equal volumes of grains in suspension are pipetted onto aluminium discs in vials and dried at 45°C. The coarse-grain fractions are obtained by dry sieving, etching with 10% hydrofluoric acid (HF) for 40 min (to remove alpha skin; Fleming, Reference Fleming1966, Reference Fleming1970; Goedicke, Reference Goedicke1984), followed by 30 min treatment with 12N HCl to convert insoluble fluorides into soluble chlorides and then washed with distilled water.
Luminescence measurements are carried out in the Risø-TL/OSL DA-20 reader (Bøtter-Jensen et al., Reference Bøtter-Jensen, Thomsen and Jain2010; Lapp et al., Reference Lapp, Kook, Murray, Thomsen, Buylaert and Jain2015) at the Physical Research Laboratory, Ahmedabad, during the year 2023–2024. The stimulations use IR (850 ± 33 nm) light-emitting diodes, and a violet laser diode (405 ± 15 nm). Detection windows comprise filters permitting transmission in the 327–353 nm region [U-340 + Brightline 340/26] for violet stimulation, and in the 320–520 nm region [BG-39 + BG-3 (blue)] for IR stimulation. These are coupled to an ET 9107B photomultiplier tube with a quartz window (Devi et al., Reference Devi, Chauhan, Rajapara, Joshi and Singhvi2022, Reference Devi, Chauhan and Singhvi2024). An indigenous daylight simulator comprising an Osram ultra-vitalux 300 W sunlamp filtered through a glass window is used as a surrogate for daylight bleaching of the samples.
Methodology
pVIRSL signal of mixed mineralogy samples
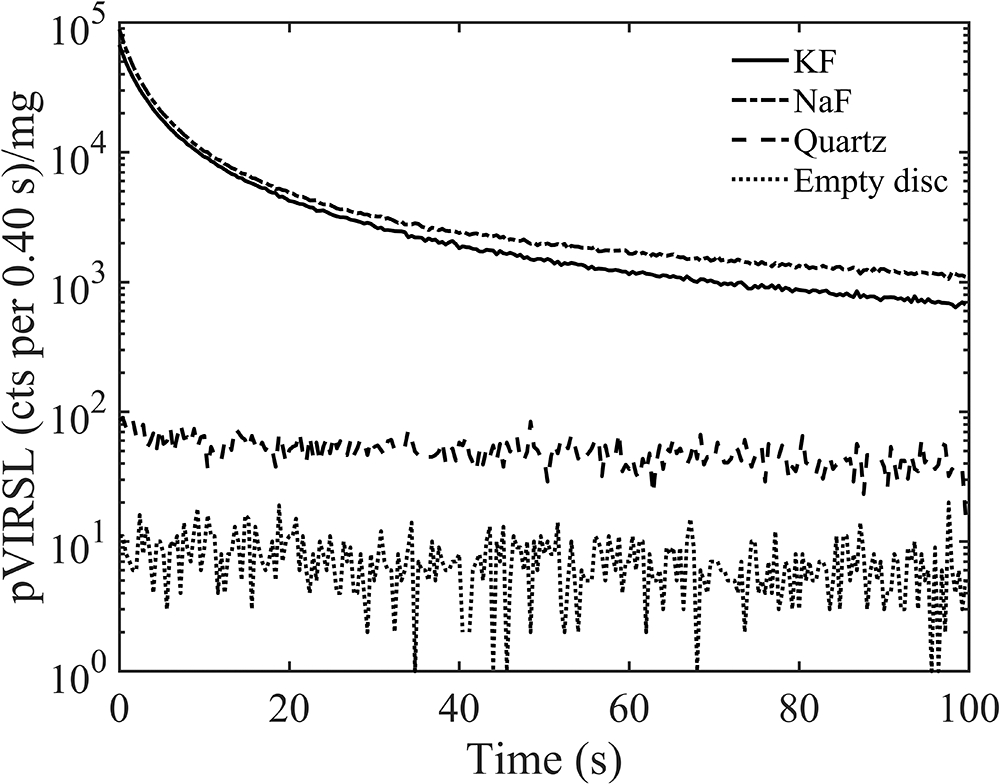
The characteristics of pVIRSL signal of pure feldspar samples were discussed by Devi et. al (Reference Devi, Chauhan and Singhvi2024). In this study, the suitability of the pVIR-SAR protocol and the assumption that in an ensemble of mixed mineralogy (e.g. quartz, feldspars and others) the pVIRSL signal results only from the feldspars is investigated. The pVIRSL signal at 200°C of sodium-rich feldspar (Na-feldspar [NaF]), K-feldspar (KF), and Risø calibration quartz (batch 122) is measured after a cut-heat to 500°C (to remove any signal from the previous dose), followed by a 20 Gy dose, a preheat at 250°C for 60 s, and violet stimulation at 50°C for 100 s. The weight-normalised pVIRSL signals are shown in Figure 1. The pVIRSL from an empty stainless-steel disc is also included to show the background signal.
Equivalent dose measurements
The pVIR-SAR protocol ((Devi et al., Reference Devi, Chauhan and Singhvi2024); Table S1) is used for equivalent dose (De) measurements. In the pVIR-SAR protocol, IRSL at 200°C for 100 s is measured after violet stimulation at 50°C for 100 s and a preheat at 250°C for 60 s. A test dose of 50–80% of the expected dose is then applied. At the end of each SAR cycle, VSL and IRSL exposures at 350°C for 200 s are used to remove charges from deeper traps. Typically, 15 to 24 aliquots are measured per sample. As the over-dispersion in equivalent doses is less than 30%, the central age model (CAM) is applied. De values of the aliquots having recuperation ≤ 5% of the natural signal, a recycling ratio within 10% of unity and signal-to-noise (S/N) ratio > 3 are accepted for dose computation. The pVIR-SAR ages are compared with BLSL-SAR ages for quartz mineral separates, IR-SAR ages for (Table S2) for young samples, and the pIRIR-SAR (Table S3) protocol for older samples. For pottery samples with the presence of sanidine, pIRIR-SAR ages are used. Laboratory residual doses are not subtracted from the equivalent dose values. As reported in the previous literature that natural residual doses are much smaller than from the residual doses estimated in the laboratory (Sohbati et al., Reference Sohbati, Murray, Buylaert, Ortuno, Cunha and Masana2012; Buylaert et al., Reference Buylaert, Jain, Murray, Thomsen, Thiel and Sohbati2012; Li et al., Reference Li, Jacobs, Roberts and Li2014; Avram et al., Reference Avram, Constantin, Hao and Timar-Gabor2022).
Fading rate measurements
The athermal fading rates (g-values) for all signals are estimated using Auclair et al. (Reference Auclair, Lamothe and Huot2003) and Devi et al. (Reference Devi, Chauhan, Rajapara, Joshi and Singhvi2022). The delay times are based on the equivalent dose of the samples and ranged from 1 to ∼10 days. The tc (time since irradiation for the prompt measurement) values are normalised to a fixed value of 2 days (Huntley and Lamothe, Reference Huntley and Lamothe2001; Auclair et al., Reference Auclair, Lamothe and Huot2003). Athermal fading rates of pVIRSL for polymineral samples are computed by plotting test dose normalised pVIRSL intensities against the delay time (Figures S1–S3). The fading corrections for ages are carried out using the method suggested by Huntley and Lamothe (Reference Huntley and Lamothe2001), with all error propagations considered. The fading rates are measured for all the samples (Figures S1–S3), along with one museum Na-feldspar (Figure 2).
Laboratory residual dose and dose recovery tests
The laboratory residual doses are estimated after the 5 h exposure under a filtered sunlamp. For the dose recovery tests, a known dose approximately equal to the expected dose is administered after a 5 h sunlamp bleach, and subsequently recovered using the pVIR-SAR and pIRIR-SAR protocols. An average of recovered doses of six aliquots per sample is used for the dose recovery ratio calculation. The laboratory residual doses are subtracted from the recovered doses. Table 2 and Table 3 present the residual doses and dose recovery ratios for pVIR-SAR and pIRIR-SAR protocols, respectively.
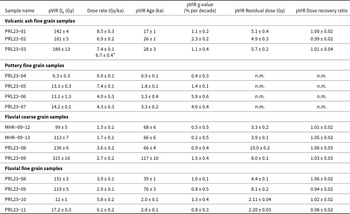
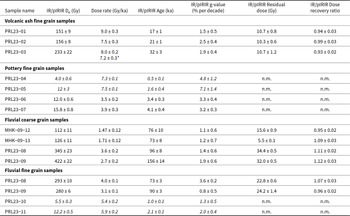
Estimated De values, fading values, recuperation, residual doses, and dose recovery ratios for all samples using pVIR-SAR protocol. Recuperation observed in all the samples is <5%. The De values are corrected for fading, wherever applicable.
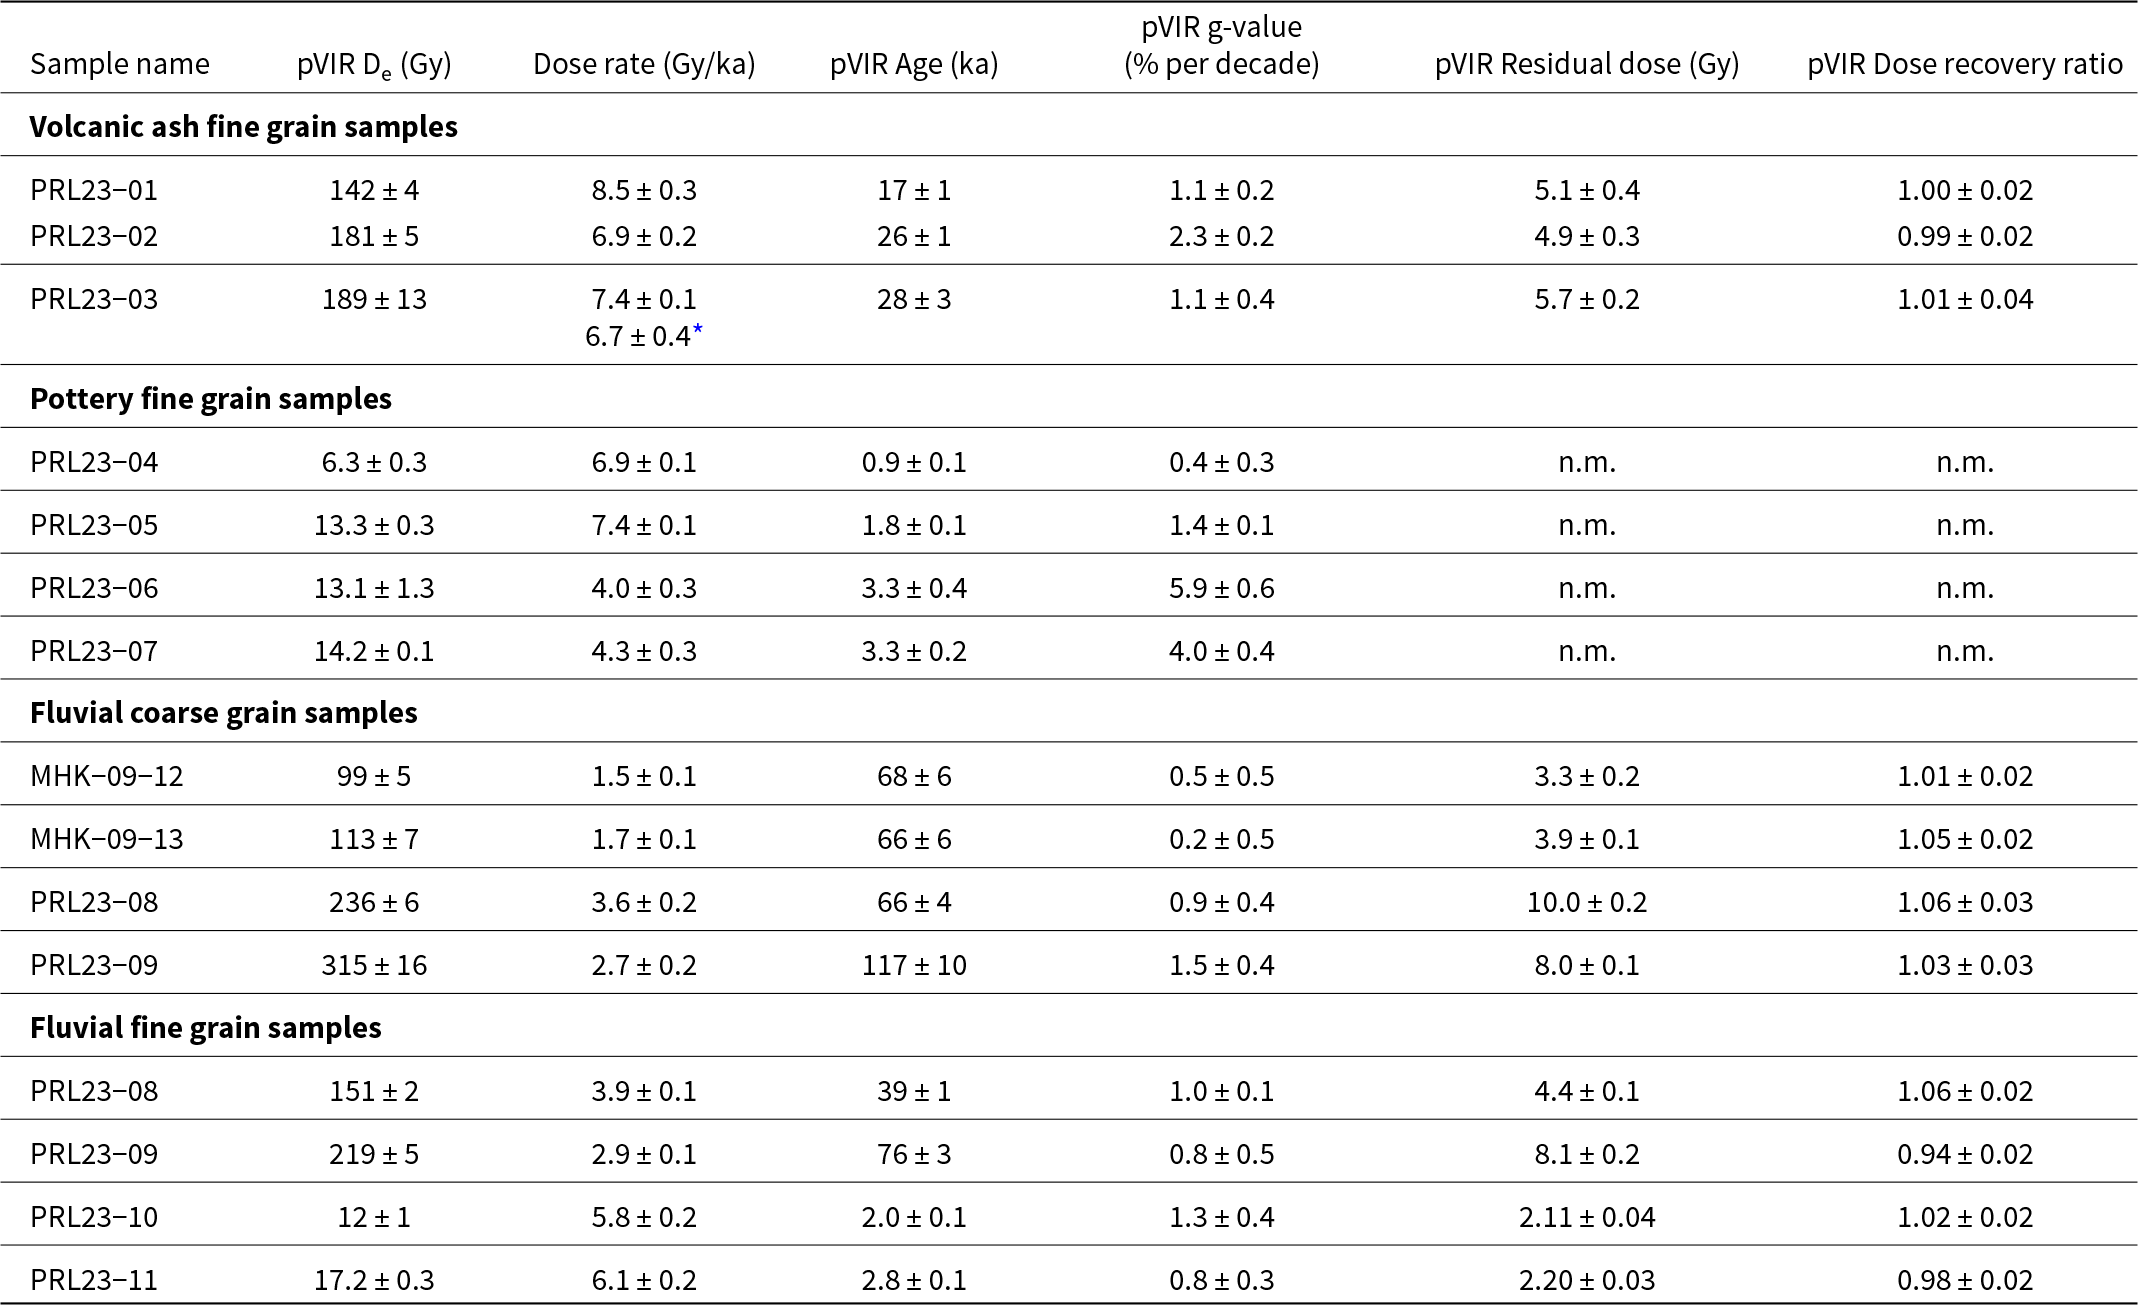
* Represents the dose rate after volumetric correction. n.m. denotes the not measured parameters.
Alpha efficiency and dose rate measurements
Alpha efficiencies (a-values) for pVIRSL IRSL, and pIRIRSL signals are measured. The samples are bleached under the sunlamp for 5 h followed by irradiation of six aliquots of each sample under vacuum using a calibrated americium-241 alpha source (Singhvi and Aitken, Reference Singhvi and Aitken1978) for 120 min. Then, equivalent beta doses for the alpha-dosed aliquots are estimated and alpha efficiencies are computed following Aitken, (Reference Aitken1985; pp. 308–317).
The elemental concentration of radioactive nuclides is measured using a high-purity germanium (HPGe) detector. The dose rates are calculated using a Dose Rate Calculator (DRc) software under an infinite matrix assumption (Tsakalos et al., Reference Tsakalos, Christodoulakis and Charalambous2016). Wherever required, volumetric corrections are applied to meet the infinite dose matrix criterion (Appendix I). The conversion factors used in DRc software followed Guérin et al. (Reference Guérin, Mercier and Adamiec2011). The dose rate computation assumed internal potassium (40K) of 12.5 ± 0.5% (Huntley and Baril, Reference Huntley and Baril1997) and rubidium (87Rb) at 400 ± 100 ppm (Huntley and Hancock, Reference Huntley and Hancock2001). The cosmic ray contribution to dose rate is estimated using Prescott and Hutton (Reference Prescott and Hutton1994).
Results
Purity of the pVIRSL signal to feldspar from mixed mineralogy
Figure 1 compares the weight-normalised pVIRSL decay curves for quartz, Na-feldspar, K-feldspar, and empty stainless-steel discs. The pVIRSL from both quartz and the empty disc are at background levels and K-feldspar and Na-feldspar had a pVIRSL signal about 102 times the background. This suggests that in polymineral samples, feldspar is the key source of pVIRSL. With this premise, pVIRSL of both the fine- and coarse-grain polymineral samples was explored.
Weight normalised shine down curves of pVIRSL from potassium feldspar (KF) (Devi et al., Reference Devi, Chauhan and Singhvi2024), sodium feldspar (NaF), quartz (calibration quartz: batch 122) and empty disc measured after 20 Gy of beta dose, a preheat at 250°C for 60 s, and violet stimulation at 50°C for 100 s.

Equivalent dose estimation
Figures S1–S3 provide typical pVIRSL optical decay and dose-response curves (DRCs) for the samples. All samples displayed sufficient signal (S/N ratio > 3). The DRCs are fitted with a single saturating exponential function. The recuperation of all samples is less than 5% of the natural signal, and the recycling ratios are within 10% of unity. Table 2 and 3 provide fading corrected pVIR-SAR equivalent doses along with IR- and pIRIR-SAR-based estimates. With the exception of coarse-grain PRL23-08 and -09, the pVIRSL equivalent doses are consistent with the expected doses. For PRL23-08 coarse grains, the pVIR-SAR equivalent dose is 236 ± 6 Gy, and the corresponding pIRIR-SAR dose is 345 ± 23 Gy. For PRL23-09, these are 315 ± 16 Gy and 422 ± 22 Gy, respectively. However, corresponding coarse-grain quartz equivalent doses, converted to feldspar equivalent doses are 110 ± 6 Gy (quartz dose = 94 ± 4 Gy) and 149 ± 9 Gy (quartz dose = 126 ± 6 Gy), respectively. A threefold dose overestimation is obtained using the pIRIR-SAR protocol and the overestimation is twofold for the pVIR-SAR protocol. The fine-grain pVIR-SAR equivalent doses for the same samples are 151 ± 2 Gy and 219 ± 5 Gy and are closer to the expected equivalent doses (Table 2).
Athermal fading
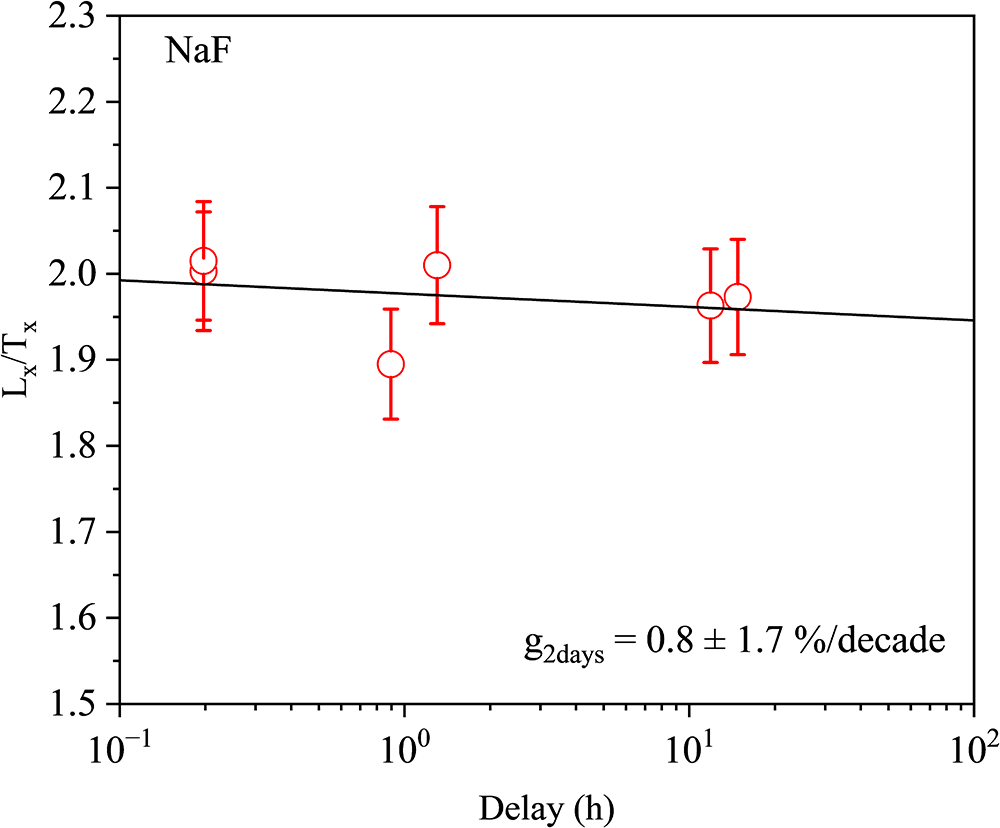
Figure 2 shows the variation of test dose normalised intensity for pVIRSL with delay time for the Na-feldspar sample. The weighted mean of athermal fading rates of fifteen aliquots of Na-feldspar is 0.1 ± 0.2% per decade.
Fading rate measurements for sodium feldspar (NaF) sample for pVIRSL signal. The normalised pVIRSL luminescence intensity is plotted against measurement delay time to estimate fading rate. The weighted mean of athermal fading rates of 15 aliquots is 0.1 ± 0.2% per decade.

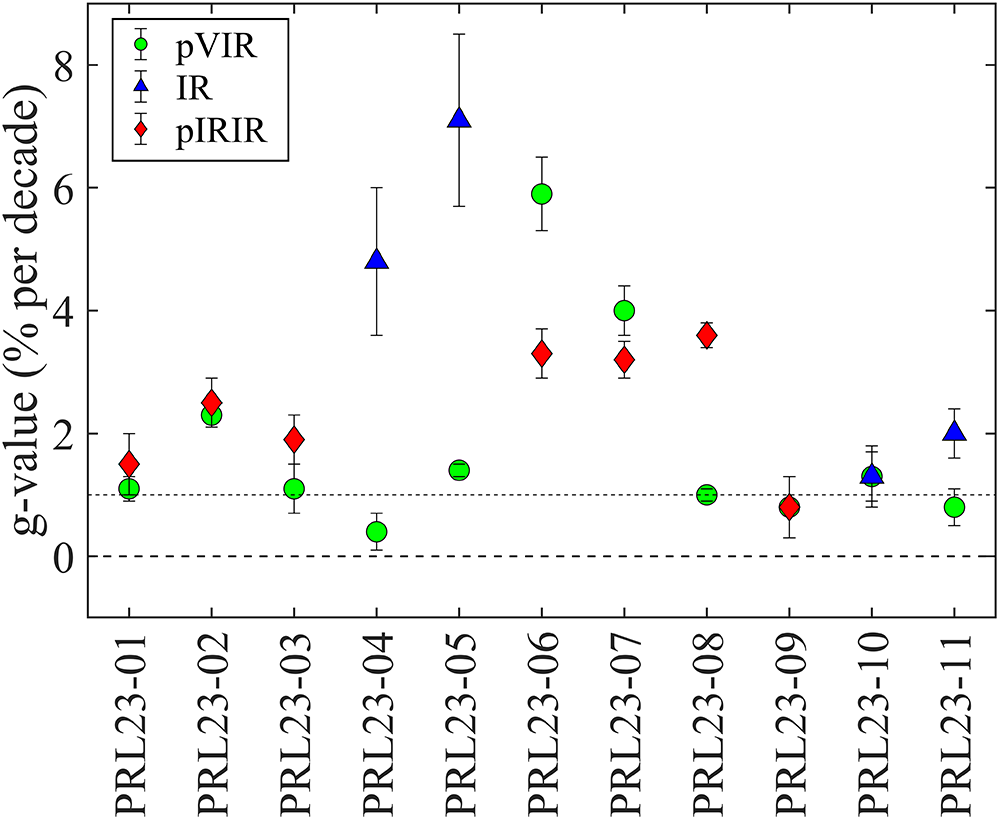
Figures S1–S4 present the normalised intensity with delay time for pVIRSL for all the fine-grain samples. For 6 out of the 11 fine-grain samples, pVIRSL athermal fading rates are g ≤ 1.1% per decade (Table 2, Figure 3). No age corrections are carried out for these samples, as low fading rates would not change the age estimations to any appreciable extent (Buylaert et al., Reference Buylaert, Jain, Murray, Thomsen, Thiel and Sohbati2012). The g-values for pVIRSL for remaining five fine-grain samples PRL23-02, -05, -06, -07 and -10 are 2.3 ± 0.2, 1.4 ± 0.1, 5.9 ± 0.6, 4.0 ± 0.4 and 1.3 ± 0.4% per decade, respectively. For IRSL and pIRIRSL signals, only PRL23-09 fluvial fine-grain sample have g-value of ≤ 1.1% per decade (Table 3, Figure 3). Other fine-grain samples have athermal fading rates >1.1 % per decade.
Average fading rate values for all fine-grain polymineral samples. Age corrections for fading rates less than one are not made (Buylaert et al., Reference Buylaert, Jain, Murray, Thomsen, Thiel and Sohbati2012). For young samples, the IRSL signal was used for controlled ages, except for those containing sanidine (PRL23-06 and PRL23-07), while for older samples, the pIRIRSL signal was measured. The error bars represent the standard error of the mean.
For polymineral coarse grains, three out of four samples yield fading rates ≤ 1% per decade for pVIRSL (Table 2). In contrast, the pRIRSL g-values are consistently ≥ 1% per decade for all four samples (Table 3).
Estimated De values, fading values, recuperation, residual doses, and dose recovery ratios for all samples using IR- and pIRIR-SAR protocol. Recuperation observed in all the samples is <5%. The De values are corrected for fading, wherever applicable.
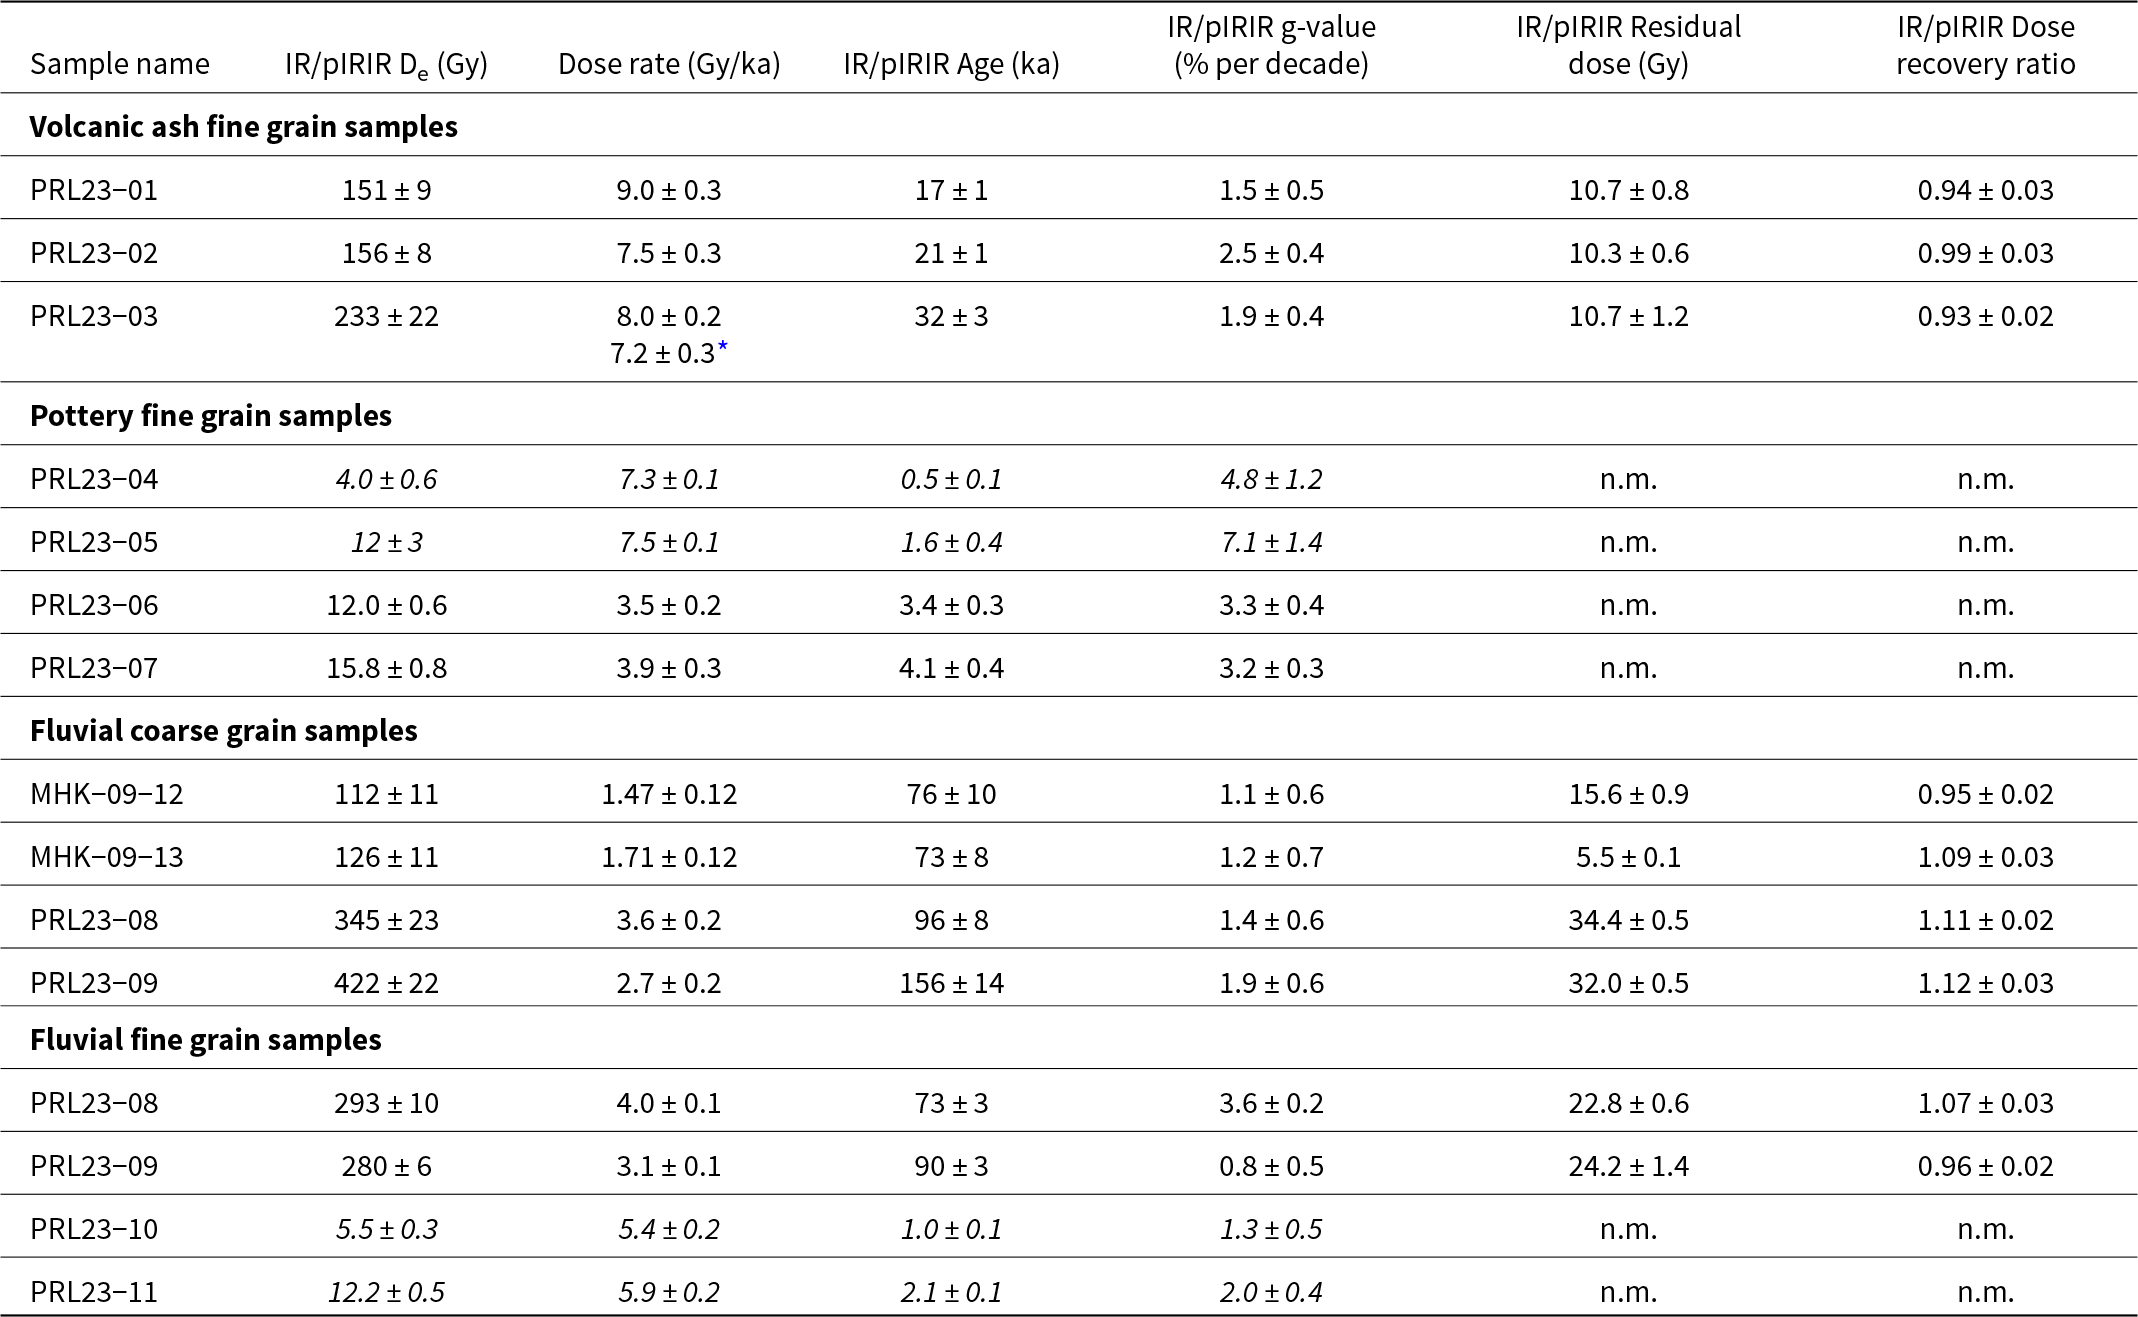
* Represents the dose rate after volumetric correction and font in italics represents the measurements for IRSL at 50 °C. n.m. stands for not measured.
Laboratory residual dose and dose recovery test
The pVIR-SAR laboratory residual doses are ranged from 2.11 ± 0.04 Gy to 10.0 ± 0.2 Gy and for pIRIR-SAR range from 5.5 ± 0.1 Gy to 34.4 ± 0.5 Gy (Table 2 and 3). The laboratory residual doses of pVIR-SAR are 30–70% lower than the pIRIR-SAR and accord with Devi et al. (Reference Devi, Chauhan and Singhvi2024). Thus, pVIRSL is bleached by daylight more efficiently compared to pIRIRSL. Residual doses of the pottery samples are not measured, as firing at temperatures above 400°C should have erased all residual signals. The dose recovery ratios for pVIR-SAR range from 0.94 to 1.06, whereas those for pIRIR-SAR range from 0.93 to 1.12 (Tables 2 and 3).
Dose rate determination
Alpha efficiency
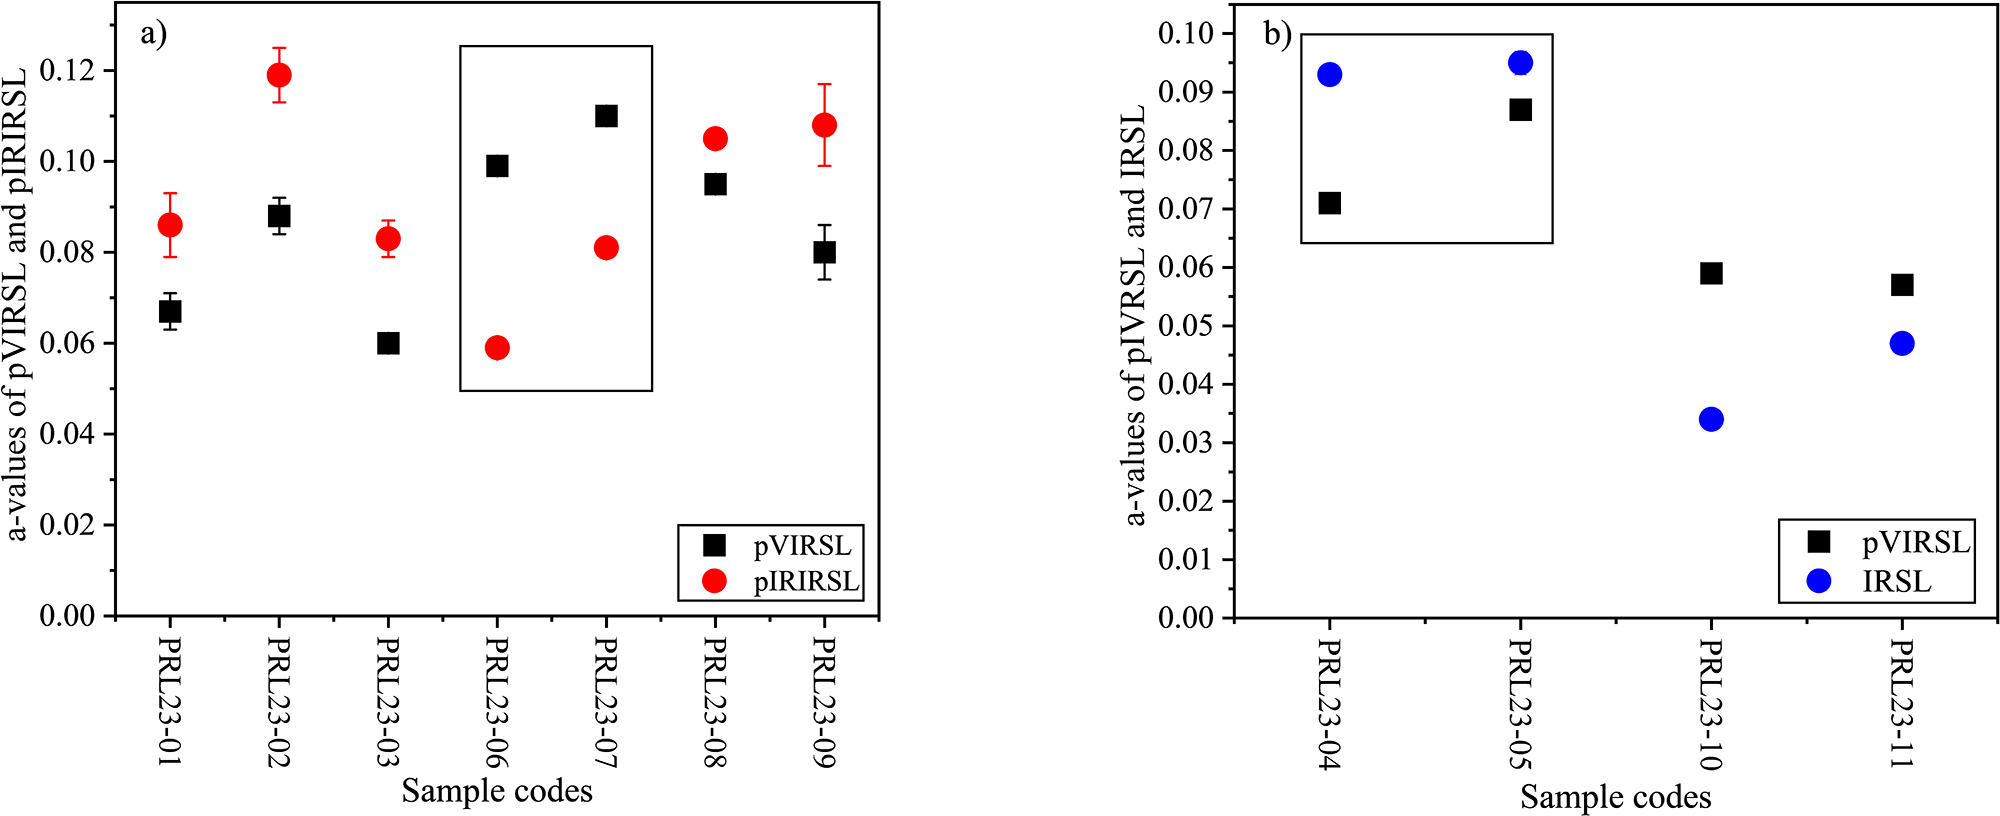
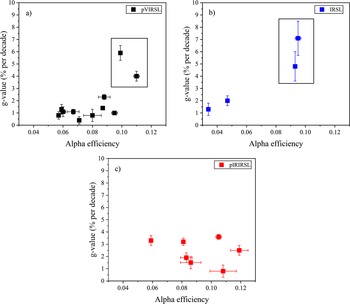
Table 4 and Figure 4 provide alpha efficiencies for pVIRSL, IRSL, and pIRIRSL signals. The alpha efficiencies of pVIRSL for volcanic ash samples, PRL23-01, -02 and -03, are 0.067 ± 0.004, 0.088 ± 0.004, and 0.060 ± 0.002, respectively, and their pIRIRSL a-values are 0.086 ± 0.007, 0.119 ± 0.006 and 0.083 ± 0.004, indicating that the a-values for pVIRSL are lower than pIRIRSL. For all fluvial samples, the a-values follow the order: IRSL < pVIRSL < pIRIRSL. In contrast, the order of a-values are reversed for the pottery samples, where IRSL > pVIRSL > pIRIRSL. Further, a correlation between alpha efficiencies and fading values is explored following the suggestion from Singhvi (Reference Singhvi1981). As seen in Figure 5, the g-values are constant with changing a-values except for pottery samples PRL23-06 and -07, where fading rates are high.
(a) Alpha efficiences of pVIRSL versus pIRIRSL, (b) pVIRSL versus IRSL of all samples. Samples in the rectangle are different sets of pottery samples and shows a reverse trend of alpha efficiencies. Here the data only for fine-grain samples are shown. The error bars represent the standard error of the mean.

The details of the concentration of radioactive nuclides, alpha efficiency (a-values), water content, and sampling depth from the surface for all samples. The dose rates are calculated using the Dose Rate Calculator (DRc) software, assuming an infinite matrix (Tsokolas et al., Reference Tsakalos, Christodoulakis and Charalambous2016). The a-values are measured only for fine grain fractions.
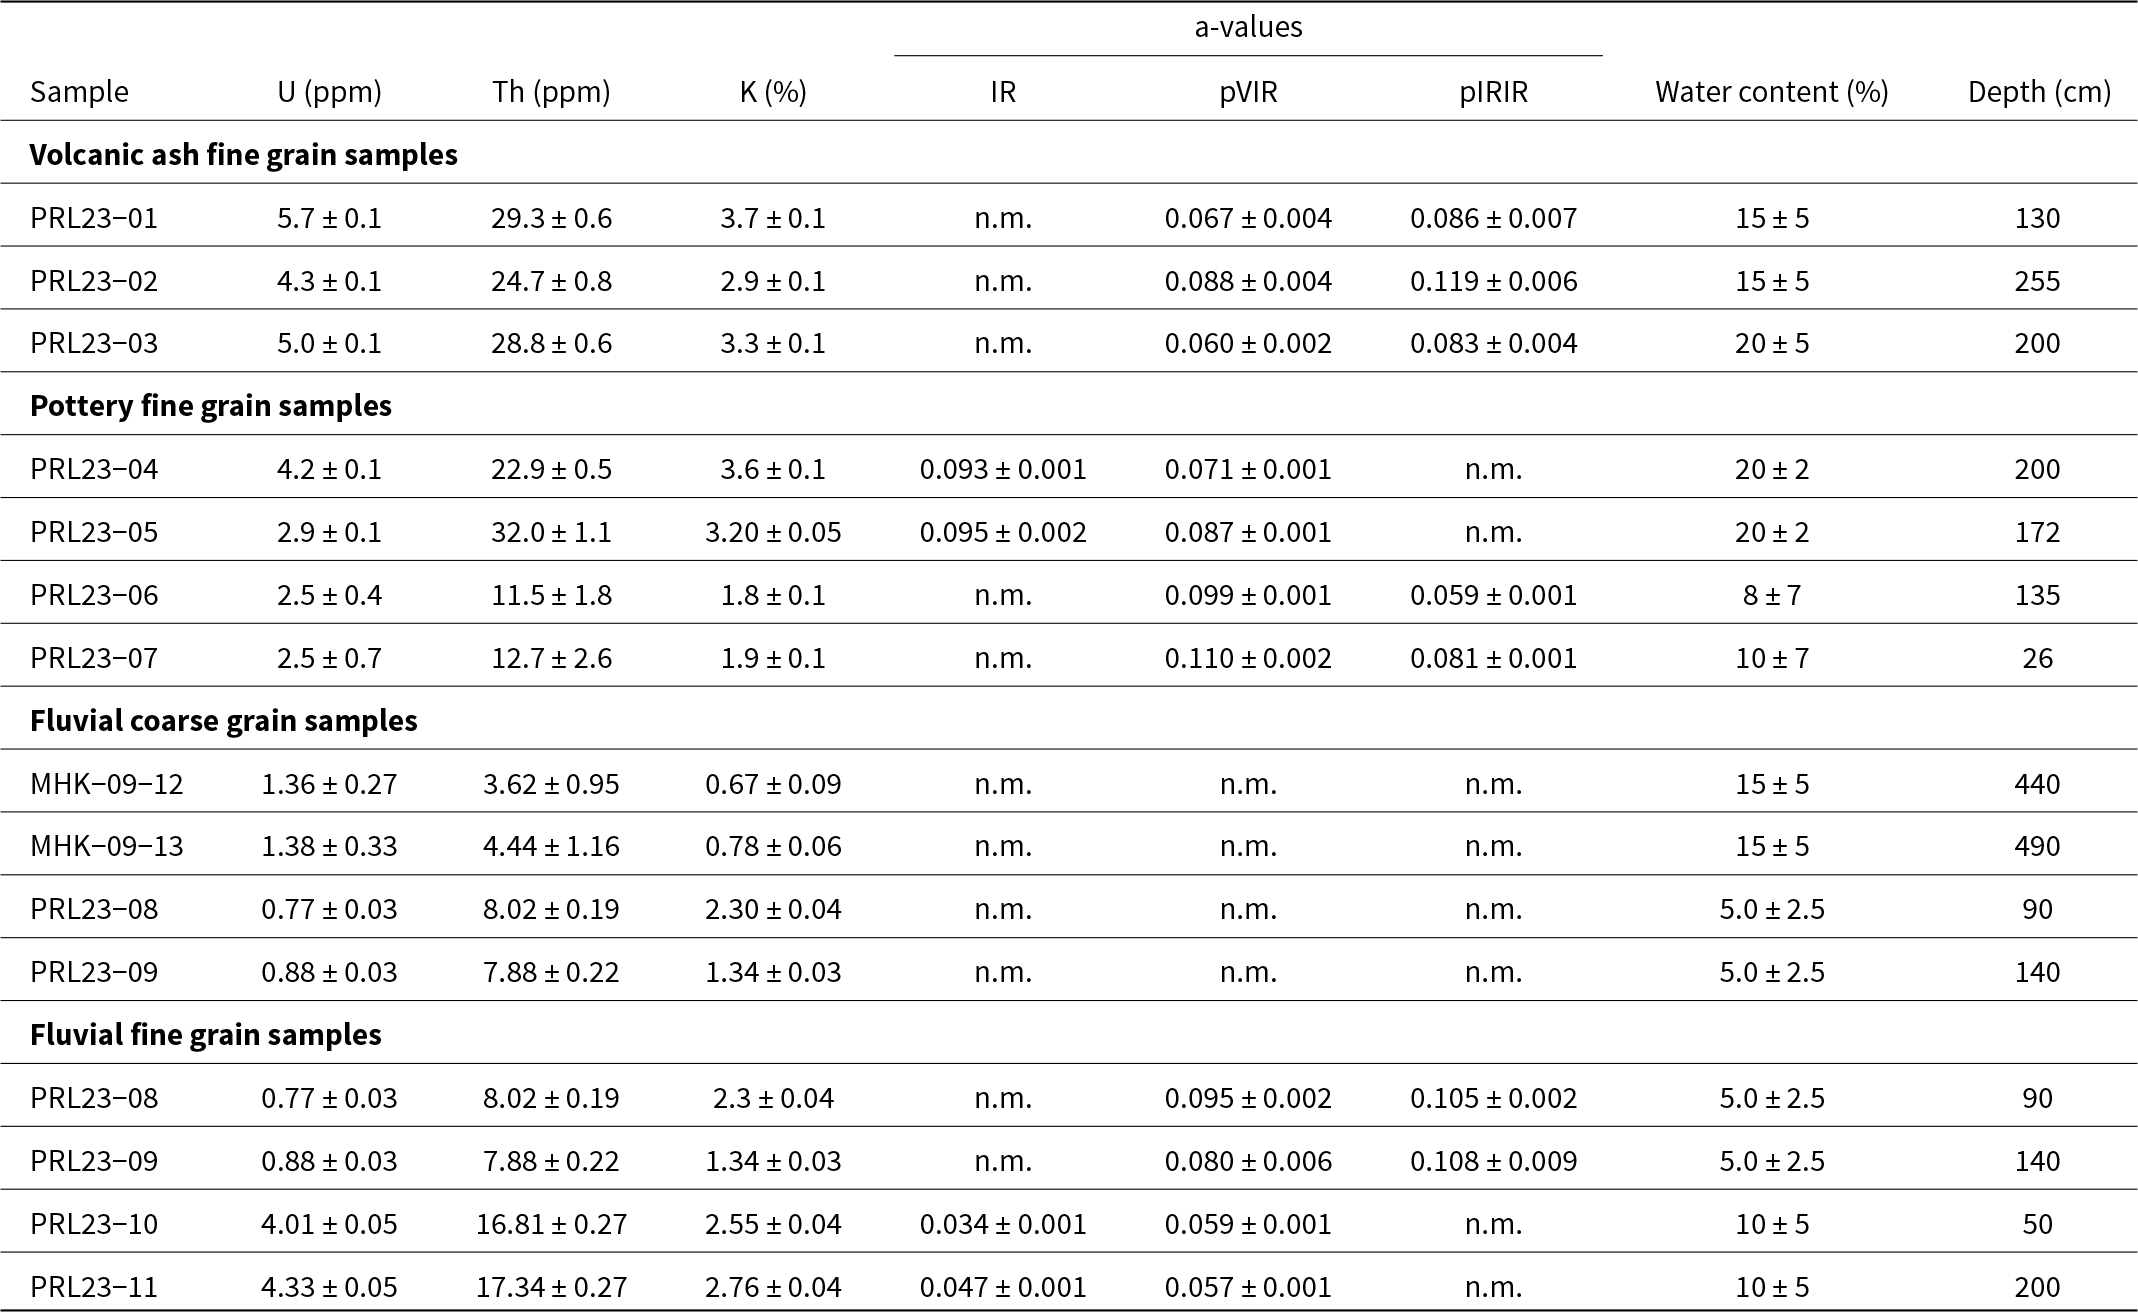
n.m. stands for not measured.
Relation between alpha efficiency and fading rates of (a) pVIRSL, (b) IRSL, and (c) pIRIRSL for all samples. The data points in the rectangle are pottery samples (PRL23-06 and -07) and have higher fading rates possibly because of the presence of sanidine. Here the data only for fine-grain samples are shown. The error bars represent the standard error of the mean.

Annual dose rate
Table 4 provides the data on the concentration of radioactive nuclides, water content and depth of the samples from surface. For the dose rate computation for the polymineral sample, a uniform internal dose rate is considered with the assumption that only feldspar grains provide pVIRSL. Sohbati et al. (Reference Sohbati, Murray, Jain, Thomsen, Hong, Yi and Choi2013) reported that in cases where the range of beta particle exceeds the grain size used (90–150 µm) and the 40K concentration is uniformly distributed in a grain, the dependence of the internal beta dose on the potassium concentration is < 5% and is insignificant. The dose rate contribution for fine grains due to internal 40K is < 1% of the total dose rate, thus providing a minimal contribution to the total dose rate. Therefore, uniform values of internal potassium and rubidium are considered for the dose rate calculations of all polymineral samples. For the PRL23-03 volcanic ash sample, considering the volumetric corrections (Appendix I), the total dose rate is reduced by 0.7 Gy/ka (Table 2). Pottery samples PRL23-06 and -07 were hollow urns and therefore the gamma doses are computed with geometric corrections using the dose rate from pottery and ambient soils (Morthekai, P., personal communication, 2023).
Ages
Fine grains
Fine-grain measurements are carried out on volcanic ash, pottery, and fluvial samples. Table 2 provides the results for pVIR ages and Table 3 provides IR and pIRIR ages. Ages discussed below are corrected for fading wherever applicable.
Volcanic ash
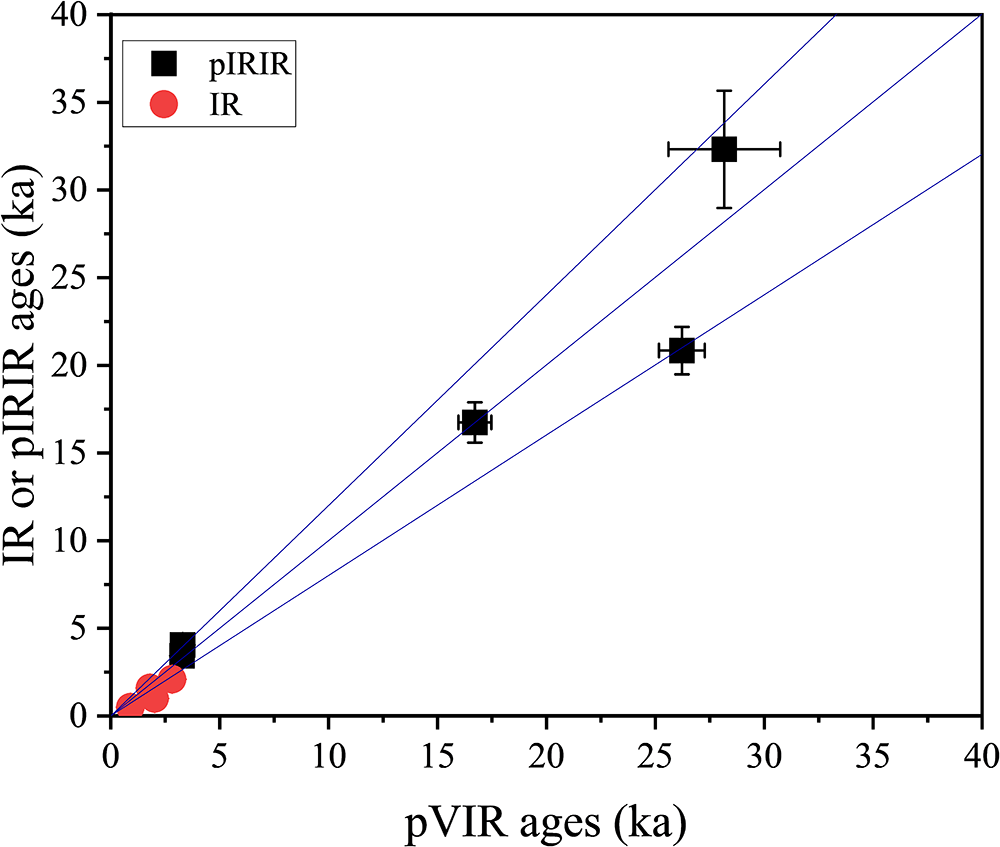
The pVIR ages of volcanic ash samples PRL23-01, -02, and -03 are 17 ± 1 ka, 26 ± 1 ka and 28 ± 3 ka, respectively (Table 2, Figure 6). These are consistent with the pIRIR ages of 17 ± 1 ka, 21 ± 1 ka, and 32 ± 3 ka (Table 3). For PRL23-03, pVIR ages are consistent with sediments above and below the volcanic ash layer, with pIRIR ages of 29 ± 1 and 34 ± 2 ka for, respectively (Anil et al., Reference Anil, Devi, Sukumaran, Lakshmi, Deenadayalan, Kumar and Chauhan2025).
Polymineral fine-grain pVIR ages plotted against the IR and pIRIR ages. Ages were corrected for fading wherever applicable. For young samples, the IRSL signal was used for controlled ages, except for those containing sanidine, while for older samples, the pIRIRSL signal was measured. The error bars represent the standard error of the mean. The blue lines indicate 20% offset in the data.

Pottery samples
The pVIR ages of pottery samples PRL23-04, -05, -06, and -07 are plotted in Figure 6 and shown in Table 2. For PRL23-04, the pVIR age is 1.8 times the IR age. The pVIR age of PRL23-05 is consistent with the IR age within 20% offset. For PRL23-06 and PRL23-07, IRSL at 50°C yielded fading rates > 10% per decade which cannot be corrected using the fading correction age models (Huntley and Lamothe, Reference Huntley and Lamothe2001). Therefore, pIRIR ages are considered as independent ages. The pVIR ages of PRL23-06 and PRL23-07 are 3.3 ± 0.4 ka and 3.3 ± 0.2 ka, and the pIRIR ages are 3.4 ± 0.3 ka and 4.1 ± 0.4 ka, respectively. Fluvial fine-grain samples, PRL23-10 and PRL23-11 returned pVIR age of 2.0 ± 0.1 ka and 2.8 ± 0.1 ka, respectively. The pVIR age of PRL23-10 is approximately twice the IR age, while the pVIR age of PRL23-11 agrees with the IR age within 20% offset.
Coarse grains: fluvial samples
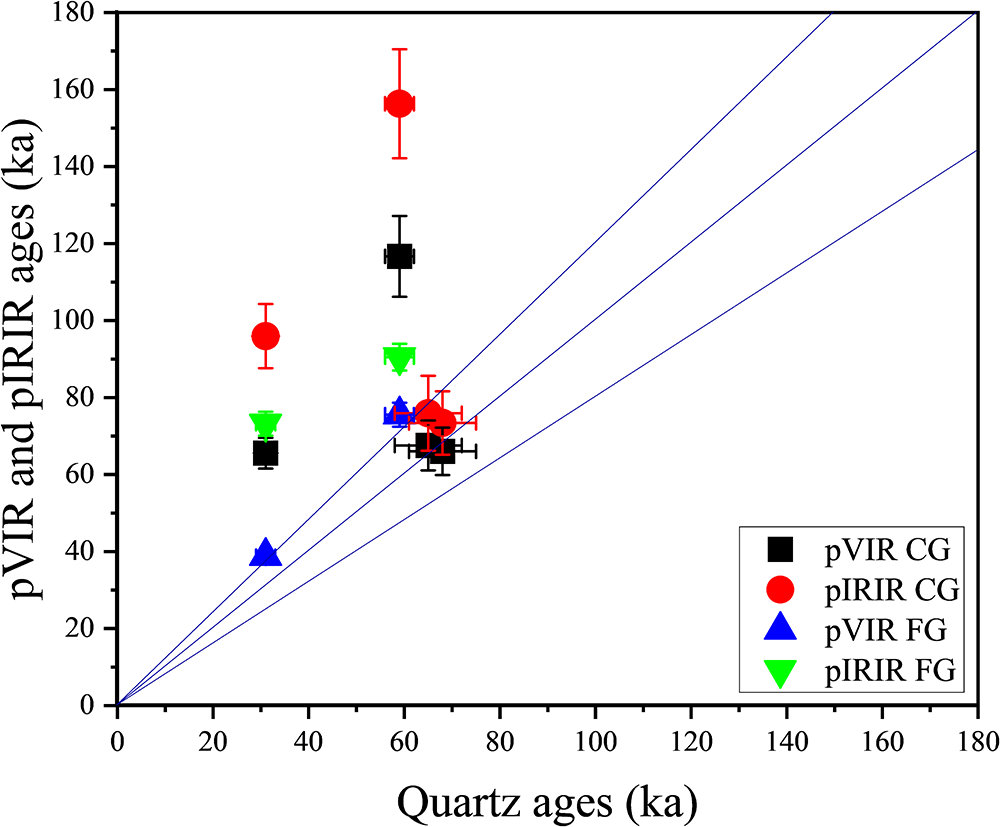
The pVIR and pIRIR ages of four polymineral coarse-grain fluvial samples are measured, of which MHK-09-12 and -13 are consistent with quartz BLSL ages (Mishra et al., Reference Mishra, Chauhan and Singhvi2013) (Table 2 and 3). The pVIR and pIRIR ages of PRL23-08 are 66 ± 4 ka and 96 ± 8 ka and for PRL23-09 are 117 ± 10 ka and 156 ± 14 ka, respectively. The pVIR ages are twice and the pIRIR ages are three times the quartz BLSL ages (Tables 2 and 3; Figure 7). Fuller et al. (Reference Fuller, Wintle and Duller1994) suggested that in fluvial contexts fine grains might be better bleached as compared to coarse grains due to the mode of their transport. Therefore, for PRL23-08 and 09 samples, the ages of fine-grain fractions are estimated. The pVIR fine-grain ages of these samples are 39 ± 1 ka and 73 ± 3 ka and are consistent with quartz BLSL ages of 31 ± 2 ka and 59 ± 3 ka within 20% offset. However, the pIRIR fine-grain ages for these samples are still twice the expected ages (Figure 7).
Comparison of coarse- and fine-grain pVIR and pIRIR ages with the expected quartz ages of fluvial samples. Ages were corrected for fading wherever applicable. The error bars represent the standard error of the mean. CG and FG stand for coarse- and fine-grain fractions. The blue lines indicate 20% offset in the data.

Discussion
This study reports the use of pVIRSL for polymineral fine- and coarse-grain samples for dating without mineral separation. Violet stimulation removes signals from minerals such as quartz, and from the principal trap of feldspar (Figure 1). At the same time, it photo-transfers some charges from deep traps to the principal trap of feldspars. These are then probed through IR stimulation. The pVIRSL signal is a photo-transferred signal originating from the deep traps of feldspars or, in some cases, charges from the principal traps also participate (Devi et al., Reference Devi, Chauhan and Singhvi2024). Therefore, in polymineral samples, the pVIRSL signal primarily arises from feldspars (Figure 1). In feldspars, the IRSL emission of sodium-rich feldspar peaks in the yellow-green emission band and potassium-rich feldspar emission peaks in the violet region of the spectral emission (Krbetschek et al., Reference Krbetschek, Götze, Dietrich and Trautmann1997; Baril and Huntley, Reference Baril and Huntley2003). Sohbati et al. (Reference Sohbati, Murray, Jain, Thomsen, Hong, Yi and Choi2013) suggested that the pIRIR signal of sodium-rich feldspar, in a blue window is due to potassium-rich feldspar as both Na- and K-feldspar co-exist in an exsolution form. However, the significant signal observed in Na-feldspar in our study in the blue window indicates that it also emits in this region (Figure 1). Thomsen et al. (Reference Thomsen, Murray, Jain and Bøtter-Jensen2008b) reported higher athermal fading in Na-feldspar than K-feldspar. The near zero fading in the Na-feldspar sample suggests that pVIRSL probes charges from the stable traps in Na-feldspar, further supporting the athermal stability of pVIRSL in feldspars (Devi et al., Reference Devi, Chauhan and Singhvi2024). Furthermore, lower fading rates for pVIRSL compared to IRSL and pIRIRSL in the majority of the samples indicate that it probes charges from more stable trapped charge centres. The higher pVIRSL fading rates for PRL23-06 and PRL23-07 compared to pIRIRSL could possibly be due to the presence of sanidine (Morthekai, P., personal communication, 2023) as Polymeris et al. (Reference Polymeris, Giannoulatou, Paraskevopoulos, Pagonis and Kitis2022) suggested that sanidine IRSL exhibits higher fading among the three groups of K-feldspar.
A general agreement of pVIR ages for all volcanic, pottery, and fluvial fine grains with other signals suggests the usability of pVIRSL for polymineral samples (Figure 6). For polymineral coarse grains from MHK-09-12 and MHK-09-13, both pVIRSL and pIRIRSL ages are consistent with the quartz BLSL ages (Figure 7). The overestimation of pVIRSL and pIRIRSL ages for PRL23-08 and PRL23-09 samples compared to quartz BLSL ages for the fluvial samples indicates that feldspar grains were not bleached properly. However, the lower overestimation seen in pVIRSL ages compared to pIRIRSL suggests that pVIRSL is more readily bleached (Table 2 and 3). For the same set of samples, the agreement of pVIR fine-grain ages with quartz BLSL ages indicates better bleachability of pVIRSL of fine grains and they have seen a greater amount of daylight exposure compared to coarse grains, which is consistent with Fuller et al. (Reference Fuller, Wintle and Duller1994). These results suggest that the pVIR-SAR protocol for fine grains is effective in addressing the challenges of dating fluvial samples. Furthermore, the lower laboratory residual doses for pVIR-SAR compared to pIRIR-SAR support the greater bleachability of pVIRSL than pIRIRSL. The reason for more efficient bleaching of pVIRSL compared to pIRIRSL needs further exploration. We consider that an important advantage of pVIRSL of fine grains is for samples such as those from Himalaya, where quartz BLSL is not easily measurable on account of its low sensitivity and coarse-grain feldspars show inadequate bleachability in respect of their IRSL.
In computing equivalent doses, we did not subtract laboratory residual doses from the estimated doses as we consider that the SAR protocol subsumes in it the residual correction, and subtracting it again would lead to over correction. Further, the residual doses measured in the laboratory after five hours of exposure under a filtered sunlamp may not actually be representative of the residual dose as it will contain some part from the unbleached component (Sohbati et al., Reference Sohbati, Murray, Buylaert, Ortuno, Cunha and Masana2012; Buylaert et al., Reference Buylaert, Jain, Murray, Thomsen, Thiel and Sohbati2012; Li et al., Reference Li, Jacobs, Roberts and Li2014). Different methods, such as intensity subtraction and using the intercept from the linear correlation between the dose and laboratory residual doses, have been used to calculate the residual dose in nature (Li et al., Reference Li, Roberts and Jacobs2013; Brezeanu et al., Reference Brezeanu, Avram, Micallef, Cinta Pinzaru and Timar-Gabor2021; Avram et al., Reference Avram, Constantin, Hao and Timar-Gabor2022). The residual doses estimated using these methods were much lower than those obtained after five hours of exposure to the sunlamp. It is also supported by the fact that the doses estimated for the surface samples were close to zero (0.09 ± 0.14 Gy; Devi et al., Reference Devi, Chauhan and Singhvi2024). Furthermore, in samples MHK-09-12 and MHK-09-13, the quartz and feldspar ages are concordant even without subtracting the laboratory residual dose, further supporting that the residual doses estimated in the laboratory are higher than those in nature. To provide an appreciation of the effect of subtraction of the residual dose, we also provide the doses and ages with laboratory residual dose subtraction for both the pVIR-SAR and pIRIR-SAR protocols in Table S4. Based on these observations, we suggest that surface samples from the dated site may serve as a reasonable approximation of the natural residual dose. This aspect will be explored further. Variations in a-values between samples and signals reflect differences in defect states. Higher a-values of pIRIRSL than pVIRSL and IRSL suggest a larger density of charge traps responsible for pIRIRSL. However, a reverse trend in the pottery samples suggests that firing possibly reorganises the density of charge traps. This requires further study and exploration.
Conclusions
This study tested the potential of the pVIR-SAR protocol for natural polymineral fine-grain (4–11 µm) and coarse-grain (90–150 µm) samples from various depositional environments and compared pVIR-SAR ages with BLSL-SAR ages from quartz, IR-SAR (T = 50°C) and pIRIR-SAR (T = 290°C) ages from feldspar. pVIRSL showed lower fading than IRSL and pIRIRSL, except in PRL23-06 and PRL23-07, likely due to the presence of sanidine. The dependence of alpha efficiencies on different signals implies that caution is needed when using constant or assumed alpha efficiencies. The pVIR-SAR protocol is a promising tool for dating polymineral fine- and coarse-grain sediments. Its rapid bleaching, reproducibility, low athermal fading rates, and the absence of interference from quartz pVIRSL could permit direct dating without mineral separation. The protocol worked well for volcanic ash, pottery fine grains, and fluvial fine- and coarse-grain polymineral samples. It enabled dating of polymineral fine- and coarse-grain sediments from a few years to ∼68 ka, with ages consistent with geological reasoning and existing controls. Compared to pIRIR-SAR, pVIR-SAR yields ages that agree with quartz ages for fine-grain fractions of fluvial samples used in the study. Overall, the study suggest that pVIR-SAR could be a valuable tool for addressing the dating challenges posed by fluvial samples and may serve as a reliable alternative dating method for precise age determination.
Supplementary material
The supplementary material for this article can be found at https://doi.org/10.1017/qua.2025.10057.
Acknowledgments
The present work was carried out at Physical Research Laboratory, Ahmedabad, India and is supported by the Department of Space, Government of India. The writing and review of this manuscript are funded by the European Research Council Consolidator Grant – PROGRESS (ERC-CoG-101043356). The authors thank Dr P Morthekai (BSIP, Lucknow), Dr Devara Anil (MSU, Baroda), Dr Linto Alappat (Christ College, Kerala), Dr Ravi Kant Prasad (Bihar Remote Sensing Application Centre, BCST, Patna) and Dr S. Sathiyaseelan (Bharathidasan University, Trichirapallai, Tamil Nadu) for the samples and their consent to publish the age data. MD thanks Professor Dr Alida Timar Gabor for constructive suggestions. MD thanks Dr Sebastian Huot for Excel macros for fading rate estimations. AKS thanks DST-SERB for a Year of Science Chair Professorship (Grant SR/S9/YSCP-O3) 2019. The authors thank two anonymous reviewers and the editor for their helpful comments.
Author contributions
Monika Devi: Conceptualisation, methodology, writing (first draft, editing, and reviewing), data curation, and analysis. Malika Singhal: Data curation and analysis. Parth Khanduri: Data curation. Naveen Chauhan: Conceptualisation, supervision, and writing (editing and reviewing). Ashok Kumar Singhvi: Conceptualisation, supervision, and writing (editing and reviewing).
Appendix I
Volumetric correction for heterogeneous sedimentary layers
The PRL23-03 sample has an average thickness of around 30 cm for the ash layer. The underlying and overlying sediment layers have lower radioactive concentrations compared to the ash layer deposit. In this case, the infinite matrix assumption is not valid gamma radiation for the ash layer sample. Therefore, volume corrections for the gamma dose rate are made. The ash layer is approximately 30 cm thick, as illustrated in Figure S5a. A sphere of radius r equal to 30 cm with three layers: two sedimentary (1 and 3) and an ash layer (2) is considered (Figure S5b). The volumetric corrections for the dose deposited by gamma rays in the ash sample is
 \begin{equation}Volum{e_s}*{\text{ }}{\gamma _s} = {\text{ }}Volum{e_1}*{\text{ }}{\gamma _1} + Volum{e_2}*{\text{ }}{\gamma _2} + Volum{e_3}*{\text{ }}{\gamma _3}\end{equation}
Considering the volume of the sphere, hemisphere, and cylinder, Eq. A1 can be written as:
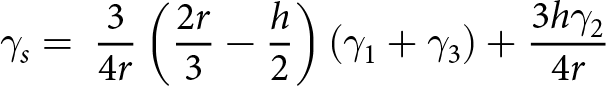 \begin{equation}{\gamma _s} = {\text{ }}\frac{3}{{4r}}\left( {\frac{{2r}}{3} - \frac{h}{2}} \right)\left( {{\gamma _1} + {\gamma _3}} \right) + \frac{{3h{\gamma _2}}}{{4r}}\end{equation}
 where h is the thickness of the ash layer and  $\gamma $ is the dose rate due to gamma radiation.


 Open access