


1. Introduction
The response of a laminar separation bubble (LSB) to the change of the external flow characteristics has been investigated in a number of previous studies, e.g. Marxen & Henningson (Reference Marxen and Henningson2011), Hosseinverdi & Fasel (Reference Hosseinverdi and Fasel2019), Rodríguez, Gennaro & Souza (Reference Rodríguez, Gennaro and Souza2021), Eljack et al. (Reference Eljack, Soria, Elawad and Ohtake2021), Toppings & Yarusevych (Reference Toppings and Yarusevych2022), Jaroslawski et al. (Reference Jaroslawski, Forte, Vermeersch, Moschetta and Gowree2023). At low Reynolds numbers and/or high angles of attack, the bursting process of an LSB may occur, causing an abrupt change of the bubble length due to a small variation in flow parameters. The occurrence of bursting leads to increased drag and reduced lift and consequently impedes the performance of wings and blades in relevant applications (Gaster Reference Gaster1967; Horton Reference Horton1967). From a topological point of view, the bubble switches from a short to a long configuration, e.g. Marxen & Henningson (Reference Marxen and Henningson2011). Short bubbles induce a relatively minor, localized change in the surface pressure, with often acceptable performance penalties. In contrast, long bubbles lead to significant modification of the surface pressure distribution due to their relatively larger separated flow region (Sandham Reference Sandham2008).
From a dynamic point of view, the stability properties of an LSB change significantly between the short and the long states (e.g. Pauley, Moin & Reynolds Reference Pauley, Moin and Reynolds1990; Alam & Sandham Reference Alam and Sandham2000). Convective Kelvin–Helmholtz-type instabilities govern the onset of transition and the subsequent shear layer roll-up in short bubbles (e.g. Hosseinverdi & Fasel Reference Hosseinverdi and Fasel2019). The formation of periodic vortices (Marxen, Lang & Rist Reference Marxen, Lang and Rist2013) and their successive three-dimensional breakdown then leads to the turbulent transition of the detached boundary layer (Marxen et al. Reference Marxen, Lang and Rist2013; Kurelek et al. Reference Kurelek, Tuna, Yarusevych and Kotsonis2021). It has been shown that global modes, for example, Rayleigh- and Görtler-type instabilities, may also cause transition to turbulence in the separated shear layer (e.g. Cherubini et al. Reference Cherubini, Robinet, De Palma and Alizard2010b). Previous studies have shown a notable dependence of LSB stability characteristics on the Reynolds number and the adverse pressure gradient (e.g. Alizard, Cherubini & Robinet Reference Alizard, Cherubini and Robinet2009; Boutilier & Yarusevych Reference Boutilier and Yarusevych2012; Dellacasagrande et al. Reference Dellacasagrande, Barsi, Lengani, Simoni and Verdoya2020), with the frequency of the most unstable harmonic perturbations decreasing as the Reynolds number and/or the pressure gradient increase. Using controlled perturbations in numerical and experimental works of Marxen & Henningson (Reference Marxen and Henningson2011) and Michelis, Yarusevych & Kotsonis (Reference Michelis, Yarusevych and Kotsonis2017), respectively, it has been conjectured that varying levels of free-stream turbulence may lead to mean flow deformation (Marxen & Rist Reference Marxen and Rist2010) and, hence, LSB stability properties, which may induce bubble bursting.
When a long LSB forms over a lifting surface, absolute instability can dominate over the convective Kelvin–Helmholtz one (e.g. Rodríguez et al. Reference Rodríguez, Gennaro and Souza2021), with self-sustained modes driving the growth of fluctuations in the separated flow region (Balzer & Fasel Reference Balzer and Fasel2016; Rodríguez et al. Reference Rodríguez, Gennaro and Souza2021). The occurrence of self-excited instability in LSBs has been documented in previous investigations(e.g. Pauley et al. Reference Pauley, Moin and Reynolds1990; Allen & Riley Reference Allen and Riley1995; Hammond & Redekopp Reference Hammond and Redekopp1998; Rist & Maucher Reference Rist and Maucher2002; Fasel & Postl Reference Fasel and Postl2006; Embacher & Fasel Reference Embacher and Fasel2014). Absolute instability has been shown to give rise to self-excited modes, which cause the formation of spanwise-oriented vortices (Huerre & Monkewitz Reference Huerre and Monkewitz1990), whose breakup leads to turbulent transition. Self-sustained, two-dimensional, low-frequency fluctuations can occur in long LSBs, and their occurrence is accompanied by changes in the geometry of the separated flow region near the reattachment point (e.g. Marquillie & Ehrenstein Reference Marquillie and Ehrenstein2003; Cherubini, Robinet & De Palma Reference Cherubini, Robinet and De Palma2010a). Ehrenstein & Gallaire (Reference Ehrenstein and Gallaire2008) showed that at the onset of global instability vortical structures forming near the reattachment point become almost simultaneously unstable. The aforementioned investigations reveal a strong sensitivity of LSB stability characteristics to external flow properties and the time-mean topology of the separating boundary layer.
The identification of deterministic thresholds for the switch between short and long LSB regimes is of great importance for practical applications, due to the significant changes in lifting surface performance. Since the pioneering work of Gaster (Reference Gaster1967), semiempirical correlations have been reported in the literature for the identification of the bubble state. Gaster (Reference Gaster1967) suggested that the bursting condition may be described by the momentum thickness Reynolds number at separation and a pressure distribution parameter. Diwan, Chetan & Ramesh (Reference Diwan, Chetan and Ramesh2006) and Mitra & Ramesh (Reference Mitra and Ramesh2019) modified Gaster's criterion, introducing the maximum bubble height as a parameter defining the bubble state (see also Serna & Lázaro Reference Serna and Lázaro2015). All of the aforementioned studies provide valuable criteria for the occurrence of the bursting process with reference to several flow configurations. However, the path over which a short bubble bursts into a long one and the effects of the flow parameters on the scaling law of an LSB in either of the two regimes are yet to be investigated.
The present work aims at providing a low-dimensional representation of the statistical response of an LSB to the main influencing parameters via the modal decomposition of a large time-mean data ensemble. Experimental velocity data obtained over a broad parameter space are projected into an optimal state space provided by means of proper orthogonal decomposition (POD). A reduced order is obtained for a dividing streamline commonly used to outline an LSB and is used to demonstrate the existence of a general response of the LSB to changes in the influencing parameters, especially in the short-bubble regime. Furthermore, short and long LSBs can be identified clearly based on their position in the POD state space, thus showing the capability of the proposed method of providing a data-driven classification of the state of an LSB.
2. Experimental apparatus and measuring techniques
All measurements were performed in the wind tunnel installed in the Aerodynamic and Turbomachinery Laboratory at the University of Genova. Laminar separation bubbles were produced on a flat plate with an elliptic leading edge (4 : 1) positioned between two adjustable endwalls (see figure 1). Changing the endwall opening angle allowed varying of the adverse pressure gradient and hence LSB characteristics. The upstream part of the test section has a converging fixed geometry, while the streamwise pressure gradient can be changed over the rear part of the plate. For the present experiments, the opening angle of the diverging section was set to  $9^\circ$ and
  $12^\circ$. The corresponding values of the acceleration parameter defined as
 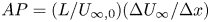 $AP=({L}/{U_{\infty,0}})({\Delta U_\infty }/{\Delta x})$ are
  $-0.27$ and
  $-0.41$. Here,
  ${\Delta U_\infty }/{\Delta x}$ is the average velocity gradient along the rear part of the plate,
  $U_{\infty,0}$ is the free-stream velocity at the channel throat, and
  $L$ is the length of the flat portion of the plate, which is equal to 300 mm. The plate width is also equal to 300 mm producing 2-D time-average flow at mid-span. In order to mitigated trailing edge effects that may influence the evolution of LSBs (e.g. Nakamura, Ohya & Tsuruta Reference Nakamura, Ohya and Tsuruta1991; Pröbsting & Yarusevych Reference Pröbsting and Yarusevych2015), a 100 mm long trailing edge extension was employed (Verdoya et al. Reference Verdoya, Dellacasagrande, Lengani, Simoni and Ubaldi2021). The extension was designed with a diffusing angle of approximately
  $5^\circ$ to avoid geometrically induced boundary-layer separation. All LSBs considered in the present work were formed on the flat portion of the model. Two turbulence-generating grids located 500 mm upstream of the plate leading edge were used to vary the free-stream turbulence intensity level. The employed grids and resulting turbulence intensity levels are detailed in table 1. The
  $Tu$ level was computed as the root mean square of streamwise velocity fluctuations measured via laser Doppler velocimetry at the plate leading edge. Velocity data were acquired at approximately 10 kHz over a sampling period of 120 s. For each combination of the
  $Tu$ level and streamwise pressure gradient, 8 to 11 Reynolds numbers based on the plate length and the inlet free-stream velocity (
 $Re_L$) were tested. The overall test matrix consists of 52 flow cases producing unique LSBs.
Test section and PIV instrumentation layout. Green boxes indicate the PIV measuring domain.

Turbulence-generating grids characterization: free-stream turbulence intensity ( $Tu$), bars width (d), mesh size (M) and porosity parameter
  $P=(1-(d/M))^2$.

Particle image velocimetry (PIV) measurements were performed in a wall-normal plane aligned with the meridional section of the plate (see the green boxes in figure 1). Two cameras with overlapping field of view were used to capture the boundary-layer development from the channel throat to the end of the plate, so as to quantify the evolution of LSBs forming over the plate surface. The PIV system includes a dual-cavity Nd:YAG pulsed laser Litron LDY 300 (energy 30 mJ per pulse at 1000 Hz repetition rate, 527 nm wavelength) and two SpeedSense M340 digital cameras with a cooled  $2560 \times 1600$ pixels CMOS matrix. The magnification factor was set to approximately 0.16. The flow was seeded with Vaseline
 $\circledR$ oil droplets with a mean diameter of
  $1.5\ {\mathrm {\mu }}{\rm m}$. A multigrid algorithm was adopted for the computation of the adaptive cross-correlation of particle images. The final interrogation window of
  $16\times 16$ pixels and 50 % overlap was used. This corresponds to a vector grid spacing of 0.41 mm. A peak validation was used to discriminate between valid and invalid vectors. Based on the work of Sciacchitano et al. (Reference Sciacchitano, Neal, Smith, Warner, Vlachos, Wieneke and Scarano2015), the uncertainty in the instantaneous velocity is estimated to be smaller than 3 % and 6 % of
  $U_0$ in the free-stream and the boundary-layer region, respectively. For each combination of the flow parameters, two sets of 6000 snapshots were acquired at a sampling rate of 1 kHz and 300 Hz for the characterization of LSB dynamics and statistics, respectively.
3. Reynolds number effect on the time-mean shape and vortical structures of LSBs
Figure 2 depicts the time-average streamwise velocity contours for a high- (2a) and a low- $Re_L$ (2b) case at fixed
  $Tu=1.5\,\%$ and
  $AP=-0.41$. Vector maps of the instantaneous fluctuating velocity are also shown. Boundary-layer separation occurs at approximately
  $x/L=0.42$ for both cases. The separation point was estimated via the extension of the zero time-mean velocity line to the wall. At the higher
  $Re_L$, the separated shear layer reattaches to the wall at
  $x/L=0.7$ and a short LSB is formed on the plate surface. The corresponding vector maps show the occurrence of a train of counter-rotating vortices becoming prominent in the aft portion of the LSB (Hosseinverdi & Fasel Reference Hosseinverdi and Fasel2019). Vortical structures form in the high-shear region (see the iso-lines of the time-mean velocity) and grow in the streamwise direction. Farther downstream, the vortex breakup leads to the occurrence of smaller scale structures. For the lower
  $Re_L$ case (figure 2b), the reattachment point moves to
  $x/L=0.95$, and a long bubble forms. The isoline
  $u/U_0=0$ features a milder negative slope within
  $0.75< x/L<0.9$, past the maximum height location, notably lengthening the aft portion of the bubble. While the main shear layer roll-up is still seen in the high-shear region at approximately the maximum bubble height location, vortical structures can also be observed in the reverse-flow region and appear to amplify while they propagate upstream. This is indicative of self-sustained oscillations, as shown in Rodríguez et al. (Reference Rodríguez, Gennaro and Souza2021). The same modification of the topology and dynamics of LSBs described here was observed for all the
  $Tu$ levels and pressure gradients with reducing the Reynolds number, highlighting common features within the same bubble regime.
Contour plots of the normalized streamwise time-mean velocity  $u/U_0$ (
 $U_0$ is the external velocity at the measuring domain inlet). Exemplary vector plots of the fluctuating velocity field are shown for each case with superimposed iso-lines of
  $u/U_e=0$, 0.3, 0.9. (a)
  $Re_L=66\,200$,
  $AP=-0.41$,
  $Tu=1.5\,\%$. (b)
  $Re_L=21\,000$,
  $AP=-0.41$,
  $Tu=1.5\,\%$.

In order to provide an overview of the bubble response to the flow parameter variation, figure 3(a) reports all the dividing streamlines computed from the present data set. The height of the dividing streamline ( $h$) is non-dimensionalized with the plate length, and the origin is set at the separation position (
 $x_{sep}$). Instead, in figure 3(b) the length and height of the LSB are scaled with the distance between the reattachment and the separation positions (
 $x_r-x_{sep}$) showing the height-to-length variation of LSBs. The current data highlight a marked change in bubble dimensions over the investigated parameter space, ranging from relatively thin and short bubbles to separated flow regions extending over most of the test-plate surface (see e.g. figure 2b). To verify the occurrence of short- and long-bubble regimes within the present database, the bursting parameter
  $P_{DCR}=(h^2/\nu) (\Delta U/\Delta X)_{act}$ originally introduced by Diwan et al. (Reference Diwan, Chetan and Ramesh2006) was employed. Here,
  $h$ is the maximum height of the separating streamline of the bubble,
  $\nu$ is the kinematic viscosity and
  $(\Delta U/\Delta X)_{act}$ is the actual velocity gradient between the separation and the reattachment positions. Figure 3(c) reports the
  $P_{DCR}$ for all cases examined, which is plotted vs the maximum height of the recirculating flow region (
 $h_r$). Here,
  $h_r$ is scaled with the local displacement thickness (
 $\delta ^*$). The results show that a significant subset of data
  $P_{DCR}$ falls below the bursting threshold of
  $-28$ proposed by Diwan et al. (Reference Diwan, Chetan and Ramesh2006) to delineate between the short- and long-bubble regimes. It has been also shown in Rist & Maucher (Reference Rist and Maucher1994) that
  $h_r/\delta ^*=0.6$ marks the occurrence of an absolute instability in LSBs, which is typical of the long-bubble regime (Sengupta et al. Reference Sengupta, Sharma, Sengupta and Suman2019). The present results show a progressive increase in
  $h_r/\delta ^*$ with decreasing
  $P_{DCR}$ below the bursting threshold, where
  $h_r/\delta ^*$ eventually exceeds 0.6. The analysis carried out in § 4 is aimed at providing a reduced-order representation of the two-dimensional bubble topology towards a common scaling.
(a) Dividing streamlines scaled with the plate length ( $h/L$) and centred on the separation position for all combinations of
  $Re_L$,
  $AP$ and
  $Tu$ levels; (b) dividing streamlines scaled with the bubble length both on streamwise and wall-normal coordinates; (c) bursting parameter (
 $P_{DCR}$) as a function of the non-dimensional recirculating height of the bubble (
 $h_r/\delta ^*$). The bursting threshold
  $P_{DCR}=-28$ proposed by Diwan et al. (Reference Diwan, Chetan and Ramesh2006) is shown with red dashed line. Long and short bubbles are highlighted with black and blue colour, respectively.

4. POD decomposition of the time-mean data ensemble
The POD (Lumley Reference Lumley1970) was used to decompose a mean flow snapshot matrix, whose columns contain the wall-normal coordinates of the points providing the dividing streamline for all  $Re_L$ values,
  $Tu$ levels and pressure gradients investigated. Consequently, the POD modes capture the variance of the time-mean shape of the bubble through the entire data set, whereas the coefficients incorporate the effects of varying flow parameters. The first three POD modes (
 $\phi$) so derived and the corresponding coefficients (
 $\chi$) are reported in figures 4(a) and 4(b), respectively. These three modes capture approximately 98 % of the overall variance of the data set. A mode convergence analysis was performed to ensure the convergence of modes 1, 2 and 3, and all three modes were observed to reach adequate convergence (
 $\geq$95 %) when only 20 % of the data were considered. It is also mentioned here that the dividing streamlines were sorted in the data matrix based on the corresponding
  $Re_L$ values at fixed pressure gradient and
  $Tu$ levels. This is the cause of the repeating data segment patterns in the POD coefficients seen in figure 4(b). The POD coefficients represent the relative contribution of the corresponding modes to the reconstruction of each individual record of the data ensemble. The first mode depicted in figure 4(a) is representative of the mean dividing streamline of the overall data set. Once combined with the related coefficient, this mode provides the scaling of the bubble height due to the flow parameter variation, with the Reynolds number playing a major role in this sense. Particularly,
  $\chi _1$ exhibits a piece-wise descending behaviour with constant positive sign. It retains the expected bubble size reduction due the increment of the flow Reynolds number:
  $Re_L$ increases from left to right in figure 4(b) for each of the six blocks constituting the overall coefficients. Modes 2 and 3 are instead representative of the deformation of the bubble shape rather than its scaling, with their related coefficients showing the occurrence of stationary points and sign change. More precisely, mode 2 acts to adjust the shape of the ensemble average mode, depending on the sign and magnitude of the corresponding coefficient. The same role is ascribed to mode 3, which exhibits a higher-order wavelength and lower-energy content, following the POD modes ranking.
(a) First three POD modes and (b) corresponding coefficients. The Reynolds number variation is incorporated in each of the six blocks corresponding to a given combination of  $Tu$ level and pressure gradient.

To illustrate the interaction of the leading three modes in defining the time-average shape of the LSB, figure 5 reports the low-rank representation of a subset of dividing streamlines for different Reynolds numbers at a fixed  $Tu$ level and pressure gradient (seven flow cases within the first block depicted in figure 4(b) are shown). In figure 5(a), the original data are reconstructed using the 1st POD mode only. Its utility is clearly linked to the scaling of the bubble height. When the contributions of modes 2 and 3 are added to the reconstructed data (figure 5b,c), a modification of the maximum height position and, especially, of the bubble geometry near the reattachment region can be observed. Particularly, a marked inflection of the green and the violet curves is seen downstream of the maximum bubble height. These curves correspond to the 4th and the 5th points of the first block in figure 4(b), for which
  $\chi _2$ (red curve) shows the maximum values. The same behaviour is observed for all the other combinations of the
  $Tu$ level and pressure gradient, each showing a critical Reynolds number at which the deformation of the time-average shape of the bubble captured by mode 2 is maximum. Based on the
  $P_{DCR}$ parameter reported in figure 3(c), the same
  $Re_L$ values at which the change of the bubble shapes captured by mode 2 occurs was found to be linked to the bursting of the LSB. The present results therefore highlight the link between bubble bursting and characteristic changes of the time-average shape of the bubble.
Low-rank reconstruction of dividing streamlines for different  $Re_L$ values at constant
  $Tu$ level and pressure gradient. Mean flow data are reconstructed using mode 1 (
 $\phi ^1$, a), modes 1 and 2 (
 $\phi ^{1-2}$, b) and modes 1 to 3 (
 $\phi ^{1-3}$, c).

5. Description of the response of an LSB in the POD space
As discussed in § 4, the  $i{\rm th}$ element of a given POD coefficient provides the contribution of the corresponding mode to the
  $i{\rm th}$ flow case. In the POD subspace constituted by the first three leading modes (figure 4a), the
  $i{\rm th}$ dividing streamline is therefore represented by the triplet of coordinates
  $\chi _1(i),\chi _2(i),\chi _3(i)$, which are obtained by projection. Since the first three POD modes capture the modification of the bubble shape due to Reynolds number,
  $Tu$ level, and pressure gradient variation, they can be used to define a low-order state space describing the response of an LSB shape to changes in the main influencing parameters. Data projection on the present POD space is also expected to increase the capability of detecting the modification of the statistical response of the bubble between the short and the long regimes.
In the present work, the projection of the current data was considered together with experimental results previously reported in the literature: Simoni et al. (Reference Simoni, Lengani, Dellacasagrande, Kubacki and Dick2019), Simoni et al. (Reference Simoni, Lengani, Ubaldi, Zunino and Dellacasagrande2017), Istvan & Yarusevych (Reference Istvan and Yarusevych2018), Toppings & Yarusevych (Reference Toppings and Yarusevych2022) and Aniffa et al. (Reference Aniffa, Caesar, Dabaria and Mandal2023). These studies describe LSBs forming over flat plates and airfoils under different  $Tu$ levels, pressure gradients and angles of attack. In order to make the current and literature data comparable, the 1-D vectors containing the wall-normal coordinates of the dividing streamlines were normalized with their corresponding
  $L_2$ norm (
 $||{\cdot }||_2$). Here
  $L_2$-normalization eliminates the bias due to considering different geometrical parameters for the scaling of an LSB, i.e. plate length or airfoil chord. Figure 6 shows the acquired dividing streamlines (continuous lines) together with literature data (dash-dotted lines) with unitary norm. Data are plotted against the normalized length of the recirculating region highlighting the variation of the shape of the LSBs within the present enlarged database. Regardless of the curve scatter observed in figure 6, the projection of all data on the POD space computed from the current database showed the existence of an underlying principal response of an LSB to changes in the influencing parameters.
Non-dimensionalized dividing streamlines taken from the current ( $-$) and selected literature (
 ${\cdot } -$) data.

Figure 7(a) shows the POD modes adopted for projection that are computed from the current dividing streamlines with unitary  $L_2$ norm. Note that the shape of POD modes and their role in reconstructing the LSB shape with
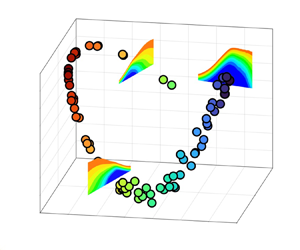
  $L_2$-normalization are the same as those obtained using global geometric scaling in figures 4 and 5. Figure 7(b) shows a 3-D plot of the first three POD coefficients obtained from projection of the present database and experimental results previously reported in the literature. These latter pertain to different combinations of governing parameters and have not been used to construct the present POD space, which qualifies them as validation sets. It should be stressed that the coefficients reported in figure 7(b) are obtained by projection of
  $L_2$-normalized data and are consequently distinct from those reported in figure 4(b). The results show that all data fall on a well-defined path once projected into the present POD state space (figure 7b), with the Reynolds number governing the bubble response. Data acquired for different
  $Tu$ levels, pressure gradients and surface geometries collapse well with higher scatter observed near the minimum value of
  $\chi _3$ (see figure 7c–e). The present results therefore indicate the existence of a general response of the time-mean shape of LSBs to the variation of the main influencing parameters that is captured by the leading POD modes. Based on the
  $P_{DCR}$ parameter, short and long bubbles are indicated in figure 7(e) with blue and black colour, respectively. The results demonstrate that the region in the current state space characterized by
  $\chi _2<0$ pertains to long LSBs, thus the second POD coefficient can be employed for the data-driven classification of the bubble regime. It is stressed that the classification of the bubble state should be performed considering the POD modes obtained by the current entire database, which was seen to retain flow features of both short- and long-bubble configurations. Results from other studies, which pertain to short LSBs, lie on the same trajectory as described by the currently acquired short LSBs. Since the first three POD coefficients were shown to capture the change in the bubble length and height due to the variation of flow parameters, the abrupt change of the trajectory defined by the leading coefficients near the minimum value of
  $\chi _3$ is representative of a substantial change in the scaling law of an LSB when
  $Re_L$ decreases below a bursting threshold. The notably lower data scatter in the short regime indicates that a well-defined correlation may exist between the change of the bubble height (governed by mode 1, figure 4a) and length (governed by modes 2 and 3, figure 4a). On the other hand, higher data dispersion observed for the long state reflects an increased sensitivity of long-bubble shape to the modification of flow properties, such as the
  $Tu$ level and the pressure gradient.
(a) The POD modes of normalized dividing streamlines; (b) 3-D plot of POD coefficients  $\chi _1$,
  $\chi _2$,
  $\chi _3$, current data set, (
 $\circ$); Simoni et al. (Reference Simoni, Lengani, Dellacasagrande, Kubacki and Dick2019), (
 ${\bf +}$); Simoni et al. (Reference Simoni, Lengani, Ubaldi, Zunino and Dellacasagrande2017), (
 $\ast$); Istvan & Yarusevych (Reference Istvan and Yarusevych2018) and Toppings & Yarusevych (Reference Toppings and Yarusevych2022), (
 $\triangle$); and Aniffa et al. (Reference Aniffa, Caesar, Dabaria and Mandal2023), (
 $\ast $); (c) 2-D plot of
  $\chi _1$-
 $\chi _2$ coefficients; (d) 2-D plot of
  $\chi _1$-
 $\chi _3$ coefficients; (e) 2-D plot of
  $\chi _2$-
 $\chi _3$ coefficients (long and short bubbles are highlighted with black and blue colour, respectively).

For the sake of completeness, figure 8 shows the influence of  $Re_L$ on the first three POD coefficients at fixed AP and
  $Tu$ level. The trajectory defined by each POD coefficient is traversed in a smooth manner when changing the flow parameters. Also, expected trends are observed based on the known physical response of LSBs to changes in the flow parameters. The value of
  $Re_L$ at which
  $\chi _2$ becomes negative reduces when increasing the
  $Tu$ level and/or decreasing the magnitude of the adverse pressure gradient. Higher levels of free-stream turbulence promote the shear-layer transition, thus shortening the length of an LSB. Similarly, reducing the adverse pressure gradient magnitude results in a thinner separated flow region. In both cases, LSB bursting is delayed to lower
  $Re_L$.
Influence of  $Re_L$ on the projection coefficients (a)
  $\chi _1$, (b)
  $\chi _2$ and (c)
  $\chi _3$ for the different AP and
  $Tu$ levels. For the colour legend refer to figure 7(b).

6. Conclusions
The present work presents a data-driven analysis of the response of a flat-plate LSB to changes in the influencing parameters. The Reynolds number,  $Tu$ level and pressure gradient were changed to produce short and long LSBs. The POD was applied to the data matrix constituted by the wall-normal coordinates of all dividing streamlines. The leading three POD modes were shown to capture the essential bubble geometry within the current database. The projection of data from the current and prior investigations into the state space constituted by the leading three modes revealed the existence of a low-order response of the normalized time-mean structure of an LSB to changes in the flow parameter, which was expressed in terms of modification of the separating streamline of the bubble. It was found that flat plate and airfoil LSBs that were not used for the computation of the modes collapse onto the trajectory defined by the present POD coefficients. The high collapse of data concerning short LSBs indicate a marked correlation between the change in the bubble maximum height and length captured by the current POD modes. Contrarily, the increased data dispersion in the long regime suggests that long bubbles are more sensitive to the variation of the external flow disturbances and the pressure gradient. It was shown that the POD space derived from the current set of measurements can be adopted for the unsupervised clustering of short and long LSBs.
Declaration of interests
The authors report no conflict of interest.


 Open access