


Water is an essential nutrient and a key molecule for cellular homoeostasis, metabolic processes, circulatory function and temperature regulation. Water makes up the largest body component and maintaining an optimal hydration level is fundamental for good health. Compared with children and adults, infants have a higher total water content of the body. From birth to 3 months of age, total body water volume decreases gradually from 73·3 to 56·5 % of body weight in boys and 73·2 to 55·6 % in girls; after that, it is relatively stable (P = 0·001)(Reference Fomon, Haschke and Ziegler1–5). Infants have higher losses than older children or adults due to a higher surface area to body mass ratio(Reference Fusch and Jochum3–Reference Manz6) and initially to a limited renal concentrating ability(Reference Fomon and Ziegler7–Reference Poláček, Vocel and Neugebauerová9). Daily water turnover, meaning the replacement of body water that is lost in a day, decreases from 160 ml/kg (1–3 months) to 100 ml/kg (10–12 months), 65 ml/kg (3 years) and 40 ml/kg at 15 years of age(Reference Fusch, Hungerland and Scharrer2). Some water is also required for growth, and a growth rate of 15 g/kg per d results in a net storage of about 12 ml water(Reference Fusch and Jochum3).
Given that infants and young children are particularly susceptible to diarrhoea and vomiting and less heat tolerant, they have a more likely tendency for dehydration(Reference Kenny, Wilson and Flouris10,Reference Vega and Avva11) . Moreover, they have difficulties expressing thirst, or their need for fluids (mainly water) and are dependent upon others to provide fluids.
Maintaining optimal hydration is a public health issue, especially in infants and young children, whose total water intake (TWI) per unit of body weight is about three times higher than that of adults(Reference Manz6). In addition, some studies have pointed out several deleterious health outcomes related to low water intake, even in cases of mild dehydration (< 2 %)(Reference Popkin, D’Anci and Rosenberg12–Reference Liska, Mah and Brisbois14). Despite this, water is often forgotten in daily dietary recommendations and some guidelines and nutrition surveys.
Total available water includes TWI and endogenous production coming from the oxidation of energy substrates (roughly 300 ml/d in adults) that would account for about 12 % of total water(5,Reference Sichert-Hellert, Kersting and Manz15,16) . However, metabolic water production depends on the nature and structure of the substrates and is proportional to energy expenditure. Therefore, its accurate assessment would require sophisticated research methods. Due to the impossibility to determine an average requirement, adequate intake (AI) levels for TWI have been established by national and international health authorities, especially the WHO, the Institute of Medicine and the European Food Safety Authority (EFSA)(5,16–Reference Grandjean18) . But accurate data on water intake in non-breastfed children are needed to set dietary reference values and inform researchers, parents, child careers and policymakers. Unfortunately, to date, children, especially the youngest ones, have been subject to little study, which, very often, has been related only to fluid consumption (milk and dairy products, plain water, other beverages and soups) or to drinking water (DW) only(Reference Sichert-Hellert, Kersting and Manz15,Reference Kant and Graubard19–Reference Vieux, Maillot and Rehm42) . Using data from the Nutri-Bébé 2013 study(Reference Chouraqui, Tavoularis and Emery43), we aimed to report TWI and to analyse the different contributors to these intakes in French infants and young children (0–3 years) and to compare the observed intakes to the AI set by the EFSA(5,Reference Grandjean18) . The secondary aim of the present study was to describe fluid consumption patterns with the respective percentage of consumers and their drinking occasions.
Subjects and methods
Study design and participants
Secondary analysis was conducted on data collected in the Nutri-Bébé survey, an observational, cross-sectional study. Data collection was from January to April 2013 by the TNS SOFRES, an official opinion, and market research institute, which fulfils the following standard requirements: ESOMAR professional code of conduct and standards; ISO 20252:2012 international standard for market, opinion and social research; and the French data protection act (Loi ‘Informatique et Libertés’), ensuring that respondents’ personal identity is withheld. Moreover, TNS SOFRES appointed a data protection officer, the ‘Correspondant Informatique et Libertés’, who is the point of contact with the ‘Commission Nationale de l’Informatique et des Libertés’, the French data protection authority. Repeating TNS SOFRES is thus exempted, of the notification process to the Commission Nationale de l’Informatique et des Libertés as far as the data processing for which it is the data controller are concerned. The guidelines laid down in the Declaration of Helsinki (https://www.wma.net/wp-content/uploads/2018/07/DoH-Oct2008.pdf) were strictly followed by observing all the principles that may apply to an observational survey including registration, informed consent, absence of health risk, information about sponsors and potential conflicts of interests. Principle number 15, that is, submission to an ethics committee, was not required according to the French legislation, since the survey did not involve invasive procedures or therapeutic intervention. Full details of the survey methodology have been described in a separate paper(Reference Chouraqui, Tavoularis and Emery43) not involving fluid intakes.
In short, the survey recruited parents of children aged 15 d to 35 months, using a precise quota method weighed for the different regions of mainland France, town size, habitat, socio-economic characteristics, age and sex of the child. After offering a fully informed description of the survey, parents were asked for their consent to participate without any monetary incentive. To be included, children must have been born at term, have had a birth weight above 2·5 kg and should have been free from intercurrent or chronic diseases. A total of 1184 children were enrolled in the study, of whom 149 were fully or partially breastfed, that is, received infant formula in addition to breast milk, during the survey (online Supplementary Fig. S1)(Reference Chouraqui, Tavoularis and Emery43). Due to the inability to assess the volume of mother’s milk suckled, only the food and fluid consumption data from non-breastfed children were considered further. Participating children were stratified by age according to the key stages of child development and feeding patterns, as carried out previously in Nutri-Bébé surveys(Reference Chouraqui, Tavoularis and Emery43–Reference Chouraqui, Tavoularis and Turck45). The age group cut-off points were: 0·5–3, 4, 5, 6, 7, 8–9, 10–11, 12–17, 18–23, 24–29 and 30–35 months. Each age group was defined by the first day of the starting month and the last day of the ending month.
The children’s parents and/or caregivers were given a diary, a 1-l measuring jug, a photographic tool kit, kitchen measuring tools and scales to assess their child’s food consumption. A trained investigator explained to parents and/or caregivers the use of these different tools and how to report the data. Subsequently, the parents and/or caregivers were asked to describe in a 3-d food diary the nature and the amounts of food and fluids the child consumed over a non-consecutive 3-d period, including one weekend day. They had to report in the diary the quantity (in g, ml or dose) served and what remained after consumption, as well as the ingredients of the food or drink. The intake occasions were noted and classified as follows: breakfast, morning snack, lunch, afternoon snack, dinner, at bedtime and during the night. These recordings over 3 d took place in between two face-to-face interviews with the TNS SOFRES investigators: the first to explain the procedure and the second to review the diary, check for completeness, clarify details and weigh the child (with just a clean diaper or underwear), using a Tefal Premiss PP1000VO scale with an accuracy of 100 g. Weights were compared with the WHO growth standard curves, leading to thirty-seven data points being considered unreliable because they deviated from the mean standard value by more than three Z-scores(Reference Chouraqui, Tavoularis and Emery43,46) . They were therefore not included in the calculation of the weight-based intake. Height was not measured, and consequently, the BMI could not be calculated. Both interviews were recorded using CAPI® software (Computer Assisted Personal Interviews). All data were recorded to maintain anonymity.
Water intake assessment
Secondary analysis of the intakes was performed by the non-profit government organisation Centre de Recherche pour l’Etude et l’Observation des Conditions de Vie – Research Center for the Study and Observation of Living Conditions. They assessed TWI by examining water intakes provided by DW and by all other fluids, including milk that, according to age, were given as infant formula (so-called starter formula), follow-on formula, young child formula (so-called growing-up milk), cows’ milk and other beverages and moisture in food which were categorised as depicted in online Supplementary Table S1. Besides tap water, bottled water was distinguished into mineral water and spring water, as defined by the European Parliament and the Food and Drug Administration(47,48) . The water contents of common beverages and of common foods were established using the Centre d’Information sur la Qualité des Aliments 2013 database developed by the Agence Nationale de Sécurité Sanitaire de l’Alimentation, de l’Environnement et du Travail(49). For baby foods, specific for infants and young children as defined by the Commission Directive of the European Communities 2006/125/EC of 5 December 2006, the water content was calculated based on the average composition of the foodstuffs composing the product described in the Centre d’Information sur la Qualité des Aliments table. Overall, 50 493 foods or fluids consumption entries were identified.
Analysis of fluids and food consumption data
Previously published results(Reference Chouraqui, Tavoularis and Emery43–Reference Chouraqui, Tavoularis and Turck45) on population characteristics and energy and protein intakes are presented as means and standard deviation. Water intakes are expressed as median with interquartile range (Q1–Q3), range and mean values and standard deviations. Sources of water intake are described as mean percentage of contribution. In each age group, the fluid and food consumption values were calculated from the mean of each individual’s contributions on the first, second and third day of the survey related to the size of the age group(Reference Chouraqui, Tavoularis and Emery43). In the absence of average requirements determinations by official authorities, daily TWI was compared with the lowest values of AI set by the EFSA as they were the most recent and almost identical to those set by WHO and by Institute of Medicine (Table 1)(5,16–Reference Grandjean18) . Only the EFSA established AI related to body weight, and this only for infants younger than 7 months(5). For infants in the first year, the EFSA AI was based on the average observed water intake from human milk in exclusively breastfed infants (100–190 ml/kg body weight per day). AI was derived from average observed intakes of human milk and typical complimentary food and beverages for older infants. For the second year of life, an adequate TWI of 1100–1200 ml/d is defined by interpolation, as intake data were not available until now. For the third year of life, AI was estimated from the reported average intakes to be 1300 ml/d for boys and girls.
Adequate intakes for total water set for boys and girls together by the WHO(16), the Institute of Medicine (IOM)(17) and the European Food Safety Authority (EFSA)(5,Reference Grandjean18)

SAS 9.2 software was used for statistical analyses (SAS Institute, Inc. http://support.sas.com/documentation/installcenter/922/). Differences in intake between sexes were tested in each age group with ANOVA. The two-sided type I error was set at 5 % for all the statistical tests.
Results
The final sample for the current analysis consisted of 1035 non-breastfed children.
The population characteristics(Reference Chouraqui, Tavoularis and Emery43), including the sex distribution and the mean body weight at the time of the survey, and the daily energy, protein and Na intakes(Reference Chouraqui, Tavoularis and Simeoni44,Reference Chouraqui, Tavoularis and Turck45) are shown in Table 2. The mean age of mothers was 30·8 (sd 5·4) years. Among mothers, 38 % were primiparous, 60 % were working and 11 % lived without a partner. The mean number of people in the household was 4·1 (sd 1·3). The mean birth weight of children was 3·33 (sd 0·48) kg. The detailed distribution of weight by sex and age has been reported already(Reference Chouraqui, Tavoularis and Emery43). Overall 88 % of children had a body weight between the 3rd and the 97th percentile of the WHO growth standards(46).
Population characteristics and reported daily dietary intakes of energy, protein and Na (n 1035)(Reference Chouraqui, Tavoularis and Emery43–Reference Chouraqui, Tavoularis and Turck45). Body weights are given as mean values and standard deviations. Intakes are given as median values with interquartile range (Q1–Q3) and compared with the highest values of the corresponding EFSA dietary references (DRV)

* According to age, boys were on average slightly heavier than girls (NS).
† Average requirements.
‡ Population reference intake.
§ Adequate intake.
Total water intake
Daily total water intake
Median (25th, 75th percentile, range) daily TWI are depicted in Fig. 1, showing a median intake increasing slightly with age from 732 to 990 ml/d in the 10–11 months aged group and then being relatively stable. The mean TWI increased with age from 753 (sd 113) ml/d in the first age group to 1007 (sd 208) ml/d in the 10–11 months old infants. After that, it remained relatively stable to be at 1083 (sd 444) ml/d in the oldest group. The mean and median TWI of children over 1 year old were below the EFSA AI (online Supplementary Table S2). Of note are the important inter-individual variations within each age group.
Total daily water intake by age group (n 1035) in relation to the EFSA AI (-----)(5,Reference Grandjean18) . The boxes represent interquartile ranges (25th and 75th percentiles); the central lines inside the box are the medians; the whiskers represent ranges (minimum and maximum value).

Daily TWI tended to be higher in boys except for the 30–35 months group. This difference in favour of boys is however only significant in three age groups (5-month-old infants, +96 ml, P = 0·002; 6-month infants, +70 ml, P = 0·049; 18–23-month-old group, +132 ml, P = 0·01). The percentages of children who, according to age, did not achieve the lowest EFSA AI are given in Table 3. They were more than 20 % after 6 months of age, about 50 % in the second year of life and more than 80 % in the third year.

Total water intake per body weight
Overall TWI per body weight decreased with age, while inter-individual variability increased (Table 4). Compared with the AI set by EFSA(5), only about 10 % of infants aged 4–5 months and 25 % of the 6 months aged infants had a TWI/kg body weight below the proposed lowest limit (100 ml/kg per d). However, from 7 to 11 months, more than 25 % of infants had intakes below this limit, while there were more than 50 % in the 12–23 months aged group and more than 75 % in the 24–35 months aged groups.
Daily total water intake per body weight (ml/kg/d) and per age group (n 998), expressed as median, Q1 (25th percentile), Q3 (75th percentile) and mean values and standard deviations

Total water intake per energy intake
Total energy intake and energy intake per kg of body weight have been assessed previously and are given in Table 2 (Reference Chouraqui, Tavoularis and Simeoni44). The distribution of the observed water-to-energy ratio is depicted in Fig. 2. Overall, the median and mean ratio values were above 1, but they fell far short of EFSA AI, especially in infants as 90 % of them, and about 75 % of the toddlers, had a ratio below the AI (Table 1)(5).
Water-to-energy ratio (ml/kcal) distribution according to age (n 1035) in relation to the EFSA AI (-----)(5). The boxes represent interquartile ranges (25th and 75th percentiles); the central lines inside the box are the medians; the whiskers represent ranges (minimum and maximum value).

Contributors to the total water intake
Contribution of each food group
The average contribution of each food group to TWI is a percentage in Fig. 3 and a mean quantitative value in online Supplementary Table S3. In general, the share of each fluid or food category to the TWI showed significant variability in each age group. Overall, fluid intake, including DW, all milk products, other beverages and soup, accounted for 76·8 % of TWI at 6 months, 66·8 % at the end of the first year of life, 72·4 % during the second year and 73·7 % during the third year of life with significant inter-individual variability. For the same groups, food moisture accounted for 23·2, 33·2, 27·6 and 26·3 %. Detailed analysis of TWI by age group and food or fluid category showed that milk, including infant formula, follow-on formula and young child formula, and dairy products were the primary water intake source whatever the age (Fig. 3). The mean contribution of these milk products to TWI decreased from more than 97% of TWI in the 0·5–3 months age group to 71% at 6 months, 54·6 % in the 10–11 months age group, 46·1 % in the 18–23 months age group and 35·4 % in the 30–35 months age group. Overall, milk and dairy products were consumed by all the children with a change of type depending on age. DW accounted for more than 5 % of TWI after 8 months to reach a share of just above 25 % in the 30–35 months age group. From the age of 6 months, vegetable and fruit intake shared a significant part of the water intake, around 20 %, since almost 100 % of children consumed them. Fruit or vegetable juices were consumed by 2–3 % of infants younger than 4 months, 7–10 % of those aged between 4 and 6 months, 14–17 % of the 7–11 months group, about 30 % of the second year group and above 50 % of the 24–35 months old children. Up to 10 months, no infant consumed more than 90 ml of juices per day; after that, they were few to consume more than 90 ml or even more than 120 ml. Older than 18 months, approximately 5% consumed more than 120 ml of juice per day. Up to 1 year of age, the consumption of sugar-sweetened beverage (SSB) was in isolated cases only. Less than 15 % of children 12–23 months old and less than 30% of children 24–35 months old consumed SSB. Up to 18 months, no children consumed more than 90 ml of SSB per day; they were 5 % after that and 10 % after 2 years. On average, fruit and vegetable juices plus SSB accounted for less than 2 % of TWI before 18 months and 7 % of TWI at 30–35 months. Their respective median intake was then 20·0 ml/d (Q1–Q3:0·0–73·8) for fruit and vegetable juices and 0·0 ml/d (Q1–Q3:0·0–0·0) for SSB.
Average contribution of each source (%) to total water intake (n 1035). Values in labels have been rounded to the nearest whole number. ![]() , miscellaneous;
, miscellaneous; ![]() , starch products;
, starch products; ![]() , industrial ready meals;
, industrial ready meals; ![]() , meat, fish and eggs;
, meat, fish and eggs; ![]() , vegetables and fruits;
, vegetables and fruits; ![]() , soup;
, soup; ![]() , soda and sweet beverages;
, soda and sweet beverages; ![]() , fruit juices;
, fruit juices; ![]() , dairy products;
, dairy products; ![]() , cow’s milk;
, cow’s milk; ![]() , formula;
, formula; ![]() , drinking water.
, drinking water.

Water used for the reconstitution of formula or as a beverage
The amount of water used to reconstitute (infant formula, follow-on formula, young child formula) was reported as formula intake. Whatever the age, tap water was very rarely (less than 3 % of occasions) used to reconstitute formula. Parents would alternately and substantially use both types of bottled water equivalently during the 3 d of recording.
Intake of DW increased with age with an extreme dispersion of the results. However, the dispersion decreased, with age, given that the quartile coefficient of dispersion decreased from 1 to 0·42 from 6 months onwards (online Supplementary Table S4).
The proportion of children who reported DW increased with age from very few infants in early life to 90–100 % of children after 8 months. Less than 5 % of the infants younger than 8 months drank tap water; the children who drank bottled water were divided almost equally between mineral water drinkers and those drinking spring water. Most children of 8 months and more (90–100 %) drank water, with an increasing proportion of them, up to 58 % for the older group, who drank tap water.
Fluid intake occasions
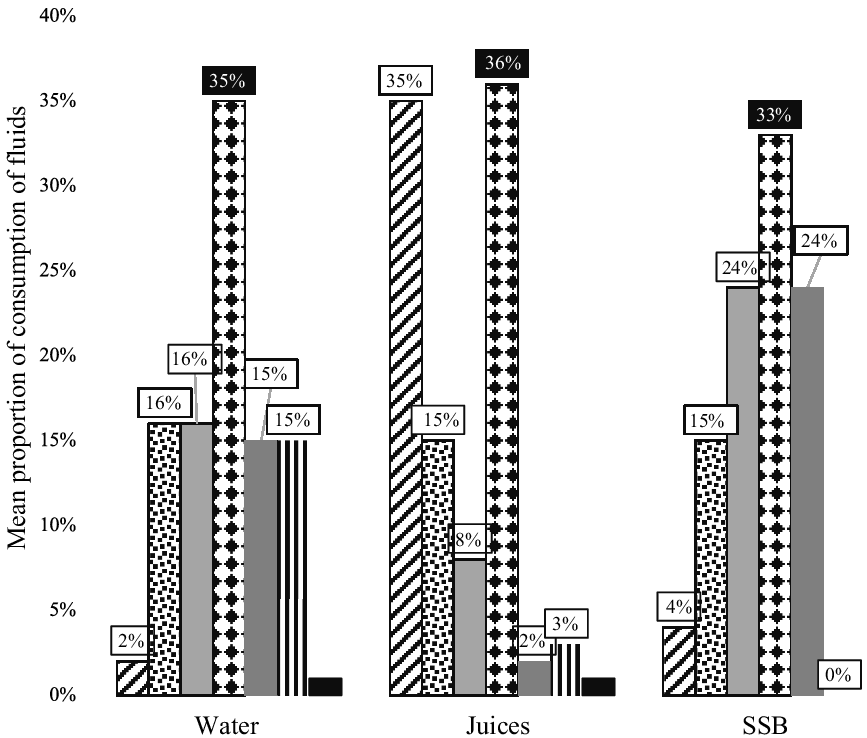
The pattern of fluid consumption was very variable in types of beverages and timing during the day. Overall, most DW (30–60 %) was consumed during the afternoon snack. The lowest volume of DW was consumed at breakfast or during the night. Lunch and dinner were associated with less than 20 % of DW consumed and at bedtime. The peak occasion for consuming soup was at lunch before 6 months, followed by dinner and the inverse after 6 months. Most fruit or vegetable juices were consumed first with afternoon snacks at all ages, then with the morning snack or lunch in infants younger than 9 months, and breakfast or morning snacks in older children. They were very rarely drunk with dinner and never later. The consumption habits of SSB were the most disparate during the day, consumed in the afternoon or during main meals but never at bedtime or during the night. Figure 4 provides a visual representation of the consumption patterns in the 30–35 months age group of children with the biggest drinkers.
Mean proportion over 3 d recording of consumption of plain water, 100 % fruit or vegetable juices and sugar-sweetened beverages (SSB) on each occasion during the day in the 30–35 months old group of children (n 81). ![]() , breakfast;
, breakfast; ![]() , morning snack;
, morning snack; ![]() , lunch;
, lunch; ![]() , afternoon snack;
, afternoon snack; ![]() , dinner;
, dinner; ![]() , at bedtime;
, at bedtime; ![]() , night.
, night.
Discussion
The present analysis of TWI from all sources provides several new and original insights for water and other fluid consumption patterns for infants and young children. Earlier studies were limited to reporting either only fluid consumption(Reference Fulgoni and Quann21,Reference Grimes, Szymlek-Gay and Nicklas29,Reference Kay, Welker and Jacquier32) or data from children greater than 1(Reference Sichert-Hellert, Kersting and Manz15,Reference Kant and Graubard19,Reference Piernas, Barquera and Popkin23,Reference Herrick and Terry31) or 3 years of age(Reference Feferbaum, de Abreu and Leone20,Reference Ozen, del Mar Bibiloni and Pons24–Reference Vieux, Maillot and Constant28,Reference Vieux, Maillot and Constant30,Reference Gandy, Martinez and Carmuega33–Reference Vieux, Maillot and Rehm42) .
Our results in children 2–3 years old are comparable to those of the German DONALD study(Reference Sichert-Hellert, Kersting and Manz15) but lower than those found in the US NHANES study or one from Mexico(Reference Kant and Graubard19,Reference Piernas, Barquera and Popkin23) . The effect of sex on the intake was neither consistent nor very pronounced in our sample, as reported in the Mexican survey(Reference Piernas, Barquera and Popkin23) or in older children(Reference Iglesia, Guelinckx and De Miguel-Etayo25,Reference Guelinckx, Tavoularis and König26) . The AI set by Institute of Medicine or EFSA were similar for both sexes(5,17,Reference Grandjean18) . The proportion of children with intakes below the AI increased to more than 80 % after 2 years. However, these results must be weighed because the EFSA AI are mean values given respectively for entire age groups 0–6, 7–12, 13–24 and 25–36 months. Thus, they do not allow us to estimate the probability of water intake inadequacy, while groups with mean intakes at or above the AI can be assumed to have a low prevalence of inadequate intakes.
On the other hand, our results of mean TWI per kg of body weight were close to those reported on water turnover by Fusch et al. in 1993 in the same age groups(Reference Fusch and Jochum3). Three-quarters of the infants and most toddlers had a TWI/energy ratio below the AI set for their age(5), but overall our results were higher than those reported in Mexico(Reference Piernas, Barquera and Popkin23). This in line with the high energy densities of the diets we reported previously as increasing with age and the introduction of solid foods, on average from 15·3 to 20·3 kJ/100 g (64 to 85 kcal/100g) and even over 24100 kJ/g (24kcal/100g) in more than 10 % of children older than 18 months(Reference Chouraqui, Tavoularis and Simeoni44). The gradual increase of non-adherence to the AI after 6 months of age was linked to the increasingly significant share of solid food with age. The decreasing consumption of formula or milk was not compensated for by the drinking of water. The reported median age for the introduction of solid food in the study sample was 4·9 (Q1–Q3: 3·9–5·9) months(Reference Chouraqui, Tavoularis and Simeoni44).
The individual requirements for water are related both to energetic consumption and to water losses via excretion, mainly urine and secretion/transpiration. The glomerular filtration rate is limited in early life and rises gradually to reach adult rates by 18–24 months(Reference Bitsori50). The minimum water required for urine depends on the daily solute excretory load, primarily determined by the diet content, nitrogenous compounds and electrolytes(Reference Fomon and Ziegler7), while the maximum urinary concentration capacity is limited in infants(Reference Iacobelli, Guignard, Polin, Abman and Rowitch8,Reference Poláček, Vocel and Neugebauerová9) . Our study population protein intakes were shown to reach 1·4 times the average requirements before 3 months, two times at 8–9 months and > 4 times at 30–35 months(Reference Chouraqui, Tavoularis and Simeoni44). Na intake reaches twice the AI values in the second year and three times in the third year. Intakes of Ca, P and Mg also exceeded the corresponding reference values(Reference Chouraqui, Tavoularis and Turck45). This would suggest a drive towards higher TWI intake than assessed to facilitate solute excretion. This finding, paired with reports of numerous deleterious health outcomes related to low water intake in children and adults, even in cases of mild dehydration, warrants further investigation. Young children considered particularly at risk of impaired cognitive function remain an understudied population relative to the known positive effects of hydration on cognition(Reference Westfall, Logan and Khan51). The long-term consequences of under-hydration in early life, particularly related to chronic kidney diseases following Brenner’s hypothesis, have not been studied so far(52).
Overall, after the first semester of life, fluids (milk and dairy products, DW, other beverages and soups) accounted for about 70 % of the TWI and food moisture for 23–33 %. The contribution of food moisture was similar to that reported by the Institute of Medicine (about 30 %), higher than that by the EFSA (20 %) and lower than in older children (40 %)(5,17,Reference Vieux, Maillot and Constant28) . Whatever the age, milk as formula or cows’ milk and dairy products represented the primary source of water intake, decreasing with age as has been shown by others(Reference Sichert-Hellert, Kersting and Manz15,Reference Kant and Graubard19,Reference Piernas, Barquera and Popkin23) . DW accounted for only one-fourth of this intake at 30–35 months, while fruit juices and SSB accounted together for a maximum of 7 % of intake, below that reported elsewhere for young children(Reference Sichert-Hellert, Kersting and Manz15,Reference Fulgoni and Quann21,Reference Piernas, Barquera and Popkin23,Reference Herrick and Terry31,Reference Jones, Kirkpatrick and Hammond40) . After 8 months of age, nearly all children drank water, while a relatively small number of them consumed juices and/or SSB, contrary to what has been reported in other studies and other countries(Reference Byrne, Magarey and Daniels22,Reference Ozen, del Mar Bibiloni and Pons24,Reference Grimes, Szymlek-Gay and Nicklas29) . Tap water consumption was more prevalent among the older children, while the youngest infants were more likely to drink hypotonic mineral water. Bottled water was also the main plain water used for the reconstitution of the formula. Bottled waters consumed were among those labelled for infants in accordance with the European directive and the Agence Nationale de Sécurité Sanitaire de l’Alimentation, de l’Environnement et du Travail criteria(47,53) . Tap water quality in France relies on strict standards edited by the Ministry of Health and the Agence Nationale de Sécurité Sanitaire de l’Alimentation, de l’Environnement et du Travail accounting for European and WHO recommendations(54–58). At the time of the survey, 97·2 % of the French population was being supplied with water of good microbiological quality(59), and respectively 98·6 and 93·1 % were provided with water that constantly met the quality limit for nitrates and pesticides, according to the European directive 98/83/EC(54,59) . Of concern might be the content of tap water in other potential contaminants (Al, Ba, Cu, Fe, Mn, Na, Ni, Pb or Sb) which have been shown to exceed the maximum levels recommended by authorities(Reference Le Bot, Lucas and Lacroix60). The possible impact on the health of such results has not yet been assessed.
Our study’s fluid consumption pattern may be considered surprising even when compared with those described by others(Reference Kay, Welker and Jacquier32). Reassuring is the very low consumption of juice or SSB at bedtime or during the night. The quite low consumption of juices and SSB in the present survey is in agreement with, and even lower than, the recommendations of all the guidelines, which do not indicate the amount of plain water to drink(Reference Heyman and Abrams61–64). High sugar content in juices contributes to increased energy consumption and the risk of dental caries. However, a meta-analysis found only a small effect of a single serving of fruit juice on BMI change(Reference Auerbach, Wolf and Hikida65). Children who drank juices, at least once a day, at age 2 were later less likely to drink milk regularly but more likely to consume juice and SSB(Reference Sonneville, Long and Rifas-Shiman66,Reference Shefferly, Scharf and DeBoer67) . Unlike juices, SSB intake has been associated with higher BMI Z-score in children over 2 years of age(Reference Marshall, Curtis and Cavanaugh38,Reference Momin and Wood68) and higher blood glucose and TAG in children aged 4 years and more(Reference Seferidi, Millett and Laverty69). Parental modelling and feeding practices, as well as low socio-economic status, are among determinants of SSB consumption in young children(Reference Mazarello Paes, Hesketh and O’Malley70). In the present study, fruit and vegetable consumption from the age of 6 months took a significant part of TWI, around 20 %, confirming their role in improving hydration status.
Several limitations to this study should be acknowledged. Most of them have already been widely discussed in a previous publication(Reference Chouraqui, Tavoularis and Emery43). Assessing fluid intakes of breastfed children was not possible. No data on temperature or humidity were gathered during much of the winter and early spring period of data collection, nor were seasonality considered. Mainland France has a temperate climate, with a 13·7°C average temperature difference between summer and winter. No differences in TWI in American children aged 2–19 years were found between seasons(Reference Kant and Graubard19). No association was shown between temperature and TWI in children aged 1–10 years, contrary to what is reported in teenagers and adults, and a weak association was found between DW intake and temperature(Reference Beltrán-Aguilar, Barker and Sohn71). Sweat production in young children is indeed considerably less than in adults under similar climatic and activity conditions even when sweating rate is corrected for skin surface area(17). Our survey does not allow an estimate of any inadequacy as we were not able to measure any morning weight variations nor assess urine volume, colour, number of voids or osmolality(Reference Adams, Arnaoutis and Johnson72). From thirty-two studies on children aged 4–13 years reviewed by Suh et al., only eleven studies reported both water intake and hydration status without assessing the relation between the two(Reference Suh and Kavouras41). Despite these limitations, our study exhibited several important strengths in addition to its originality. It represents a significant, nationally representative data source with an important sample size. The methodology we used and considered as validated(Reference Chouraqui, Tavoularis and Emery43) was in line with the EFSA and the recent WHO guidelines(73,74) and has been estimated as a suitable method to assess water intake even if a 7-d diary seems to be more relevant(Reference Gandy75,Reference Warren, Guelinckx and Livingstone76) . Data analysed in our study were collected using rigorous methods to measure water intake. The fact that the children were completely dependent at this age on the parents and/or caregivers for their intake strongly suggests that all the events have been recorded.
Conclusion
Hydration is a particular concern for young children. Due to the scarcity of early childhood surveys assessing TWI and its sources in infants and young children studies as this one become very important. The present study has provided valuable new data on infant and children’s TWI as well as on the different sources of this intake according to age. We observed that an increasing number of children failed to meet the AI for water intake with age, raising concerns about their hydration status. However, of note is that all reference values, set as AI, have been defined derived from observed intakes, and sometimes by interpolation, without considering the hydration status nor the possible health consequences. Therefore, no conclusion on the inadequacy of the intakes we reported may be drawn, except that intake at or above the AI may be considered as adequate in conditions of moderate environmental temperature and moderate physical activity levels. Our results suggest that children’s water consumption should be monitored more closely by health professionals, caregivers and perhaps even parents. The results can be used together with those of older children to develop new approaches to improve the overall quality of infants’ and children’s diet and their hydration status by encouraging parents to offer water to drink more often after the introduction of solid food and to favour demand-feeding before. It is worth noting that the intakes of juices and SSB were lower in the current analysis than in other studies. During this early phase of life, dietary patterns begin to form and can influence later food and drinking preferences and health. This underlines the importance of parenting practices, especially availability of healthy and unhealthy beverages at home, permissiveness towards sugared drinks and lack of self-efficacy to refuse SSB consumption, as well as encouragement to drink plain water.
Future research should aim to assess TWI together with hydration status and to examine the relation between optimal hydration status of young children and disease prevention. This should allow future guidelines to give more precise reference values, while the training of health professionals and textbooks should give more attention to water requirements and the importance of drinking plain water.
Acknowledgements
The authors convey our profound recognition to the families who participated in the survey and to all of the people who contributed to the design of the survey, and to those who collected the data.
The initial survey has been funded to the SOFRES and the CREDOC by the Secteur Français des Aliments de l’Enfance (SFAE), 9 boulevard Malesherbes, Paris-75008, France. The secondary assessment of total water intake and water content of foods was funded by the Association pour la Formation, les Etudes et la Communication en Gastroentérologie Et Nutrition Pédiatriques (AFECGENP), 36 rue de l’Isère, 38610-Gières, France.
J. P. C. was involved in the study design, analysis, and interpretation of data and wrote the original draft, having primary responsibility for the final content. L. S. participated in the collection and analysis of data. S. N. T. and S. K. reviewed and provided comments on drafts of the manuscript. All authors approved the final manuscript.
J. P. C. received travel expenses and registration fees from Danone Research to attend the H4H Scientific Conference. L. S. is employed by the CREDOC funded by the SFAE and AFECGENP. S. A. K. has active grants with Danone Research and Standard Process and received honoraria for lectures by Danone Research. S. N. T. declares no conflict of interest.
Supplementary material
For supplementary materials referred to in this article, please visit https://doi.org/10.1017/S0007114521003469


