





Introduction
Coherent beamforming-based spatial division multiplexing (SDM) using large-scale multi-input multi-output (Massive-MIMO) system base stations have already been commercially deployed and it has become common in the range of sub-6 GHz for 5th generation (5 G) mobile access networks [Reference Marzetta3,Reference Hayakawa, Mochizuki, Hirabe, Kikuma and Nose4]. Millimeter-wave base stations are also being deployed to accommodate higher traffic capacities using analog beamforming and its services.
If millimeter-wave mobile access systems are widely used and have become populated, it would be expected that the demand of integrated access and backhaul (IAB) millimeter-wave radio units for both mobile backhaul (MBH) and the access links so that the mobile operators don't have to prepare additional sites and equipment for the economic and cityscape viewpoint. Additionally, the multi-hop link of backhaul radios enables the new deployment options without optical fiber infrastructure and additional access service areas of the coverage holes. In IAB RU, both the single carrier transmission is required for the low latency MBH and the OFDM orthogonal multi-beam capabilities are required for the multi-user MIMO (MU-MIMO) access link simultaneously.
This paper describes the design and implementation of an active phased array antenna system that has 256 antenna elements for hybrid beamforming at 39 GHz, and validation of wireless single carrier transmission for MBH applications and MU-MIMO for mobile access applications. An earlier version of this paper was presented at the 2021 51st European Microwave Conference and was published in its Proceedings [Reference Kuwabara, Tawa, Maruta, Hori and Kaneko1]. MU-MIMO validation uses reciprocity-based zero forcing (ZF) coherent beamforming to validate multiplexing tests for up to 8 users.
39 GHZ Hybrid advanced antenna systems (AAS) design and structures
Figure 1 shows a block diagram of an AAS consisting of a baseband (BB) and intermediate frequency (IF) processing unit, 16 radio frequency (RF) converter units, and 16 antenna units.
Block diagram of prototyped 39 GHz hybrid AAS.

Figure 2 shows a photo of the prototype AAS with the RF converter and antenna units integrated into the chassis of the subsystems described in Fig. 1. Excluding the fan unit, it occupies a width of about 200 mm, a depth of 200 mm, and a height of 250 mm. The converter and antenna units are connected to BB/IF processing units by cables for 16 transmission IF signals and 16 reception IF signals. In the case of a single carrier transmission test, the same IF signal is processed, and in the case of MU-MIMO test, the weighted IF signals are processed.
Photo of (a) prototyped AAS RU and (b) 256 elements antenna module.

Figure 3 shows one of the antenna units in the AAS. The antenna unit has two 65 nm CMOS-based 8-channel transmitter and receiver analog beamformer ICs [Reference Wang, Wu, Pang, You, Aviat Fadila, Saengchan, Fu, Matsumoto, Nakamura, Kubozoe, Kawabuchi, Liu, Zhang, Qiu, Liu, Oshima, Motoi, Hori, Kunihiro, Kaneko, Shirane and Okada5, Reference Pang, Li, Luo, Alvin, Saengchan, Aviat Fadila, Yanagisawa, Zhang, Chen, Huang, Gu, Wu, Wang, You, Liu, Sun, Zhang, Huang, Oshima, Motoi, Hori, Kunihiro, Kaneko, Shirane and Okada6].
Photo of one antenna unit.

The antenna element has a waveguide structure and is connected to the beamformer IC by a microstrip-line. Microstrip and waveguide conversion is performed by tapered fin-lines constructed on a printed circuit board. Figure 4 shows the result of simulating the radiation pattern of a single antenna element. 16 waveguide antenna elements are arranged in one antenna unit. Since the microstrip-line connecting the beamformer IC and the waveguide is arranged to be as short as possible, this structure is effective in reducing the feed loss of the antenna.
The shape of waveguide antenna and simulated radiation pattern.

By stacking 16 antenna units, a 256-element antenna module is formed. By devising an arrangement of tall parts such as band pass filters and power supply (PS) circuits in the antenna unit, as shown in Fig. 5, it is possible to stack the antenna units alternately [Reference Kuwabara, Tawa, Tone and Kaneko7]. As a result, the intervals of the antenna elements are aligned with a short length close to a half-wavelength while managing heat dissipation.
Arrangement of the antenna unit.

Over the air (OTA) measurement results
Beam pattern measurement
Before starting the OTA measurement, we adjusted the phase shifter inside the beamforming IC, align the phases between all antennas, created a state where a beam can be formed in front and used that as the initial state for subsequent experiments. From the initial state, by using 16 transceivers, azimuth beam steering by digital beamforming is possible, and by setting the phase of the beam forming IC, elevation beam steering by analog beam forming is possible. Figure 6 shows each antenna pattern. The −3 dB angle at the front beam is ±2.7 degrees in both azimuth and elevation.
Pencil beam steering patterns. (a) Digital azimuth, (b) analog elevation.

With this equipment, OTA measurements were performed using both wideband single-carrier QAM and OFDM signals, assuming MBH and access links, respectively. Table 1 shows the system parameters for a single-carrier transmission, and Table 2 shows the system parameters for OFDM transmission.
Radio system parameters for single carrier test

Radio system parameters for the OFDM MU-MIMO test

Single carrier measurement
During single carrier OTA measurements, the AAS RU was used as the transmitter and the TDD switch was fixed as the transmitter. The modulated wave created for transmitting the IF signal is encoded by Low-Density Parity-Check (LDPC) codes with a modulation rate of 875 M baud. This signal was output from the antenna module via 16 up converters. A pencil beam was formed in the front direction. A standard rectangular horn antenna with 20 dBi gain received 39 GHz RF at a distance of approximately 2.5 m. In MBH applications, it is common practice to control the transmission power with some tolerance for degradation of distortion characteristics, depending on the modulation scheme. In this test, the transmission gain on the AAS RU side was increased to the limit where the radio transmission quality was not degraded, and the transmitter EIRP was measured from the received power at the horn antenna end. The radio transmission quality and RF spectrum were evaluated by analyzing the IF signal through the down converter with a commercial modem(https://www.nec.com/en/global/prod/nw/pasolink/products/ipasolinkEX_advanced.html). The down converter has a noise figure of 12 dB and a gain control function. The receiver's gain is controlled so that the IF level is optimal for the dynamic range of the modem.
As an example of the experimental results, the cases of QPSK and 128QAM modulation schemes are shown below.
Figure 7(a) shows the measured RF spectrum of the QPSK modulated transmission signal and (b) shows its constellation. The transmission data rate was 1.57 Gbps, the mean square error was −19.3 dB, and the transmitter EIRP was 49 dBm. This corresponds to a range of reach of 2 km as MBH link, assuming that the antenna gain on the receiving side is 20 dBi and the receiver's noise figure is 10 dB.
Measured (a) spectrum and (b) constellation with 1 GHz BW QPSK.

Figure 8(a) shows the RF spectrum of the measured 128 QAM modulated transmission signal and (b) shows its constellation. The transmission data rate was 5.50 Gbps, the mean square error was −26.5 dB, and the transmitter EIRP was 43 dBm. This corresponds to a range of reach of 200 m as the MBH link, assuming that the receiver is the same.
Measured (a) spectrum and (b) constellation with 1 GHz BW 128QAM.

OFDM MU-MIMO measurement
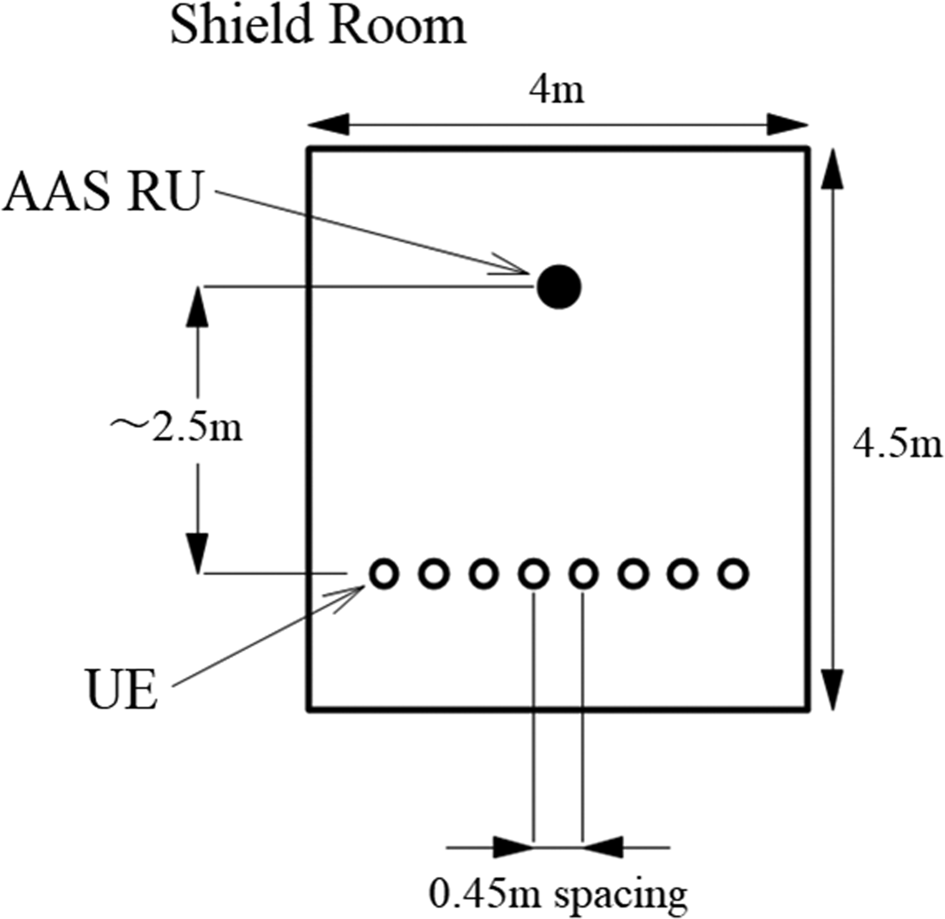
Figure 9 shows a photo of the measurement setup in the shielded room, and Fig. 10 shows the geometry of the access point AAS RU and the eight user equipment (UE).
Photo of OFDM MU-MIMO measurement setup.

Geometrical arrangement of AAS RU and four UEs.
To achieve MU-MIMO, all 16 transceivers in the AAS RU must be calibrated [Reference Tawa, Kuwabara, Maruta and Kaneko8]. MU-MIMO is a technique to suppress interference by forming null signals in layers unnecessary for the terminal. If the calibration is incomplete, it is assumed that insufficient null signals will be formed and multiple unwanted layer signals will accumulate, reducing the effectiveness of interference suppression. Accurate channel estimation must form sufficient nulls, which require reciprocity calibration.
The calibration procedure is described below. First, a transmitted signal was sent from one UE and the signal received by 16 transceivers in the AAS RU was measured (uplink). Next, an orthogonal signal is transmitted through 16 transceivers to 16 antennas of the AAS RU and the signal received by the same UE is measured (downlink). If the reciprocity of the 16 antennas in AAS RU is maintained, the amplitude and phase differences between the uplink and downlink signals will be equal for the 16 transceivers in the AAS RU. To compensate for this relationship, calibration coefficients are prepared for each resource block and for each transceiver and applied by the DSP. This allows channel estimation using uplink and downlink reciprocity.
The experiments were performed using OFDM signals conforming to 3GPP TS38.214 [2] in 100 MHz bandwidth. First, SRS signals were output from multiple UEs, received by AAS RU, and analyzed. This was used to calculate beam weights. Next, we used the ZF method to perform MU-MIMO transmission for multiple UEs. At this time, the output power is normalized so that the distortion of the waveform of each antenna output does not change even if the number of layers is changed. The signal evaluation was performed using Kesysight's Vector Signal Analyzer for the IF signal obtained via the down converter of each UE.
Figures 11–17 show examples of QPSK constellations observed during experiments with 2–8 UEs. In the experiments with 8 UEs, the EVM values were −15.14, −17.78, −16.46, −15.71, −16.04, −15.50, −11.30 and −13.10 dB, respectively. 3GPP TS38.214 The estimated total throughput using the rank adaptation according to MCS index Table 2 is 2.42 Gbps when using an OFDM signal with a bandwidth of 100 MHz. The resulting spectral efficiency (SE) was 24.2 bps/Hz/cell.
Measured constellation and MSE with 2UEs spatial multiplexing.

Measured constellation and MSE with 3UEs spatial multiplexing.
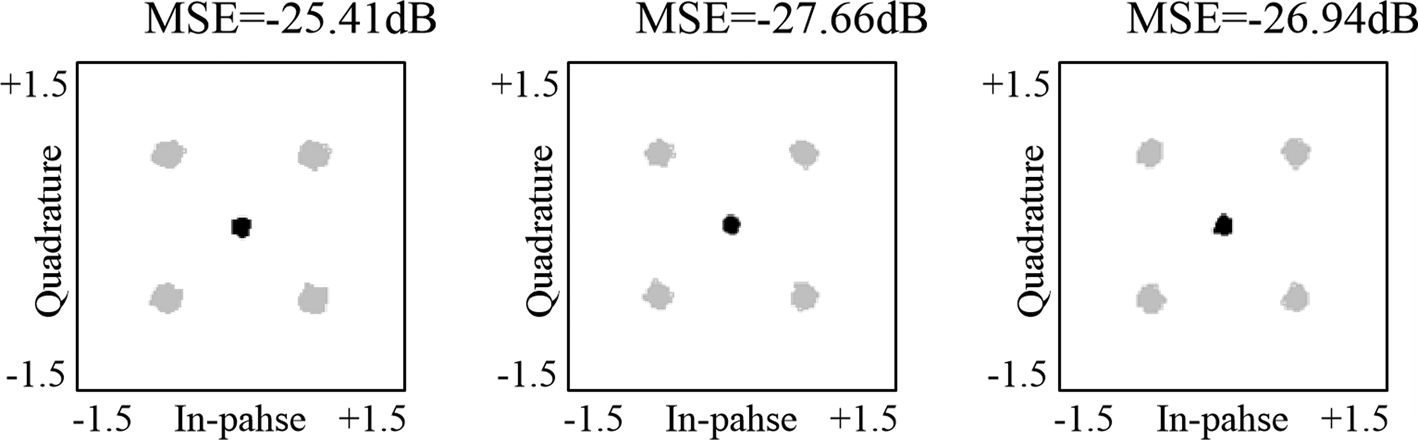
Measured constellation and MSE with 4UEs spatial multiplexing.

Measured constellation and MSE with 5UEs spatial multiplexing.

Measured constellation and MSE with 6UEs spatial multiplexing.

Measured constellation and MSE with 7UEs spatial multiplexing.
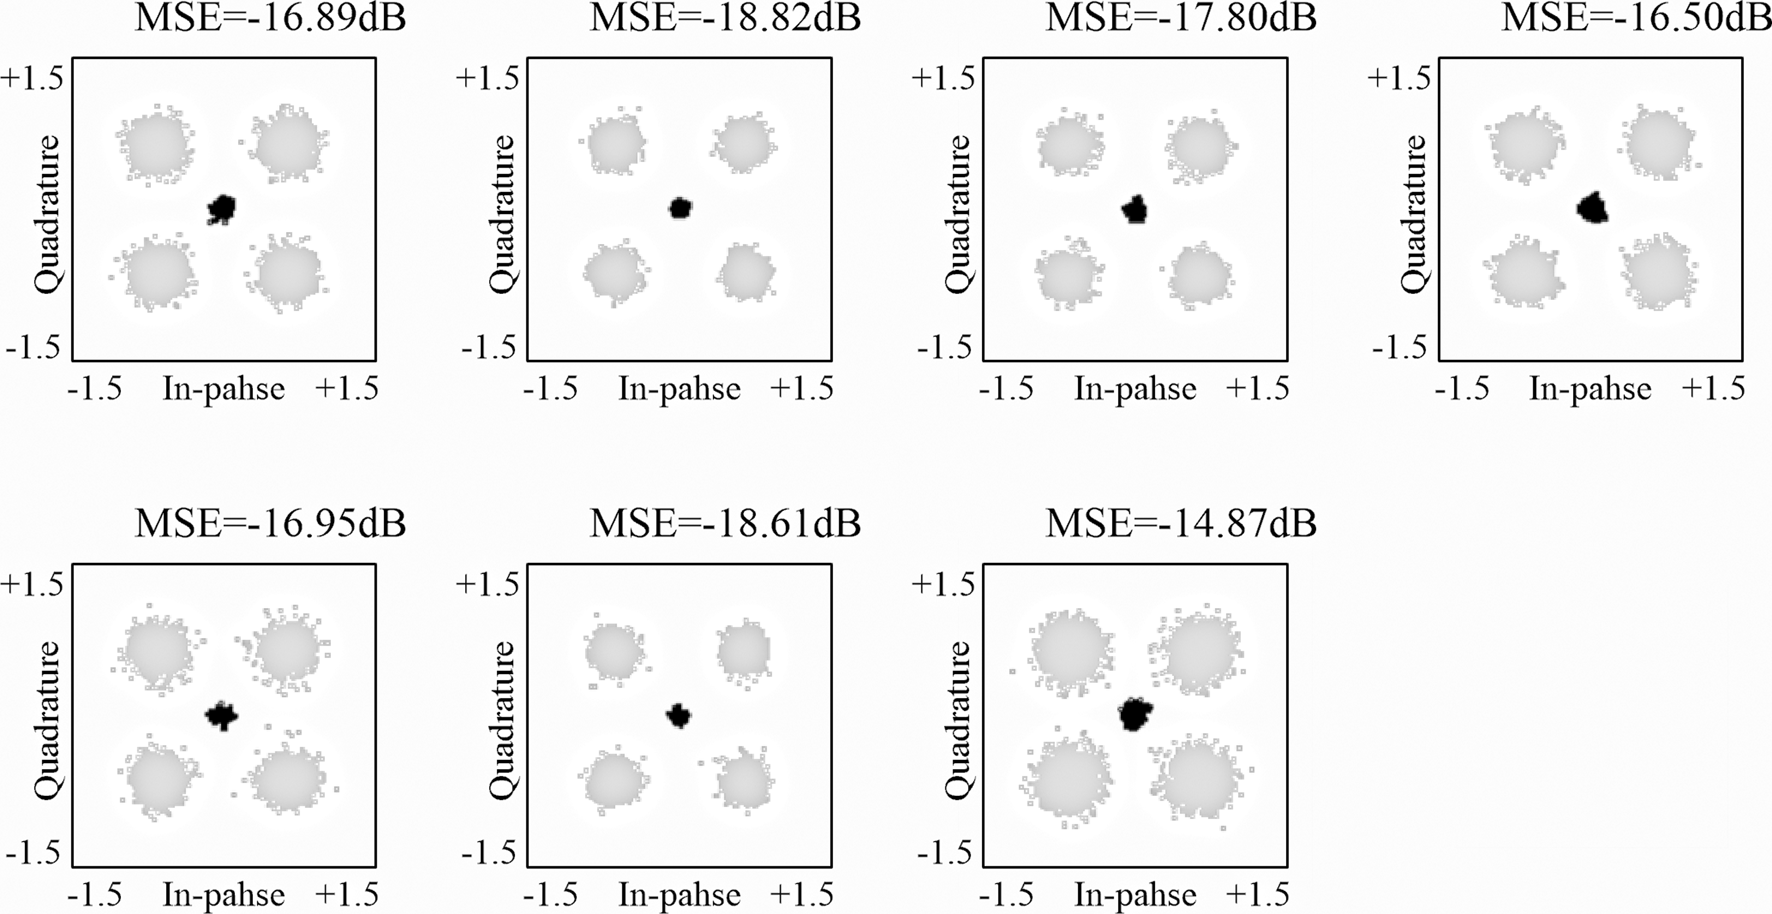
Measured constellation and MSE with 8UEs spatial multiplexing.

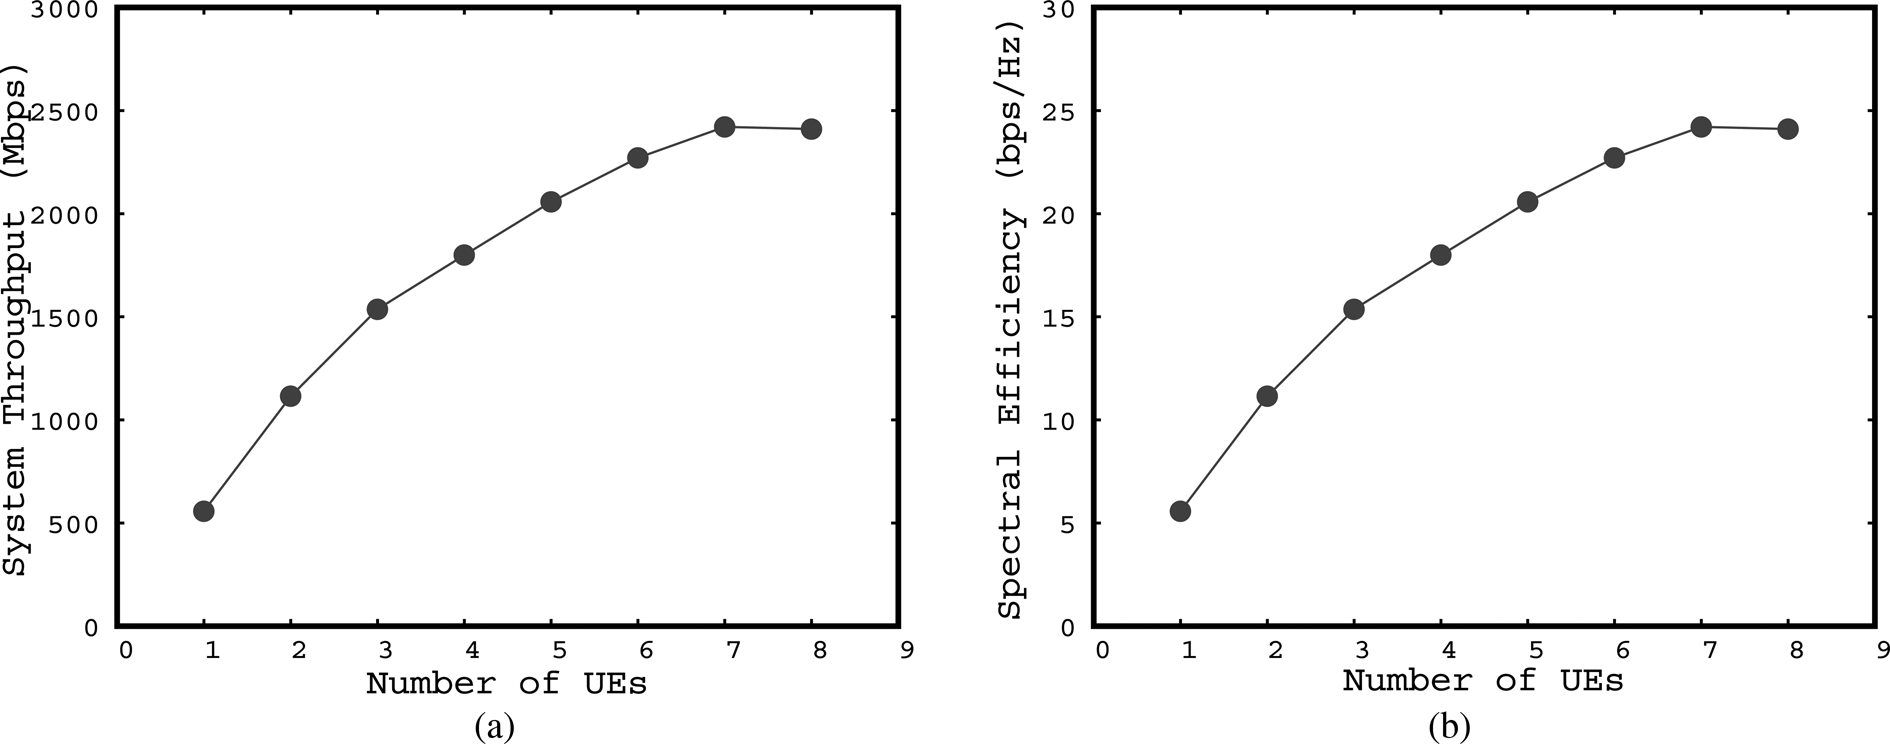
For example, when conducting an experiment with two UEs, two of the eight UEs are selected; so there are 8C2 = 28 combinations, but some of these combinations are selected for the experiment. We experimented with more, but not all, combinations, and each time we estimated and calculated the total throughput and evaluated it as the average throughput for the number of UEs. Table 3 shows an example of MSE in each UE obtained in each experiment. With one UE, the MSE is about −30 dB, which is the limit of this system. This is roughly equivalent to what would be expected from the integral value of Phase Noise. MSE degrades as the number of UEs increases, but because of the close distance, the received level at each UE is not low enough to affect the thermal level, and it is expected that the degradation is mainly due to interference caused by the lack of spatial separation capability. Figure 18(a) shows the average throughput for the number of UEs, and (b) shows the SE for the number of UEs. According to this, up to 3 or 4 MIMO streams, the throughput can be expected to increase linearly with the number of streams, but above that, there is a tendency to saturate, and the maximum throughput is achieved with about 7 multiplexing.
Measured (a) system throughput and (b) SE by number of UEs.
An example of the MSE value measured in each UE in the MU-MIMO test with 1 to 8 UEs

Investigation of UL to DL reciprocity calibration methods
As mentioned earlier, the reciprocity calibration is important to maximize throughput. It should be noted that the calibration performed here is not to align the absolute values of the 16 antenna characteristics, but to compensate for reciprocity. The transmission and receiving antenna gains and patterns for each antenna module alone are adjusted at the module level and are not adjusted in this procedure. For example, if the transmission gain and phase of each antenna are different, but the receive gain and phase of each antenna are similarly different, the reciprocity will be maintained. As a result, spatial multiplexing can be realized by channel estimation. A relative comparison of the transmission and receiving characteristics of each antenna is sufficient for reciprocity calibration. In fact, our calibration is achieved by multiplying the transmission signal by a complex coefficient, the magnitude of which is nearly unity. In the experiment shown in the previous section, 16 antennas were calibrated using a UE placed in front of the device to obtain the optimum calibration result. However, in actual operation, it is difficult to place a calibration antenna in front of the RU. Therefore, we examined a self-contained calibration method. Specifically, it is as follows.
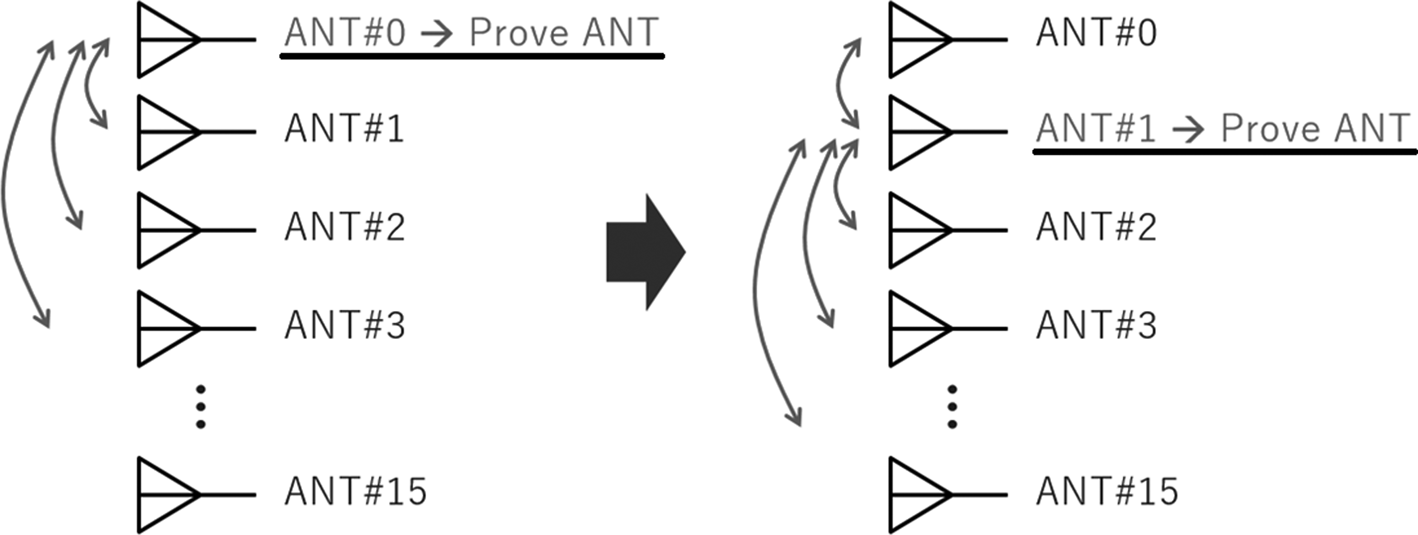
First, one of the 16 antennas is used as a probe antenna, and when it is used as a transmitting antenna, the other antennas are receiving, or when it is used as a receiving antenna, the other antennas are transmitting. The calibration is performed in the same procedure as the reciprocity calibration performed in the previous experiment. As a result, it is possible to calibrate 15 antennas, but depending on the arrangement of the antennas, there remains a problem that the calibration accuracy is problematic because the reception level is small, or the remaining probe antenna cannot be calibrated. Therefore, the probe antenna is changed to another one, and the same calibration procedure is repeated. Since the reciprocity calibrations are relative to each other, this allows calibrations of all 16 antennas. Additionally, as shown in Fig. 19, by switching the probe antenna one after another to perform calibration, discarding data with a low reception level, and performing calibration using only data for which a sufficient signal level has been obtained, sufficient accuracy is achieved for all antennas.
Self-contained calibration.
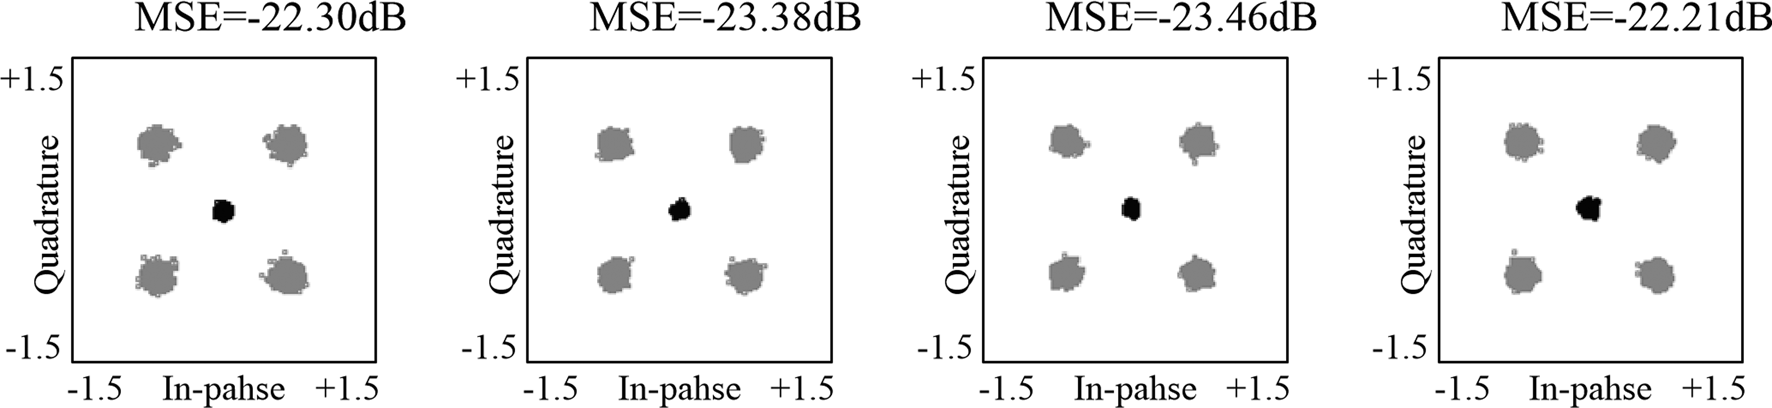
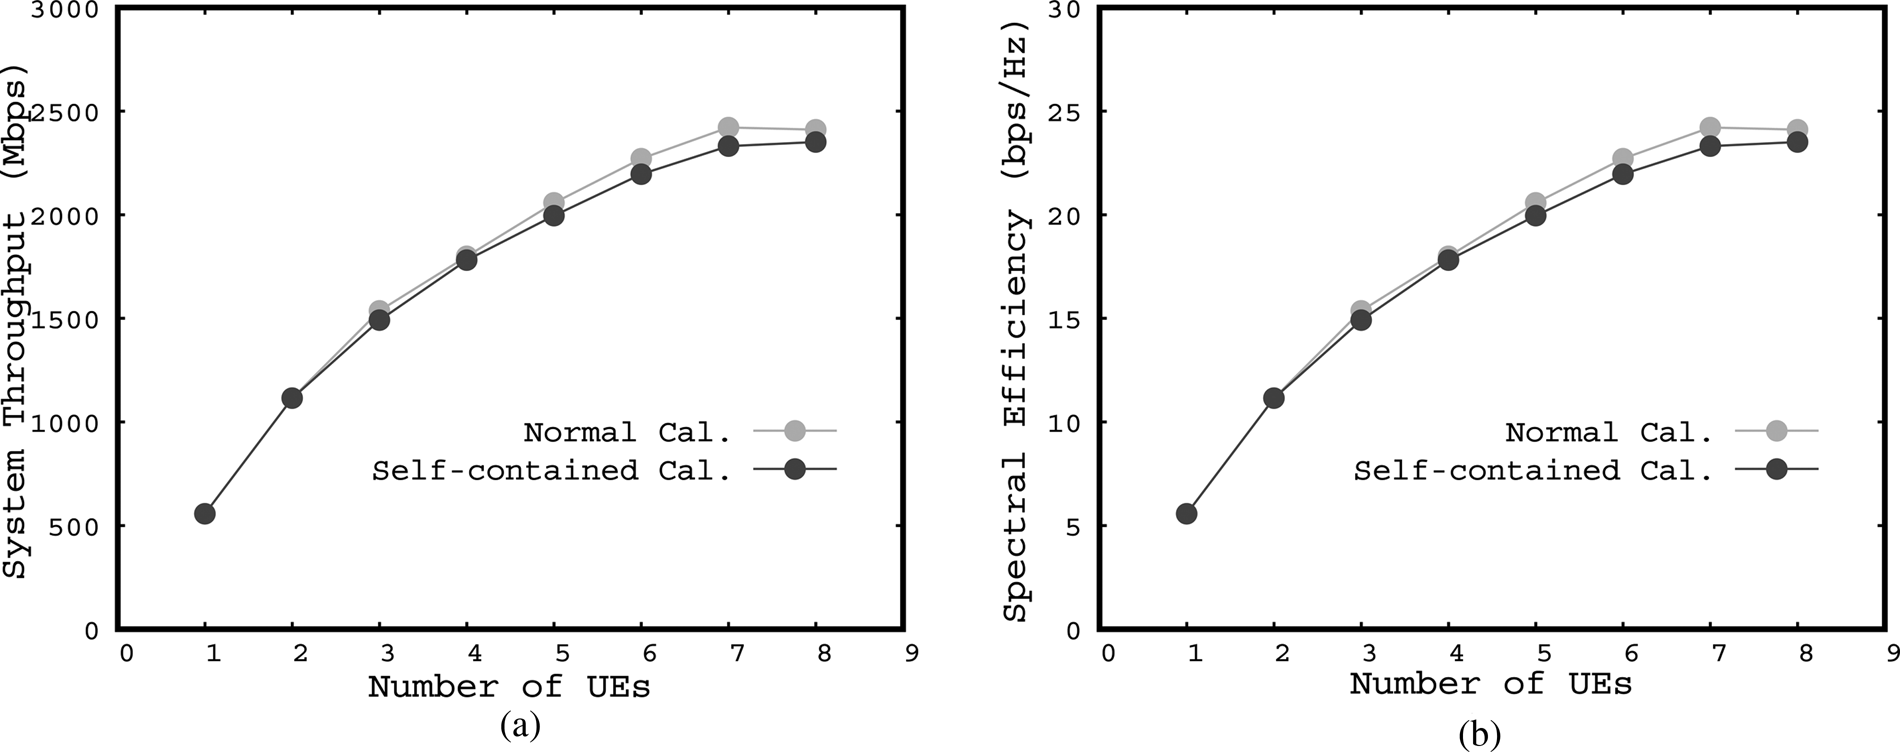
After calibrating according to this procedure, the MU-MIMO experiment up to eight multiplexes was performed again. As an example of the measurement, Fig. 20 shows constellation plots and EVM measurement results with four multiplex state. These results do not appear to differ significantly from the result of the experiment with normal calibration. As in the previous experiment, we accumulated data while changing the number and position of the UE antennas. The plot of average throughput and SE is shown in Fig. 21. Almost the same results are obtained, and it is demonstrating that self-contained calibration methods are sufficient. As a matter of fact, even with this calibration procedure, the magnitude of the coefficients was almost unity.
Measured constellation and MSE with 4UEs spatial multiplexing with self-contained calibration.
Differences in measurement results of (a) system throughput and (b) SE by number of UEs depending on the calibration methods.
Conclusion
At 39 GHz, we verified the prototype of AAS with a hybrid beamforming function of 256 antenna elements. In an experiment assuming an MBH link, we verified and demonstrated a single carrier transmission data rate of 5.5 Gbps using 128QAM modulation at 1 GHz Band Width. In an experiment assuming mobile access, an OFDM 8 MU-MIMO connection was realized with a 100 MHz band width, and a system throughput of 2.4 Gbps was obtained. This indicates that the prototype AAS RU can implement IAB functionality.
Table 4 shows the performance benchmarks for the FR2 AAS system. As far as the author knows, this is the first experimental demonstration for IAB applications that use millimeter-wave in MU-MIMO.
Comparison with previous FR2 digital or hybrid AAS works

Acknowledgement
This research is supported by the Ministry of Internal Affairs and Communications in Japan (JPJ000254).
Conflict of interest
The author(s) declare none.
 Toshihide Kuwabara received the B.E. degree and the M.E. degree in electrical engineering from Waseda University, Japan, in 1991 and 1993 respectively. Currently, he is a senior engineer at NEC Corporation. His main development work is the design and optimization of millimeter-wave and sub-terahertz radios. He is serving as a TPC member of the IEEE BiCMOS and Compound Semiconductor Integrated Circuits and Technology Symposium (BCICTS).
 Noriaki Tawa received the B.Sc. degree from Hiroshima University, Japan, in 2003, and M.Sc. and Ph.D. degrees from Osaka University, Japan, in 2005, 2008, respectively. He had held research fellowships from Japan Society for the Promotion of Science from 2007 to 2008. In 2008 he entered NEC Corporation where he have been engaged in the high efficiency PAs and the bit-streamer technologies development for base-stations. He is currently focusing the digital beam-forming massive MIMO technology in quasi-/millimeter-wave frequency range and high efficiency PAs in sub-6 GHz range.
 Yasushi Maruta received the B.E. degree in electrical engineering and the M.E. degree in electronics from Tohoku University in 1994 and 1996, respectively. He joined NEC Corporation in 1996, where he has been engaged in the development of baseband signal processing parts on base-stations for mobile wireless communication. He is currently focusing the massive-MIMO technology enhancement in millimeter-wave and sub-terahertz frequency range.
 Shinichi Hori received the B.E. degree in mechanics and the M.E. degree in electronics from the University of Tokyo, Tokyo, Japan, in 1998 and 2000, respectively. He joined NEC Corporation, Kawasaki, Japan, in 2000, where he has been engaged in the research and development of RF CMOS circuits for wireless communication. In 2008, he was a Visiting Scholar with the Center for Integrated Systems, Stanford University, Stanford, CA, USA. His current interests include high-efficiency power amplifier architecture and IC/module implementation for mobile base stations, and multi-mode/multi-band transceiver ICs for software-defined-radio systems. Mr. Hori is also a member of the Institute of Electronics, Information and Communication Engineers, Japan.
 Tomoya Kaneko received the B.S. degree in physics from Tokyo University of Science, Japan and the M.S. degree in science from University of Tsukuba, Japan, in 1984 and 1986 respectively. He joined NEC Corporation, Japan in 1986, where he has been engaged in design and development of Microwave and millimeter-wave circuits, their MCMs and sub-systems for radio communication systems. From 1999 to 2002, he was an engineer at NEC America Inc., USA, where he developed GaAs MMICs for millimeter-wave P-P radios. He is currently a senior professional in Wireless Access Development Department of NEC Corporation. His current interests are millimeter-wave technologies and massive-MIMO considering their application to the mobile access networks. He had been serving as a TPC member and an overseas advisor of the IEEE BiCMOS and Compound Semiconductor Integrated Circuits and Technology Symposium (BCICTS) for twelve-years.


 Open access

