Overweight is increasing in the adolescent population and became a public health issue in Brazil and worldwide(Reference Reis, Vasconcelos and Barros1,Reference Sumi, Iwase and Nakamura2) . In Brazil, from 1974/1975 to 2008/2009, overweight increased from 3·7 % to 21·7 % among males from 10 to 19 years old, and from 7·6 % to 19·4 % among females in the same age range(3). In 2015, among Brazilian adolescents aged between 13 and 17 years, 23·8 % of the girls and 23·7 % of the boys were overweight(4). At the global scale, the prevalence of obesity among children and adolescents aged between 5 and 19 years increased from 0·7 % and 0·9 % in 1975, to 5·6 % and 7·8 % in 2016 in females and males, respectively(5).
During adolescence, changes occur in body composition that vary according to sex, age, stage of sexual maturation and environmental factors of each individual(6). The initial period is marked by growth spurt and appearance of secondary sexual characteristics, as well as an increase in body fat accumulation, which occurs mainly in female sex, being an essential physiological gain for growth and necessary for the beginning and maintenance of menstrual cycles. In boys, the gain of adipose tissue is slower, and even loss may occur. In the middle and late periods, the completion of growth and morphological development occur(Reference Priore, Faria and Franceschini7).
Due to the changes that occur in this period of life, adolescence becomes a vulnerable period for the occurrence of obesity and its associated complications(Reference Juonala, Magnussen and Berenson8,Reference Wang, Steffen and Vessby9) . Excess body fat is related to the development of diseases such as diabetes mellitus(Reference Bozza, Campos and Barbosa Filho10,Reference Lascar, Brown and Pattison11) , hypertension(Reference Buscot, Thomson and Juonala12), the metabolic syndrome(Reference Giudici, Rolland-Cachera and Gusto13) and CVD(Reference Buscot, Thomson and Juonala12), whose onset occurs in adolescence and progresses through adulthood(Reference Juonala, Magnussen and Berenson8,Reference Buscot, Thomson and Juonala12) . In addition, obesity is a risk factor for psychosocial diseases such as body image disorders, which may evolve and contribute to the development of body image disorders(Reference Miranda, Amorim and Bastos14).
This context highlights the importance and need of monitoring the health situation of adolescents. Accordingly, there is a clear need to carry out this assessment according to sex and age, as the several changes in body composition influence the reliability of the indices used in anthropometric evaluation(Reference Filgueiras, Vieira and Fonseca15).
BMI is the most commonly used indicator to assess the nutritional status of individuals at any age. However, this is not the most reliable method for the assessment of excess body fat and the risk of associated diseases, such as cardiometabolic diseases(Reference Vanderwall, Randall Clark and Eickhoff16–Reference Ripka, Orsso and Haqq18). A limitation that needs to be considered regarding this index is that it does not distinguish between lean and fat mass(Reference Filgueiras, Cecon and Faria17,Reference Woolcott and Bergman19) . Particularly in adolescents, studies show that individuals classified as eutrophic based on their BMI have excess body fat, thus confirming that this limitation should be accounted for when assessing nutritional status(Reference Ripka, Orsso and Haqq18,Reference Schröder, Ribas and Koebnick20) . Hence, in addition to the waist:height ratio (WtHR), other indices have been proposed to enable a more reliable assessment of excess body fat and, consequently, to predict the risk of developing cardiometabolic alterations.
The conicity index (CI)(Reference Valdez21), body adiposity index (BAI)(Reference Bergman, Stefanovski and Buchanan22) and the body roundness index (BRI)(Reference Thomas, Bredlau and Bosy-Westphal23) were developed and have been used to assess body fat in adults. However, there is a limited number of studies that analyse the relevant capacity of these and other anthropometric indexes to evaluate the body fat in paediatric population. In addition, there are no reliable cut-off points that can verify with scientific authenticity the excess accumulation of adipose tissue in the adolescents, as well as the associated risk factors Thus, this study aims to identify the BAI with the best capacity to predict excess fat and propose cut-off points for them, according to sex and period of adolescence.
Methodology
Study design and sample
This is a cross-sectional study which comprised the three periods of adolescence (early: from 10 to 13 years old; middle: from 14 to 16 years old; late: from 17 to 19 years old)(6) with 1188 adolescents: 804 female and 384 male, aged from 10 to 19 years old.
We conducted the research with data collected in cities located in the microregion of Viçosa, comprising twenty municipalities, which is part of Zona da Mata mesoregion, state of Minas Gerais, Brazil. The microregion has an estimated population of adolescents between 10 and 19 years of 39 270(Reference Bozza, Campos and Barbosa Filho10); thus, the evaluated sample corresponds to 3 % of the total population of the same age group.
The data used in this article were obtained from twelve cross-sectional studies developed by a research group of Graduate Program in Nutrition Sciences at the Federal University of Viçosa. Data collections were carried out with students from public schools, between 2002 and 2017.
In general, the eligibility criteria used in all databases were: adolescents aged between 10 and 19 years, girls who had already undergone menarche at least 1 year earlier, voluntary participants in good health conditions and whose participation was allowed by an authorisation signed by their parents or legal guardians (if under 18 years of age). As exclusion criteria, we verified whether the adolescents could normally engage in any kind of physical activity, whether they had any chronic or communicable disease, some obesity-related factor or inflammatory diseases, whether they have been using some kind of controlled drug or medicine likely to influence metabolic function and whether they are currently participating in any other study addressing either body composition assessment or nutritional status control. Both criteria were observed throughout the selection and data collection processes, through contact with the students at the school, the Health Division and the research laboratory at the Federal University of Viçosa.
The databases of these studies were analysed separately and thoroughly until they were included in the study. After the analysis, all these databases were merged and we proceeded with the selection of the adolescents. We excluded duplicate data of adolescents evaluated more than once during the same period. Data from participants assessed more than once, but in different periods, were retained.
We calculated the study power by the OpenEpi® online programme (www.OpenEpi.com), considering the outcome of the WHtR among the groups with high and adequate body fat percentage (BF%). Based on the means and standard deviations of the WHtR in the group of adolescents with excess body fat (0·48 (sd 0·069) cm) and eutrophic (0·41 (sd 0·032) cm), the result of the analysis showed power equal to 100 %.
Anthropometric and body composition assessment
All anthropometric measurements were performed by researchers, who were trained during the conduct of the pilot studies, before the start of data collection. The same protocols, instruments and devices were used for anthropometric and body composition measurements in all studies, so the information collected are homogeneous, which guarantees the relevance of the results found in this research.
The weight was measured on an electronic digital scale (Kratos®), with a maximum capacity of 150 kg and a sensitivity of 50 g. Weighing was performed according to the techniques proposed by WHO(24). For greater measurement reliability, the calibration of the scale was verified with a standard weight of 1 kg.
We measured height using a portable stadiometer (Alturexata®), up to 220 cm in length. We performed the measurements following the techniques recommended by WHO(24).
We used a flexible and inelastic tape measure (Cardiomed®) with a maximum length of 2 m to measure waist (WC) and hip circumferences, being careful not to compress soft tissues. We made the measurements in duplicate, assuming a maximum variation of 0·5 cm and in case of variation greater than this value, we performed a third measurement, using the mean between the two nearest measurements.
WC was measured at the midpoint between the lower margin of the last rib and the iliac crest, in the horizontal plane(25) and the hip circumference in the gluteal region, surrounding the largest horizontal portion between the waist and knees(Reference Heyward and Stolarczyk26).
We used the gold standard in the assessment of body composition, Dual-Energy X-ray absorptiometry (DEXA) equipment (Lunar Prodigy Advance DXA System – analysis version: 13.31, GE Healthcare), to estimate the BF%, in the morning, with all participants fasting for 12 h and following the assessment protocol. We used sex-specific cut-off points to classify excess body fat. Accordingly, we classified values ≥25 and 20 % for females and males, respectively, as excess fat(Reference Lohman27).
Body adiposity indices
The WtHR was calculated by the quotient of WC measurement (cm) by the height measurement (cm), waist:hip ratio (WHR) by the relationship between WC (cm) and hip circumference (cm). BMI was assessed according to age and sex (BMI/I) by WHO AnthroPlus software, using z-score values(Reference De Onis, Onyango and Borghi28).
The CI was calculated according to the formula proposed by Valdez(Reference Valdez21); the BAI according to Bergman et al. (Reference Bergman, Stefanovski and Buchanan22) and the BRI are based on the proposal of Thomas et al. (Reference Thomas, Bredlau and Bosy-Westphal23).
Statistical analyses
The databases were elaborated in Excel software, and to guarantee the validity of the data, they were double-typed. We performed the statistical analysis with the aid of Statistical Package for Social Sciences (SPSS) software for Windows, version 20.0 and MedCalc version 9.3. We adopted as level of rejection of the null hypothesis α = 5 %. We performed the Shapiro–Wilk test, in which was found that the variables did not present normal distribution.
We presented median and interquartile range values for the descriptive analysis of continuous variables. The Mann–Whitney U test was used to compare the sexes and the Kruskal–Wallis test to compare the periods of adolescence for each sex. After verifying statistical difference (P < 0·05) by Kruskal–Wallis, we performed Bonferroni’s correction for P value and again Mann–Whitney U test to identify which groups differed from each other.
We established the predictive capacity and cut-off points of BAI by building ROC (receiver operating characteristic) curves. We determined the AUC-ROC and the respective CI (95 % CI), stratified by sex and period of adolescence. The sensitivity and 1-specificity values generated by the ROC curves were assessed to identify the best cut-off points, considering the best balance between these values. To classify the AUC values, we used: <0·6 bad; from 0·6 to 0·7 sufficient; from 0·7 to 0·8 good; from 0·8 to 0·9 very good and from 0·9 to 1·0 excellent(Reference Borges29).
Ethical aspects
All studies whose databases were included in this research were submitted to and approved by the Ethics Committee on Research with Human Beings of the Federal University of Viçosa. In addition, the present study was submitted to the Ethics Committee on Research with Human Beings of the Federal University of Viçosa and obtained a single approval number (2879661).
When the surveys were conducted, participants and their guardians were informed about their objectives and received the Informed Consent and Agreement Consent Terms for those under 18 years old. Only those who submitted duly signed terms were included.
The adolescents’ participation was voluntary, so they could leave the research at any time without any harm and their data were kept confidential.
Results
Most were female (67·7 %), of the total 37·6 % were in the middle period of adolescence and 35·2 % in the late, with a median age of 16 years old (interquartile range: 13–17). According to BMI assessment, 22·1 and 21·5 % of the male and female adolescents, respectively, were with overweight, and by DEXA assessment, 29·4 and 69·4 %, respectively, had a high BF%.
Regarding nutritional status classified by BF% (DEXA), a lower proportion of excess body fat was observed in early adolescence (20·0 %) compared with the middle (43·8 %) and late (36·2 %) (P < 0·001) period. There was also a difference in the proportion between the middle and late period (P = 0·021).
We observed that all measurements and indices showed differences (P < 0·05) between periods in females and only WHtR and BRI did not differ (P > 0·05) in any period in males (Table 1).
Comparison of anthropometric and body composition variables between periods of adolescence according to the adolescents’ sex, Minas Gerais (n 1188)†,‡
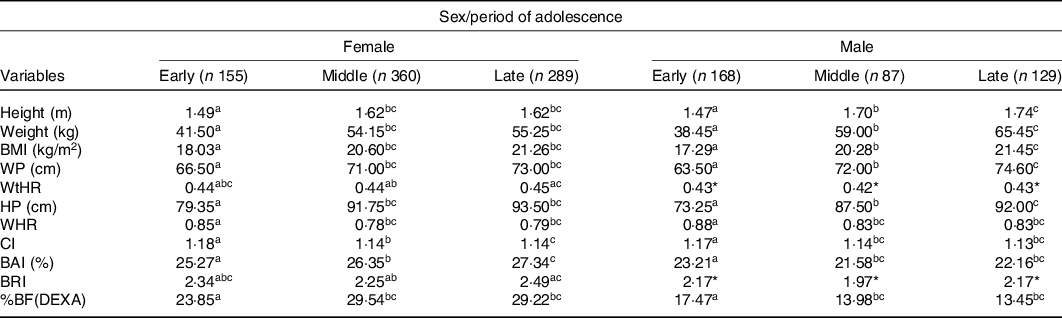
WP, waist perimeter; WtHR, waist:height ratio; HP, hip perimeter; WHR, waist:hip ratio; CI, conicity index; BAI, body adiposity index; BRI, body roundness index; %BF, body fat percentage.
Medians in the same row followed by the same letter do not differ for each sex by the Kruskal–Wallis test, supplemented by the Mann–Whitney with Bonferroni correction (P < 0·016).
* P > 0·05.
† Early: 10–13 years; Middle: 14–16 years; Late: 17–19 years.
‡ Reference Method: DEXA.
The analysis of the ROC curves showed AUC values considered very good or excellent (>0·8) for BMI, WtHR, BAI and BRI in adolescents in general (Table 2).
Cut-off points, sensitivity, specificity and AUC of the adiposity indices for body fat prediction in adolescents, Minas Gerais (n 1188)†,‡(95 % confidence intervals)
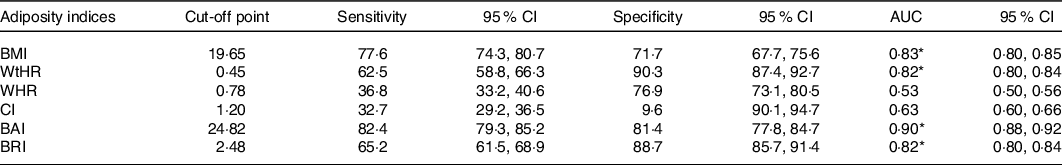
WtHR, waist:height ratio; WHR, waist:hip ratio; CI, conicity index; BAI, body adiposity index; BRI, body roundness index.
* AUC value rated very good or excellent (> 0·8).
† Reference Method: DEXA.
‡ All AUC values were significant (P < 0·05).
In the analysis by period of adolescence and sex, ROC curves indicated AUC values considered very good or excellent (>0·8) for BMI and BAI in females in all periods. In males, WHR had an AUC value below 0·8 in the early and late period of adolescence. The best combinations of sensitivity and specificity values to determine the cut-off points of these indices in predicting body fat in adolescents are shown in Tables 3 and 4.
Cut-off points, sensitivity, specificity and AUC of the adiposity indices for body fat prediction, according to the period of adolescence, in female adolescents, Minas Gerais (n 804)†,‡,§(95 % confidence intervals)
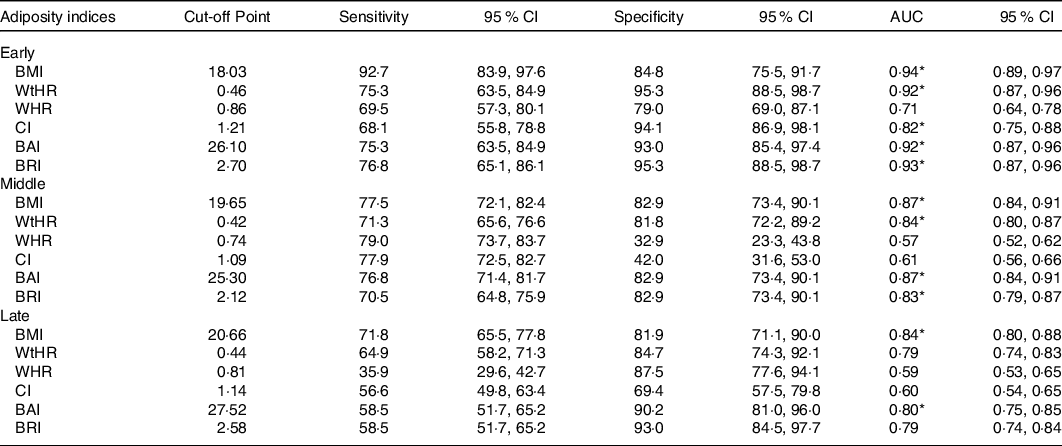
WtHR, waist:height ratio; WHR, waist:hip ratio; CI, conicity index; BAI, body adiposity index; BRI, body roundness index.
* AUC value rated very good or excellent (> 0·8).
† Early: 10–13 years; Middle: 14–16 years; Late: 17–19 years.
‡ Reference Method: DEXA.
§ All AUC values were significant (P < 0·05).
Cut-off points, sensitivity, specificity and AUC of the adiposity indices for body fat prediction, according to the period of adolescence, in male adolescents, Minas Gerais (n 384)†,‡,§(95 % confidence intervals)
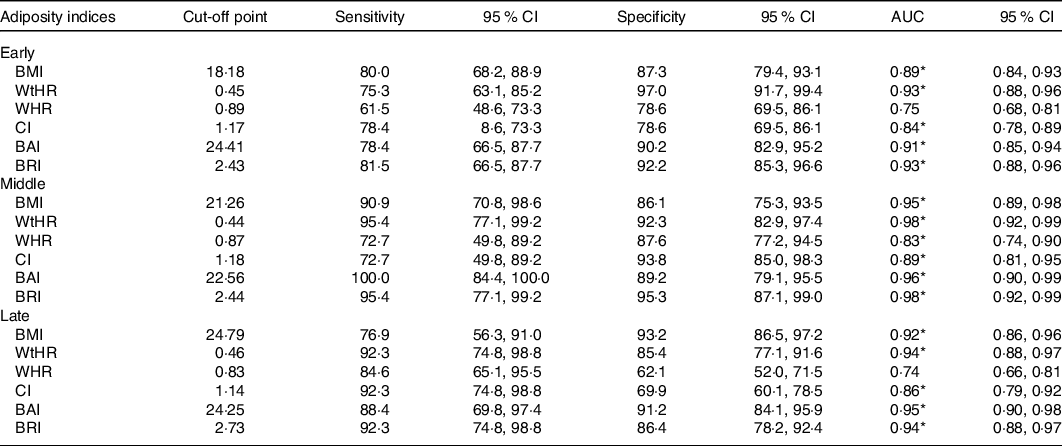
WtHR, waist:height ratio; WHR, waist:hip ratio; CI, conicity index; BAI, body adiposity index; BRI, body roundness index.
* AUC value rated very good or excellent (> 0·8).
† Early: 10–13 years; Middle: 14–16 years; Late: 17–19 years.
‡ Reference Method: DEXA.
§ All AUC values were significant (P < 0·05).
In girls, from 10 to 13 years old, the cut-off points of 18·03 kg/m2 for BMI, 0·46 for WtHR, 26·10 for BAI and 2·70 for BRI showed higher predictive capacity of excess body fat. Among those in the middle period, the values of 19·65 kg/m2 for BMI, 0·42 for WtHR, 25·30 for BAI and 2·12 for BRI had the best combinations between sensitivity and specificity. In those aged from 17 to 19 years, the ideal cut-off values were 20·66 kg/m2 for BMI, 0·44 for WtHR, 27·52 for BAI and 2·58 for BRI (Table 3).
In boys, in early adolescence, the ideal cut-off values for BMI were 18·18 kg/m2, 0·45 for WtHR, 24·41 for BAI and 2·43 for BRI. In the middle period, the cut-off point for BMI was 21·26 kg/m2, for WtHR 0·44, for BAI 22·56 and for BRI 2·44. In boys aged from 17 to 19 years, the cut-off points of 24·79 kg/m2 for BMI, 0·46 for WtHR, 24·25 for BAI and 2·73 for BRI showed better predictive capacity of excess body fat (Table 4).
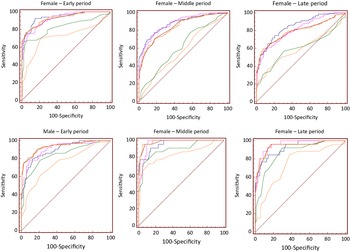
In female adolescents, BMI was the index with the highest predictive capacity for body fat in the three periods. In the early period, between BMI and WtHR, BRI and BAI, there was no difference (P > 0·05). In the middle period, the BMI and BAI showed the same value of AUC (P > 0·05). In the late, BMI was higher than all other indices (P < 0·05), although BAI displayed good predictive power for body fat (Fig. 1).
Comparison between the receiver operating characteristic (ROC) curves of adiposity indices used to predict body fat, according to the sex and period of adolescence (n 1188). ![]() , BMI;
, BMI; ![]() , WtHR;
, WtHR; ![]() , WHR;
, WHR; ![]() , CI;
, CI; ![]() , BAI;
, BAI; ![]() , BRI.
, BRI.
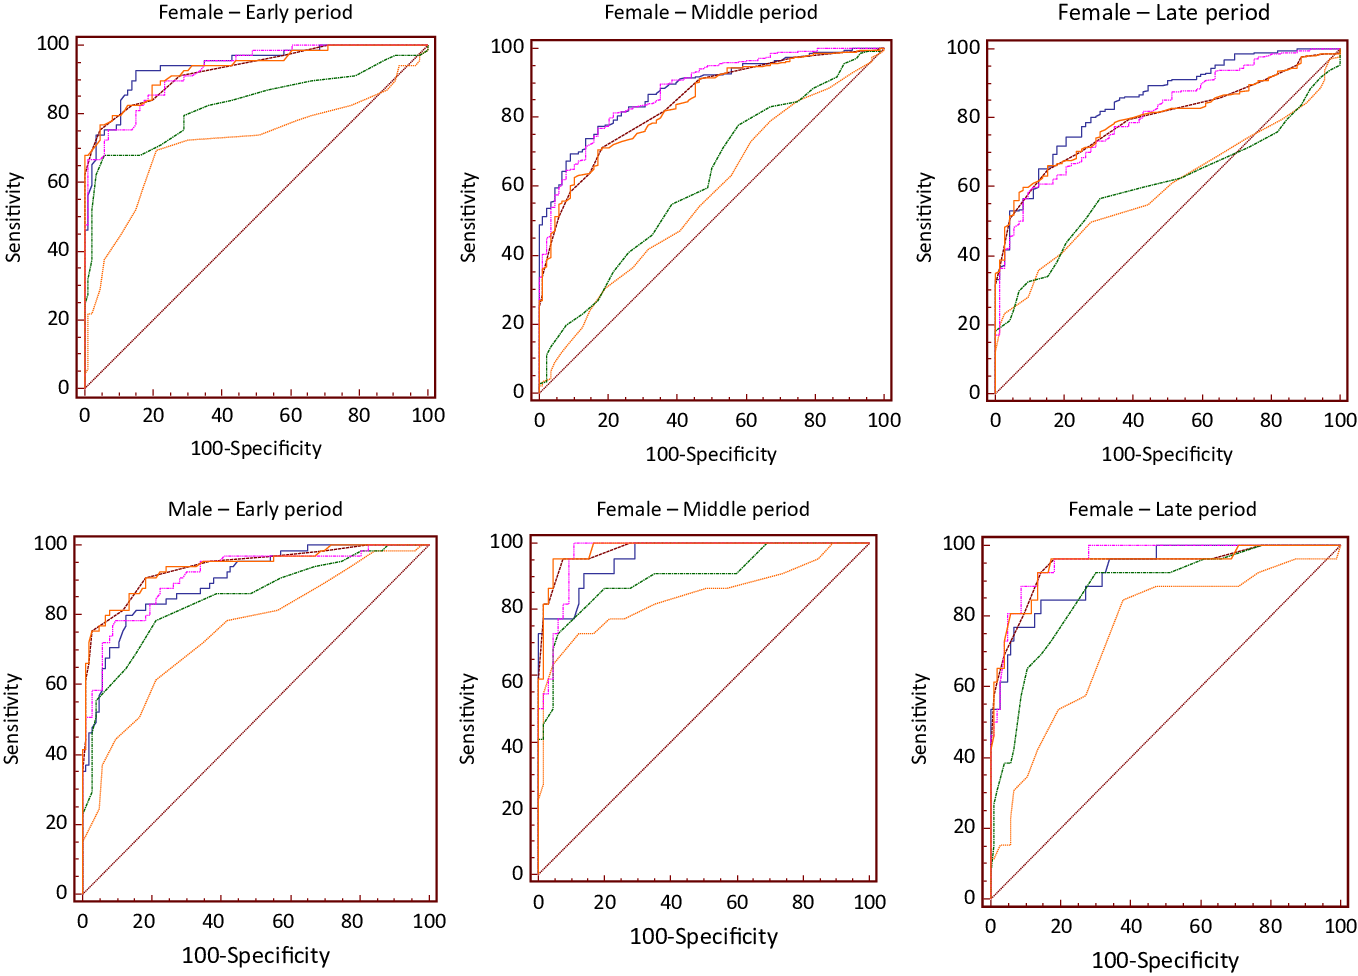
For males in the early period, WtHR and BRI showed better predictive capacity for body fat, with equal AUC value (P > 0·05). However, WtHR did not differ from BMI, BAI and BRI (P > 0·05), as well as BRI showed no difference for BAI and BMI (P > 0·05). BRI showed better capacity to predict body fat in the middle period, and it was similar to BMI, WtHR and BAI (P > 0·05). In the late, BAI showed higher value of AUC, being similar to BMI, WtHR, CI and BRI (P > 0·05) (Fig. 1).
Discussion
Among all anthropometric indices assessed, WtHR, BMI, BAI and BRI showed good capacity to predict the excess body fat estimated by DEXA in both sexes and in all periods of adolescence.
Most of the measures and indices assessed in this study showed higher values in female adolescents. In both sexes, most measures and indices showed differences between the periods of adolescence, except for WtHR and BRI. In addition, except for WHR and CI in girls, and WHR, CI, BAI and BF% (DEXA) in boys, the other indices had lower values in the early period.
Other studies assessing the nutritional status of adolescents in relation to age have found that younger individuals had a higher proportion of overweight, according to the BMI classification(Reference Gontijo, Faria and Oliveira30,Reference Costa, Barreto and Bleil31) . Contrary to what was observed in this study, in which was found that there was no difference in nutritional status classified by BMI in relation to the period of adolescence. However, higher prevalence of excess body fat was observed in adolescents aged 14 years or more, in both sexes.
In adolescence, body composition varies according to age, sexual maturation and physical growth, with physiological increase of adipose tissue, being higher in females, because this accumulation of body fat is essential for the beginning and maintenance of menstrual cycles and consequently for the reproductive process(Reference Sumi, Iwase and Nakamura2,Reference Costa, Barreto and Bleil31) . However, it should be considered that this is an age of many changes and therefore is a critical period for the development of obesity(Reference Cumpian-Silva, Rinaldi and Mazzeti32,Reference Guinhouya, Samouda and Beaufort33) . High-energy eating habits and sedentary lifestyles of adolescents in general may lead to excessive body fat accumulation and obesity(Reference Longo-Silva, Toloni and Menezes34,Reference Miranda, Amorim and Bastos35) . This condition may lead to the development of cardiometabolic diseases, which may originate in adolescence(Reference Cobayashi, Oliveira and Escrivão36,Reference Moraes and Veiga37) .
Changes in physical, cognitive and physiological development are influenced by genetics and environmental factors, so physical characteristics differ among individuals, with bone mass and the ratio between muscle tissue and adipose tissue vary according to sex and age. These differences make it difficult to adopt specific cut-off points for anthropometric indices in adolescence. Therefore, the assessment of body composition is necessary, and the identification of more accurate adiposity indices for estimating body fat and the determination of cut-off points for these indices, in this age group, are important to expand the methods of assessment and monitoring of overweight and obesity. These strategies are essential for disease prevention and health promotion in the adolescent population(Reference Motlagh, Seiyed and Zahra38,Reference Ribeiro, Kogure and Lopes39) .
Therefore, BMI should be used with caution, especially in adolescents, since during the growth spurt, this index may not reliably reflect increases in body fat. In addition, the detection of cardiometabolic risk factors in this age group is complex, mainly due to quick and intense variations that occur in body composition(Reference Telford, Cunningham and Abhayaratna40).
BMI is widely used as a surrogate measure of obesity. However, its calculation is not specific to assess body composition components, and its limitations should be considered(Reference Swainson, Batterham and Tsakirides41). A well-known limitation of BMI is that it does not distinguish between fat and lean mass(Reference Ripka, Orsso and Haqq18). Indeed, BMI has been shown to be a poor predictor of BF% in children and adolescents(Reference Vanderwall, Randall Clark and Eickhoff16).
Therefore, BMI should be used with caution, especially in adolescents, for during the growth spurt, this index does not reliably reflect increases in body fat(Reference Telford, Cunningham and Abhayaratna40). Perhaps, this is because neither the BMI nor other indicator or anthropometric indices have taken into account the changes caused by sexual maturation in the body composition of adolescents of each sex throughout the periods of this life phase. Since this is not an effective index for assessing excess body fat, it is also not effective for predicting cardiometabolic risk factors(Reference Ripka, Orsso and Haqq18,Reference Woolcott and Bergman19) .
A high prevalence of eutrophic adolescents with high BF% has been observed. In a meta-analysis that included thirty-seven studies comparing BMI with gold standard methods such as DEXA, the authors found that BMI had a sensitivity of 73 % to identify excess body fat in children and adolescents, concluding that more than a quarter of undiagnosed subjects with obesity due to BMI may have excess adiposity(Reference Javed, Jumean and Murad42). Another study showed that eutrophic adolescents with BMI and high BF% have high cardiometabolic risk factors similar to those with overweight by BMI and high BF%(Reference Serrano, Carvalho and Pereira43). Therefore, other anthropometric indices have been used to assess the adult population, but do not have well-defined cut-off points for adolescents.
WtHR demonstrates good predictive capacity for body fat and is a good index to be used in the adolescents’ assessment, as in the calculation height and waist are considered(Reference Alvarez, Vieira and Sichieri44,Reference Ashwell and Gibson45) . Pelegrini et al. (Reference Pelegrini, Silva and Silva46) assessed 1197 Brazilian adolescents and found that BMI and WHtR had a greater capacity to estimate body fat in both sexes, unlike CI, which as in this study, had the lowest values of AUC.
WHR did not perform well in the estimation of body fat, as in other study that showed that BMI and WC correlated with BF% in Swedish adolescents of both sexes, while WHR did not correlate well(Reference Neovius, Linne and Rossner47). Similar to Motlagh et al. (Reference Motlagh, Seiyed and Zahra38) who assessed 2444 adolescents aged from 12 to 14 years and observed that WC and WtHR show higher AUC than WHR in predicting overweight and obesity.
In adolescence, WHR is not a good parameter for assessing body composition because it uses hip measurement and it changes quickly during the growth spurt(Reference Alvarez, Vieira and Sichieri44). Similar to previous results, in male children and adolescents from Spain, BMI and WC had good capacity to estimate body fat, showing values of AUC above 0·80(Reference Sarría, Moreno and García-Llop48).
As observed in this study, Weiss et al. (Reference Weiss, Leal and Assis49) assessed Brazilian adolescents from 11 to 14 years old and found that the CI did not perform well to diagnose high body fat in female adolescents, with a value of AUC of 0·52. In boys, the value of the AUC was also low, 0·69, showing that CI was not a good predictor of high body fat.
Corroborating the results presented in this study, Frignani et al. (Reference Frignani, Passos and Ferrari50) found that the BAI showed association and high agreement with the BF% in adolescents, in both sexes. Studies assessing the performance of BAI and BRI to estimate body fat are scarce in the literature, especially conducted specifically with adolescents. In this study, both showed good capacity to predict body fat in this population. According to Thomas et al. (Reference Thomas, Bredlau and Bosy-Westphal23), BRI has better performance to estimate the percentage of total and visceral body fat compared with BMI and WC.
Authors state that BRI can be considered a better predictor of cardiovascular risk when compared with BMI, since it estimates the location of excess body fat, better reflecting the estimation of visceral fat, since its calculation considers the WC(Reference Thomas, Bredlau and Bosy-Westphal23,Reference Maessen, Eijsvogels and Verheggen51) .
The analysis of the ROC curves allowed to determine cut-off points for the assessed indices, to estimate the excess of body fat, considering this population in general and according to sex and period of adolescence. The AUC for BMI, WtHR, BAI and BRI were considered very good or excellent in adolescents in general, but most of these values were lower compared with those analysed by sex and period of adolescence. Assessing the accuracy of anthropometric indices to estimate body fat is necessary, especially in this age group and due to changes in body composition that occur during adolescence(Reference Sumi, Iwase and Nakamura2). We suggest the use of specific cut-off points for the various adiposity indices, according to the adolescent’s sex and age, in order to obtain a more accurate and reliable diagnosis of excess body fat.
The ideal cut-off values for predicting excess body fat for the assessed indices varied according to adolescent’s sexes and periods. Except for BMI, up to the present moment, no Brazilian study has proposed cut-off points for the other indices to be used in the adolescent population, considering sex and period of adolescence. Moreover, the known cut-off points for BMI are not specific for assessing excess body fat, as proposed and presented in this study for all indices.
The ideal BMI cut-off points increased with age in both sexes, as did BRI in males. In the middle period, the values for WtHR, BAI and BRI were lower in girls, as well as the WtHR and BAI in boys.
It is important to highlight that the ideal BMI cut-off values for the diagnosis of excess body fat in this population, in both sexes and all periods of adolescence, were below the cut-off point for overweight diagnosis according to WHO(Reference De Onis, Onyango and Borghi28) standards. Similarly, ideal values of WtHR cut-offs in girls and boys of all ages in this study were below 0·50, a value proposed to assess abdominal obesity regardless of age and sex(Reference Ashwell and Gibson45). This suggests that the biological risk associated with increased body fat may be underestimated in adolescents.
The range of the sample can be considered a limitation of the study, since adolescents from only one city were assessed. Also, studies have shown that there may be distinctions in body composition between different ethnicities(Reference Wang, Li and Lee52,Reference Heymsfield, Peterson and Thomas53) , although there is still no consensus on the subject(Reference Alenaini, Parkinson and McCarthy54). However, the study has a significant sample number and comprised the whole age group of adolescents of different races and socio-economic status. In addition, the study used a gold standard method for assessing body composition (DEXA). Thus, we noticed that the results presented could be used to assess the accumulation of body fat in adolescents, as well as to prevent risk factors for health and development of this population.
In conclusion, besides the BMI, the adiposity index, WtHR, BAI and BRI have shown to perform well to identify excess body fat in these adolescents. Considering the characteristics of each index evaluated, we identified that the best index to predict excess body fat in female adolescents aged from 10 to 13 years was the WtHR, whereas the BAI was the best to those aged between 14 and 19 years. In male adolescents, aged from 10 to 13 years and 14 to 16 years, the best index was the WtHR and the BAI showed better predictive capacity in boys from 17 to 19 years old.
The results of this study reinforce the importance of using indices with specific cut-off points for each period of adolescence and according to sex for the reliable diagnosis of excess body fat. It is advisable to use indices together to obtain a more accurate assessment. Thus, the WtHR and BAI are a low-cost and non-invasive method that is reproducible and reliable, with high sensitivity and specificity values and can be used together with the BMI. This allows an assessment and monitoring of the nutritional and health status of adolescents, in order to prevent the development of diseases at this age and into adulthood. However, further studies are necessary to confirm the reproducibility of the results.
Acknowledgements
The authors would like to thank the Fundação de Amparo à Pesquisa do Estado de Minas Gerais (FAPEMIG), Coordenação de Aperfeiçoamento de Pessoal de Nível Superior (CAPES) and Conselho Nacional de Desenvolvimento Científico e Tecnológico (CNPq).
This research received no specific grant from any funding agency, commercial or not-for-profit sectors.
N. S. M. worked on the design of the article, analysis and interpretation of the results, on the writing of the manuscript and approved the final version to be published, S. A. V. R. worked on the design, analysis and interpretation of the results, on the revision of the writing of the manuscript and approved the final version to be published, P. F. P. worked on the design, analysis and interpretation of the results, on the revision of the writing of the manuscript and approved the final version to be published, V. P. N. M. worked on the analysis and interpretation of the results, on the revision of the writing of the manuscript and approved the final version to be published, E. C. G. S. worked on the analysis and interpretation of the results, on the revision of the writing of the manuscript and approved the final version to be published, S. C. C. F. worked on the design, analysis and interpretation of the results, on the revision of the writing of the manuscript and approved the final version to be published and S. E. P. participated in the conception and design of the article, interpretation of results, revision of the writing of the manuscript and approved the final version to be published.
The authors declare that there are no conflicts of interest.