


Carnitine is a vitamin-like substance that plays a vital role in the β-oxidation of long-chain fatty acids (FA) to produce energy by transporting them from the cytosol to the mitochondrial matrix, via carnitine palmitoyltransferase 1 (CPT1)(Reference Bremer1, Reference Zammit, Ramsay and Bonomini2). Carnitine can be synthesised endogenously from lysine and methionine, mainly in the liver(Reference Bieber3–Reference Tanphaichitr and Broquist5). In mammals, a deficiency of carnitine causes dyslipidemia and severe lipid accumulation(Reference Pons and De Vivo6, Reference Scholte, Pereira and Jonge7), and carnitine has been used as a functional food additive to promote FA oxidation and treat metabolic diseases, such as diabetes and obesity(Reference Mingrone8–Reference Stephens, Constantin-Teodosiu and Laithwaite10). Analogous to its role in mammals, carnitine is thought to aid the maintenance of energy homeostasis in other land and aquatic animals when administered as a dietary supplement(Reference Harmeyer11, Reference Harpaz12). Therefore, carnitine is industrially produced as a drug or feed additive for clinical and nutritional use. However, industrial production yields both optical isomers of carnitine, l-carnitine and d-carnitine(Reference Vernez13–Reference Sánchez-Hernández, García-Ruiz and Crego15), and a mixture of the two (dl-carnitine) is widely sold. Many mammalian studies have shown that only l-carnitine has beneficial effects(Reference Liedtke, Nellis and Whitesell16–Reference Spasov, Iezhitsa and Pisarev18), while d-carnitine can interfere with the uptake and transport of l-carnitine(Reference Vernez13, Reference Paulson and Shug19), and therefore inhibit the β-oxidation of FA(Reference Spasov and Iezhitsa20, Reference Leichter, Ottem and Hahn21), which has a hepatotoxic effect(Reference Arafa22). However, studies of the functions of l- and d-carnitine in aquatic animals have yielded contradictory results to date(Reference Santulli and D’Amelio23, Reference Du, Liu and Tian24).
High-energy diets are now widely fed to farmed fish, which has led to a number of metabolic diseases, especially severe fat accumulation, developing in various fish species, leading to adverse effects on their growth and health(Reference Wang, Liu and Tian25, Reference Du, Clouet and Huang26). Therefore, there is a great deal of interest in identifying means of increasing lipolysis to supply energy in the form of FA and to alleviate excess lipid accumulation in fish. Carnitine has been used as a lipid-lowering feed additive in farmed fish since the 1980s. A number of studies have shown that l-carnitine can efficiently reduce tissue lipid deposition in some fish species; however, it does not affect body lipid content or growth performance in other species, and actually increases hepatic content in a few(Reference Li, Li and Qin27). In fact, in practical aquaculture, dl-carnitine is more commonly used in feeds. However, the nutritional effects of d-carnitine have only been evaluated in sea bass, and the results showed that d-carnitine reduces growth performance and increases tissue lipid content (in liver and muscle); in addition, the regulatory mechanism of d-carnitine on nutritional metabolism in fish was not yet known now(Reference Santulli and D’Amelio23, Reference Santulli and D’Amello28). Interestingly, a number of studies have shown that dl-carnitine has a similar effect in many fish species to l-carnitine to reduce whole-body lipid content, when used at the same dose(Reference Du, Liu and Tian24, Reference Tian, Leng and Li29). These contradictory results have discouraged the use of carnitine in aquafeed, and therefore it would be of great interest to precisely distinguish the effects of l- and d-carnitine on nutrient metabolism in fish.
In addition, it has been difficult to compare the effects of l- and d-carnitine supplementation, because it has not been possible to eliminate the background of endogenous l-carnitine in vivo. Under most physiological conditions, endogenous carnitine biosynthesis may be sufficient to maintain adequate tissue concentrations(Reference Ozorio30), and therefore dietary supplementation with d-carnitine might only be partially able to affect l-carnitine concentration in particular tissues. For example, in the rat, dietary d-carnitine supplementation reduces endogenous l-carnitine levels in heart and skeletal muscle by >50 % and in kidney by <30 %, but not at all in the liver, brain or plasma(Reference Paulson and Shug19). Furthermore, previous work in mammals and zebrafish has shown that mitochondrial β-oxidation of FA is not efficiently inhibited when the endogenous carnitine concentration is reduced by ≤50 %(Reference Heinonen and Takala31, Reference Li, Li and Qin32). Therefore, the effects of d-carnitine on metabolism are difficult to investigate using standard animal models, meaning that the individual metabolic effects of l- and d-carnitine supplementation in animals have not been fully determined to date.
Therefore, we aimed to establish a low-carnitine model to investigate the effects of feeding dietary l- or d-carnitine on metabolism. Mildronate (3-(2,2,2-trimethylhydrazinium) propionate; MD) is a structural analogue of a precursor in l-carnitine synthesis (γ-butyrobetaine), which has been used to establish mammalian models of mitochondrial dysfunction, in which endogenous carnitine biosynthesis is efficiently inhibited(Reference Simkhovich, Shutenko and Meirena33). Recently, we have established MD-induced low-carnitine models in zebrafish and Nile tilapia, in which endogenous carnitine concentrations were only approximately 10 % of control levels(Reference Li, Li and Qin32, Reference Pan, Li and Li34).
In order to precisely distinguish the effects of l- and d-carnitine on systemic nutrient metabolism, we first established a low-carnitine Nile tilapia model, which is a useful model for the study of nutrient metabolism and for which there is a great deal of available genomic information(Reference Richard, Michaelle and Naoual35). Diets containing 0·4 g/kg l- or d-carnitine were fed to low-carnitine fish for 6 weeks, after which growth, dietary use and organ biochemistry were assayed, and gene expression analysis and liquid chromatography-mass spectrometry (LC-MS)-based metabolomics were performed. The data show that compared with l-carnitine, d-carnitine inhibits lipid catabolism and causes lipotoxicity. In addition, metabolomic and gene expression analyses together showed the induction of systemic metabolic changes by d-carnitine. To the best of our knowledge, this is the first study to illustrating the different effects of l- and d-carnitine on nutrient metabolism in an animal with a relatively low-carnitine background.
Experimental methods
Animal ethics
All experiments were conducted under the Guidance of the Care and Use of Laboratory Animals in China. The present study was approved by the Committee on the Ethics of Animal Experiments of East China Normal University.
Fish, diets and sampling
More than 600 juvenile Nile tilapia were purchased from Shanghai Ocean University (Shanghai, China). Before the formal experiment, the fish were acclimated for 2 weeks, during this period they were fed on a commercial diet (protein 37·1 %, lipid 10·9 %) (Shenyang, China). To establish the low-carnitine tilapia model and perform the experimental design, two experimental stages were followed as shown in Fig. 1. Accordingly, four diets were prepared: basal diet, basal diet adding mildronate propionate (MD, 25 g/kg diet), basal diet adding MD (25 g/kg diet) and l-carnitine (0·4 g/kg diet) and basal diet adding MD (25 g/kg diet) and d-carnitine (0·4 g/kg diet). To prepare the diets, MD, l-carnitine and d-carnitine were firstly dissolved in water and then mixed with the ingredients of the basal diet. The formulations of the diets are listed in online Supplementary Table S1.
Design and the protocol of the present experiment. W, weeks; MD, mildronate (3-(2,2,2-trimethylhydrazinium) propionate).
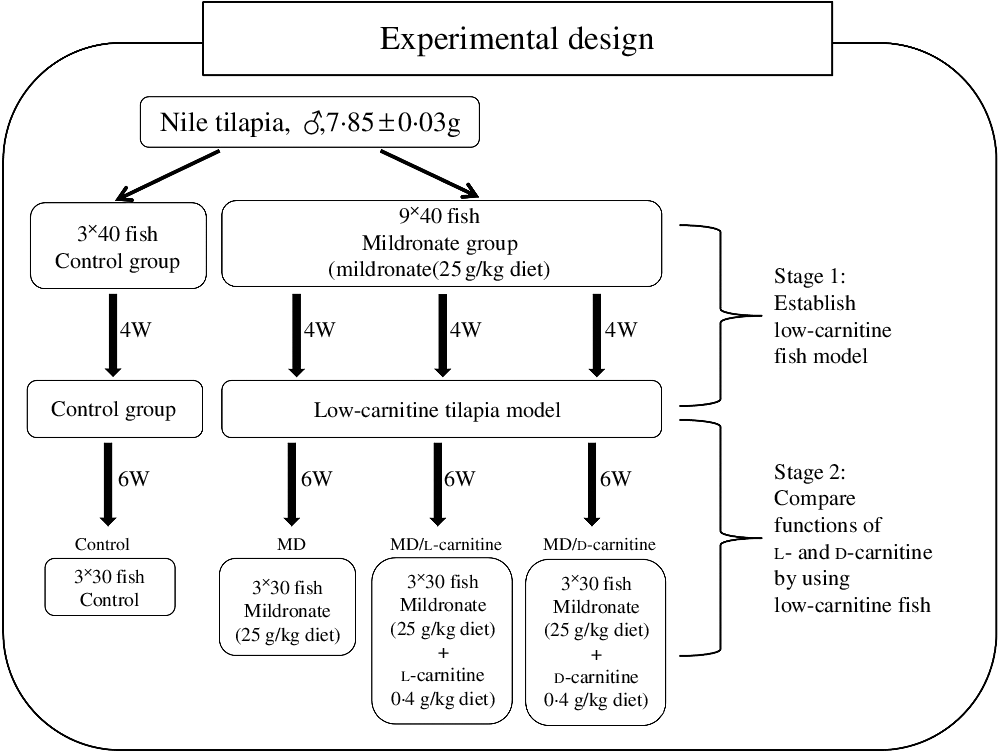
After the acclimation, the first stage of the experiment was conducted to establish the low-carnitine tilapia model as we recently reported(Reference Li, Li and Qin32, Reference Pan, Li and Li34). In this stage, 480 fish were randomly divided into two groups (control group and MD group) and fed with the basal diet and basal diet adding MD (25 g/kg diet) at 4 % body weight, respectively. The control group contained three tanks, while the MD group had nine tanks, and each tank contained forty fish. After 4 weeks, only ten fish from each tank were anesthetised using the MS-222 at 20 mg/l, sampling for the liver, muscle, visceral adipose tissue and plasma to calculate the hepatosomatic index, intraperitoneal fat index and tissue concentration of carnitine. During this stage, the photoperiod was 12 h/12 h, and the temperature was kept at 26 ± 2°C. The weight of the fish in each tank was recorded once a week, and the feeding amount was adjusted correspondingly.
The second stage of the experiment was to evaluate the different functions between l- and d-carnitine in nutritional metabolism. The MD-treated fish from the first stage were randomly divided into three groups: MD group (MD), MD + l-carnitine group (MD/l-carnitine) and MD + d-carnitine group (MD/d-carnitine). Fish from each dietary group were distributed in three tanks (thirty fish per tank) and fed 4 % body weight for 6 weeks. The experimental conditions were similar as in the first stage. Thereafter, fish were fasted for 12 h and anesthetised (MS-222 at 20 mg/l) for sample collection of plasma, liver, muscle and visceral adipose tissue. All samples were frozen with liquid N2 and then stored at –80°C until use for molecular and biochemical assays.
Carnitine concentration assay
After the whole feeding trial, parts of the liver and muscle of six fish were collected from each group, accurately weighted and homogenised by distilled water (1:10, w/v). The tissue homogenate was centrifuged at room temperature, 2000 rpm for 15 min. A 100 μl aliquot of tissue homogenate supernatant was first incubated by using 50 μl KOH (1 mol/l) at 37°C for 30 min to fully hydrolyse the combined carnitine, and 10 μl HCl (1 mol/l) was then added to neutralise the solution (sample A). A total of 60 μl distilled water was added directly into another 100 μl aliquot of tissue homogenate (sample B). Protein in samples A and B was removed by precipitating with 200 μl of cold acetonitrile (containing 1 μg/ml carbachol, the internal standard) and centrifuged at 16 900 g for 20 min. The 1 μl of the supernatant was injected for LC-MS/MS analysis. Total carnitine was defined as the concentration of carnitine in sample A, free carnitine was defined as the concentration of carnitine in sample B, and acyl-carnitine was defined as total carnitine minus free carnitine (A minus B). The details of LC-MS measurements were reported in our recent publication(Reference Li, Li and Qin27). The measurement of serum carnitine was similar to the testing of the tissue carnitine.
Biochemical composition of whole fish and tissues
The crude lipid of the liver and muscle was extracted and measured using methanol and chloroform (1:2, v/v) as previously described(Reference Folch, Lees and Sloane36, Reference Lambert and Dehnel37). The glycogen content of liver was assessed by the commercial kit (Jiancheng Biotech Co.). The crude protein of the liver, muscle and whole fish was measured by KjeltecTM 8200 (FOSS). The serum TAG content, malondialdehyde, superoxide dismutase, glucose and total amino acids were measured by using specific commercial kits (Jiancheng Biotech Co.).
Histological analysis
Pieces of liver (5 × 5 mm) were fixed in 4 % paraformaldehyde and embedded in paraffin as described previously(Reference Betancor, Sprague and Sayanova38). Sections of 5 μm thickness were stained with haematoxylin and eosin. The paraffin sectioning and haematoxylin and eosin staining of visceral adipose tissue were performed as described(Reference Du, Ma and Lock39). Histology of the two tissues was observed and photographed by Olympus BX53.
Quantitative real-time PCR
Total RNA was isolated by using a Tri Pure Reagent (Aidlab). The quality and quantity of total RNA were tested by NANODROP 2000 Spectrophotometer (Thermo). The cDNAs of tissues total RNA were synthesised using a PrimerScriptTM RT reagent Kit with a gDNA Eraser (Perfect Real Time) (Takara) by S1000TM Thermal Cycler (Bio-Rad). Elongation factor 1α (ef1α) and β-actin were used as the reference genes. The primers of all testing genes for quantitative PCR (qPCR) were listed in online Supplementary Table S2. The qPCR assay was carried out as described previously(Reference He, Ning and Chen40).
Metabolomics assay of liver samples
The accurately weighed liver samples (20 mg/sample) from d- or l-carnitine-treated fish were prepared to grind in the cooled tube with internal standard and 80 % methanol, and ultrasonicated after vortexed. Samples were then centrifuged at 4°C, 14 000 rpm for 10 min. A volume of 200 μl of the supernatants from each tube was collected by using crystal syringes, filtered through 0·22 μm microfilters and transferred to LC vials.
For the LC-MS assay, the LC-MS (ACQUITY UHPLC system Ultimate 3000 coupled with LTQ Orbitrap MS, Thermo Fisher Scientific) was used to acquire the original MS data, and then the further multivariate data were analysed by the software XCMS (TSRI), Excel 2007 (Microsoft) and SIMCA (version 14.0, Umetrics). The data (VIP >1, P <1) were selected to identify the differential metabolites, explain biological roles and construct metabolic pathway by One-step Solution for Identification of Small Molecules in Metabolomics Studies software (Chinese Academy of Sciences and Dalian ChemData Solution Information Technology, China), HMDB (http://www.hmdb.ca/) and METLIN (https://metlin.scripps.edu/), and Kyoto Encyclopedia of Genes and Genomes (KEGG) (http://www.genome.jp/kegg/). The above metabolomics assay was performed with some modification from the methods of the previous study( Reference Zhang, Zhou and Zhao41 ). The detailed procedures of liver metabolomics assay are described in the online Supplementary Experimental procedures.
Statistical analyses
All the results are presented as means with their standard errors (n 4–6). The independent-samples t test was performed to evaluate the significant difference (P < 0·05) of variables between the control and MD groups in the establishment of low-carnitine tilapia. In the data of evaluation of the different functions of l- and d-carnitine, significant differences (P < 0·05) of each variable were firstly detected using the one-way ANOVA test, followed by Duncan’s multiple range test to estimate the differences. All analyses were conducted using the SPSS Statistics 19.0 software (IBM).
Results
Establishment of low-carnitine tilapia
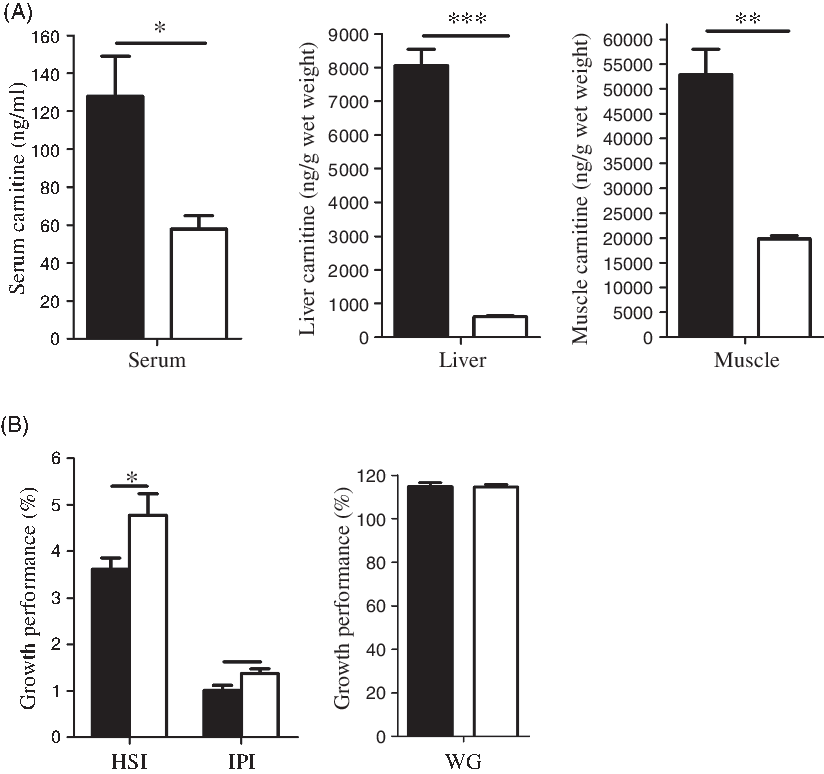
After 4 weeks of feeding with MD (1000 mg/kg body weight per d), a low-carnitine fish model had been successfully established, evidenced by the large reductions in serum, liver and muscle concentrations of free carnitine, and the greater mass of adipose tissue and the liver (Fig. 2(A)). Throughout the 4-week feeding period, both control and MD-treated fish remained visually in good health, and there was no significant growth difference between the two groups (Fig. 2(B)). These low-carnitine tilapias were then used in a subsequent 6-week experiment to investigate the metabolic effects of l- and d-carnitine, which were individually added to the MD diet.
Establishment of low-carnitine tilapia at the 4th week. (A) Free carnitine concentration in serum, liver and muscle; (B) growth performance (hepatosomatic index (HSI), intraperitoneal fat index (IPI), weight gain (WG)). Values are means (n 6), with their standard errors represented by vertical bars. Mean values are significantly different: *P < 0·05, **P < 0·01, ***P < 0·001. ![]() , Control;
, Control; ![]() , mildronate.
, mildronate.
d-Carnitine is associated with lower acyl-carnitine synthesis than l-carnitine and is metabolised by detoxification pathways
After 6 weeks, neither the MD/l-carnitine nor the MD/d-carnitine diet affected growth, when compared with MD fish (data not shown). In serum, MD fish had the lowest free carnitine concentration (40 ng/ml) (Fig. 3(A)). Both l- and d-carnitine supplementation significantly increased the free carnitine content in serum of MD fish to 108 and 98 ng/ml, respectively, which were similar as the free carnitine concentration in serum of control fish (109 ng/ml) (Fig. 3(A)). However, only l-carnitine supplementation could increase the serum concentration of acyl-carnitine, which is the physiological form of carnitine used in the acyl-carnitine shuttle across the mitochondrial membranes, to the normal level as that in control tilapia (123 v. 141 ng/ml, control v. MD/l-carnitine), whereas the serum concentration of acyl-carnitine in MD and MD/d-carnitine groups was low and comparable (40 v. 39 ng/ml, MD v. MD/d-carnitine) (Fig 3(A)). Similarly, in liver, both l- and d-carnitine supplementation increased the free carnitine concentration in the low-carnitine tilapia more than three-fold (1795 v. 9018 v. 8797 ng/g, MD v. MD/l-carnitine v. MD/d-carnitine) (Fig. 3(A)), but only l-carnitine increased the hepatic concentration of acyl-carnitine with about two times more being present than in the MD or MD/d-carnitine-fed fish (10 822 v. 3522 v. 5482 ng/g, MD/l-carnitine v. MD v. MD/d-carnitine) (Fig. 3(A)). In contrast to the sensitivity to isomer-specific effects of carnitine in the liver, there were no significant differences in free carnitine or acyl-carnitine concentrations in muscle among all the groups of fish (Fig. 3(A)).
Effect of l-carnitine and d-carnitine on the carnitine concentration and detoxification of the low-carnitine tilapia. (A) Free carnitine and acyl-carnitine in serum, liver and muscle. (B) Genes related to detoxification in liver and muscle. Values are means (n 6), with their standard errors represented by vertical bars. a,b Mean values with unlike letters are significantly different (P < 0·05). CYP1A, cytochrome P450 1A; HSP70, heat shock protein 70. ![]() , Control;
, Control; ![]() , mildronate;
, mildronate; ![]() , mildronate/l-carnitine;
, mildronate/l-carnitine; ![]() , mildronate/d-carnitine.
, mildronate/d-carnitine.
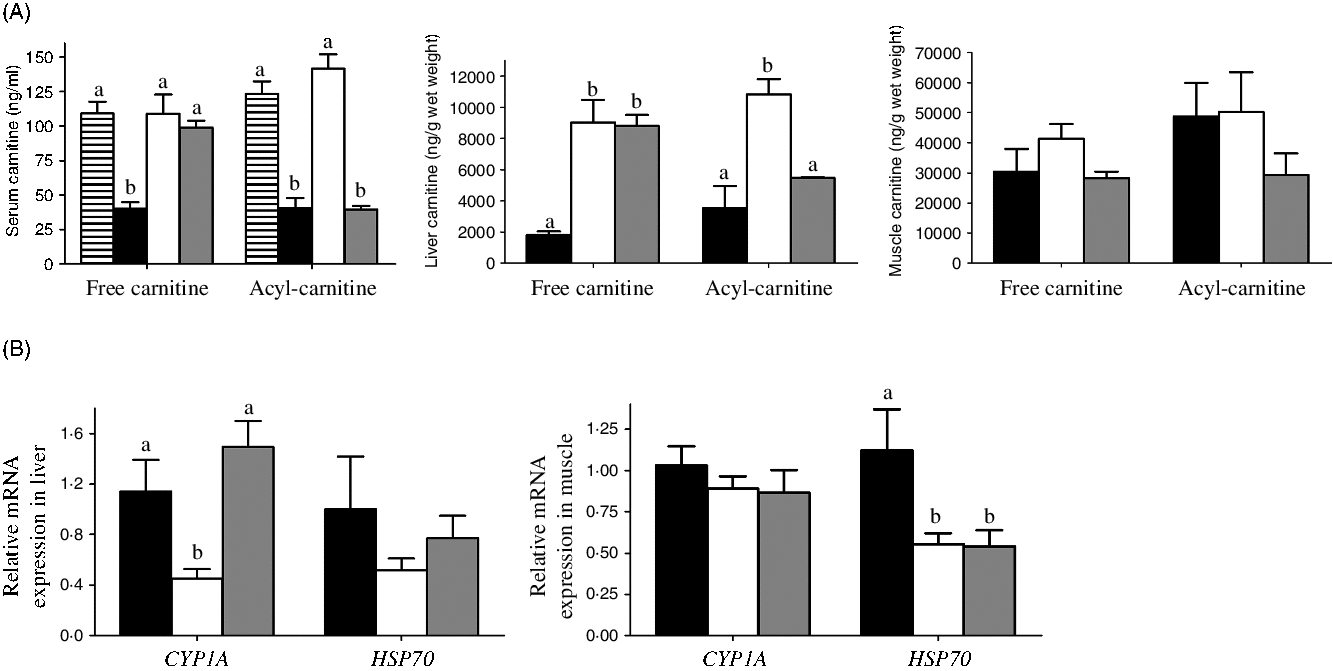
Markers of xenobiotic detoxification were also assayed (Fig. 3(B)). In the liver, the MD/l-carnitine group had significantly lower expression of cytochrome P450 family 1 subfamily A (CYP1A) than the MD or MD/d-carnitine groups. A similar trend was identified with respect to liver heat shock protein 70 (HSP70), but this did not reach significance. In muscle, the expression of CYP1A was comparable among the groups, whereas the l- and d-carnitine groups showed significantly lower expression of HSP70.
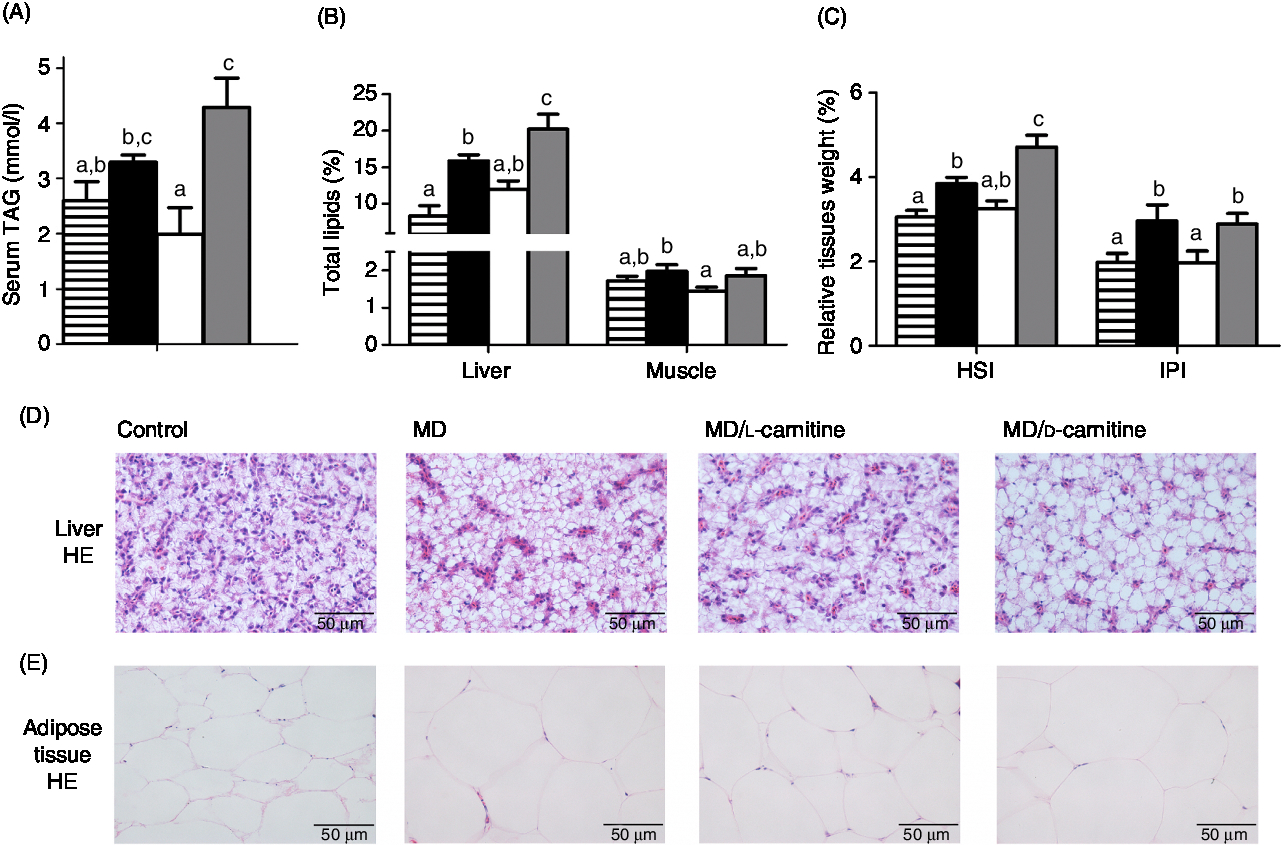
d-Carnitine causes greater lipid deposition and expression of genes involved in the β-oxidation of fatty acids than l-carnitine
As shown in Fig. 4, among the four groups, the control and MD/l-carnitine groups displayed lower serum TAG concentration (Fig. 4(A)) and lipid content in liver and muscle (Fig. 4(B)) than the MD and MD/d-carnitine groups (serum TAG: 2·60 v. 1·99 v. 3·30 v. 4·29 mmol/l, liver lipid: 8·33 v. 11·97 v. 15·89 v. 20·21 %, muscle lipid: 1·72 v. 1·44 v. 1·98 v. 1·86 %, control v. MD/l-carnitine v. MD v. MD/d-carnitine). The MD/d-carnitine group had the significantly higher serum TAG concentrations and liver lipid content than those in the MD/l-carnitine group, and also had significantly higher liver lipid content than that in the MD group. As a consequence, the nearly masses of the liver and adipose tissue in the control and MD/l-carnitine group were lower than the other two groups, but the MD/d-carnitine group had the highest liver mass (Fig. 4(C)). These trends were also reflected in histological images of the liver and adipose tissue, which showed that the control and l-carnitine group had the lower, and d-carnitine the highest, degree of lipid accumulation in the liver and adipose tissue (Fig. 4(D) and (E)). Thus, l-carnitine feeding reduced the lipid content of the liver, adipose tissue and serum to the normal level, but d-carnitine did not.
Effect of l-carnitine and d-carnitine on tissue lipid deposition. (A) TAG in serum; (B) total lipids in liver and muscle; (C) liver and adipose tissue weight; (D) liver histological characteristics (haematoxylin and eosin (HE) stain); (E) adipose tissue histological characteristics (HE stain). Values are means (n 6), with their standard errors represented by vertical bars. a,b,c Mean values with unlike letters are significantly different (P < 0·05). HSI, hepatosomatic index; IPI, intraperitoneal fat index. ![]() , Control;
, Control; ![]() , mildronate (MD);
, mildronate (MD); ![]() , MD/l-carnitine;
, MD/l-carnitine; ![]() , MD/d-carnitine.
, MD/d-carnitine.
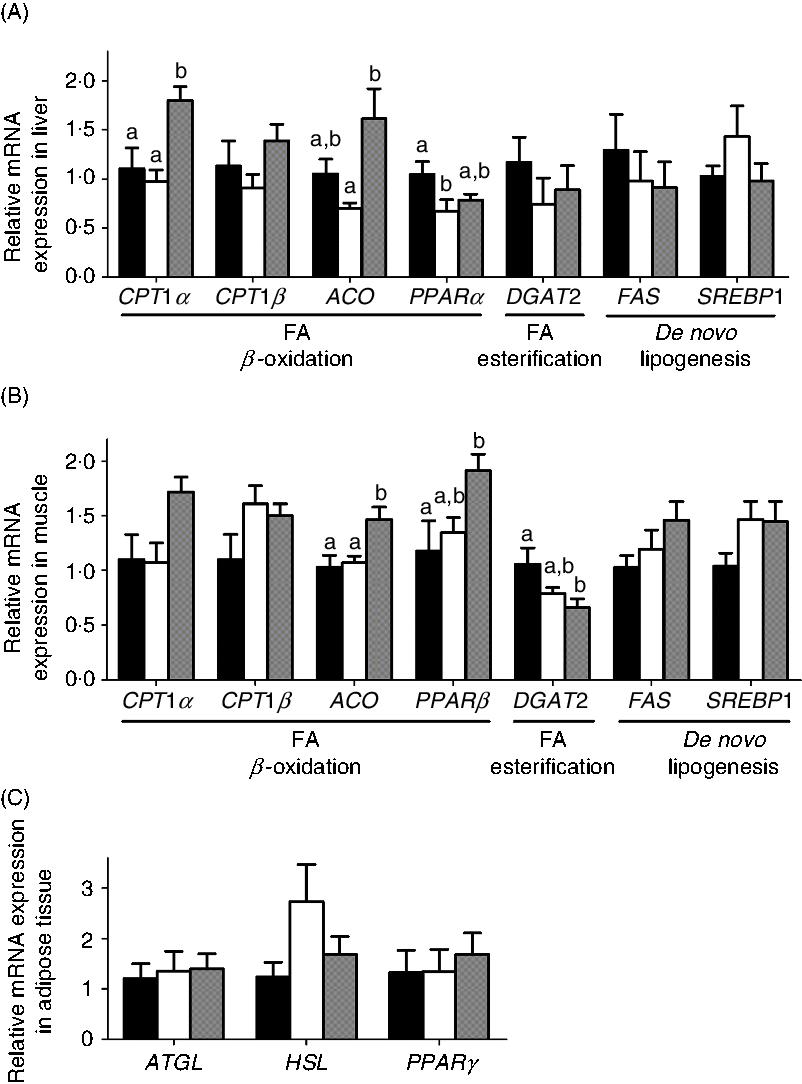
The mRNA expression of genes involved in lipid metabolism in liver, muscle and adipose is shown in Fig. 5. Interestingly, the MD and MD/l-carnitine groups showed similar expression levels of genes involved in lipid catabolism. In contrast, diacylglycerol O-acyltransferase 2 (DGAT2), the gene responsible for FA esterification, fatty acid synthase (FAS) and sterol regulatory element-binding transcription factor 1 (SREBP1), which are critical for de novo lipogenesis, showed similar levels of expression in the l- and d-carnitine groups. However, MD/d-carnitine treatment was associated with significantly higher mRNA expression of CPT1α and acyl-CoA oxidase (ACO) in the liver and muscle, and PPARβ in muscle, than l-carnitine or MD. These genes all encode proteins that are involved in mitochondrial or peroxisomal β-oxidation.
Effect of l-carnitine and d-carnitine on the mRNA expression of lipid metabolism. (A) Liver lipid metabolism; (B) muscle lipid metabolism; (C) adipose tissue lipid metabolism. Values are means (n 6), with their standard errors represented by vertical bars. a,b Mean values with unlike letters are significantly different (P < 0·05). CPT1, carnitine palmitoyltransferase 1; ACO, acyl-CoA oxidase; DGAT2, diacylglycerol O-acyltransferase 2; FAS, fatty acid synthase; SREBP1, sterol regulatory element binding transcription factor 1; FA, fatty acid; ATGL, adipose TAG lipase; HSL, hormone-sensitive lipase. ![]() , Mildronate;
, Mildronate; ![]() , mildronate/l-carnitine;
, mildronate/l-carnitine; ![]() , mildronate/d-carnitine.
, mildronate/d-carnitine.
d-Carnitine stimulates higher glucose utilisation than l-carnitine
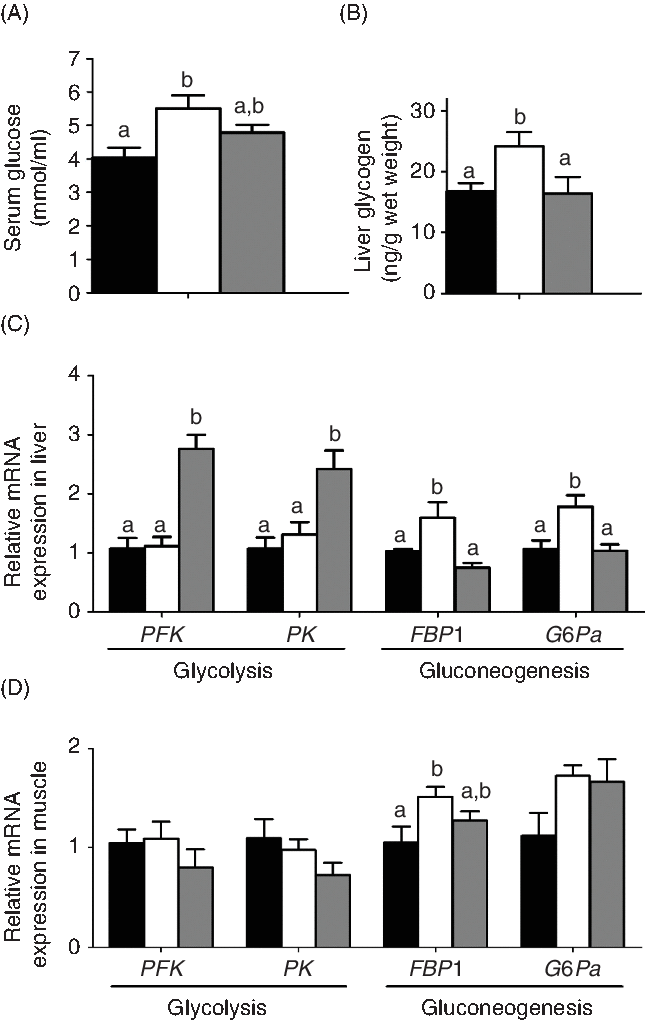
The effects of the two carnitine isomers on glucose metabolism are shown in Fig. 6. The MD/l-carnitine group showed the highest concentrations of serum glucose and liver glycogen of the three groups, but serum glucose was not significantly different in the MD/l-carnitine and MD/d-carnitine groups (Fig. 6(A) and (B)). Consistent with this, there were also differences in the expression of genes involved in glucose metabolism. In the liver, MD/l-carnitine significantly increased the mRNA expression of the gluconeogenic enzymes fructose-1,6-bisphosphatase 1 (FBP1) and glucose-6-phosphatase α (G6Pα), while higher expression of the glycolytic enzymes phosphofructokinase and pyruvate kinase was found in the MD/d-carnitine group (Fig. 6(C)). In muscle, higher expression of FBP1 and G6Pα was also found in the MD/l-carnitine group.
Effect of l-carnitine and d-carnitine on glucose metabolism. (A) Serum glucose; (B) glycogen in liver; (C) liver glucose metabolism; (D) muscle glucose metabolism. Values are means (n 6), with their standard errors represented by vertical bars. a,b Mean values with unlike letters are significantly different (P < 0·05). PFK, phosphofructokinase; PK, pyruvate kinase; FBP1, fructose-1,6-bisphosphatase 1; G6Pα, glucose-6-phosphatase-α. ![]() , Mildronate;
, Mildronate; ![]() , mildronate/l-carnitine;
, mildronate/l-carnitine; ![]() , mildronate/d-carnitine.
, mildronate/d-carnitine.
l- and d-carnitine do not significantly affect protein metabolism
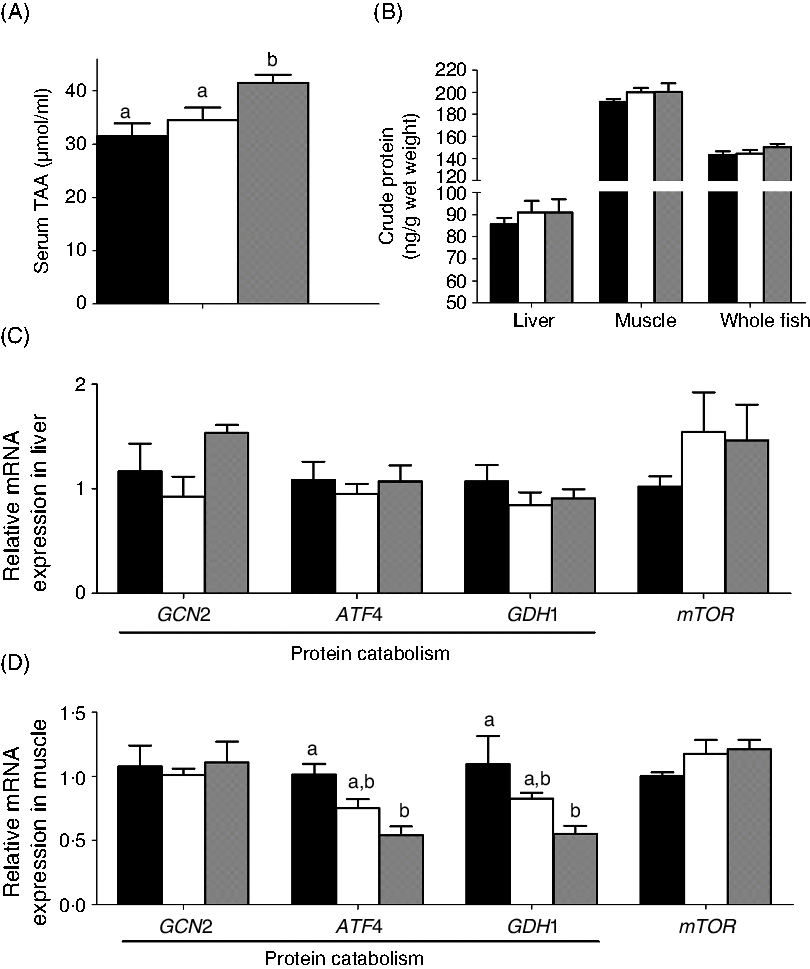
The effects of the two carnitine isomers on protein metabolism are presented in Fig. 7. Only MD/d-carnitine significantly increased total amino acids (Fig. 7(A)), but the total protein content of liver, muscle and whole fish were comparable among the three groups (Fig. 7(B)). The mRNA expression of genes involved in protein metabolism was unaffected by the type of carnitine fed (genes involved in protein catabolism: initiation factor 2 kinase (GCN2), activating transcription factor 4 (ATF4), and glutamate dehydrogenase 1 (GDH1); genes involved in synthesis: mechanistic target of rapamycin (mTOR)) in liver. In muscle, the MD/d-carnitine group demonstrated lower expression of the protein catabolism genes ATF4 and GDH1 than the MD group. However, considering the comparable protein content of the whole body and tissues, it is clear that l- and d-carnitine do not differentially affect protein metabolism.
Effect of l-carnitine and d-carnitine on protein metabolism. (A) Serum total amino acids (TAA); (B) crude protein in tissues and whole body; (C) liver protein metabolism; (D) muscle protein metabolism. Values are means (n 6), with their standard errors represented by vertical bars. a,b Mean values with unlike letters are significantly different (P < 0·05). GCN2, initiation factor 2 kinase; ATF4, activating transcription factor 4; GDH1, glutamate dehydrogenase 1; mTOR, mechanistic target of rapamycin. ![]() , Mildronate; □, mildronate/l-carnitine;
, Mildronate; □, mildronate/l-carnitine; ![]() , mildronate/d-carnitine.
, mildronate/d-carnitine.
d-Carnitine has the potential to cause more severe inflammation, oxidative stress and apoptosis than l-carnitine
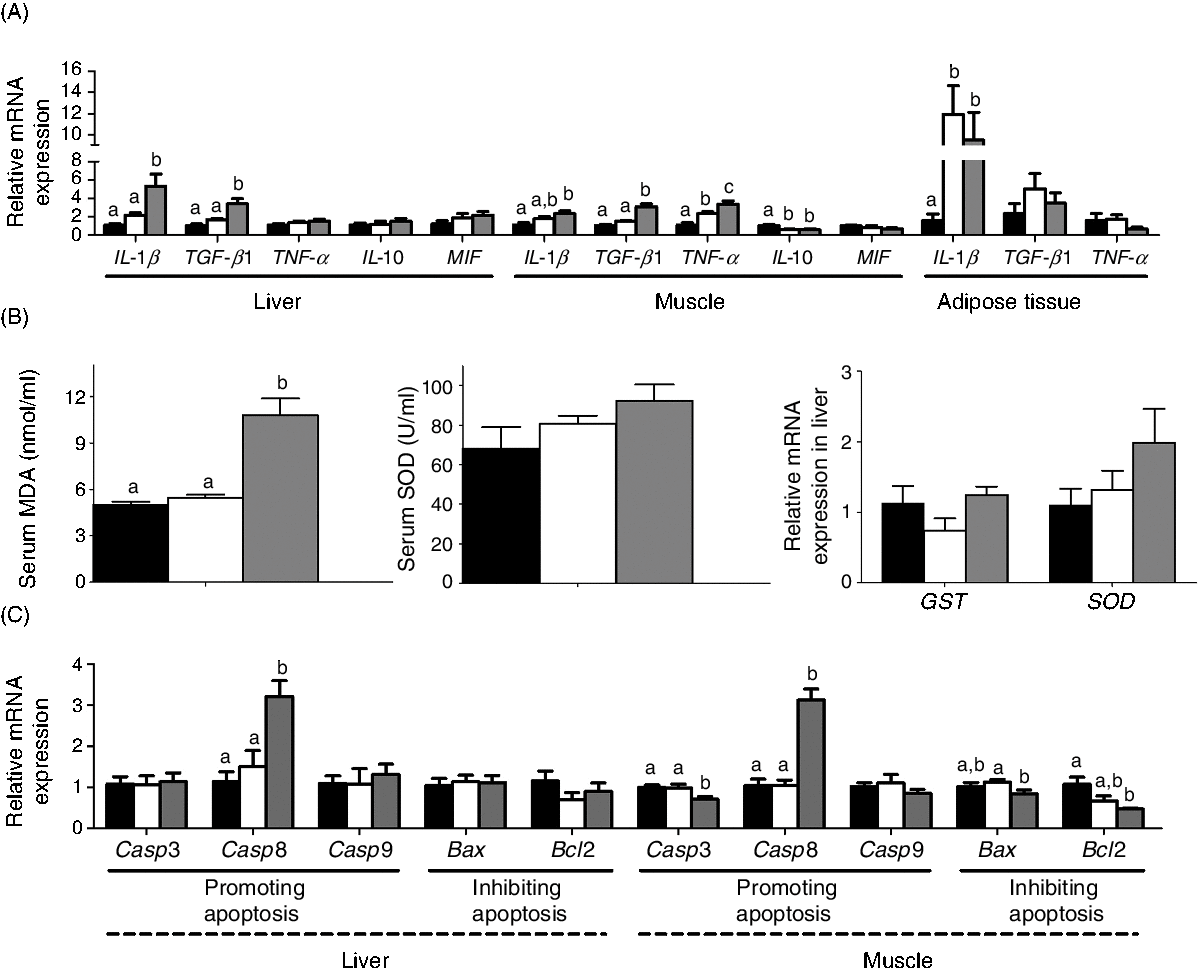
The mRNA expression of the genes involved in inflammation, oxidative stress and apoptosis is shown in Fig. 8. MD/d-carnitine induced higher expression of pro-inflammatory factors, particularly IL-1β and transforming growth factor β1 (TGF-β1) in liver and muscle, and TNF-α in muscle, than MD/l-carnitine and MD (Fig. 8(A)). However, MD/l-carnitine feeding only caused higher expression of TNF-α in muscle and IL-1β in adipose tissue than MD. Similarly, MD/d-carnitine feeding resulted in higher serum concentrations of peroxidation products (malondialdehyde) and tended to increase the mRNA expression of the antioxidant enzymes glutathione S-transferase and superoxide dismutase in the liver. However, MD/l-carnitine and MD feeding was associated with similar levels of these oxidative stress markers (Fig. 8(B)). d-Carnitine also induced higher hepatic mRNA expression of caspase 8 (Casp8), a marker of apoptosis, and lower muscle mRNA expression of B-cell lymphoma 2 (Bcl2), an anti-apoptosis protein, than MD and MD/l-carnitine feeding (Fig. 8(C)). Although MD/d-carnitine also reduced the mRNA expression of caspase 3 (Casp3) and BCL2-associated X (Bax) in muscle (Fig. 8(C)), the marked up-regulation of Casp8 implies a greater potential for apoptosis in the MD/d-carnitine group.
Effect of l-carnitine and d-carnitine on inflammation, oxidative stress and apoptosis. (A) Genes related to inflammation; (B) serum malondialdehyde (MDA) and superoxide dismutase (SOD), mRNA expression of glutathione S-transferase (GST) and SOD; (C) genes related to apoptosis. Values are means (n 6), with their standard errors represented by vertical bars. a,b,c Mean values with unlike letters are significantly different (P < 0·05). TGF-β1, transforming growth factor β1; MIF, macrophage migration inhibitory factor; Casp3, caspase 3; Casp8, caspase 8;Casp9, caspase 9; Bax, BCL2-associated X; Bcl2, B-cell lymphoma 2. ![]() , Mildronate; □, mildronate/l-carnitine;
, Mildronate; □, mildronate/l-carnitine; ![]() , mildronate/d-carnitine.
, mildronate/d-carnitine.
Metabolomic analysis reveals distinct metabolic responses to the feeding of d- and l-carnitine
A metabolomic analysis was performed to further aid understanding of the contrasting effects of l- and d-carnitine in the liver of low-carnitine tilapia. The score plots of the orthogonal partial least squares discriminant analysis (OPLS-DA) model show that all the samples from the d-carnitine and l-carnitine-treated groups were within the 95 % Hotelling T2 ellipse, and that the metabolomic profiles of l- and d-carnitine groups were clearly separated (Fig. 9(A)), implying differing metabolomic profiles. When the d-carnitine and l-carnitine groups were compared, with the l-carnitine group being used as the control, a total of eighty-four metabolites with differing concentrations between the groups were identified (VIP > 1 and P < 0·05) (online Supplementary Table S3). Of these eighty-four metabolites, two acyl-carnitines and eleven lysophospholipids were present at lower concentrations, and twenty-three phospholipids and glycerophosphoric acid (the substrate of diglyceride) were present at higher concentrations in the MD/d-carnitine group than the MD/l-carnitine group.
Evaluation and Kyoto Encyclopedia of Genes and Genomes (KEGG) pathway of the liver metabolomics (d-carnitine/l-carnitine). (A) Orthogonal partial least squares discriminant analysis (OPLS-DA); (B) KEGG pathway of analysis. mTOR, mechanistic target of rapamycin; TCA, tricarboxylic acid.
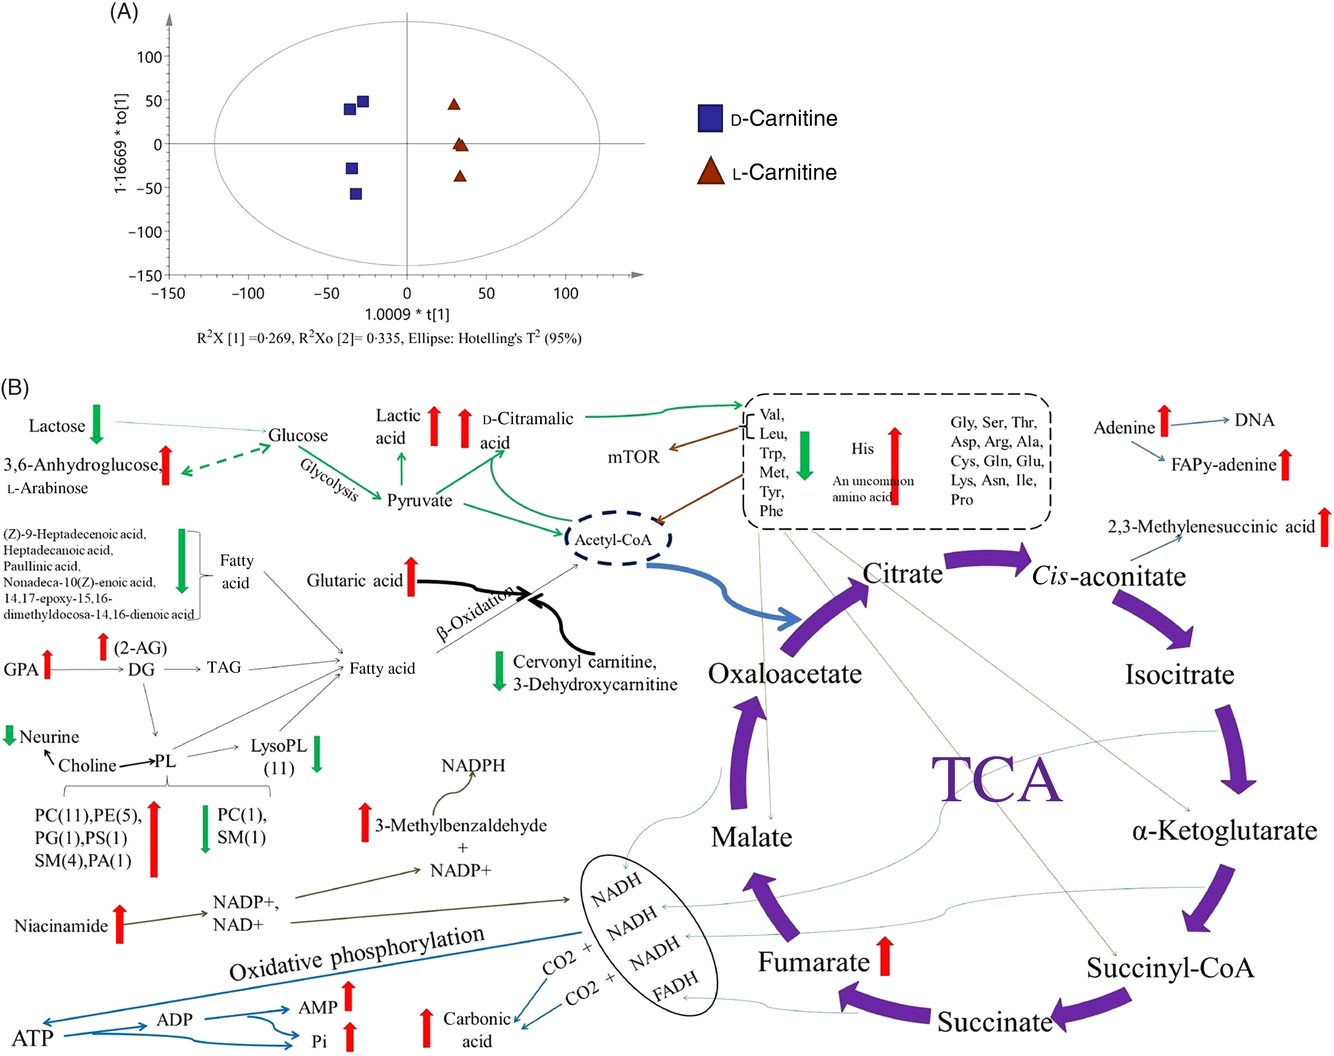
d-Carnitine also increased the anaerobic production of lactic acid and d-citramalic acid from pyruvate, but was associated with reductions in the concentrations of five essential amino acids in tilapia (Leu, Val, Met, Trp and Phe) and higher concentrations of His and (+)-threo-2-amino-3,4-dihydroxybutanoic acid. Moreover, d-carnitine increased the concentrations of fumaric acid, 2,3-methylenesuccinic acid, carbonic acid, AMP and phosphoric acid, which are by-products of the tricarboxylic acid cycle and oxidative phosphorylation. All the metabolites showing marked differences between the d-carnitine and l-carnitine groups are displayed in a comprehensive metabolic map as Fig. 9(B). In summary, the hepatic metabolomic analysis shows that d-carnitine feeding is associated with greater lipid deposition, glycolysis and amino acid catabolism, to maintain energy homeostasis.
Discussion
Contrasting effects of l-carnitine and d-carnitine on lipid metabolism
Although carnitine has been used as a feed additive for more than 20 years, the specific effects of l- and d-carnitine in many aquatic species have yet to be properly determined(Reference Torreele, Sluiszen and Verreth42–Reference Selcuk, Tiril and Alagil47). Contradictory findings generated by previous studies have been attributed to inter-species differences or variations in dietary components(Reference Harpaz12, Reference Ozorio30). However, the previous studies could not avoid the confounding effects of the endogenous carnitine background when attempting to evaluate the effects of administering exogenous l- or d-carnitine. We were able to inhibit the synthesis of endogenous carnitine using MD and thereby establish a low-carnitine model in the zebrafish and tilapia in our previous studies(Reference Li, Li and Qin32, Reference Pan, Li and Li34). The present study was the first to evaluate the specific effects of l- and d-carnitine in fish with a low endogenous carnitine background.
Dietary l-carnitine efficiently increased the free carnitine and acyl-carnitine concentrations in the serum and liver of the low-carnitine tilapia, and also reduced lipid accumulation in tissues of the low-carnitine tilapia. Of note, these values of l-carnitine group were similar as those in normal fish, showing that the dietary supplementation of l-carnitine was sufficient to recover the carnitine shortage caused by MD. Because acyl-carnitine is the physiologically active type of carnitine, this is consistent with l-carnitine being the physiological carnitine isomer in tilapia and also confirms that exogenous l-carnitine can be utilised in fish. Of note, dietary supplementation with l-carnitine did not significantly increase the concentrations of free carnitine or acyl-carnitine in muscle in the low-carnitine tilapia. The tissue-specific effect of l-carnitine was found in many experiments in mammals or fish, in which the carnitine content of muscle was relatively stable, whereas the liver was more sensitive to carnitine supplementation or deficiency(Reference Li, Li and Qin32, Reference Morand, Bouitbir and Felser48, Reference Wächter, Vogt and Kreis49). However, some fish studies also reported that dietary l-carnitine could increase the muscle carnitine content in African catfish and zebrafish(Reference Li, Li and Qin27, Reference Ozório, Uktoseja and Huisman50, Reference Ozório, Van Ginneken and Van den Thillart51). Therefore, the tissue-specific effects of l-carnitine are likely to be different among species, and thus more low-carnitine animal models should be established to intensively evaluate the possible different functions of l-carnitine among species.
The supply of additional carnitine would be expected to promote the transport of FA into mitochondria, β-oxidation to produce energy and a reduction in lipid storage. As strong evidence for this, in the present study, l-carnitine supplementation significantly ameliorated the lipid deposition caused by the MD-induced carnitine deficiency. In our recent study of normal zebrafish, dietary l-carnitine supplementation also increased hepatic carnitine concentration, mitochondrial activity and the mRNA expression of CPT1 (Reference Li, Li and Qin27), which was associated with lower body lipid content. Interestingly, l-carnitine supplementation in low-carnitine tilapia did not cause an up-regulation of the expression of genes involved in β-oxidation. This is likely explained by our previous finding that, compared with normal tilapia, CPT1 is overexpressed in MD-treated tilapia as a compensatory response to carnitine deficiency and the associated low β-oxidation capacity(Reference Pan, Li and Li34). This could explain why when exogenous l-carnitine was supplied, the already highly up-regulated mitochondrial β-oxidation could be effective at reducing the accumulated lipid.
In contrast to the effects of l-carnitine, dietary supplementation with d-carnitine did not elevate acyl-carnitine concentrations in the low-carnitine tilapia, and in fact tended to reduce it in muscle. It also further aggravated the lipid deposition in the low-carnitine tilapia. Consistent with these effects, the mRNA expression of genes involved in β-oxidation was compensatorily up-regulated in the d-carnitine group. These effects were similar to those previously observed in MD-induced low-carnitine tilapia, zebrafish and rodents(Reference Li, Li and Qin32, Reference Pan, Li and Li34, Reference Degrace, Demizieux and Gresti52), and indicate abnormal lipid metabolism as part of a metabolic syndrome. This confirms that d-carnitine should not be given to fish and also suggests that some of the findings of previous studies, which showed no differences between the inclusion of l-, d- and dl-carnitine in the diet(Reference Du, Liu and Tian24, Reference Tian, Leng and Li29), were confounded by the presence of endogenous l-carnitine.
As further evidence, d-carnitine supplementation caused a greater detoxification response than l-carnitine, suggesting that d-carnitine is more likely to be treated as a xenobiotic substrate than l-carnitine in tilapia. Moreover, the feeding of d-carnitine demonstrated more potential for inflammation, oxidative stress and apoptosis than l-carnitine. This could be caused by d-carnitine itself, or indirectly by the lipotoxicity it induced, which is the result of excess fat deposition. It is known that excess lipid accumulation in non-adipose tissues is associated with higher concentrations of NEFA and TAG in the circulation, and that this is often accompanied by inflammation, oxidative stress and cellular dysfunction or death(Reference Mattern and Hardin53–Reference Perez-Martinez, Perez-Jimenez and Lopez-Miranda55). In summary, d-carnitine cannot be physiologically used, such that the high serum FA levels cannot be lowered, because they cannot enter mitochondria for oxidation, resulting in lipotoxicity.
However, in the present study, the difference in the effects of the two carnitine isomers on muscle metabolism was less marked. A possible reason for this is that there is a higher background concentration of carnitine in muscle than in the liver, or that the degree of supplementation with l- and d-carnitine was insufficient to significantly alter the concentration of acyl-carnitine, such that any change in lipid metabolism in muscle was not obvious. However, d-carnitine did induce adverse effects in muscle, indicated by up-regulation of inflammatory and apoptotic markers.
Thus, the present study provides clear evidence that, at least in Nile tilapia, dietary l-carnitine is physiologically utilised in the transport of acyl-carnitine into mitochondria and improves FA utilisation, while dietary d-carnitine appears to be treated as a xenobiotic and disrupts metabolism.
Metabolic adaptation of tilapia in response to d-carnitine ingestion
In addition to facilitating a comparison of the effects of l- and d-carnitine on lipid metabolism, another aim of the present study was to investigate the metabolic adaptation of tilapia in response to d-carnitine.
Cooperation between mitochondria and peroxisomes
Previous studies in mammals and zebrafish have shown that when mitochondrial β-oxidation is inhibited and fat accumulates in the liver or heart, CPT1 gene expression or enzyme activity compensatorily increases to enhance FA transport into the mitochondrial matrix( Reference Li, Li and Qin32 , Reference Degrace, Demizieux and Gresti52 , Reference Degrace, Demizieux and Du56 ). In the present study, CPT1 gene expression was also higher in the liver of d-carnitine-treated fish. However, because d-carnitine significantly reduced the acyl-carnitine concentration, acyl-CoA would not be able to efficiently enter the mitochondrial matrix for β-oxidation. Nevertheless, in addition to increasing the expression of genes involved in mitochondrial β-oxidation, cooperation can also occur between mitochondria and peroxisomes as an adaptive mechanism to facilitate β-oxidation in mammals(Reference Van den Branden and Vamecq57, Reference Mannaerts, Debeer and Thomas58). Some previous studies in mammals have shown that gene expression or enzyme activities associated with peroxisomal β-oxidation can be enhanced as an adaptation to the inhibition of mitochondrial β-oxidation(Reference Degrace, Demizieux and Du56, Reference Tsoko, Beauseigneur and Gresti59–Reference Wicks, Vandanmagsar and Haynie62). In the present study, d-carnitine-treated tilapia exhibited higher expression of ACO, which encodes a key enzyme of peroxisomal β-oxidation, suggesting that peroxisomal β-oxidation may be up-regulated after d-carnitine treatment. However, a number of studies have indicated that peroxisomal β-oxidation has a significantly lower capacity than that of mitochondrial β-oxidation, particularly in muscle(Reference Henderson and Tocher63–Reference Frøyland, Lie and Berge65). Therefore, even though peroxisomal β-oxidation may have been up-regulated in the d-carnitine group, this would have been insufficient to compensate for the depressed mitochondrial β-oxidation of FA.
Energy homeostasis regulation
In sports medicine, l-carnitine is used to inhibit glycolysis by suppressing pyruvate dehydrogenase(Reference Constantin-Teodosiu, Carlin and Cederblad66), or phosphofructokinase activity(Reference Eizadi, Bakhshi and Abrifam67), which reduces exercise-associated lactate accumulation(Reference Siliprandi, Di Lisa and Pieralisi68–Reference Vecchiet, Di Lisa and Pieralisi70), and delays the development of fatigue(Reference Brass71, Reference Karlic and Lohninger72). This indicates that carnitine is involved in the partition between lipid and carbohydrate use. In the present study, l-carnitine supplementation induced glucose sparing by normalising FA utilisation, while d-carnitine-fed tilapia used more glucose and protein in response to a lack of energy derived from lipids. Compared with mammals, fish have a lower ability to use carbohydrates as energy sources(Reference Wilson73), but interactions between lipid and carbohydrate metabolism have been demonstrated in fish(Reference Polakof, Médale and Larroquet74, Reference Borges, Valente and Véron75). In the present study, d-carnitine not only stimulated the expression of genes involved in glycolysis and reduced the expression of genes involved in gluconeogenesis, but also reduced liver glycogen stores and enhanced the production of lactic acid and d-citramalic acid from pyruvate, as demonstrated by the metabolomics data. This indicates that d-carnitine-fed fish use glucose more efficiently. Greater use of glucose by the glycolytic pathway has also been reported in mice in which mitochondrial β-oxidation is impaired(Reference Wicks, Vandanmagsar and Haynie62, Reference Tavecchio, Lisanti and Bennett76).
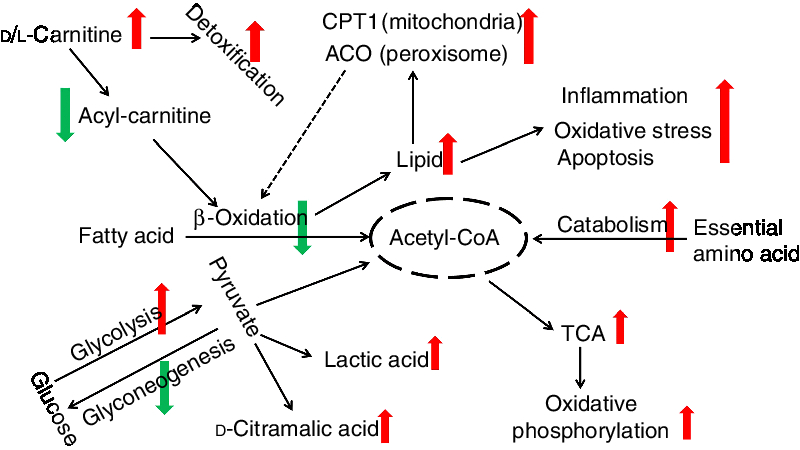
Energy homeostasis involves the balanced use of lipid, glucose and protein substrates(Reference Li, Li and Qin27, Reference Trevisan, Nosadini and Avogaro77, Reference Solini, Bonora and Bonadonna78). In the present study, we found that essential amino acid concentrations in the liver were much lower, and the total concentration of amino acids in the plasma was higher. This suggests that there is greater protein catabolism in d-carnitine-treated fish and that free amino acids, including essential amino acids, are metabolised to produce additional energy. Because the total protein content of tissues was not affected by the d-carnitine treatment, it is also possible that ingested protein is digested more efficiently in these fish, such that amino acid absorption from the gut can be increased. However, this possibility requires further investigation. Interestingly, d-carnitine-treated fish also produced higher concentrations of intermediate metabolites and end-products of the tricarboxylic acid cycle, and end-products of oxidative phosphorylation. This supports the assertion that although mitochondrial β-oxidation was impaired to induce greater lipid deposition, these tilapias could still obtain energy from catabolism of glucose and amino acids to maintain homeostasis, which was associated with greater activity of the tricarboxylic acid cycle and oxidative phosphorylation. This differential regulation of energy substrate use in the d-carnitine-treated fish is summarised in Fig. 10.
Different functions of l-carnitine and d-carnitine on metabolic regulation of fish. CPT1, carnitine palmitoyltransferase 1; ACO, acyl-CoA oxidase; TCA, tricarboxylic acid.
In conclusion, using a low-carnitine tilapia model, the present study has shown that dietary l-carnitine can be physiologically utilised in fish, and it has the effect of reducing lipid accumulation in the liver. In contrast, dietary d-carnitine intake reduced the acyl-carnitine concentration in the body and induced lipid accumulation in the liver, which was accompanied by lipotoxicity. Moreover, dietary d-carnitine stimulated glycolysis and amino acid degradation to maintain energy homeostasis. Therefore, d-carnitine is not recommended for use as feed additives in animals.
Acknowledgements
The authors thank the financial support by the National Natural Science Fund of China (31772859 and 31830102) and Program of Shanghai Academic Research Leader (19XD1421200).
We thank Mark Cleasby, PhD, from Liwen Bianji, Edanz Group China (www.liwenbianji.cn/ac), for editing the English text of a draft of this manuscript.
The authors’ contributions were as follows: Z. D. and J. L. designed the research; J. L., L. L., Y. Z. and F. Q. conducted the research; J. L., Z. J., S. L., L. C. and M. Z. analysed the data; S. L. and M. Z. contributed to the final writing of the paper; J. L., P. D. and Z. D. wrote the manuscript. All authors read and approved the final manuscript.
The authors declare that there are no competing interests associated with the manuscript.
Supplementary material
For supplementary material/s referred to in this article, please visit https://doi.org/10.1017/S000711451900148X


