

Credit markets have always been imperfect, with significant transaction and information costs hindering the allocation of funds (Lamoreaux, Reference Lamoreaux1986; Hoffman et al., Reference Hoffman, Postel-Vinay and Rosenthal2000; Guinnane, Reference Guinnane2001; Van Zanden et al., Reference Van Zanden, Zuijderduijn and De Moor2012). In economies without financial intermediaries, lenders had to allocate resources to search for and screen potential borrowers and monitor the use of funds, while borrowers had to seek out lenders.Footnote 1 Over time, financial intermediaries emerged to economise on these costs. Notaries, for instance, were crucial intermediaries, holding valuable information on potential lenders and borrowers (Hoffman et al., Reference Hoffman, Postel-Vinay and Rosenthal2000; Levy, Reference Levy2012).Footnote 2 Eventually, banks were created, helping savers and investors mitigate transaction and information costs, thereby facilitating credit allocation, and fostering economic growth (Gerschenkron, Reference Gerschenkron1962; Cameron, Reference Cameron and Cameron1967; Sylla, Reference Sylla1969; Lamoreaux, Reference Lamoreaux1986; Haber, Reference Haber1991; Zegarra, Reference Zegarra2018b).Footnote 3
In Latin America, credit markets have operated since viceregal times. Prior to the creation of banks, private lenders dealt with transaction and information costs, and extended credit to a variety of borrowers, sometimes with the intermediation of notaries.Footnote 4 Some private lenders were merchants and traders, others were proprietors; some were lawyers, others were government employees; some were men, others were women. In Mexico, merchants and traders provided credit and even received deposits all over the territory (McCaleb, Reference McCaleb1920; Ludlow and Marichal, Reference Ludlow, Marichal, Ludlow and Marichal1998; Aguilar, Reference Aguilar, Cerutti and Marichal2003; Cerutti, Reference Cerutti, Cerutti and Marichal2003; Olveda Reference Olveda, Cerutti and Marichal2003; Rodríguez Reference Rodríguez, Cerutti and Marichal2003; Levy, Reference Levy2012).Footnote 5 In Brazil, private lenders also provided credit in urban and rural areas (Flory, Reference Flory1978; de Sampaio, Reference de Sampaio2002; Hanley, Reference Hanley2005; Pesavento, Reference Pesavento2012; Penna, Reference Penna2022). In Peru, private lenders provided credit to families and firms both before and after the creation of banks (Camprubí, Reference Camprubí1957; Engelsen, Reference Engelsen1977; Zegarra, Reference Zegarra2013b, Reference Zegarra2016, Reference Zegarra2017a, Reference Zegarra2022). In other countries, private lenders also made loans to a variety of borrowers (Langer and Hames, Reference Langer and Hames1994; Pineda, Reference Pineda2006; Granados and Torres, Reference Granados and Torres2023).
Private lenders were not all the same; some engaged more actively in the credit market than others. For example, in 19th-century Lima, Peru, Pedro Gonzales de Cándamo, Pedro Denegri, and Manuela Pando served the credit needs of numerous borrowers.Footnote 6 Meanwhile, in 19th-century Sinaloa, Mexico, Amado Andrade, Remedios de la Rocha, Martin Martinelli, and Domingo Uriarte made many more loans than other private lenders (Aguilar, Reference Aguilar, Cerutti and Marichal2003). In Durango, Mexico, the commercial houses Bracho Hermanos, Gurza Hermanos y Cia, Julio Hildebrand Sucs, and Stahlknecht y Cia played an important role as private lenders (Rodríguez, Reference Rodríguez, Cerutti and Marichal2003).
Frequent lenders likely held some competitive advantages over occasional lenders.Footnote 7 One key advantage for frequent lenders stemmed from their extensive experience in the credit market, leading to enhanced information on potential borrowers. While notaries held valuable information about potential borrowers,Footnote 8 lenders still faced information constraints. However, frequent lenders could reduce costs for searching and screening new borrowers through economies of scale, making information asymmetries less significant for them than for occasional lenders. Additionally, frequent lenders could mitigate risk by diversifying their loans across different economic sectors, a strategy unavailable to their occasional counterparts.
Several economists have argued that financial markets can foster economic growth through mechanisms such as economizing on information costs and facilitating risk diversification.Footnote 9 For instance, by economizing on information costs, financial markets may facilitate learning about investment opportunities, thereby improving resource allocation and increasing economic growth (Greenwood and Jovanovic, Reference Greenwood and Jovanovic1990; Levine, Reference Levine1997). In addition, financial markets that ease risk diversification may encourage a portfolio shift toward projects with higher expected returns, thereby fostering economic growth (Saint-Paul, Reference Saint-Paul1992; Obstfeld, Reference Obstfeld1994; Levine, Reference Levine1997). If frequent lenders economized on information costs and diversified risk, they would have contributed to capital mobilization, technological change and economic growth.
Nineteenth-century Lima presents a noteworthy case for studying the role of frequent lenders in early credit markets. During the Guano Era, some residents of Lima (limeños) accumulated large amounts of capital (Bonilla, Reference Bonilla1974; Yepes, Reference Yepes1981; Zegarra, Reference Zegarra2023, Reference Zegarra, Kantor and Kitchens2025). They could have contributed to the mobilization of capital by lending to a variety of borrowers. Did wealthy lenders help mobilize capital, or did they only fund the investments of the richest borrowers? By operating on a larger scale than occasional lenders, frequent lenders could experience gains in efficiency. Did frequent lenders diversify risk to a greater extent than occasional lenders? Did frequent lenders know potential borrowers better than occasional lenders, thereby facing lower information asymmetries?
Several studies have examined the functioning of credit markets in Peru in the past. Some scholars have analyzed the role of the Church in the credit market (Suárez, Reference Suárez1993; Quiroz, Reference Quiroz1994). Others have shown that merchants, retailers and other private lenders played an important role as sources of credit (Suárez, Reference Suárez2001; Zegarra, Reference Zegarra2017a). Some scholars have analyzed the role of commercial and mortgage banks in the 19th century (Camprubí, Reference Camprubí1957; Engelsen, Reference Engelsen1977; Quiroz, Reference Quiroz1993; Zegarra, Reference Zegarra2015, Reference Zegarra2017a). Other studies have analyzed the effect of usury laws, gender discrimination, political instability, and the borrower’s income on the allocation of credit (Zegarra, Reference Zegarra2013b, Reference Zegarra2016, Reference Zegarra2017b, Reference Zegarra2022). However, no study has specifically examined the differences in the allocation of credit between frequent and occasional lenders.
This article examines the role of frequent lenders in the credit market of Lima between 1840 and 1865,Footnote 10 using information from a sample of notarized loans. The evidence shows that frequent lenders were wealthy individuals. Frequent lenders had enough resources to make loans to large borrowers; however, they did not only lend to the wealthiest borrowers. Some of their loans went to rich individuals, but frequent lenders also served the needs of middle- and low-income borrowers. In fact, the proportion of loans allocated to medium and small borrowers was similar for both frequent and occasional lenders.
Two possible advantages of frequent lenders were that they had better opportunities to diversify risk, and could deal with information asymmetries at lower costs than occasional lenders. The evidence shows that frequent lenders diversified risk to a greater extent than occasional lenders, by making loans to borrowers from different sectors. In addition, consistent with the hypothesis that frequent lenders knew borrowers better than other lenders, frequent lenders engaged in repeated lending less regularly than occasional lenders.
The article is organized as follows. Section 1 provides a historical background. Section 2 presents the dataset. Section 3 discusses the characteristics of private lenders. Section 4 analyzes the destination of loans and the mobilization of capital. Section 5 compares risk diversification between frequent and occasional lenders. Section 6 examines the differences in information asymmetries between frequent and occasional lenders. Section 7 concludes the article.
1. Historical background
In the mid-19th century, the population of Peru was about two million. Lima, the capital city, had 85,000 inhabitants.Footnote 11 Lima was located on the central coast, just a few miles from Callao, the country’s main port of the country. Lima played an important political and economic role both during viceregal times and after independence from Spain.
Most of the labor force was employed in the secondary and tertiary sectors. Retailers, artisans and low-skilled workers made up the majority of this workforce (Zegarra, Reference Zegarra2021).Footnote 12 Merchants conducted commercial activities in the wholesale sector, with many maintaining connections to foreign trade. Some of them were known as almaceneros, because they owned a warehouse (almacén). There were also many retailers in Lima. Among them, the most common were pulperos, tenderos, cajoneros, tendejoneros, and manteras. In the services sector, there was also a variety of businesses. Some businesses operated in the hospitality industry. Others provided transportation services, such as muleteers, wagoners and carters. In addition, Lima had a variety of manufacturers, mostly artisans, such as carpenters, bricklayers, shoemakers, bakers, butchers, and chocolate makers, among many others. Some manufacturers processed food and beverages, while others worked with wood, iron, and other materials.
Merchants were among the wealthiest businessmen in Lima (Yepes, Reference Yepes1981; Zegarra, Reference Zegarra2023). According to the guild tax report of 1843, almaceneros (one type of merchant) earned an average of 2,318 pesos that year, while encomenderos (another type of merchant) earned an average of 787 pesos.Footnote 13 On average, merchants (wholesalers) earned 1,733 pesos in 1843. Retailers earned significantly less than merchants. On average, large and middle-income retailers earned 334 pesos, while small retailers earned 178 pesos. In the services sector, profits were typically lower than those of merchants. For example, on average, muleteers earned about 375 pesos, fonderos earned 302 pesos, and chinganeros earned 235 pesos in 1843. Manufacturers, mostly artisans, generally earned incomes comparable to those of retailers. On average, manufacturers earned 259 pesos in 1843.
During the Guano Era, the economy of Lima experienced a commercial boom (Camprubí, Reference Camprubí1957; Bonilla, Reference Bonilla1974; Yepes, Reference Yepes1981; Basadre, Reference Basadre1983; Zegarra, Reference Zegarra2023).Footnote 14 Large merchants greatly benefited from the expansion of the economy. Almaceneros experienced a significant increase in profits during the 1840s and 1850s. Specifically, the average profits per almacenero rose from 3,038 pesos in 1843 to 7,895 pesos in 1859. In contrast, the average profits of cajoneros (small retailers) declined between 1843 and 1859.Footnote 15
Some people in Lima owned real estate. In 1836, there were 1,777 real estate proprietors in the city of Lima; by 1857, this number was 1,541.Footnote 16 During this period, the value of real estate increased significantly. On average, the value of real estate per proprietor rose from 18,244 pesos in 1836 to 26,317 pesos in 1857. The 5% wealthiest proprietors owned real estate valued at more than 57,000 pesos in 1836, and over 75,000 pesos in 1857. Meanwhile, the poorest 5% owned properties worth less than 1,200 pesos in 1836, and less than 1,700 pesos in 1857. Real estate proprietors could generate income by renting out their properties. On average, they earned an annual rent of about 547 pesos in 1836 and 790 pesos in 1857.Footnote 17
In viceregal times, credit was provided by the Church and private lenders (Suárez, Reference Suárez1993; Quiroz, Reference Quiroz1994, Reference Suárez2001). However, in the 19th century, with the process of desamortización, the Church lost much of its wealth and its role as a financier. Private lenders provided credit to a wide range of borrowers, including men and women, merchants and artisans, employees and lawyers. As the Peruvian economy expanded, the credit market grew rapidly (Camprubí, Reference Camprubí1957; Zegarra, Reference Zegarra2016). With more sources of funding, families and firms benefited from the expansion of credit. As the credit market grew, some entrepreneurs invested in banks. Commercial banks emerged in Peru in the early 1860s, followed by mortgage banks in the late 1860s (Camprubí, Reference Camprubí1957; Engelsen, Reference Engelsen1977; Zegarra, Reference Zegarra2013a, Reference Zegarra2017a).
Before the creation of banks, private lenders provided credit to a diverse range of borrowers. Some of these lenders made frequent loans, while others made occasional loans. Wealthy lenders such as Pedro Gonzales de Cándamo, Pedro Denegri and Manuela Pando extended multiple loans to various borrowers. Some questions arise. Did wealthy lenders contribute to the mobilization of capital, or did they primarily meet the credit needs of affluent borrowers? Frequent lenders operated on a larger scale than occasional lenders. Did they experience gains in efficiency? In the following sections, this study will examine the differences between frequent and occasional lenders in the allocation of credit in Lima.
2. Dataset
Notarized loans provide valuable information to analyze the functioning of credit markets in the past (Hoffman et al., Reference Hoffman, Postel-Vinay and Rosenthal2000; Levy, Reference Levy2012; Zegarra, Reference Zegarra2016, Reference Zegarra2017a, Reference Hoffman, Postel-Vinay and Rosenthal2019). In Lima, notaries preserved records of their certified documents in special volumes, known as protocolos. These protocolos are now housed in the National Archives of Peru. Notarized loans usually provide information about the identifies of lenders and borrowers, additional information about them, and loan conditions. With this information, it is possible to determine the frequency of loans for each lender, and how frequent and occasional lenders allocated their funds.
This study is based on a sample of notarized loans from 1840 to 1865. To construct the database, all notarized contracts in the categories of obligaciones (obligations), mutuos, and hipotecas (mortgages) recorded by five notaries were reviewed.Footnote 18 The loans notarized by José de Selaya, Felipe Orellana, José Escudero, Francisco Palacios, and José Ayllón were transcribed. These notaries were among the most prominent of Lima.
Notarized contracts typically include the names of both the lender and the borrower. Many of these loans provide additional details about the parties involved. For instance, some contracts specify the occupation of the lender and borrower. The contracts also typically mention the size of the loan, the maturity, and the interest rate.
Many contracts specify the occupations of the lender and borrower. However, for some contracts, this information is missing. To obtain additional information about the occupations of lenders and borrowers, guild tax reports were consulted, specifically those from 1834, 1838, 1843, 1852 and 1859. These tax records include the identities of guild members, the addresses of their offices or stores, and the amount of tax paid.Footnote 19
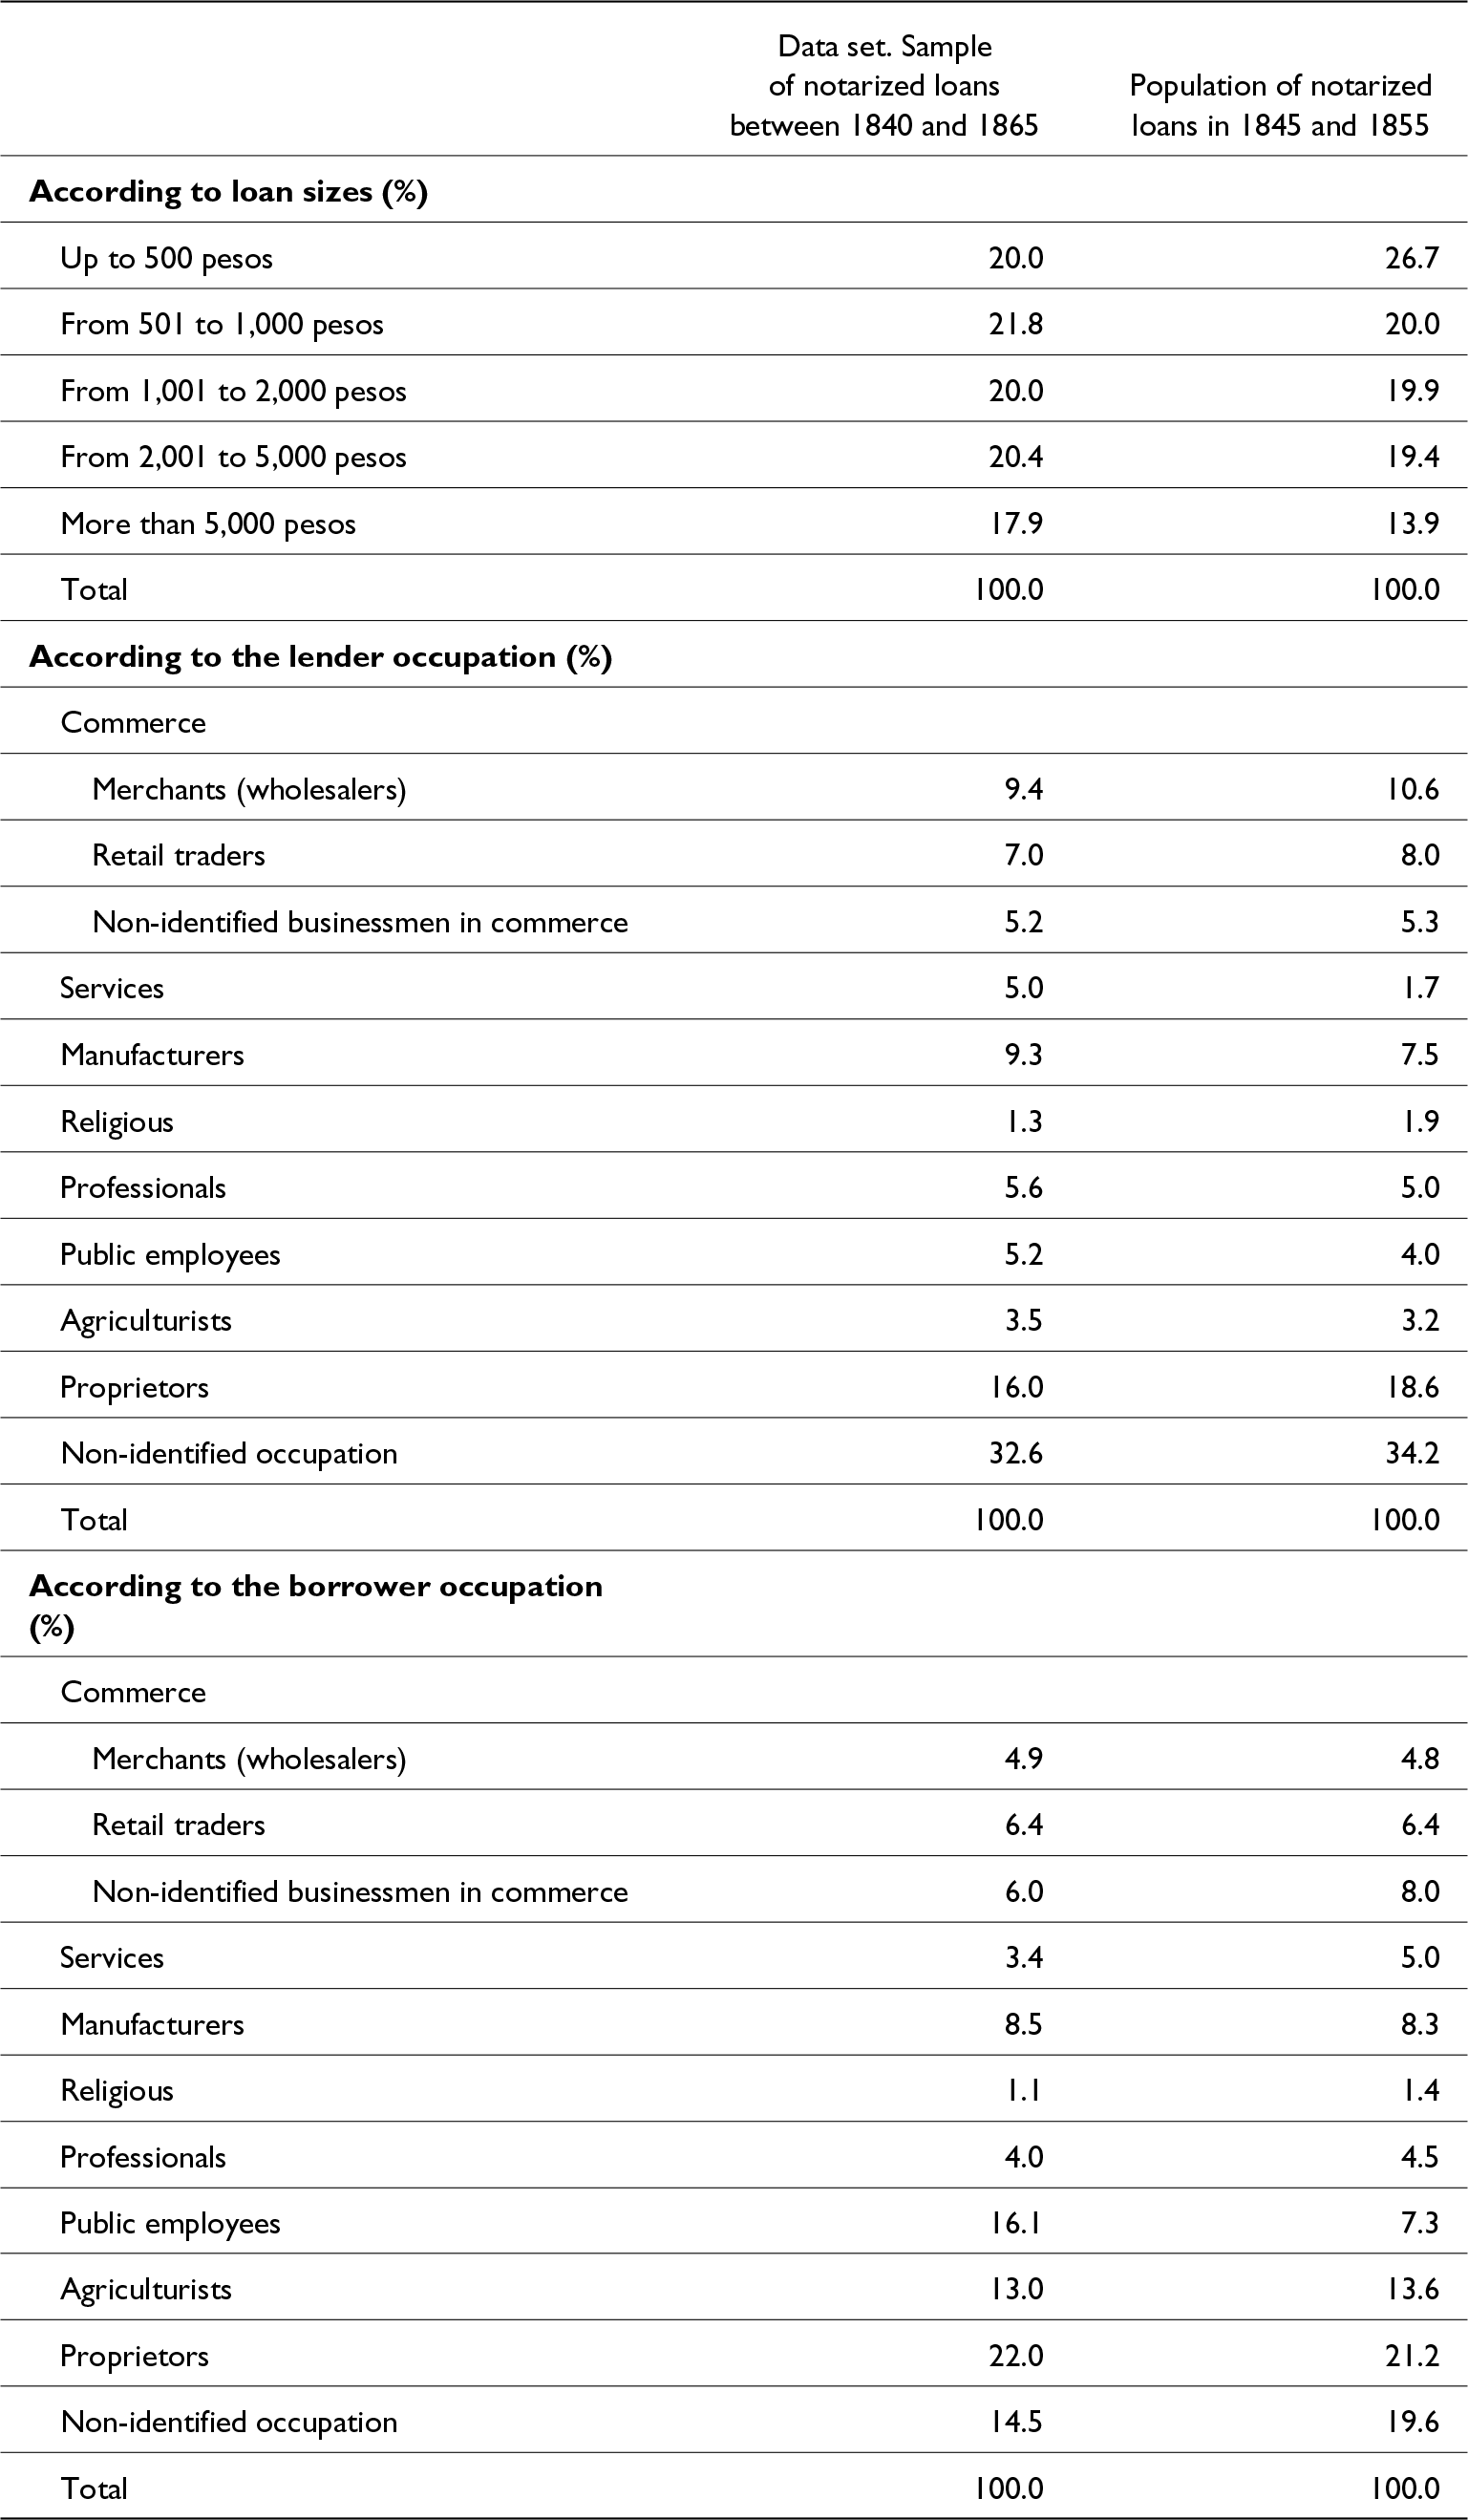
Since the data set is based on a sample of notaries, there may be concerns about its representativeness. For 1845 and 1855, loans from all notaries were transcribed. To assess whether the data set is representative, a comparison of the distribution of loans between the dataset and the population of loans for 1845 and 1855 was conducted. Table 1 shows that there are important similarities in the distribution of loans between the dataset in 1840–65 and the population of loans for 1845 and 1855. For instance, about 42% of loans in the sample (the dataset) were up to 1,000 pesos, compared to 47% in the population of loans for 1845 and 1855. Meanwhile, merchant lenders made up 9% of loans in the sample, and 11% in the population of loans for 1845 and 1855. Proprietor lenders made 16% of loans in the sample, and 19% in the population. Merchants received 5% of loans in the sample, and 5% in the population, while proprietors received 22% of loans in the sample, and 21% in the population.Footnote 20
Distribution of loans (%)

Notes: The table shows the distribution of loans according to the loan size, the occupation of the lender, and the occupation of the borrower, for the sample of notarized loans between 1840 and 1865, and the population of notarized loans in 1845 and 1855.
On the other hand, notarial records have one limitation: some loans may not have been certified by a notary. Notarized loans could differ from non-notarized loans. To understand these differences, the incentives to notarize can be analyzed. A lender may have faced the dilemma of whether to notarize the loan contract. The advantage of notarizing was the higher probability of repayment. Notarization probably reduced the probability of default: if the loan was not notarized, the borrower could claim he/she did not receive a loan from the lender. The disadvantage of notarizing a loan was the cost (in terms of money and time) of involving a notary. The incentives to notarize a loan contract were likely lower when the lender and borrower had a personal relationship. For example, if the lender and borrower were brothers, the borrower might have had a strong incentive to repay the loan, making the lender less likely to consider notarizing the contract. Therefore, personal connections were probably less common in notarized loans.Footnote 21 Additionally, larger loans were likely notarized more frequently. If the cost of notarization had a fixed component, the benefits of notarizing very small loans probably did not outweigh the costs. Notarization’s advantages were more significant for medium and large-sized loans. Since this study relies on notarized records, its findings are particularly applicable to impersonal credit transactions involving medium and large amounts, rather than very small loans between relatives or close friends.
3. Private lenders
Prior to the creation of banks, private lenders served the credit needs of a variety of borrowers in Lima. However, not all private lenders were the same. Some lenders participated more actively in the credit market than others. Some lenders made frequent loans; others made loans only occasionally.
This study distinguishes private lenders by the frequency of loans. Two categories of lenders were considered: frequent lenders and occasional lenders.Footnote 22 For each contract, it was determined whether the lender was a frequent lender or an occasional lender. Consider a notarized loan between lender i and borrower j on date t. Lender i was classified as a frequent lender if he/she made more than K loans in the five years prior to date t. Two alternative values for K were considered. For K = 5, lender i was defined as a frequent lender if he/she made more than five loans in the five years prior to date t. For K = 10, lender i was defined as a frequent lender if he/she made more than ten loans in the five years prior to date t. On the other hand, a lender i was defined as an occasional lender if he/she made up to K loans in the five years prior to t.Footnote 23
Frequent lenders in Peru did not make as many loans between 1840 and 1865 as mortgage banks did years later. Mortgage banks in Peru, which emerged in the late 1860s, made hundreds of mortgage loans every year (Zegarra, Reference Zegarra2017a). However, the distinction between frequent and occasional lenders is important to determine whether differences in the frequency of loans influenced the allocation of credit.
Using K = 5, on average, there were 8.4 frequent lenders per year between 1845 and 1865 (Table 2).Footnote 24 The total credit from these lenders in the dataset was 124,000 pesos per year. Using K = 10, the number of frequent lenders per year was 4.6, and their value of loans per year was 73,000 pesos. On the other hand, the number of occasional lenders per year ranged between 97 and 100 (depending on the value of K), while their value of loans per year ranged between 440,000 and 492,000 pesos. Frequent lenders made between 13% and 22% of the total value of loans in the dataset between 1845 and 1865.Footnote 25
Number of lenders and loans, and value of loans

Notes: The table shows the evolution of the number of lenders, the number of loans, and the value of loans per year between 1845 and 1865. The table also shows the number of loans per lender, and the value of loans per lender. Finally, the table shows the market shares of frequent and ocassional lenders for the value of loans. For a loan contract between lender i and borrower j at date t, lender i was defined as a frequent lender if he/she made more than K loans in the five years prior to t, where K = 5 (first definition), 10 (second definition). Lender i was defined as a ocassional lender if he/she made up to K loans in the five years prior to t.
Lenders needed capital to allocate credit. On average, loans had a maturity of about a year. Assuming loans were repaid within that timeframe, lenders could not access the funds lent during the previous twelve months to make new loans. To determine the capital a lender allocated to the business of lending, the average annual value of loans per lender was calculated for each year. On average, the annual value of loans per frequent lender ranged from 11,900 to 13,400. In comparison, the annual value of loans per occasional lender ranged from 4,300 to 4,600 pesos. As expected, the annual value of loans per lender was higher for frequent lenders. Frequent lenders required larger amounts of capital to make more frequent loans.
Some wealthy individuals in Lima earned thousands of pesos annually, enabling them to accumulate sufficient capital to make the loans typically associated with frequent lenders. For example, in 1836, the richest 5% of estate proprietors (89 individuals) earned at least 1,700 pesos annually from renting their properties in Lima. By 1857, the richest 5% (77 individuals) earned at least 2,300 pesos from rental income. Meanwhile, an average almacenero earned approximately 3,000 pesos in 1843, and 7,900 pesos in 1859. Wealthy proprietors and merchants could accumulate within a few years enough capital to allocate the sums typically handled by frequent lenders. However, these individuals represented the uppermost segment of Lima’s income distribution. For the majority of the population, raising 10,000 pesos in capital was unattainable. For instance, a laborer in the 1850s earned about one peso per day. Assuming 250 working days per year, his/her total annual income would be 250 pesos. If a laborer saved 20% of their annual income, it would take him/her 200 years to accumulate 10,000 pesos in capital.
Occasional lenders did not invest as much capital in the credit market as frequent lenders. However, their capital requirements suggest that they were not poor.Footnote 26 As indicated by the average value of loans per year, a person needed a few thousand pesos of capital to allocate the amount of credit allocated on average by occasional lenders. It is unlikely that laborers and other low-income individuals participated as lenders in Lima’s notarized credit market even as occasional lenders.
Frequent lenders were among the wealthiest people in Lima. Pedro Gonzales de Cándamo was a notable example. Born in Chile in 1799, he passed away in Lima in 1866. His investments spanned various sectors, including commerce, finance, and railroads. Gonzales de Cándamo was a prominent merchant. By the early 1830s, he had already joined the guild of encomenderos.Footnote 27 From the late 1830s, he was also a member of the guilds of prestamistas (financiers), and almaceneros. In 1842, he became a consignee of guano, alongside with Francisco Quiros, Aquiler Allier, Puymeról y Montané, and Gibbs (Quiroz, Reference Quiroz1987). In 1848, Gonzales de Cándamo ventured into the railroad business. Together with José Vicente Oyague, he secured a concession from the government of Ramón Castilla to construct the Lima-Callao railroad, Peru’s first railroad. The concession was granted for a duration of ten years, and the railroad was inaugurated in 1851 (Costa y Laurent, Reference Costa y Laurent1908).
Gonzales de Cándamo earned substantial income as a financier. In 1859, he paid 480 pesos annually in taxes on his lending operations.Footnote 28 Given a tax rate of approximately 4%, this indicates that his annual earnings from lending were about 12,000 pesos. Overtime, he also became a prominent bank shareholder. In 1865, he became a shareholder of the Banco del Perú, one of the main banks of Peru. He bought one share worth 80,000 soles or 100,000 pesos. This bank was a commercial bank and issued banknotes widely accepted as a means of payment (Camprubí, Reference Camprubí1957). As a shareholder of this bank, Gonzales de Cándamo partnered with other influential businessmen.Footnote 29 By 1866, his wealth had reached the remarkable sum of 6.3 million pesos (Quiroz, Reference Quiroz1987).
Another frequent lender was Pedro Denegri. Denegri was an Italian businessman, with important commercial and financial interests.Footnote 30 According to the guild tax reports, he was an almacenero in 1843, an almacenero, consignee and mortgage lender in 1852, and an almacenero, consignee, encomendero, and mortgage lender in 1859.Footnote 31 In 1859, he paid about 656 pesos in annual taxes, corresponding to an annual profit of 16,400 pesos for all his businesses. Denegri also participated in the creation of banks. He was one of the shareholders of the Banco del Perú in 1863; he invested 80,000 soles in one share of this bank (Camprubí, Reference Camprubí1957).Footnote 32 Three years later, he participated in the creation of the Banco de Crédito Hipotecario, the first mortgage bank of Peru, together with other leading businessmen of Lima (Camprubí, Reference Camprubí1957).Footnote 33 Denegri also invested in real estate. In 1857, he possessed several fincas in the first and second districts (cuarteles) of Lima with an estimate annual “production” of 6,760 pesos.Footnote 34 Assuming the rent of an estate was equal to 3% its value,Footnote 35 his real estate was worth 225,000 pesos. On the other hand, Denegri also showed interest in politics: he was one of founders of the Civil Party in 1871 (Tantaleán, Reference Tantaleán2011).
Some frequent lenders were women. One of them was Manuela Pando, the wife of José Gonzales de la Fuente (former count del Villar de la Fuente), and a wealthy owner of fincas, haciendas and chakras. In 1836, she owned seven estates in the city of Lima; in particular, she owned four estates in the first district of the city, one in the second district, another in the fourth district, and another in the fifth district. Since the annual “production” of these properties was 3,978 pesos, their estimated value was 132,600 pesos at a rental rate of 3%.Footnote 36 In 1857, she was still a wealthy owner of fincas in Lima. In particular, she possessed five estates in the city, with a total annual production of 3,000 pesos.Footnote 37 Manuela also owned haciendas and chakras. For example, in 1843, she was listed as the owner of the chakra Cárdenas in the valley of Ate, and the chakra Legua in the valley of Magdalena.Footnote 38 In 1844, she appeared as the proprietor of the haciendas Retes and García Alonso in the province of Chancay, north of Lima (Quiroz, Reference Quiroz1987).
Table 3 shows the distribution of loans, according to lenders’ occupation, in addition to their role as moneylenders. A significant proportion of frequent lenders were also merchants and proprietors. Merchant lenders accounted for 17% to 21% of loans made by frequent lenders. In contrast, merchant lenders accounted for only about 7% of loans made by occasional lenders. In addition, proprietors accounted for 24% to 26% of loans made by frequent lenders, while service providers accounted for 15% to 19%. By comparison, proprietors made 13% to 14% of loans from occasional lenders, while service providers accounted for 4%. On the other hand, occasional lenders were less well documented than frequent lenders. Indeed, the occupation of the lender (in addition to their role as moneylenders) could not be identified for 34% to 37% of the loans made by occasional lenders, compared to less than 3% for loans from frequent lenders.
Sources of loans in Lima

Notes: The table shows the distribution of loans according to the occupation of the lender. For each loan contract, it was determined whether the lender was a frequent lender or an occasional lender. For a loan of lender i to borrower j at date t (t ≥ January 1, 1845) lender i was defined as a frequent lender if he/she made more than K loans in the five years prior to t, where K = 5 (first definition), 10 (second definition). Lender i was defined an occasional lender if he/she made up to K loans in the five years prior to t. The table also shows the average loan size for the entire data set.
Therefore, frequent lenders were usually wealthy individuals with real estate properties in Lima and, in some cases, haciendas. Many were merchants or proprietors. However, there were also frequent lenders with different occupations. In contrast, some occasional lenders were wealthy, but others were not. Given the significant amounts of capital lenders typically invested, it is unlikely low-income individuals participated in the notarized credit market as lenders, even as occasional lenders.
Most loans were granted by occasional lenders, who made between 78% and 87% of the value of loans in the sample. However, although overall frequent lenders accounted for a lower proportion of the number of loans than occasional lenders, they could have had an important role in the allocation of credit. In the next sections, I will analyze the differences in the destination of loans between frequent and occasional lenders.
4. Destination of loans and capital mobilization
On average, frequent lenders were wealthier than occasional lenders. They could promote the mobilization of capital by lending to middle- and low-income borrowers. Did frequent lenders in 19th-century Lima facilitate capital mobilization for broader economic participation, or did they primarily cater to the credit needs of the wealthy? Were there differences in the allocation of credit between frequent and occasional lenders?
There were reasons for frequent lenders to primarily extend loans to larger borrowers compared to occasional lenders. First, frequent lenders were wealthier, providing them with the resources to fund substantial loans to the largest borrowers. Second, their ability to mobilize significant capital allowed them to make large loans without incurring concentration risks. Third, frequent lenders likely had connections with affluent individuals, reducing information asymmetries when lending to wealthy borrowers.
However, there were also reasons for frequent lenders to extend loans to middle- and low-income borrowers. First, having provided credit for several years, frequent lenders likely possessed better knowledge of potential borrowers than occasional lenders, including not only large borrowers, but also medium and small borrowers. Second, the allocation of loans depended partly on the demand for credit. If there were relatively few large borrowers, both frequent and occasional lenders would primarily grant loans to middle- and even low-income borrowers.
Frequent lenders extended some loans to wealthy borrowers, including merchants (Table 4). Merchants received approximately 4.5% of the loans made by these lenders. One of those merchants was Antonio Pedro Oliveira, who borrowed 4,000 pesos from frequent lender Felipe Barreda in May 1861. Similarly, in September 1862, almacenero Juan Rivera borrowed approximately 49,000 pesos from Pedro Denegri, another frequent lender. The loan, with a one-year maturity, was secured by Rivera’s house and orchard in Plazuela de las Mercedarias, as well as his commercial establishment on Palacio and Bodegones streets.Footnote 39 Hacendados and agriculturists, some of whom were wealthy, also received credit from frequent lenders, accounting for between 12% and 14% of their loans. For example, hacendado Manuel Elguera obtained two loans from Pedro Gonzales de Cándamo, a frequent lender and wealthy entrepreneur.Footnote 40 Proprietors, some of whom were also affluent, were another significant group of borrowers from frequent lenders, receiving 26% of their loans. For example, Pedro Terry, a proprietor of fincas in Lima, was an important borrower of Gonzales de Cándamo. Between 1857 and 1859, he received a total of 80,000 pesos in two loans.Footnote 41
Destination of notarized loans

Notes: The table shows the distribution of loans according to the occupation of the borrower. For each loan contract, it was determined whether the lender was a frequent lender or an occasional lender. For a loan of lender i to borrower j at date t (t ≥ January 1, 1845) lender i was defined as a frequent lender if he/she made more than K loans in the five years prior to t, where K = 5 (first definition), 10 (second definition). Lender i was defined as an occasional lender if he/she made up to K loans in the five years prior to t. The table also shows the average loan size for the entire data set.
However, many borrowers from frequent lenders were not wealthy.Footnote 42 Government employees, who typically earned medium incomes, were among those who received credit from these lenders, accounting for 31% to 36% of their loans. For instance, in June 1861, Bernardo Muñoz, a member of the Supreme Court of Lima, borrowed 2,400 pesos from Pedro Denegri.Footnote 43 In August 1863, Juan Peña, a public employee, borrowed 525 pesos from Adrian Bielich, using his wage as collateral.Footnote 44 Frequent lenders also extended credit to retailers, artisans, and professionals, occupations typically not associated with high incomes, similar to government employees. For example, in April 1850, retailer Juan Díaz borrowed 1,000 pesos from Cipriano Correa.Footnote 45 In August 1860, lawyer Tomás Lama borrowed 1,637 pesos from Manuel Román.Footnote 46 In November 1862, Santiago Bianchi, a pasta maker, borrowed 650 pesos from Pedro Denegri.Footnote 47 Similarly, in June 1863, carpenter Calixto Rosas borrowed 600 pesos from Pedro Denegri.Footnote 48
Occasional lenders also provided credit to a wide range of borrowers. Some were rich merchants, hacendados, and proprietors. For example, in December 1857, merchant Juan Ondarza borrowed 3,100 pesos from Manuel Carrillo, a lender with only one loan in the sample.Footnote 49 In June 1863, bodeguero Gerónimo Peirano borrowed 2,000 pesos from Francisco Campodónico, another occasional lender.Footnote 50 In August 1863, hacendado Pedro Paz Soldán borrowed 24,000 pesos from Miguel San Román, another occasional lender.Footnote 51
However, many other borrowers of occasional lenders were not wealthy. These lenders extended loans to retailers, artisans, government employees and other middle- and low-income borrowers. For instance, in April 1857, cajonero Domingo Barraza borrowed 500 pesos from Toribia Suaso.Footnote 52 In July 1857, mason José Parreño borrowed 275 pesos from Manuel Villacampa.Footnote 53 In October 1864, baker José Rivera borrowed 550 pesos from Félix Zambrano.Footnote 54
There were some differences in the distribution of loans by borrower occupation, between frequent and occasional lenders. For example, proprietors and government employees received a larger share of loans from frequent lenders, while manufacturers received a greater proportion of loans from occasional lenders. However, there were also significant similarities. The proportion of loans granted to occupational categories associated with high incomes was similar for both groups of lenders. Specifically, merchants, agriculturists (usually hacendados), and proprietors received between 43% and 45% of loans from frequent lenders, and about 40% of loans from occasional lenders.Footnote 55
The fact that frequent lenders made loans to a wide variety of borrowers was important for capital mobilization. These lenders were among the wealthiest individuals in Lima. Overall, frequent lenders accounted for a lower proportion of the total value of credit than occasional lenders. However, by lending to a variety of borrowers, they contributed to the mobilization of capital from the top of the income distribution to the middle- and low-income segment. Frequent lenders could have focused on lending to large borrowers; however, they also satisfied the credit needs of other borrowers.Footnote 56
5. Risk diversification
Private lenders faced a risk of default when making loans. Even if they screened borrowers and monitored the use of funds, unforeseen events could arise, causing borrowers to struggle with repayment. Lenders could mitigate this risk by diversifying their investments across various sectors. If one sector experienced a negative shock, lenders who concentrated their funds in that sector could incur significant losses. By spreading their funds across multiple sectors, lenders could lessen the impact of negative shocks in any sector of the economy.
Frequent lenders could lend to borrowers from a wider range of sectors than occasional lenders. For example, a private lender could lend to merchants, hacendados, civil servants, proprietors and artisans. The average risk of default would be lower. In contrast, an occasional lender who lent only to artisans would face significant losses if the manufacturing sector experienced a negative shock. Certainly, it is possible that a frequent lender only lent to borrowers from the same sector; but it was also possible for a frequent lender to diversify risk across economic sectors. Did frequent lenders diversify risk to a larger extent than occasional lenders?
Using information from the dataset, it was possible to calculate the distribution of loans by borrower occupation. For a loan from lender i to borrower j on date t,  ${x_m}$ was calculated as the share of borrower occupational category m in the total value of loans from lender i in the five years up to t, where m = 1, 2, …, M (M = 8). The following borrower occupational categories were considered: i) merchants and traders, ii) service providers, iii) agriculturists, iv) members of religious institutions, v) professionals, vi) government employees, vii) proprietors, and viii) manufacturers.
Using information on sectoral shares,  ${x_m}$, two indicators of sectoral concentration risk were calculated: the concentration ratio, and the Herfindahl ratio. For a loan from lender i to borrower j on date t, the concentration ratio was equal to the maximum share ${x_m}$, while the Herfindahl ratio was calculated as $HR_{it}\,=\,{\sum}_{m=1}^{M}x^{2}_{m}$. The higher the values of the two indicators, the more concentrated the distribution of the value of loans across occupational categories, and thus the higher the concentration risk. If a lender allocated the same value of loans to all occupational categories, the concentration ratio would be 1/M = 0.125, and the Herfindahl ratio would also be 1/M = 0.125. On the contrary, if a lender allocated all its loans to a single category, both concentration risk indicators would be equal to 1.0.
Table 5 shows descriptive statistics for the concentration ratio and the Herfindahl ratio, as well as the distribution of loans, according to these two indicators of concentration risk. Frequent lenders were able to diversify risk by lending across the occupational spectrum. The evidence shows that they diversified risk to a greater extent than occasional lenders. On average, frequent lenders had a concentration ratio of about 0.6, meaning that they allocated 60% of their total loan value to the largest sector recipient. In comparison, occasional lenders allocated 90% of their total loan value to the largest sector recipient. Between 43% and 47% of loans made by frequent lenders had a concentration ratio exceeding 0.6. In contrast, between 87% and 91% of loans from occasional lenders had a concentration ratio above 0.6. Some occasional lenders made only a single loan, resulting in a concentration ratio of 1.0. When these occasional lenders are excluded from the sample, the remaining occasional lenders exhibited a lower average concentration ratio. Nonetheless, their average ratio remained higher than that of frequent lenders.
Concentration ratio and Herfindahl ratio

Notes: The table shows descriptive statistics of the concentration ratio and the Herfindahl ratio, as well as the distribution of loans, according to these ratios. For a loan contract between lender i and borrower j at date t (t ≥ January 1, 1845), the concentration ratio was calculated as the maximum sectoral share in the total value of loans of lender i in the five years up to date t, and the sectoral Herfindahl ratio was calculated as the sum of the squares of the shares of each sector in the total value of loans of lender i in the five years up to date t. The following sectors were considered: commerce, services, agriculture, religious, professionals, public employees, proprietors and manufacture. Lender i was defined as a frequent lender if he/she made more than K loans in the five years prior to t, where K = 5 (first definition), 10 (second definition). Lender i was defined as an occasional lender if he/she made up to K loans in the five years prior to t. 1/ All occasional lenders were considered. 2/ Occasional lenders who did not make any loan in the five years prior to t were not considered.
On the other hand, the Herfindahl ratio was lower for frequent lenders than for occasional lenders. Specifically, the average Herfindahl ratio was approximately 0.5 for frequent lenders, and between 0.8 and 0.9 for occasional lenders. About 32% of loans made by frequent lenders had a Herfindahl ratio exceeding 0.6. In comparison, 77% to 82% of loans made by occasional lenders were associated with a Herfindahl ratio above 0.6.Footnote 57
Therefore, frequent lenders distributed loans across a broader range of sectors, diversifying their portfolios more extensively than occasional lenders. Their diversification could help them mitigate the average risk of default.
6. Repeated lending
Lenders typically lack perfect information about potential borrowers, including their risk profiles. This information gap can result in adverse selection.Footnote 58 In the 19th century, lenders in Lima faced information asymmetries. In a city with thousands of inhabitants, lenders likely lacked perfect information about potential borrowers.Footnote 59
Lenders could screen potential borrowers. They could analyze the credit history of borrowers to estimate their risk of default. They could also examine other aspects of borrowers’ lives to assess their risk levels. Screening provided valuable information about borrowers’ riskiness, reducing the likelihood of adverse selection. However, the screening process was costly, requiring lenders to invest both time and money.
Notaries could assist in the screening process by providing valuable information about borrowers. They likely had some knowledge of borrowers’ credit history and the assets they owned, which could serve as collateral. This information could help lenders reduce the probability of adverse selection.Footnote 60 However, while notaries offered valuable insights, their information was likely imperfect.
Repeated lending could also help lenders address information asymmetries.Footnote 61 By building a long-term relationship with borrowers, lenders could gain substantial insights into their risk profiles. They could learn about borrowers’ past behavior, such as whether they consistently made payments on time, or were frequently late. Additionally, lenders could gather information about borrowers’ earnings flows, which was valuable in assessing their ability to repay debts with their regular net income.
Frequent lenders were likely better equipped to overcome information asymmetries than occasional lenders. By investing time and resources in building a network of contacts, they could gain a deeper understanding of potential borrowers compared to other lenders.
A loyalty rate was calculated for each loan contract. For a loan from lender i to borrower j on date t, the loyalty rate was calculated as the proportion of loans made by lender i to borrower j in the five years prior to t relative to the total number of loans made by lender i to any borrower during the same period.
Table 6 shows descriptive statistics for the loyalty rate to borrowers, as well as the distribution of loans by loyalty rate. Loyalty rates for frequent lenders are compared to those for occasional lenders. Using K = 5, the average loyalty rate was 0.04 for frequent lenders, and 0.15 for occasional lenders. Using K = 10, the average loyalty rate was 0.03 for frequent lenders, and 0.13 for occasional lenders. Loyalty rates to borrowers were consistently lower for frequent lenders. For instance, 93% to 95% of loans made by frequent lenders were associated with loyalty rates between 0 and 0.2, compared to 72% to 75% of loans made by occasional lenders. In addition, no loans (0%) made by frequent lenders, but 16% to 20% of loans made by occasional lenders, were associated with loyalty rates between 0.8 and 1.0.
Loyalty rates to borrowers

Notes: The table shows descriptive statistics of the loyalty rate to borrowers, as well as the distribution of loans, according to the loyalty rate, for large and small lenders. The loyalty rate to borrowers was calculated for each contract. For a loan contract between lender i and borrower j at date t (t ≥ January 1, 1845), the loyalty rate was calculated as the number of loans by lender i to borrower j in the five years prior to t as a proportion of the total number of loans by lender i to any borrower in the same period. Lender i was defined as a frequent lender if he/she made more than K loans in the five years prior to t, where K = 5 (first definition), 10 (second definition). Lender i was defined as an occasional lender if he/she made up to K loans in the five years prior to t. The calculations of loyalty rates does not consider the lenders who did not make any loan in the five years prior to t.
A multivariate analysis was conducted to assess whether frequent lenders engaged in repeated lending less often than occasional lenders. The dependent variable is the loyalty rate of lender i to borrower j, calculated as the proportion of loans made by lender i to borrower j in the five years preceding t, the date of the contract signing.
Dummy variables were included in the model to assess differences in the dependent variable between frequent lenders and occasional lenders. Two alternative definitions of frequent lenders were considered (K = 5, 10). One dummy variable was set to 1.0 if the lender made more than five loans in the five years prior to date t. An alternative dummy is equal to 1.0 if the lender made more than ten loans in the five years prior to t.
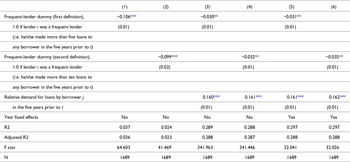
Table 7 shows the OLS estimates. Column 1 includes the first frequent-lender dummy (K = 5). The results show that the coefficient of the frequent-lender dummy is − 0.106, significant at the 1% level. Column 2 includes the second frequent-lender dummy (K = 10), where the coefficient is − 0.099, also significant at the 1% level. These results in columns 1 and 2 indicate that frequent lenders had lower loyalty rates than occasional lenders.
Econometric estimation. Dependent variable: Loyalty rate of lender i to borrower j in the five years prior to t

Notes: The table shows the OLS estimates of several regressions for the loyalty rate of lender i to borrower j in the five years prior to t as dependent variable. For a loan contract between lender i and borrower j at date t, the loyalty rate was calculated as the number of loans by lender i to borrower j in the five years prior to t as a proportion of the total number of loans by lender i to any borrower in the same period. Lender i was defined as a large lender if he/she made more than K loans in the five years prior to t, where K = 5, 10. The relative demand for borrower j in the five years prior to t was calculated as the ratio between the number of loans obtained by borrower j from any lender in the five years prior to t and the number of loans made by lender i to any borrower in the same period. Standard errors are in parenthesis. Columns 1–4 include a constant, while columns 5–6 include year fixed-effects. Significance levels: *** 1%, **5%, * 10%.
Repeated lending may be influenced by the demand for loans. A lender is more likely to make repeated loans to a borrower who frequently seeks loans compared to a borrower who rarely does. In some cases, some borrowers only required a single loan. A lender who granted a loan to such a borrower would not engage in repeated lending with him/her simply because no additional loans were needed. Even if the lender was willing to provide more funds to the same borrower, repeated lending would not occur in the absence of further demand.
A variable is included in the model to control for the demand for loans. This control variable is the relative demand for loans by borrower j in the five years prior to t, where t is the date a notarized loan contract was signed between lender i and borrower j. The relative demand was calculated using the following ratio: Number of loans obtained by borrower j from any lender in the five years prior to t/Number of loans made by lender i to any borrower in the five years prior to t. This ratio may have a positive effect on the dependent variable.
Columns 3 and 4 include the relative demand for loans by borrower j, alongside the frequent-lender dummies. The coefficient for the relative demand for loans by borrower j is approximately 0.16, and is significant at a 1% level. These results indicate that the relative demand for loans by borrower j has a positive effect on the loyalty rate of lender i to borrower j. Notably, after controlling for the relative demand for loans by the borrower, the coefficients of the frequent-lender dummies are lower in absolute value than those in columns 1 and 2. However, the coefficients remain negative and significant. In column 3, the coefficient of the frequent-lender dummy is − 0.03, significant at the 5% level. Similarly, in column 4, the coefficient of the frequent-lender dummy is also − 0.03, significant at the 5% level.
Other variables may also be omitted from the model, some of which could vary over time. For instance, the loyalty rate to borrowers might increase in certain years due to higher uncertainty. If frequent lenders reduced their supply of funds during these periods to a greater extent than occasional lenders, the coefficient of the frequent-lender dummy could exhibit a negative bias.
To address omitted variables that vary over time, time fixed-effects were included in the model. The results are reported in columns 5 and 6. The estimates indicate that the coefficients of the frequent-lender dummies are negative and significant. Moreover, the coefficients in columns 5 and 6 are very similar to the coefficients in columns 3 and 4.
The results indicate that repeated lending was less likely among frequent lenders, who exhibited a lower loyalty rate compared to occasional lenders. This finding aligns with the hypothesis that frequent lenders had more information about potential borrowers than occasional lenders.
7. Conclusions
Frequent lenders were wealthy men and women who allocated funds. Some were merchants, some were hacendados, others were proprietors. They extended credit to a range of borrowers, from the wealthy to those with medium and small needs. Although they accounted for less than 30% of the total value of loans in the sample, these lenders were crucial in mobilizing capital in Lima’s credit market, by lending to a diverse group of borrowers, not just the richest borrowers in Lima. The fact that frequent lenders made loans to a variety of borrowers was important for the mobilization of capital. Frequent lenders were among the richest people in Lima. By lending to a variety of borrowers, they contributed to the mobilization of capital from the top of the income distribution to the segment of middle- and low-income borrowers.Footnote 62
Frequent lenders enjoyed some competitive advantages relative to occasional lenders. For example, frequent lenders lent to borrowers from different sectors, thereby diversifying risk to a greater extent than occasional lenders. The sectoral concentration ratio and Herfindahl ratio were lower for frequent lenders. In particular, over a five-year period to the contract date, the average concentration ratio was 0.6 for frequent lenders, and 0.9 for occasional lenders, while the Herfindahl ratio was 0.5 for frequent lenders, and between 0.8 and 0.9 for occasional lenders.
In addition, frequent lenders reduced information asymmetries. One would expect that frequent lenders would have more valuable information about the riskiness of borrowers than occasional lenders, and thus that information asymmetries would be less important for frequent lenders. Consistently, the evidence shows that repeated lending was less likely among frequent lenders. In particular, on average, the loyalty rate to borrowers in the five years prior to the loan contract was between 0.03 and 0.04 for frequent lenders, and between 0.13 and 0.15 for occasional lenders.
Frequent lenders could be seen as an intermediate stage between a system with only occasional lenders and a system with banks. A common view of banks is that they experienced gains from specialization in financial intermediation. Banks gained in efficiency by exploiting economies of scale, diversifying risk, and reducing information asymmetries. If banks gained from specialization, frequent lenders could also experience some gains in efficiency from some degree of specialization.
Acknowledgements
I am grateful to the editors of Revista de Historia Económica/Journal of Iberian and Latin American Economic History and the three anonymous referees for their comments and suggestions. This work was funded by the Research Promotion Office of PUCP through the Research Support Fund (FAI 2022).


 Open access