


Preparing food at home is a complex behaviour entailing a sequence of steps, from obtaining food, to planning and preparing meals, to finally serving and eating the meal( Reference Kaufmann 1 ). Food prepared at home is generally healthier than food obtained away from home( Reference Lin and Guthrie 2 – Reference Larson, Perry and Story 5 ), suggesting that people who prepare food at home likely eat a healthier diet compared with people who obtain the majority of their meals away from home. Consequently, a myriad of obesity prevention strategies focus on avoiding fast and processed foods, as well as ensuring access to fresh produce for all Americans( Reference Kohan 6 , Reference Story, Kaphingst and Robinson-O'Brien 7 ). These strategies hinge on the assumption that if given the knowledge and opportunity, most people would purchase fresh ingredients and prepare food at home. Obesity prevention interventions are increasingly moving towards addressing the intermediate steps between food access and healthy eating – planning meals, procuring ingredients and preparing food at home( Reference Fulkerson, Rydell and Kubik 8 , Reference Davis, Ventura and Cook 9 ). Little research, however, has examined current patterns of home food preparation in the USA and the factors affecting this complex behaviour; such work is necessary to ensure that interventions can be appropriately tailored to the needs of various groups.
Time spent on cooking in the USA declined by almost 40 % from 1965 to 1995( Reference Jabs and Devine 10 ). While time-saving devices such as microwave ovens and food processors have allowed for greater efficiency, decreased frequency of cooking is likely the driving force behind this sharp decline. With ever busier lives, employed mothers’ likelihood of allotting time for food preparation depends on other competing priorities, as well as their self-efficacy related to cooking and nutrition( Reference Jabs, Devine and Bisogni 11 ). Parents may use food choice as a way to cope with stressors at home and work, using fast food or TV dinners as a reward for a difficult day or week( Reference Devine, Jastran and Jabs 12 ). Cooking has declined despite evidence that regular family meals lead to healthier diets and lower BMI in children and adolescents( Reference Gillman, Rifas-Shiman and Frazier 13 – Reference Rollins, Belue and Francis 17 ), although most studies about family meals do not delineate whether mealtime food is prepared at home or obtained outside the home. Efforts to elucidate the relationship between home food preparation and BMI have had mixed results. A study among African American adolescents from low-income families in Baltimore showed that an increased frequency of home food preparation alone was associated with a higher BMI, while adolescents from families who prepared food at home and used healthy cooking methods had a lower BMI( Reference Kramer, Coutinho and Vaeth 18 ). Another study examining the relationship between adult Americans’ time-use choices and BMI found that increasing time spent on home food preparation was associated with lower BMI for adult women only( Reference Zick, Stevens and Bryant 19 ). From a life course standpoint, a study in Minnesota showed that food preparation behaviours track over time, and individuals who were involved in home food preparation during emerging adulthood had healthier diets in their mid to late twenties( Reference Laska, Larson and Neumark-Sztainer 20 ).
This body of work suggests three things. First, home food preparation patterns have changed over the past several decades: time spent on cooking has declined( Reference Smith, Ng and Popkin 21 ), and cooking skills and knowledge have eroded( Reference Jabs, Devine and Bisogni 11 ). Second, home food preparation may be an important predictor of eating a healthful diet( Reference Lin and Guthrie 2 – Reference Larson, Perry and Story 5 ). Third, the relationship between BMI and home food preparation is complex, variable and requires further study( Reference Kramer, Coutinho and Vaeth 18 , Reference Zick, Stevens and Bryant 19 ). In addition, the literature reveals a broad assumption that marginalized populations, including minority and low socio-economic status (SES) groups, are more likely to engage in obesogenic behaviours and, conversely, higher-SES groups are more likely to engage in healthy behaviours. While this assumption has proven true for many health-related behaviours, including fast-food consumption( Reference Pabayo, Spence and Cutumisu 22 ) and physical activity( Reference Pabayo, Spence and Cutumisu 22 , Reference Boone-Heinonen, Diez Roux and Kiefe 23 ), variability in home food preparation across subsets of the population has not been examined.
Understanding patterns of health-related behaviours on a population level is crucial for designing, and appropriately targeting, public health interventions and policy. We therefore employed a large, nationally representative data source to examine the relationship between home food preparation and SES, race/ethnicity, family structure and other sociodemographic factors.
Methods
Study population
We analysed the prevalence and patterns of cooking dinner at home in the USA. We used National Health and Nutrition Examination Survey (NHANES) data pooled from 2007 and 2008, the only years of available data during which the outcome of interest was measured. NHANES is a nationally representative, cross-sectional data set collected by the National Center for Health Statistics. NHANES began in the 1970s and has been administered annually since 1999. Complex, multistage probability sampling is used to enrol approximately 5000 people from fifteen counties in the USA each year( 24 ). Specific individuals and counties vary from year to year. All ages are included. The sample is representative of the US civilian, non-institutionalized population. An average of 1·6 individuals are included from each household. In 2007 and 2008, 12943 individuals were selected and 10149 of them were interviewed. Our sample includes the households of all 10149 interviewed participants.
Outcome
The primary outcome was self-reported frequency of cooking dinner at home. This was determined during an in-person, household interview, by asking, ‘During the past seven days, how many times did you or someone else in your family cook food for dinner or supper at home? This includes time putting ingredients together to cook a meal. Do not include heating up leftovers’( 25 ). One reference person from each household answered this and other household-level questions. It is unknown whether the household reference person was the main food preparer in the household; for the purposes of the present analysis, we have assumed that responses will not be significantly affected by the cooking status of the household reference person. Possible answers ranged from 0 to 7 dinners cooked at home per week; 98·5 % of participants responded.
Covariates
We included sociodemographic covariates describing the household whenever possible because the outcome, cooking dinner at home, is a household activity. SES was measured using the household poverty level and the household reference person's education level. The household reference person's employment status was not available for inclusion. We categorized poverty level into three groups: below 130 % of the US Census Bureau federal poverty level (FPL), 130–350 % of FPL and above 350 % of FPL. Households below 130 % of FPL are eligible for Supplemental Nutrition Assistance Program benefits. The household reference person's education level was categorized as: less than 9th grade, 9th–11th grade, high-school graduate or general equivalency degree (GED), some college or Associate's degree, and college graduate or above.
The household reference person was always aged 18 years or older. We categorized age into four groups: 18–25 years, 26–45 years, 46–65 years and over 65 years. We included race/ethnicity and country of birth as proxies of culture. The household reference person's race/ethnicity was not available for inclusion, so the study participant's race/ethnicity was used. Race/ethnicity was self-reported as white, black, Hispanic or other. The household reference person's country of birth was reported as born in the USA, born in a Spanish-speaking country, or born in a foreign, non-Spanish-speaking country. We collapsed country of birth into two categories: US-born or foreign-born.
We included marital status and the presence of dependants in the household as indicators of family structure. We categorized the household reference person's marital status into two groups: either living with a partner (living with a partner or married) or living without a partner (widowed, divorced, separated or never married). We inferred the presence of dependants in the household by subtracting 1 from the household size if the reference person was not living with a partner and by subtracting 2 if the reference person was living with a partner. If the resulting number was greater than or equal to 1, we classified that household as having dependants.
We also included household food security, which was determined using the US Food Security Survey module and was categorized as very low, low, marginal or full food security.
Statistical analysis
All analyses accounted for the complex NHANES survey design, including stratification, cluster design and weighting, producing estimates and standard errors representative of the non-institutionalized US population( 24 ). We examined frequency of cooking dinner at home as an ordinal, count variable, ranging from 0 to 7 dinners cooked at home per week. We calculated the prevalence of each frequency of cooking dinner at home, as well as the mean number of dinners cooked per week by various sociodemographic groups, using the covariates above.
We then collapsed the frequency of cooking dinner at home into three categories, comparing households that never cook dinner (0–1 dinners cooked per week) or always cook dinner (6–7 dinners cooked per week), with households that sometimes cook dinner at home (2–5 dinners cooked per week). We determined the distribution of each sociodemographic group across dinner categories and fit a multinomial logistic regression model to test associations between cooking dinner at home and the sociodemographic covariates. We tested for interactions between SES variables and race/ethnicity. We performed fractional polynomial regression to better understand the relationship between SES and cooking dinner at home, by plotting the predicted mean household poverty level and education level based on the frequency of home dinner preparation. All analyses were done using the statistical software package Stata 11·2.
Results
On a population level, 8 % of Americans reported never cooking dinner, 43 % sometimes cooking dinner and 49 % always cooking dinner at home (Tables 1 and 2). There were differences in the average number of dinners cooked at home per week across many of the covariates (Table 3). Respondents from households below 130 % of FPL cooked an average of 5·4 dinners per week (95 % CI 5·2, 5·7) compared with 4·8 dinners per week for households over 350 % of FPL (95 % CI 4·6, 5·0). Respondents from households where the reference person had less than a 9th grade education cooked an average of 6·0 dinners per week (95 % CI 5·7, 6·2), compared with 4·9 dinners per week (95 % CI 4·7, 5·1) if the reference person attended at least some college. Respondents from black households cooked the fewest dinners at home (mean 4·4, 95 % CI 4·2, 4·6). Respondents from Hispanic households with a foreign-born reference person cooked more (mean 5·9, 95 % CI 5·8, 6·1) than respondents from Hispanic households with a US-born reference person (mean 4·9, 95 % CI 4·7, 5·1), who cooked at a rate similar to whites (mean 5·0, 95 % CI 4·8, 5·2). In general, respondents from households where the reference person was US-born cooked an average of 4·9 dinners per week (95 % CI 4·7, 5·1), compared with 5·8 dinners per week (95 % CI 5·7, 6·0) if the reference person was foreign-born. Respondents from households with dependants cooked more often (mean 5·2, 95 % CI 5·1, 5·4) than respondents who lived alone and respondents from households without dependants (mean 4·6, 95 % CI 4·3, 5·0).
Prevalence of home dinner preparation in the USA; National Health and Nutrition Examination Survey (NHANES) 2007–2008Footnote * Footnote †
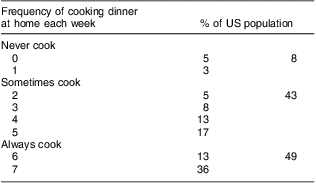
* n 9993, population size = 293 699 077.
† All analyses were completed with appropriate weighting, taking into account the complex survey design of NHANES 2007–2008.
Sociodemographic characteristics of the total sample and in each dinner preparation categoryFootnote *; National Health and Nutrition Examination Survey (NHANES) 2007–2008
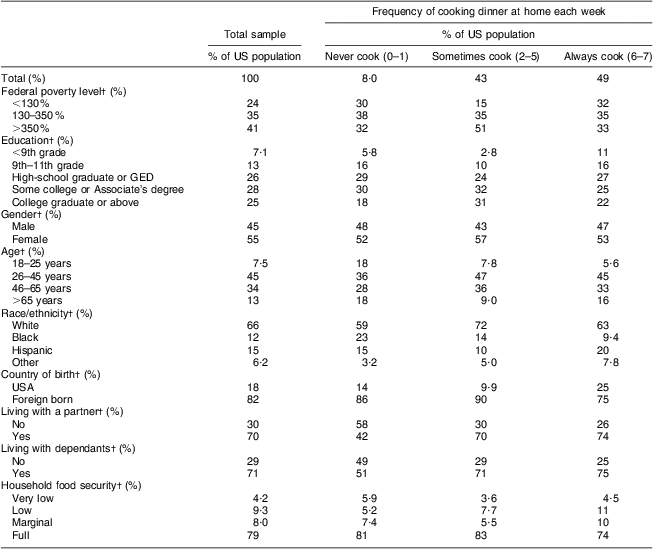
GED, general equivalency degree.
* All analyses were completed with appropriate weighting, taking into account the complex survey design of NHANES 2007–2008.
† Differences in the percentage of the sociodemographic group present in each dinner category were significant at P < 0·001 by the Wald χ 2 test.
Frequency of home dinner preparation by sociodemographic groupFootnote *; National Health and Nutrition Examination Survey (NHANES) 2007–2008
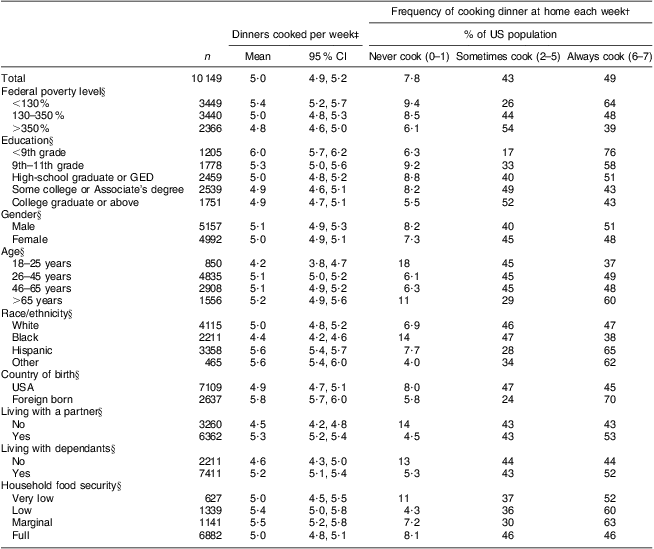
GED, general equivalency degree.
* All analyses were completed with appropriate weighting, taking into account the complex survey design of NHANES 2007–2008.
† We calculated the percentage of each sociodemographic group in each dinner category.
‡ We calculated the mean number of dinners cooked per week and the 95 % confidence interval for each sociodemographic group.
§ Differences in the percentage of the sociodemographic group present in each dinner category were significant at P < 0·001 by the Wald χ 2 test.
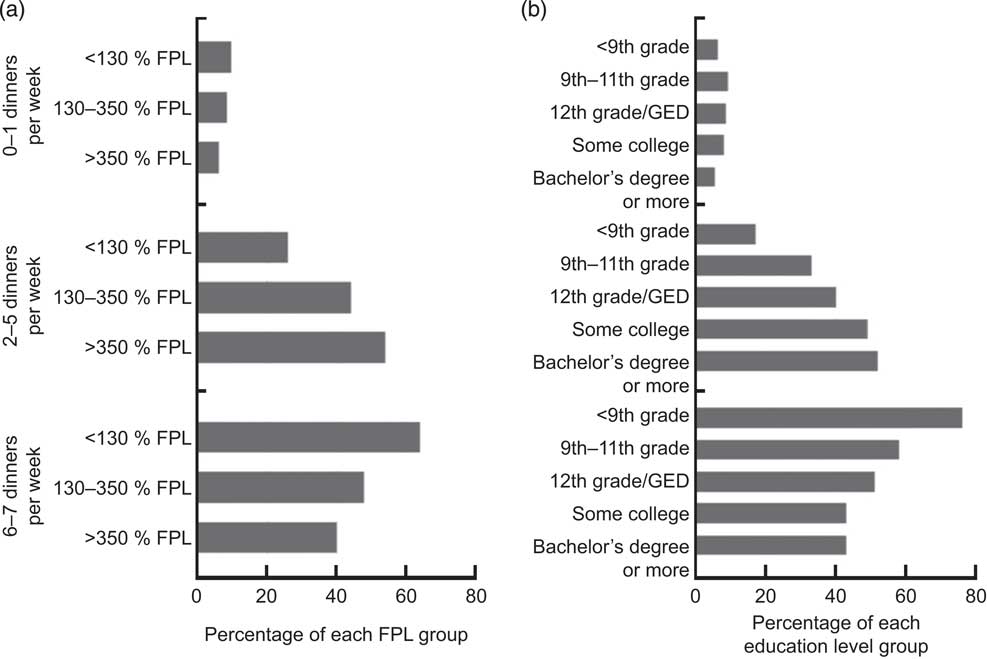
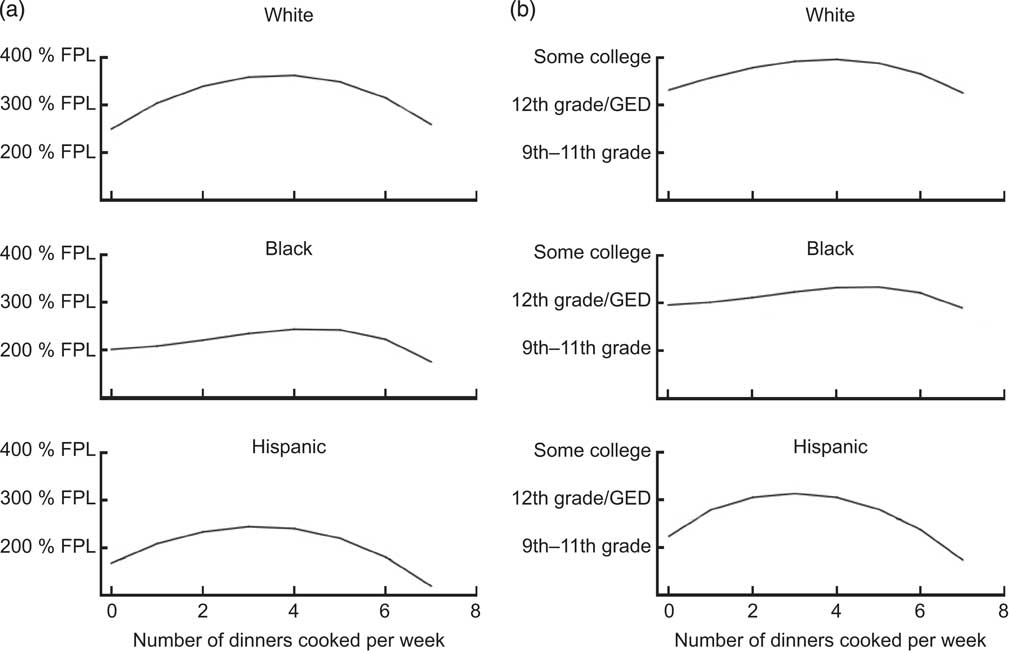
Frequency of home dinner preparation varied across the SES spectrum (Figs 1 and 2). Poorer, less educated households were more likely to either always or never cook dinner at home, whereas wealthier, more educated households were more likely to sometimes cook dinner at home. This pattern was evident across all self-reported race and ethnicity groups.
Socio-economic status (SES) and home dinner preparation in the USA; National Health and Nutrition Examination Survey (NHANES) 2007–2008. We plotted the percentage of each SES group, stratified by (a) federal poverty level (FPL) and (b) education level, in each dinner category (0–1, 2–5 or 6–7 dinners cooked at home per week). The corresponding numbers are found in Table 3; all differences were significant at P < 0·001 by the Wald χ 2 test (GED, general equivalency degree)
Predicted socio-economic status based on frequency of home dinner preparation in the USA; National Health and Nutrition Examination Survey (NHANES) 2007–2008. We stratifed by race/ethnicity and used fractional polynomial regression to predict (a) the mean expected household federal poverty level (FPL) and (b) the mean expected education level based on the number of dinners cooked at home per week (GED, general equivalency degree)
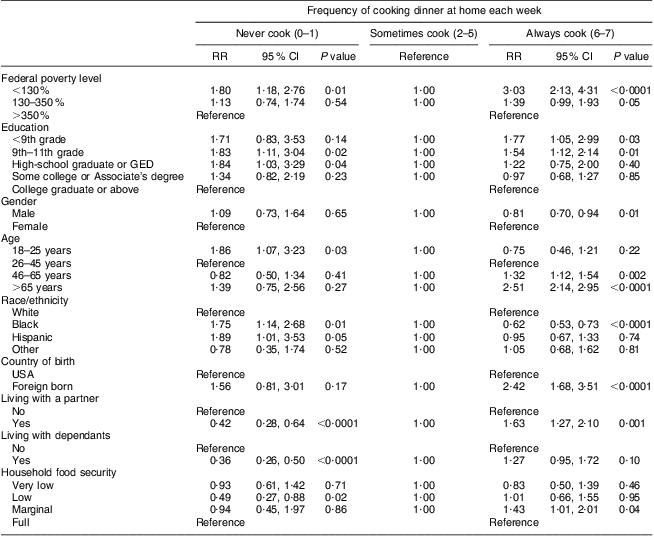
In the multinomial regression, we determined the likelihood of always or never cooking dinner at home, compared with sometimes cooking dinner at home (Table 4). Adjusting for the other covariates, several characteristics were significantly associated with a greater likelihood of always cooking dinner at home: income less than 130 % of FPL (relative risk (RR) = 3·03, 95 % CI 2·13, 4·31, P < 0·0001), income 130–350 % of FPL (RR = 1·39, 95 % CI 0·99, 1·93, P = 0·05), 11th grade education or less (<9th grade: RR = 1·77, 95 % CI 1·05, 2·99, P = 0·03; 9th–11th grade: RR = 1·54, 95 % CI 1·12, 2·14, P = 0·01), age greater than 45 years (age 45–65 years: RR = 1·32, 95 % CI 1·12, 1·54, P = 0·002; age >65 years: RR = 2·51, 95 % CI 2·14, 2·95, P < 0·0001), having a foreign-born household reference person (RR = 2·42, 95 % CI 1·68, 3·51, P < 0·0001), living with a partner (RR = 1·63, 95 % CI 1·27, 2·10, P = 0·001) and having marginal food security (RR = 1·43, 95 % CI 1·01, 2·01, P = 0·04). On the other hand, income greater than 350 % of FPL, male gender and black race were all associated with a lower likelihood of always cooking dinner (male: RR = 0·81, 95 % CI 0·70, 0·94, P = 0·01; black: RR = 0·62, 95 % CI 0·53, 0·73, P < 0·0001).
Associations between sociodemographic characteristics and frequency of home dinner preparationFootnote *; National Health and Nutrition Examination Survey (NHANES) 2007–2008
RR, relative risk; GED, general equivalency degree.
* Relative risks and 95 % confidence intervals were calculated using multinomial regression models, with households that cook 2–5 dinners at home per week as the reference group.
Characteristics significantly associated with a greater likelihood of never cooking dinner at home were: income less than 130 % of FPL (RR = 1·80, 95 % CI 1·18, 2·76, P = 0·01), 9th–12th grade education (9th–11th grade: RR = 1·83, 95 % CI 1·11, 3·04, P = 0·02; high-school graduate or GED: RR = 1·84, 95 % CI 1·03, 3·29, P = 0·04), age 18–25 years (RR = 1·86, 95 % CI 1·07, 3·23, P = 0·03), black race (RR = 1·75, 95 % CI 1·14, 2·68, P = 0·01) and Hispanic ethnicity (RR = 1·89, 95 % CI 1·01, 3·53, P = 0·05). On the other hand, several characteristics were associated with being less likely to never cook dinner at home: if the reference person lived with a partner (RR = 0·42, 95% CI 0·28, 0·64, P < 0·0001), if there were dependants in the household (RR = 0·36, 95% CI 0·26, 0·50, P < 0·0001) and if there was low food security (RR = 0·49, 95% CI 0·27, 0·88, P = 0·02). Interaction terms between SES variables and race were not significant (data not shown).
Discussion
Based on this nationally representative sample from 2007 and 2008, patterns of home dinner preparation in the USA varied substantially with SES. Poorer, less educated households were more likely to either always or never cook dinner at home, and wealthier, more educated households were more likely to sometimes cook dinner at home. On the whole, half of American households always cooked dinner at home. Dinner preparation patterns also varied with family structure and culture. Households with dependants were much less likely to never cook dinner at home, and households where the reference person lived with a partner were more likely to always cook dinner at home. Being born outside the USA was associated with cooking more dinners at home. Interestingly, respondents from Hispanic households with a foreign-born reference person cooked the most dinners at home, while respondents from Hispanic households with a US-born reference person cooked at a rate similar to whites. Respondents from black households cooked the least.
The relative preponderance of cooking, a healthy behaviour( Reference Lin and Guthrie 2 – Reference Briefel, Wilson and Gleason 4 ), among low-SES households runs counter to the widely held assumption that low-SES groups are more likely to engage in unhealthy behaviours and high-SES groups are more likely to engage in healthy behaviours( Reference Pabayo, Spence and Cutumisu 22 , Reference Boone-Heinonen, Diez Roux and Kiefe 23 ). Confounding is unlikely to account for these observed relationships, which in our study hold true even when controlling for factors such as race/ethnicity and family structure. Previous studies have shown that time is a significant barrier preventing many people from cooking, and this is especially true among low-SES groups( Reference Jabs and Devine 10 – Reference Devine, Jastran and Jabs 12 ). Our work further explains these observations by showing that compared with high-SES groups, low-SES groups have a more dichotomous (never/always) distribution when it comes to cooking. One possible explanation for this finding is the differential value of time and money across SES strata, whereby for low-SES groups, the marginal value of time may be lower than the marginal value of money. That is, although cooking at home consumes more time, money is scarcer than time. There are only two ways to maximize food dollars in this setting: (i) cook at home or (ii) obtain cheap (often less healthy) food outside the home. Cooking allows limited food dollars to be stretched further. The opposite would be true in high-SES groups. With the emergence of discretionary income, the marginal value of time is greater than the marginal value of money, leading high-SES groups to be more likely to sometimes cook dinner at home and sometimes not. Assuming an equal desire to eat healthily and an equal ability to prepare food at home, variation in the marginal value of time and money may explain some of the variation in home food preparation patterns by SES.
Cooking at home can therefore represent either a choice or a forced option. Households with increased means via greater wealth and education choose to eat something other than a home-cooked meal several nights per week, while poorer, less educated households are forced to either always or never cook dinner at home. We found that while half of all Americans always cook dinner at home, the remainder obtain many or most dinners away from home. The well-described increase in processed and fast-food consumption over the past several decades suggests a concomitant decline in preparing food at home( Reference Nielsen, Siega-Riz and Popkin 26 ), and our data fit that pattern. On one hand, it is encouraging that despite the constraints of modern society, many Americans still find it possible to regularly prepare dinner at home. Yet the choice of wealthier members of US society not to cook at home is a choice to move towards something, be it leisure, less housework or more free time. Any effective public policy response to motivate home cooking as a means to healthy eating will have to account for these incentives.
Never or always cooking dinner at home also appears to be a forced option for populations marginalized by race or ethnicity. We found that households self-reporting as black or Hispanic were more likely to never cook dinner at home. The effect of Hispanic ethnicity was observed only after adjusting for being foreign-born, which is not surprising given that Hispanic households with a foreign-born reference person cooked much more than Hispanic households with a US-born reference person. This suggests that acculturation into a marginalized segment of American society may decrease the frequency of cooking dinner at home. Variation by race and country of birth supports the idea that cultural norms have a significant effect on people's cooking patterns, regardless of other factors( Reference Dubowitz, Acevedo-Garcia and Salkeld 27 , Reference Devine, Wolfe and Frongillo 28 ).
Family structure also plays a significant role in home food preparation habits. Households with dependants were one-third as likely to never cook dinner at home, and households where the reference person lived with a partner were 1·6 times more likely to always cook dinner at home. These data are consistent with the idea that cooking and feeding others are inherently social behaviours driven by a desire to provide both emotional and material stability, and that those who live in a social environment will therefore be more likely to cook( Reference Kaufmann 1 ).
The present study has both limitations and strengths. First is the certain existence of unmeasured confounders not reported in this data source, such as information about the local food environment, urban/suburban/rural location, household time constraints, and attitudes regarding the importance of health, nutrition and home-cooked meals. Second, the outcome, frequency of home dinner preparation, was based on self-report and therefore vulnerable to recall bias, social desirability and varying interpretations of the question, in particular the definition of cooking. Third, because the data are observational and cross-sectional, we can only observe associations and cannot infer causality. These relatively recent, nationally representative data do allow, however, for a current appraisal of home food preparation that is generalizable to the non-institutionalized US population. The wide reach and rapidly evolving nature of the obesity epidemic make it important to have a current, population-level understanding of health-related behaviours. The present study's most significant contribution is providing insight into the factors affecting home food preparation, an under-examined behaviour in the research on healthy eating and obesity.
Preparing healthy food at home is potentially one of the most significant points for effective interventions to curb the obesity epidemic, both at the individual and population level. Distinct patterns of home food preparation likely emerge because the factors driving home food preparation behaviours vary across different populations. Interventions aimed at increasing home food preparation will therefore need to be tailored and targeted to meet the unique needs of specific groups. The presumption of the ability and desire to prepare food at home is implicit in many obesity prevention strategies, including the national initiative to eradicate food deserts in the USA by 2017( Reference Kohan 6 ). The potential effectiveness of this initiative hinges on the assumption that if given access, families will purchase fresh ingredients and prepare healthy food at home. Recent data do not, however, show a consistent relationship between geographic proximity to fresh food and healthy eating( Reference Story, Kaphingst and Robinson-O'Brien 7 , Reference An and Sturm 29 – Reference Boone-Heinonen, Gordon-Larsen and Kiefe 31 ). Providing access to fresh ingredients is only the first step. Ensuring that people will choose to prepare food at home, operating within constraints of money and time, will help translate access into healthy eating. While many programmes incorporate food preparation ability into a broader agenda to improve healthy eating and active living, little research has focused directly on the home food preparation aspect of the intervention. A recent Cochrane review found that broad-based obesity prevention and intervention programmes in children have had mixed success, further underscoring the importance of systematically designing and tailoring intervention programmes to meet individual needs( Reference Oude Luttikhuis, Baur and Jansen 32 ).
There are four main considerations for future studies. First, although previous studies have shown that food prepared at home is generally healthier than food obtained away from home, we need to establish whether this relationship holds true across SES strata, cultural groups and family structures. Second, the relationship between home food preparation and health outcomes such as obesity, CVD and diabetes requires further study. Third, we must better understand the forces that shape household choices regarding home food preparation. Finally, we must design effective, enticing and scalable interventions to improve home food preparation practices across diverse groups.
Acknowledgements
Sources of funding: S.V. was supported by a National Research Service Award institutional training grant for primary medical care (T32-HP10026). No funder had a role in the design, analysis or writing of this article. Conflicts of interest: None of the authors had any conflict of interest to declare. Authors’ contributions: S.V., J.A.L., D.E.P. and C.F. designed the research. S.V., M.O.H., D.E.P. and C.F. performed the statistical analysis. S.V., J.A.L., M.O.H., D.E.P. and C.F. wrote the manuscript. S.V. had primary responsibility for final content. All authors read and approved the final manuscript. Acknowledgements: The authors gratefully acknowledge Alexander Fiks, MD, MSCE, Lisa McLeod, MD, MSCE, and Catherine Zorc, MD, MSHP for their contributions to this manuscript.



