

Data from observational studies show that increased wholegrain food consumption is strongly associated with a lower relative risk of CVD(Reference Anderson1–Reference McKeown, Jacques and Mayer5). In addition, cross-sectional studies have suggested a favourable association between wholegrain food intake and markers of cardiovascular health(Reference Ajani, Ford and Mokdad6–Reference McKeown, Meigs and Liu8).
These observational data led to health claims for use on wholegrain foods in the USA(9), UK(10) and Sweden(11). In each case, the claims relate to a reduction in subsequent risk of heart disease (or the maintenance of a healthy heart) for those consuming whole grains. The health claims are based on whole grains as a category, and do not make a distinction between different grain varieties or their relative benefits. Consumers are advised simply to consume more ‘whole grains’ and are provided with a list of foods and products containing whole grain. For some cereals, such as oats and barley, there are observational and intervention data suggesting that bran and some soluble fibre components improve plasma cholesterol concentrations and other markers of cardiovascular health(Reference Truswell12). However, evidence that consumption of mixed sources of wholegrain foods as replacements for refined-grain foods has similar benefits is limited. In a randomised, cross-over feeding trial, eleven overweight or obese hyperinsulinaemic subjects were fed diets based on either refined grain or whole grain for two 6-week periods. A reduction in average fasting insulin concentrations was observed, and the majority of participants had increased insulin sensitivity (as measured by a euglycaemic–hyperinsulinaemic insulin clamp) at the end of the whole-grain diet period(Reference Pereira, Jacobs and Pins13). In contrast, no change in insulin sensitivity was seen using the same methodology in a randomised, cross-over study comparing wholegrain or refined-grain food consumption over 6 weeks in thirty overweight participants(Reference Andersson, Tengblad and Karlstrom14). In this second study, consumption of wholegrain foods also had no significant effect on serum lipids, markers of lipid peroxidation, blood pressure or markers of inflammation. Two recent studies have suggested that intervention with wholegrain foods, in combination with either the Step I American Heart Association(Reference Behall, Scholfield and Hallfrisch15) or a hypoenergetic(Reference Katcher, Legro and Kunselman16) dietary regimen, was more beneficial to markers of CVD risk (diastolic and mean arterial blood pressure in Behall et al. (Reference Behall, Scholfield and Hallfrisch15) and C-reactive protein and percentage abdominal fat in Katcher et al. (Reference Katcher, Legro and Kunselman16)) than intervention with the low-fat-dietary regimen alone. Thus, although there are strong observational data to support the health benefits of increased whole-grain consumption, data from small-scale interventions are conflicting and direct evidence from intervention studies carried out in large numbers of subjects is not available. This is highlighted by two recent systematic reviews, which both concluded that there is a lack of randomised, controlled evidence demonstrating a beneficial effect of mixed sources of wholegrain foods on CVD risk(Reference Kelly, Summerbell and Brynes17, 18). No previous intervention studies have specifically tested the impact of increasing whole-grain intake among participants who habitually consume refined grains; the effect of increased wholegrain food consumption is instead compared with a refined-grain cross-over- or washout period. Previous reports would suggest that whole-grain intake in the UK population is generally low, with about a third of British adults eating no whole grains, and less than 5 % consuming three servings of whole grains daily(Reference Lang, Thane and Bolton-Smith19).
We hypothesised that increasing the consumption of a variety of wholegrain foods by individuals not routinely consuming such foods would result in improvements to measures of CVD risk. Accordingly, we conducted a randomised, parallel-group dietary intervention to evaluate the effect of substituting refined-grain foods for wholegrain foods in the diet of habitual refined-grain consumers on markers of CVD risk to inform the development of dietary guidelines. The primary outcome measure was change in fasting plasma LDL-cholesterol concentration, a standard marker of CVD risk(Reference Zanchetti20). Secondary outcome measures were change in fasting lipid profile, measures of insulin sensitivity, inflammatory and haemostatic measures, blood pressure and body weight.
Methods
Project ethical approval and registration
The present study was conducted according to the guidelines laid down in the Declaration of Helsinki and all procedures involving human subjects were approved by the Newcastle and North Tyneside Local Research Ethics Committee 1 (reference 05/Q0905/75) and by the Newcastle upon Tyne Hospitals NHS Foundation Trust R&D Department. Written informed consent was obtained from all subjects/patients. The study was registered with isrtcn.org (ISRCT no. CCT-NAPN-A13175).
Study participants
A total of 316 participants, aged 18–65 years, were recruited for the study in two UK centres (Newcastle upon Tyne and Cambridge). Exclusion criteria were: (1) BMI below 25 kg/m2; (2) habitual consumption of >30 g whole grain per d (i.e. >1·5 servings per d), as assessed by a retrospective 1-week FFQ; (3) previous diagnosis of CVD or diabetes, or treatment for hyperlipidaemia; (4) smoking more than twenty cigarettes per d, or with a history of substance abuse. Those reporting recent weight change ( ≥ 3 kg), desire to diet or planning an extended period away from the study centres were also excluded.
Participants were recruited by advertisements in the local press, posters and by invitation letters through local primary care practices. Initial screening was carried out by telephone interview. Those thought to be suitable completed a FFQ to quantify whole-grain intake during the previous week and were subsequently invited for further screening (of BMI) at the research facility.
Details of study enrolment and completion are summarised in Fig. 1. Although there were a significantly higher number of dropouts in the intervention groups, the majority of these discontinued the study before completion of baseline measurements (i.e. before the wholegrain food intervention had commenced), mainly as a result of lack of motivation. Only six participants withdrew due to the study foods (three in each intervention group), suggesting that the intervention was generally well accepted in this population group.
Enrolment details for the WHOLEheart study. WG, whole-grain.

Intervention design
A previous feasibility (uncontrolled, non-randomised) study at Newcastle University (AR Jones and CJ Seal, unpublished results) demonstrated a reduction in both total and LDL-cholesterol concentrations following 8 weeks of a whole-grain intervention at intakes of approximately 70 g whole grain per d in twenty-two male and female subjects. The change in LDL-cholesterol (about 10 %) concentration was greater than predicted from the Framingham Offspring Study(Reference McKeown, Meigs and Liu8) in which a 4 % difference in fasting LDL-cholesterol concentration was observed between the lowest (median intake less than one serving of whole grain per d) and highest (median intake approximately three servings of whole grain per d) quintiles of whole-grain consumption. These data were used in conjunction with data from a previous project carried out at the Medical Research Council's collaborative centre for Human Nutrition Research (MRC-HNR), Cambridge (Food Standards Agency no. N02026) to estimate the sample size. Both sets of data were derived from overweight study participants, i.e. similar to those selected for the WHOLEheart study, to give an appropriate estimate of variance.
On the basis of the estimates of variance from the two previous studies, a sample size of 254 subjects was calculated to detect a 10 % decrease in LDL-cholesterol with a 0·05 significance level and 80 % power, assuming an sd of 0·85. Allowing for an estimated dropout rate of 15 % (based on similar nutrition intervention studies in the two centres), a target of 100 subjects per treatment group was proposed.
Participants were randomly allocated (using an MS-DOS-based computer program at each study centre) to the three study groups for a 16-week intervention using a procedure that ensured an even distribution of participants within each group by age, sex and BMI. A single research staff member at each centre was responsible for recruitment, allocating participants by minimisation, giving participants instructions and providing them with study foods, and taking anthropometric measurements to agreed standard operating procedures. Participants in the control group were asked to maintain their current diet throughout the 16-week period. The two intervention groups were provided with a range of wholegrain foods (see Table 1), and asked to substitute these ‘like-for-like’ for refined-grain foods in their diet to a prescribed amount over the intervention period. Participants in intervention group 1 were asked to consume the equivalent of 60 g whole grain per d (approximately equal to the whole-grain content of three slices of bread) for the whole 16-week period; participants in intervention group 2 were asked to consume 60 g whole grain per d for 8 weeks followed by 120 g whole grain per d for the final 8 weeks of the intervention.
Whole-grain content of foods provided to WHOLEheart participants
* Denotes cooked weight, whereas all other whole-grain contents are per 100 g dry weight.
Study foods
Participants were given the wholegrain foods shown in Table 1. Foods were provided on-demand at approximately fortnightly intervals, and were either delivered to volunteers or collected in person by the participants during measurement visits. The wholegrain foods were selected from the small range of wholegrain foods readily available in the UK at the time of starting the intervention. Participants were given free choice as to which wholegrain foods they selected to achieve the target levels of intake for each intervention group (see below). This approach was chosen to best reflect choices of wholegrain foods in a free-living population, similar to those reported in observational studies. The whole-grain content of these foods was described to study participants in whole-grain servings, where one serving was equivalent to the whole-grain content of one slice of wholemeal bread (approximately 20 g). However, a portion (the amount of food eaten at a sitting) could contain more than one serving of whole grains (for example, a portion of brown rice contained 3–3·5 servings, or 60–70 g, of whole grain). The target for intervention group 1 was to consume three servings of whole grain per d throughout the 16 weeks of the intervention. For intervention group 2 the target was three servings per d for the first 8 weeks then six servings per d for the second 8 weeks of the intervention. Where possible, foods were packaged into portion sizes appropriate for male and female participants based on typical portions reported in the UK National Diet and Nutrition Survey data and other data from cohort studies carried out in Newcastle(Reference Thane, Jones and Stephen21). The number of whole-grain servings was indicated on the packaging. In other cases, foods were provided in manufacturers' packaging, and details of the whole-grain content were given in participant study guides. Participant whole-grain intake was assessed by FFQ at week 0 (baseline), week 8 and week 16. The FFQ was a 149-item questionnaire, based on the European Prospective Investigation into Cancer and Nutrition (EPIC) FFQ and asking for consumption of foods during the preceding 7 d only. The WHOLEheart FFQ was expanded to include inputs for both the wholegrain foods provided for the study, and for other wholegrain foods available in the UK. Participants were given checklists and calendars to mark off their consumption of servings of whole grain to aid compliance.
Blood sampling and anthropometric measurement
All measurements were made at week 0 (baseline), week 8 and week 16. Each time-point included: duplicate fasting blood samples (within 7 d of each other); seated resting blood pressure (assessed twice on the same day, 5 min apart); waist circumference, measured at the mid-point between the lower rib margin and the iliac crest; BMI and body fat percentage, assessed using a Tanita BC-418 segmental body composition analyser (Tanita Corporation of America Inc., Arlington Heights, IL, USA)(Reference Jebb, Cole and Doman22).
Plasma sample analysis
Analysis of plasma fibrinogen and plasminogen activator inhibitor-1 were conducted at the Department of Clinical Biochemistry at Addenbrooke's Hospital, Cambridge, UK. All other measures of plasma CVD risk markers were analysed by the Nutritional Biomarker Analysis group at the MRC-HNR unit in Cambridge, UK using standard analytical procedures (under ISO 9001 accreditation). Further details of these analyses are included in Table 2.
Markers of CVD risk analysed in fasting plasma samples. All measurements were made at week 0, week 8 and week 16 of the intervention period
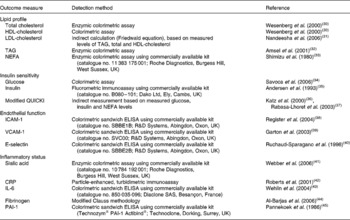
QUICKI, quantitative insulin sensitivity check index; ICAM-1, intercellular adhesion molecule 1; VCAM-1, vascular cell adhesion molecule 1; CRP, C-reactive protein; PAI-1, plasminogen activator inhibitor.
Statistical analysis
All statistical analyses were carried out using the Stata version 10.1 software package (Statacorp LP, College Station, TX, USA). All variables (except waist and body fat percentage) were log transformed before analysis. A pre-specified, random-intercepts model was used to account for the correlated nature of longitudinal measures. The intervention groups were compared with the control group at follow-up by taking the average of week 8 and week 16 data and taking the average of the two intervention groups. This was considered to be the most powerful way of detecting a statistically significant difference, and removes the need for adjusting P values because of multiple comparisons. The difference between both geometric means and a 95 % CI are presented. If the 95 % CI fell around 0, then no further analysis was carried out.
Results
The median age (46 years) and BMI (30 kg/m2) of participants completing the study were not different between groups (Table 3). Participant characteristics at baseline were similar across all groups (see Table 3), indicating good randomisation through the minimisation procedure.
(Median values and standard deviations)
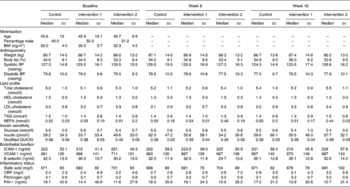
BP, blood pressure; QUICKI, quantitative insulin sensitivity check index; ICAM-1, intercellular adhesion molecule 1; VCAM-1, vascular cell adhesion molecule 1; CRP, C-reactive protein; PAI-1, plasminogen activator inhibitor-1.
* Age, sex (percentage male) and BMI were used in participant randomisation.
Duplicate measures of C-reactive protein, lipid profiles and markers of insulin sensitivity all had Spearman's correlation values above 0·70, demonstrating good reproducibility between measurements at each time-point. Table 4 shows the effect of wholegrain intervention on fasting lipid profiles and other markers of cardiovascular risk, expressed as percentage change compared with the control group, calculated following the statistical model outlined above. Table 3 displays mean data for all outcome measures in each group at each time-point. Differences from the control group were very small and not significant (P>0·05) for any of the measured outcomes. Most markers were ameliorated in whole-grain consumers compared with non-whole-grain consumers, but in all cases the 95 % CI spanned zero change.
(Percentage change compared with the control group and 95 % confidence intervals)
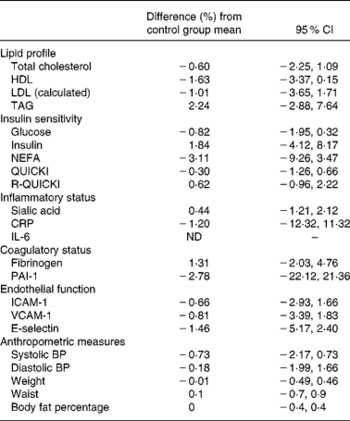
QUICKI, quantitative insulin sensitivity check index; R-QUICKI, revised QUICKI; CRP, C-reactive protein; ND, not determined; PAI-1, plasminogen activator inhibitor-1; ICAM-1, intercellular adhesion molecule 1; VCAM-1, vascular cell adhesion molecule 1; BP, blood pressure.
As an example, LDL-cholesterol was 1·01 (95 % CI − 1·71, 3·65) % lower on the intervention arms than on the control diet at follow-up measurements (intervention group and week 8 and week 16 data averaged). Approximately 70 % of all IL-6 measurements from the intervention period were below the minimum detectable value (0·8 pg/ml); therefore no statistical analysis was possible for this outcome measure only. Weight changes within the groups were also similar.
Participant whole-grain and dietary intake
The mean whole-grain intake of each group (estimated from FFQ data) at each time-point is shown in Fig. 2. Levels of intake were close to those prescribed, suggesting that the participants, on average, complied with the study requirements. At baseline whole-grain intake was less than 20 g per d for each group, showing that whole-grain intake was still within the screening criteria for inclusion at the commencement of the study. For the control group whole-grain intake averaged 19 (sd 19·9) g/d across the whole intervention; for intervention group 1, whole-grain intake was 74 (sd 28·5) g/d averaged for weeks 8 and 16 (no significant difference in whole-grain intake between week 8 and week 16); finally, for intervention group 2, whole-grain intake was 83 (sd 31·1) g/d at week 8 and 115 (sd 39·6) g/d at week 16.
Whole-grain intake (g/d) calculated from FFQ for WHOLEheart participants from screening and during the 16-week intervention. (□), Control group; (![]() ), intervention group 1, 60 g whole grain per d for 16 weeks; (■), intervention group 2, 60 g whole grain per d for 8 weeks, followed by 120 g whole grain per d for 16 weeks. Values are means, with standard deviations represented by vertical bars. a,b,c Mean values with unlike letters were significantly different (P < 0·001; two-tailed unpaired non-parametric t test).
), intervention group 1, 60 g whole grain per d for 16 weeks; (■), intervention group 2, 60 g whole grain per d for 8 weeks, followed by 120 g whole grain per d for 16 weeks. Values are means, with standard deviations represented by vertical bars. a,b,c Mean values with unlike letters were significantly different (P < 0·001; two-tailed unpaired non-parametric t test).
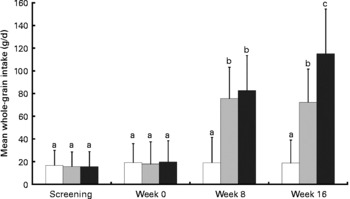
Table 5 shows the median daily frequency of food item consumption by participants in each group. The principal changes in whole-grain intake were reflected in an increase in the frequency of consumption of breads and breakfast cereals. In the control group, frequency of breakfast cereal consumption was lower at week 8 (P = 0·001). Both intervention groups had higher frequencies of intakes of these food categories during the last 8 weeks of intervention for intervention group 2 (P < 0·038). For intervention group 2 there was a significant reduction in the frequency of fruit consumption at 16 weeks compared with the control group (P = 0·045), but otherwise frequency of intakes of other food groups were not different between intervention and control groups.
(Mean values and standard deviations)

* Changes in frequencies of food consumption were significantly different from their comparator values (P < 0·05).
† Changes in daily frequency of consumption of intervention group 1 and intervention group 2 from baseline (week 0) were compared with changes from baseline in the control group (week 0) by the non-parametric, two-sample Wilcoxon rank-sum test. Control values from week 8 and week 16 were compared with those at baseline.
Median macronutrient intake at each time-point was estimated from FFQ data. The results are summarised in Table 6 (expressed as changes from baseline). While the wholegrain food intervention resulted in a marked increase in dietary fibre intake compared with baseline in the intervention groups (median increase of between 4·69 and 11·0 g/d), it also resulted in an increased total carbohydrate intake (median increase of about 15 g/d or above), and tended to result in an increased total energy intake (a significant increase in intervention group 1 at week 8 and intervention group 2 at week 16).
Median change from baseline in daily nutrient intakes at week 16 for each study group and P values v. control†

* Nutrient intakes were significantly different from the control values (P < 0·05).
† Estimates of macronutrient intake were taken from FFQ data. Changes in daily nutrient intakes of intervention group 1 and intervention group 2 were compared with changes in the control group by the non-parametric, two-sample Wilcoxon rank-sum test. Values for the control group did not significantly differ from baseline at either week 8 or week 16.
Discussion
An increase in whole-grain consumption for a 16-week period did not significantly affect any of the biomarkers of cardiovascular health assessed here. These results are consistent with previous findings of Andersson et al. (Reference Andersson, Tengblad and Karlstrom14), who noted no benefit of consumption of a range of wholegrain foods (from mixed grain sources) on any marker of CVD risk(Reference Andersson, Tengblad and Karlstrom14). The 2007 study of Andersson et al. (Reference Andersson, Tengblad and Karlstrom14) is also the only randomised, controlled whole-grain intervention other than the study reported here to have a robust power calculations to determine sample size. An earlier study of similar design showed a small but significant decrease in mean fasting insulin, but no other benefits to CVD risk were evident(Reference Pereira, Jacobs and Pins13). Two previous studies have shown that inclusion of wholegrain foods alongside hypoenergetic dietary interventions reduced blood pressure(Reference Behall, Scholfield and Hallfrisch15), C-reactive protein and percentage abdominal fat(Reference Katcher, Legro and Kunselman16) significantly more than hypoenergetic interventions alone. Such studies support observational data suggesting whole-grain consumption is part of a healthy lifestyle, but do not demonstrate that increased wholegrain food consumption benefits CVD risk as a single, independent dietary factor.
The biomarkers of cardiovascular health used within the present study are all well-established biochemical and anthropometric markers of CVD risk, and embody the range of physiological processes thought to be involved in disease onset. We calculated a fasting marker of insulin sensitivity based on glucose, lipid and insulin concentrations (modified quantitative insulin sensitivity check index; QUICKI). Whilst this method has been shown to be significantly correlated with more robust measures of insulin sensitivity(Reference Brady, Gower and Lovegrove23) it may be less sensitive in detecting subtle diet-induced changes compared with direct measures such as the euglycaemic–hyperinsulinaemic clamp or intravenous glucose tolerance test. Likewise, a more detailed analysis of lipoprotein subclasses may be required to demonstrate changes in lipid metabolism.
We believe that the disparity in the findings from the observational data and the present intervention study warrants further consideration and may arise as a consequence of methodological and/or biological effects. We sought wherever possible to reduce the sources of methodological errors. Intervention studies may sometimes fail to show the expected effect because the subjects fail to comply with the dietary prescription or because of unexpected changes in the control group. FFQ are not as ideal as food diaries for assessing dietary or nutrient intake, but do provide a useful means of measuring changes in frequency of the consumption of specific food types over time, and also tend to be less time intensive for participants to fill out, thereby increasing compliance. The FFQ used in the present study was designed to quantify food consumption during the 7 d before measurement days. The shorter time frame for recollection may increase the precision of the measurement tool compared with FFQ which measure diet over preceding months or up to 1 year. Results from the dietary analysis suggested that the provision of specific foodstuffs and regular contact and motivation of participants by the research team resulted in good compliance to the prescribed intake levels of whole grain in each group. However, the participants appeared to include the wholegrain foods as a dietary addition as opposed to the dietary substitution that was explicitly requested in participant guidelines and investigator instruction. Therefore, the modality of whole-grain inclusion in the diet desired for the intervention may not have been achieved. Our dietary inclusion criteria for participants were based solely on low elective wholegrain food consumption. Future whole-grain-based dietary interventions in free-living individuals may benefit from more specific inclusion criteria (for example, choosing participants who regularly consume breakfast, or those who consume high amounts of (refined) grain products within their habitual diet). This dietary effect is also relevant to the development of dietary guidelines for whole-grain consumption in the general population. These guidelines must be designed to achieve replacement of refined-grain foods in the diet without increased overall food consumption.
Intervention studies may sometimes be underpowered to detect a significant effect, but this was a large study which estimated differences with high precision (i.e. narrow 95 % CI), where no clear trend was observed. The study may have been of insufficient duration to detect an effect, but comparison of the results at 8 and 16 weeks did not suggest a consistent trend which may have become significant with continued intervention. In other dietary interventions that ameliorate markers of CVD risk, lipid parameters are frequently modulated after only 2–4 weeks (for example, Cicero et al. (Reference Cicero, Nascetti and Lopez-Sabater24), Madsen et al. (Reference Madsen, Jensen and Schmidt25) and Jenkins et al. (Reference Jenkins, Kendall and Marchie26)), suggesting that the time frame for the present study was more than adequate.
Accordingly, it may be more likely that the lack of effect of the wholegrain food intervention has a biological explanation. In this controlled intervention, we provided study foods in a very specific and structured manner, which may not reflect the consumption of wholegrain foods by habitual whole-grain consumers recorded in observational studies. The range of products was restricted and subjects had to make conscious changes in other parts of their diet in order to incorporate the study foods as prescribed. Breads and breakfast cereals were the most frequently consumed wholegrain foods and the concomitant increase observed in total dietary carbohydrate intake, plus the addition of food accompaniments such as spreads, milk, etc, may have contributed to the trend towards increased energy intake in the intervention participants. At the highest level of whole-grain intake there was a small but significant reduction (equating to about 0·5 per d reduction of consumption frequency) in fruit consumption, again implying that volunteers may have changed their dietary pattern in order to accommodate the high intake of whole grain required during the second stage of the intervention. These changes may have offset any health benefits of the wholegrain component. The net effect is that the diet of high whole-grain consumers in the present intervention study is different from that of high whole-grain consumers in observational studies, where ‘elective’ whole-grain intake is a marker of a broader diet and lifestyle that cannot be easily replicated in controlled, intervention studies. However, we believe this type of food-based dietary intervention in free-living, healthy individuals more appropriately models the impact that public health recommendations worded around increasing consumption to prescribed levels of generic wholegrain foods could have on the diet of the general population. Our findings that individuals within the present study tended to alter their diet will be useful in the design of future whole-grain-based dietary intervention studies.
Participants were given a range of wholegrain foods reflecting those generally available in the UK. The term ‘whole grain’ has been used to describe foods that contain more than 51 % whole grain in which the naturally occurring proportions of germ, bran and endosperm are retained(27). The majority of the foods provided to participants (see Table 1), with the exception of bread, were not made from finely milled grain, thus it is unlikely that this aspect of processing would have influenced the results. While commercially available wholegrain loaves have similar glycaemic index values to refined loaves(Reference Foster-Powell, Holt and Brand-Miller28), previous work has shown that increasing the content of intact cereal grains in breads resulted in reduction in glycaemic index(Reference Jenkins, Wesson and Wolever29). Several of the other, less processed, foods used in the present study had glycaemic indices lower than that of wholemeal bread.
Finally, the lack of intervention effect may be a consequence of the study population. Pre-screening of participants for those with elevated fasting LDL-cholesterol would have better targeted a population at risk from CVD. However, we did not select a clinically high-risk population for the present study, since the outcomes of this research were based on benefitting dietary guidelines for the population as a whole. Instead, the present study focused specifically on a group of overweight individuals, representative of the population of the UK and other countries where overweight is now the norm, and likely to be at moderately increased risk of CVD (see Table 3). However, the duration of this controlled intervention study represents a very short period of dietary change in the context of lifelong dietary exposures, and may be insufficient to change the lifetime disease trajectory for these individuals with a strong pre-existing risk factor.
Within the present study, we have tested whether infrequent whole-grain consumers respond with improved markers of cardiovascular health when substituting wholegrain food products into their diet, and have found no effect. The present study sounds a note of caution to the specific health claims for whole grain-rich foods and cardiovascular health. However, it does not undermine more general efforts to promote whole grains as part of a healthy diet for the general population across the life course, based on data from observational studies.
Acknowledgements
This research was fully funded by the UK Food Standards Agency (project N02036). All study foods were kindly provided for the study by UK suppliers (Cereal Partners Worldwide, Weetabix, Allied Bakeries and PepsiCo).
The authors acknowledge the research support provided by Katherine Chan and administrative assistance by Mary Walton. We would also like to acknowledge the effort and time commitment of all WHOLEheart participants, without whom the present study would not have been possible.
C. J. S., S. A. J. and C. M. designed the study, I. A. B. managed participant studies and analysed dietary data and M. C. was the study statistician. D. P. R., P. A. and S. A. K. provided technical support and advice as members of the project steering group. All authors were involved in data interpretation and manuscript preparation.
The authors report no conflicts of interest arising from the present research and its publication.


