


Non-technical Summary
The evolution of the mandible in mammalian carnivores is influenced by various demands in ecology in different groups. Previous work has tried to quantify the shape of the mandible of certain groups of mammalian carnivores to relate it to different ecologies. In this study, we quantify the shape of the mandible of a larger variety of carnivores and make biomechanical measurements of the mandible to understand the influences of biomechanical properties on mandibular shape and carnivorous mammal ecology and what portions of the mandible undergo the most change over evolution. We define shape by using geometric morphometrics, which quantify a shape based on aligned Cartesian coordinates. Biomechanical measurements used included measuring the relative bite force transmitted, the potential strength of the mandible against bending and torsion in different directions, and resistance of the mandible to stress and strain.
We found that the muscle-bearing portion of the mandible has higher rates of evolutionary change than the tooth-bearing portion. This is supported by statistical tests of the biomechanical measurements that include that portion of mandibular shape and are better correlated with mandibular shape. In the trend of becoming more carnivorous, mammals evolve stronger mandibles that are shortened and thickened with greater areas of muscle attachment and a longer shearing area of the teeth. While looking at the shape variation in mandibles, different groups of mammalian carnivores have been able to fill out specialized carnivorous diets with similar functional metrics despite having different mandibular shapes.
Introduction
Among many clades of Mammalia there have been parallel adaptations to a carnivorous ecology that produced stereotypical changes in jaw shape that are inferred to represent increased functional performance of the mandible for capturing and processing prey (Radinsky Reference Radinsky1982; Greaves Reference Greaves1985; Werdelin and Gittleman Reference Werdelin, Gittleman and Gittleman1996; Van Valkenburgh Reference Van Valkenburgh1999, Reference Van Valkenburgh2007). Phylogenetically distant carnivorous clades, such as metatherian and eutherian carnivores, may have different constraints on specific jaw shapes (Losos Reference Losos2011; Renvoisé et al. Reference Renvoisé, Kavanagh, Lazzari, Häkkinen, Rice, Pantalacci and Jernvall2017). However, in principle, the parallel changes in jaw shape with the evolution of carnivory are expected to require similar functional performance such as amounts of stress and strain on the jaw for the typical external forces that occur during prey capture or food processing. We might therefore expect that phylogenetically distant carnivorous mammals may have overall different jaw shapes but with similar lever proportions and loadings on teeth and joints (Van Valkenburgh Reference Van Valkenburgh1999, Reference Van Valkenburgh2007; Goswami et al. Reference Goswami, Milne and Wroe2011; Losos Reference Losos2011; Tseng Reference Tseng2013). Similar functional properties may also be found in food processing mechanics combined with differences in prey capture mechanics that could differentially affect loading on the canines versus the carnassial and molars (Biknevicius and Ruff Reference Biknevicius and Ruff1992; Meachen-Samuels and Van Valkenburgh Reference Meachen-Samuels and Van Valkenburgh2009; Slater et al. Reference Slater, Dumont and Van Valkenburgh2009; Kitchener et al. Reference Kitchener, Van Valkenburgh, Yamaguchi, Macdonald and Loveridge2010). In this paper, we will contrast the evolution of the mandibular shape with its functional performance measured by biomechanical efficiency in response to the acquisition of specific dietary specializations in carnivorous mammals.
Some adaptations for increased carnivory in Mammalia include the development of a carnassial shear in which at least one upper tooth and one lower tooth occlude to create a shearing surface that better processes meat (Butler Reference Butler1946; Crompton and Hiiemae Reference Crompton and Hiiemae1969; Greaves Reference Greaves1983; Ungar Reference Ungar2010), often positioned near the midpoint in the mandible to get the most efficient muscle force without trading off gape size (Greaves Reference Greaves1983). For groups that have become more specialized in carnivory, additional adaptations often include reduced mandible length that is often accompanied by a reduction of either anterior premolars or posterior molars as a by-product of selection. This reduction in mandible length increases the efficiency of the lever arm of the mandible adductor complex (Martin Reference Martin and Gittleman1989; Hunt Reference Hunt1998; Van Valkenburgh Reference Van Valkenburgh2007; Christiansen Reference Christiansen2008). However, this reduction in length is not a ubiquitous trait in all specialized carnivores (e.g., Ursus martimus) and longer craniofacial structure may be a by-product of increasing size (Mitchell et al. Reference Mitchell, Sherratt and Weisbecker2024; Sansalone et al. Reference Sansalone, Wroe, Coates, Attard and Fruciano2024). Other typical adaptations include increased origin and insertion areas of the temporalis muscle at the temporal fossa and sagittal crest of the cranium (origins) and coronoid process of the mandible (insertion) to produce a stronger or faster bite (Tseng and Wang Reference Tseng and Wang2010; Meloro and O’Higgins Reference Meloro and O’Higgins2011; Meloro et al. Reference Meloro, Clauss and Raia2015; Hartstone-Rose et al. Reference Hartstone-Rose, Hertzig and Dickinson2019). Different clades repeatedly evolved into carnivorous forms and ecologies during the Cenozoic (Martin Reference Martin and Gittleman1989; Van Valkenburgh Reference Van Valkenburgh1991, Reference Van Valkenburgh2007). As these clades have converged to fill in the same ecological roles, similarities in their adaptations and how these adaptations have developed are expected to be similar based on presumed linkage of dietary ecology and biomechanical performance and to be seen through functional morphological metrics.
The analyses in this paper will focus on the morphological and functional transitions among four carnivorous diet types: hypocarnivory, mesocarnivory, hypercarnivory, and osteophagus hypercarnivory. Mesocarnivory describes an animal-dominant omnivory, in which more than half of the diet is meat but a noticeable portion is supplemented with non-vertebrate food including insects and plant material (in living taxa, this can be described quantitatively as 50–70% of the diet being composed of meat; Van Valkenburgh Reference Van Valkenburgh1991, Reference Van Valkenburgh1999, Reference Van Valkenburgh2007; Roemer et al. Reference Roemer, Gompper and Van Valkenburgh2009; Balisi et al. Reference Balisi, Casey and Van Valkenburgh2018). Additionally, most mesocarnivores are typically small to medium body size and hunt prey smaller than themselves. Hypocarnivory describes “true” omnivory, in which half of the diet is composed of meat and the rest is supplemented with non-vertebrate food (in living taxa, this can be described quantitatively as less than or equal to 50% of the diet being composed of meat) (Van Valkenburgh Reference Van Valkenburgh1988, Reference Van Valkenburgh1999, Reference Van Valkenburgh2007). Hypocarnivores can vary in body size and can be described as “plant-dominated omnivores” due to their wide diet range that includes more plant material. Hypercarnivory describes a diet of carnivores in which entirely or nearly all of the diet is composed of vertebrate meat (in living taxa, this can be described quantitatively as greater than 70% of the diet being composed of meat; Van Valkenburgh Reference Van Valkenburgh1988, Reference Van Valkenburgh1991, Reference Van Valkenburgh1999, Reference Van Valkenburgh2007; Van Valkenburgh et al. Reference Van Valkenburgh, Wang and Damuth2004). Hypercarnivores vary in body size and can hunt prey that is equal to or larger in body size than they are. Osteophagus hypercarnivores (e.g., the spotted hyena [Crocuta crocuta]; the extinct bone-crushing dog [Borophagus]) are a subset of hypercarnivores whose diet includes large bones as well as vertebrate meat (Van Valkenburgh Reference Van Valkenburgh1991, Reference Van Valkenburgh2007). Hypocarnivory, hypercarnivory, and osteophagus hypercarnivory are typically considered specialized or derived forms of dietary ecology from a mesocarnivorous or insectivorous ancestral condition. The functional differences among these dietary categories are through the differences in the proportion of crushing and slicing features in the dentition (Butler Reference Butler1946; Crompton and Hiiemae Reference Crompton and Hiiemae1969; Greaves Reference Greaves1985; Van Valkenburgh Reference Van Valkenburgh1991, Reference Van Valkenburgh1999). While these categories were originally used for the description of extant species, paleontologists have assigned extinct species to them based on functional morphological properties of their teeth, including the development and length of the shearing blades (Butler Reference Butler1946; Greaves Reference Greaves1983; Van Valkenburgh Reference Van Valkenburgh1991, Reference Van Valkenburgh1999, Reference Van Valkenburgh2007), the area of the crushing basins in the molars (Van Valkenburgh Reference Van Valkenburgh2007), and structural properties of the teeth such as the microscopic patterns of the enamel (Stefen Reference Stefen1997; Tseng Reference Tseng2013; Tseng and Flynn Reference Tseng and Flynn2015).
During the Mesozoic Era, the ancestors of carnivorous mammal groups generally occupied insectivore or generalist roles with only a few becoming truly carnivorous consumers of vertebrate flesh or bone (Halliday and Goswami Reference Halliday and Goswami2016; Benevento et al. Reference Benevento, Benson and Friedman2019). However, in the aftermath of the Cretaceous–Paleogene extinction, many groups of therian mammals (including both placentals and marsupials) began to fill in the roles of secondary consumers and apex predator guilds in ecosystems following the vacancy of non-avian dinosaurs (Halliday and Goswami Reference Halliday and Goswami2016). The therian mammal clades of Metatheria, Mesonychia, Oxyaenodonta, Hyaenodonta, and Carnivoramorpha occupied guild ecotypes, including mesocarnivores, hypocarnivores, hypercarnivores, and osteophagus hypercarnivores (Van Valkenburgh Reference Van Valkenburgh1991, Reference Van Valkenburgh1999; Tseng Reference Tseng2013; Tseng and Flynn Reference Tseng and Flynn2015). Metatheria includes crown Marsupialia and their closest relatives. Mesonychia is a clade of early predatory mammals within Ungulata that has been inferred at times to be related to whales (Szalay Reference Szalay1969; Solé et al. Reference Solé, Godinot, Laurent, Galoyer and Smith2018). Oxyaenodonta comprises the extinct short-faced carnivore group with two pairs of carnassial teeth common in the early Paleogene. Hyaenodonta is the extinct long-faced carnivore group of the Paleogene and early Neogene that has three pairs of carnassial teeth; with Oxyaenodonta, it makes up the potentially polyphyletic clade of “Creodonta” based on the presence of having more than one pair of carnassial teeth (Butler Reference Butler1946; Borths et al. Reference Borths, Holroyd and Seiffert2016; Ahrens Reference Ahrens2017). Finally, Carnivoramorpha includes crown Carnivora, the paraphyletic “Miacidae,” and its closest relatives in Viverravidae (Wozencraft Reference Wozencraft and Gittleman1989; Wesley-Hunt and Flynn Reference Wesley-Hunt and Flynn2005; Spaulding and Flynn Reference Spaulding and Flynn2012; Fig. 1). During the Cenozoic, clades iteratively occupied carnivorous ecotypes in cycles of evolutionary boom and bust. Examples of such replacements include the early Cenozoic Mesonychia and Oxyaenodonta being replaced by Hyaenodonta and Carnivora by the Eocene–Oligocene, Hyaenodonta being replaced by Carnivora by the Oligocene–Miocene, and various families within Carnivora replacing each other from the Miocene to the present (i.e., the various subfamilies of Canidae in North America; Martin Reference Martin and Gittleman1989; Van Valkenburgh Reference Van Valkenburgh1999, Reference Van Valkenburgh2007).
Time-calibrated phylogeny of carnivorous Cenozoic therian mammals with major clades o.f interest highlighted. Green is Metatheria, orange is Mesonychia, yellow is “Creodonta,” and purple is Carnivoramorpha. Red dots indicate branches where evolution of hypercarnivory (closed) or bone-cracking hypercarnivory (open) occurs, with taxa to the right of the circles being either hypercarnivores or bone-crackers. Blue dots indicate branches where evolution of hypocarnivory occurs, with taxa to the right of the circles being hypocarnivores. Taxa on the left of red or blue circles are mesocarnivores. Ahrens (Reference Ahrens2017), Baskin (Reference Baskin, Janis, Scott and Jacobs1998), Borths et al. (Reference Borths, Holroyd and Seiffert2016), Goin et al. (Reference Goin, Woodburne, Zimicz, Martin and Chornogubsky2016), Solé et al. (Reference Solé, Godinot, Laurent, Galoyer and Smith2018), Spaulding and Flynn (Reference Spaulding and Flynn2012), and Wozencraft (Reference Wozencraft and Gittleman1989) were the trees used, with first- and last-appearance dates from the Paleobiology Database (Peters and McClennen Reference Peters and McClennen2016). The tree was constructed using the phytools v. 1.5-1 R package (Revell Reference Revell2023).

Regardless of whether the turnover between the groups was actively produced by competition or passively the result of the filling of niches vacated by extinction, the consequence is that several phylogenetically different groups have independently acquired parallel carnivorous specializations several times in the history of mammals. Some of the similar adaptations for these ecotypes include the evolution of at least one pair of carnassial-shear teeth that progressively occupied a greater portion of the jaw instead of crushing areas of molars to better process meat (Greaves Reference Greaves1983; Meloro and Raia Reference Meloro and Raia2010) and changes in mandibular or cranial shape to catch prey or resist stress from larger struggling prey (Goswami et al. Reference Goswami, Milne and Wroe2011; Prevosti et al. Reference Prevosti, Turazzini, Ercoli and Hingst-Zaher2012). Van Valkenburgh (Reference Van Valkenburgh2007) describes a series of eco-morphotype convergences among the members of Carnivora, such as cat-like and hyaena-like morphotypes between feliforms and caniforms, with further morphological convergences, such as the domed cranium of the latter. However, there are noticeable differences within the dental and mandibular morphologies of these groups due to their phylogenetic history. Among these are the larger number of carnassial pairs of teeth in metatherians and creodonts versus carnivorans (Van Valkenburgh Reference Van Valkenburgh1999, Reference Van Valkenburgh2007), the lack of “true” carnassial teeth in mesonychians due to their omnivore–herbivore ancestry and the loss of the shear facets on their molars (Szalay Reference Szalay1969; Halliday et al. Reference Halliday, Upchurch and Goswami2017; Solé et al. Reference Solé, Godinot, Laurent, Galoyer and Smith2018), and a larger head-to-body size ratio among non-carnivoramorphans (Van Valkenburgh Reference Van Valkenburgh1988, Reference Van Valkenburgh1999; Martin Reference Martin and Gittleman1989).
Despite the phylogenetic differences in the mandibular shape of these disparate carnivore groups, it stands to reason that the average stress and strain on the mandible should be similar if the diet has similar composition. For example, a species with an osteophagus diet should have a mandible that is better able to resist high levels of stress and strain generated by reaction force from biting on a hard object. We can thus expect a kind of “many-to-one mapping” (Alfaro et al. Reference Alfaro, Bolnick and Wainwright2005; Wainwright et al. Reference Wainwright, Alfaro, Bolnick and Hulsey2005), in which many mandibular shapes achieve the same functional performance for a limited number of carnivorous diet types. To test this hypothesis, this study uses a combination of geometric morphometrics and biomechanical analyses to test the relationship between form and function in a representative sample of mesocarnivores, hypocarnivores, hypercarnivores, and osteophagus hypercarnivores from across Mammalia. Geometric morphometrics define and quantify the morphology of the mandible, and biomechanical analyses quantify its functional performance. Statistical analyses are then used to determine how the biomechanical variables contribute to variance in mandibular shape. Measurements from biomechanical analyses include beam analysis of the mandibular body, mechanical advantage of the mandible, and finite element analysis of the mandible during biting. We expect that species that are ecologically similar will have similar patterns of stress and strain on the mandible, even if they plot separately on mandibular morphospace, and for the derived groups, we expect that there should be convergence in the stress and strain metrics, which we will confirm with convergence tests.
Materials and Methods
Specimens
A total of 93 specimens, each representing a different species of therian mammal, were used in this study, of which 35 are from extant taxa and the others from extinct taxa. The taxonomic breakdown is as follows: Caniformia (35 species), Feliformia (22 species), and Carnivoramorpha outside of crown Carnivora (4 species) (for a total of 61 carnivoramorphans); Hyaenodonta (11 species) and Oxyaenodonta (2 species) (for a total of 13 “creodonts”); Mesonychia (6 species); and Metatheria (13 species). This selection picks representatives of different points in the evolution of hypercarnivory and/or osteophagy (otherwise known as bone-cracking) behavior in the clade Theria over the course of its evolution, with a sampling of as many independent clades that evolved hypercarnivory or osteophagy. Extant taxa were chosen to represent as many independent transitions as possible from mesocarnivory to hypercarnivory, with the criterion being that at least one hypercarnivore and one mesocarnivore with well-preserved mandibles were available. Extant hypocarnivorous taxa were included to provide outliers that could potentially be different from mesocarnivores and hypercarnivores. Each species is represented by a single adult mandible as determined by having full permanent dentition. Fossil mandibles are often missing the condyle, coronoid process, or key teeth, and in some cases, our sampling of fossil taxa was constrained by the availability of complete or near-complete mandibles that were not taphonomically deformed
The ecological group breakdown is 36 mesocarnivorous taxa, 30 hypercarnivorous taxa, 21 bone-cracking taxa, and 6 hypocarnivorous taxa (Supplementary Table S1). We have adopted the categorizations used by taxon specialists and assigned them based om previous publications that either describe the diet of extant taxa or are inferred for extinct taxa based on dental morphological descriptions. Our analyses here are of the mandible itself and will avoid mandible morphological descriptions used to determine whether taxa are mesocarnivorous, hypercarnivorous, hypercarnivorous bone-crackers, or hypocarnivores, so the mandibular analyses here are independent of the morphological criteria used for dietary categorization. All taxa are represented and studied via photographs taken from collection databases and previous publications or taken directly during visits.
Institutional Abbreviations.
AMNH: American Museum of Natural History, USA; BMNH: Natural History Museum, London (formerly the British Museum of Natural History), UK; CGM: Egyptian Geological Museum, Egypt; CORD-PZ: Museo de Paleontologia, Facultad de Ciencias Exactas, Fisicas y Naturales de la Universidad Nacional deo Cordoba, Argentina; IUPC: Indiana University Paleontology Collections, USA; MHNC: Museo de Historia Natural “Alcide d’Orbigny,” Bolivia; MHNT.PAL: Muséum d’Histoire Naturelle de Toulouse, France; MNHN: Museum National d’Historie Naturelle, France; MPM-PV: Museo Regional Provincial “Padre M. J. Molina,” Argentina; UF: University of Florida, USA; UMMZ: University of Michigan Museum of Zoology, USA; USNM: Smithsonian Institution National Museum of Natural History, USA; YPM: Yale Peabody Museum, USA.
Geometric Morphometrics
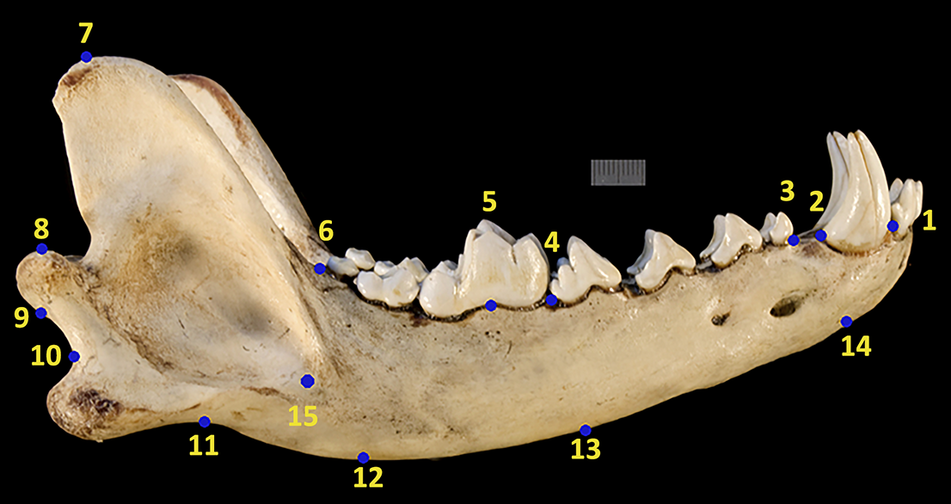
Geometric morphometrics is the analysis of shape that uses Cartesian landmark and semilandmark coordinates to capture variation in shape (Adams et al. Reference Adams, Rohlf and Slice2004). Landmarks for geometric morphometrics were collected from photographs using the multipoint tool in the software ImageJ (Rasband Reference Rasband1997). Images were processed to have the rostrum of the mandible pointing toward the left side of the photograph. Fifteen landmarks were taken from the mandible, including (1) the anterior and (2) posterior of the canine root, (3) the anterior and (4) posterior of the premolar row, (5) the projection of the protocone cusp of the “principal” carnassial or its geometric equivalent (which will be referred to throughout this paper simply as the “carnassial”), (6) the posterior of the molar row, (7) the tip of the coronoid process, (8) the highest and (9) lowest points of the condylar process, (10) the angular notch between the angular process and the condylar process, (11) the angular extreme of the angular process, (12, 13, and 14) the perpendicular point on the ventral side of the mandibular corpus (from 6, 4, and 2, respectively) based on the horizontal line between landmarks (1) and (6), and (15) the most anterior point of the masseteric fossa (Fig. 2). These landmarks follow Meloro and O’Higgins (Reference Meloro and O’Higgins2011).
Landmark scheme of the therian mammal jaws in this analysis with a Canis lupis mandible as an example obtained from the University of Michigan Museum of Zoology Animal Diversity Web database.

Geometric morphometric analysis was carried out in R (Ihaka and Gentleman Reference Ihaka and Gentleman1996) with the R package geomorph v. 4.0.5 (Adams and Otárola-Castillo Reference Adams and Otárola-Castillo2013; Adams et al. Reference Adams, Collyer, Kaliontzopoulou and Baken2023). Outlines were imported into rStudio after processing into a TPS format. Landmarks were Procrustes superimposed to align landmarks and eliminate the difference in size so that variation in landmark placement and shape can be meaningfully analyzed. The aligned shapes underwent principal component analysis (PCA) to identify the major axes of shape variation in the sample and to provide a new set of shape variables that are mathematically uncorrelated with one another. Procrustes-aligned shapes also went through a single-factor multivariate analysis of variance (MANOVA; Adams and Collyer Reference Adams and Collyer2018; Huberty and Petoskey Reference Huberty, Petoskey, Tinsley and Brown2000) of ecological categories and taxonomic grouping (Adams and Collyer Reference Adams and Collyer2018) to compare correlation of shape between the two. To determine whether any of the ecological groups are morphological outliers, we compared Procrustes distances between their shapes and calculated an unweighted pair group method with arithmetic mean (UPGMA) tree to show their differences. Morphological integration analysis was performed to test which parts of mandibular shape are modularized and independently evolving. Comparative morphological shape evolution of the horizontal ramus (the tooth-bearing body of the mandible) and the ascending ramus (the posterior portion of the mandible consisting of the coronoid, condylar, and angular processes) was done using the function compare.multi.evol.rates to see the rates of shape evolution between the areas of mandibular shape identified by the integration analysis. This analysis estimates multivariate evolutionary rates assuming a Brownian motion model of evolution (Denton and Adams Reference Denton and Adams2015). For this analysis, the landmarks were subdivided as landmarks 1–5 and 12–14 for the horizontal ramus and landmarks 6–11 and 15 for the ascending ramus. A time-calibrated phylogenetic tree was used for these analyses derived from Newick trees from Ahrens (Reference Ahrens2017), Baskin (Reference Baskin, Janis, Scott and Jacobs1998), Borths et al. (Reference Borths, Holroyd and Seiffert2016), Goin et al. (Reference Goin, Woodburne, Zimicz, Martin and Chornogubsky2016), Solé et al. (Reference Solé, Godinot, Laurent, Galoyer and Smith2018), Spaulding and Flynn (Reference Spaulding and Flynn2012), and Wozencraft (Reference Wozencraft and Gittleman1989) that included the taxa from this research. The Spaulding and Flynn (Reference Spaulding and Flynn2012) topology was used for the higher-level relationships and the others (Wozencraft Reference Wozencraft and Gittleman1989; Baskin Reference Baskin, Janis, Scott and Jacobs1998; Borths et al. Reference Borths, Holroyd and Seiffert2016; Goin et al. Reference Goin, Woodburne, Zimicz, Martin and Chornogubsky2016; Ahrens Reference Ahrens2017; Solé et al. Reference Solé, Godinot, Laurent, Galoyer and Smith2018) for family-level clades. The Newick trees were combined with the R package phytools v. 1.5-1 (Revell Reference Revell2023) and time-calibrated with first- and last-appearance dates from the Paleobiology Database (Peters and McClennen Reference Peters and McClennen2016; Fig. 1) using the timePaleoPhy function.
Beam Analysis and Mechanical Advantage
To compare mandible bite performance at different locations along the toothrow and among taxa, we used principles of beam analysis. Beam analysis describes an object regarding its strength, resistance, and reaction to bending if a force is applied to it as if it were beam (in this case, the mandible is being treated as a beam; Metzger et al. Reference Metzger, Daniel and Ross2005; Therrien Reference Therrien2005; Porro et al. Reference Porro, Holliday, Anapol, Ontiveros, Ontiveros and Ross2011). This analysis was carried out via 2D photographs using methods outlined by (Therrien Reference Therrien2005). Seven measurements were taken as follows to calculate the second moment of area (I) for the canine, precarnassial, carnassial, and postcarnassial areas of the mandibular body: the dorsoventral height and the labiolingual width. These measurements were taken in ImageJ using the line segment tool from buccal and occlusal photographs of mandibles. These measurements were used to calculate the second moment of area (I) for each plane:
 $$ Ix=\frac{\pi b{a}^3}{4}\hskip1.08em $$
 $$ Iy=\frac{\pi a{b}^3}{4}\hskip0.96em $$
where a represents the dorsoventral radius and b represents the labiolingual radius. Ix is the second moment of area on the labiolingual plane and Iy is the second moment of area for the dorsoventral plane. The section modulus (Z) of each plane in the area can then be obtained using the equations:
 $$ Zx=\frac{Ix}{a}\hskip0.96em $$
 $$ Zy=\frac{Iy}{b}\hskip0.84em $$
The section moduli can then be used to determine relative bending force in each area. The dorsoventral bending force (DBF) and the labiolingual bending force (LBF) may be obtained by dividing Zx and Zy, respectively, by the distance of each area to the condyle (L). These values must then be log-transformed to be comparative to one another due to the range of body sizes:
 $$ \mathrm{DBF}=\log \left(\frac{Zx}{L}\right) $$
 $$ \mathrm{LBF}=\log \left(\frac{Zy}{L}\right) $$
Additionally, the section modulus for the x-plane may be divided by the section modulus for the y-plane to give the relative bending force (RBF):
 $$ \mathrm{RBF}=\frac{Zx}{Zy} $$
These bending force values may then be used to generate a bending force profile of the mandibles along the horizontal ramus from the rostral to posterior end.
Mechanical advantage measurements were used as a proxy for bite force. Mechanical advantage is a ratio of the length of the in-lever (the lever arm producing force, i.e., the muscle) to the length of the out-lever (the lever arm where the force comes out at, i.e., the bite point; Greaves Reference Greaves1983, Reference Greaves1985). Mechanical advantage was calculated for each combination of in-lever for temporalis and masseter muscle and out-lever for the canine and carnassial bite.
Digital Model Creation
We also used finite element analysis (FEA) to estimate bite performance as a measure of stress and strain. To do this, we created 3D digital models from each 2D photograph. Before model creation, we took a series of linear measurements from the specimens from buccal and occlusal views of the mandibles, including the length and height of the mandible and the width of each tooth. Simple extruded 3D models were created from a series of photographs based on the methods of Morales-García et al. (Reference Morales-García, Burgess, Hill, Gill and Rayfield2019). This procedure was accomplished by importing photographs and outlines of the buccal view of mandibles into the 3D software Blender (Brito Reference Brito2007), where a 2D mesh was created via outlining the imported images, which produces a 2D mesh. Our models intentionally represented only the bony mandible and excluded the dentition, because tooth count varies among the different taxa studied, and the completeness of the dentition varied among fossilized specimens. The 2D mesh was then extruded based on the average width of the toothrow measured previously in ImageJ. Simple extruded 3D models were confirmed to be the size of the specimen before being exported. The Blender models were then imported into MeshLab (Cignoni et al. Reference Cignoni, Callieri, Corsini, Dellepiane, Ganovelli and Ranzuglia2008) for remeshing to ensure a watertight mesh with an appropriate number of tetrahedral elements of relatively equal size was created before being exported into the software FEBio for FEA (Maas et al. Reference Maas, Ellis, Ateshian and Weiss2012). The meshing process is illustrated in Figure 3.
The process of creating a simple extruded 3D finite element model using the Canis lupus mandible from Fig. 2 as an example. A, A picture of the mandible from the lateral view. B, Imported photo from A as a background in Blender to trace and then fill in. C, From an occlusal view of the mandible, measuring average tooth width to extend traced object to create a simple extruded 3D model in Blender (D).

Finite Element Analysis
FEA was applied to the resulting 3D extruded mandible models to calculate the stress and strain imposed by bites at two functionally comparable locations along the toothrow. FEA is the use of calculations, models, and simulations to understand how an object may behave when a force(s) is(are) applied to it by treating the model as a number of discrete, connected elements (Richmond et al. Reference Richmond, Wright, Grosse, Dechow, Ross, Spencer and Strait2005; Ross Reference Ross2005; Rayfield Reference Rayfield2007). Simple extruded 3D models were imported into FEBio to determine von Mises stress and strain from the forces of biting and feeding in the mandibles (Morales-García et al. Reference Morales-García, Burgess, Hill, Gill and Rayfield2019; Varela et al. Reference Varela, Tambusso, Zerpa, McAfee and Fariña2023). Solved finite element models can be used to determine the stress (force/area) and strain (deformation) of an object by calculating the movement of fixed points on a model when a force is applied to it (Strait et al. Reference Strait, Wang, Dechow, Ross, Richmond, Spencer and Patel2005; Bright and Gröning Reference Bright and Gröning2011; Reed et al. Reference Reed, Porro, Iriarte-Diaz, Lemberg, Holliday, Anapol and Ross2011). A convergence test on element resolution was done to determine the minimum number of elements necessary that would produce the same results as higher-resolution models (Rayfield Reference Rayfield2007; Bright Reference Bright2014). The minimum number of elements was found to be an average of about 600,000 elements after using the increasing resolution tool in FEBio.
The models were assigned isotropic elastic properties with a density of 1900 kg/m3, Young’s modulus of 20 GPa, and a Poisson ratio of 0.3 based on the average values of mammalian cortical bone (Currey Reference Currey1984; Wroe et al. Reference Wroe, McHenry and Thomason2005; Tseng Reference Tseng2013). The whole mandible was assigned these properties. As mentioned earlier, the models were created without the dentition, including tooth roots, because previous studies have shown that uncertainty and variation in the tooth roots introduce biases that make overall comparisons difficult (Marinescu et al. Reference Marinescu, Daegling and Rapoff2005) and have integrated teeth and mandible bodies as one, as they are both stiff (Tseng Reference Tseng2013; Bright Reference Bright2014; Serrano-Fochs et al. Reference Serrano-Fochs, De Esteban-Trivigno, Marcé-Nogué, Fortuny and Fariña2015; Morales-García et al. Reference Morales-García, Burgess, Hill, Gill and Rayfield2019). Because both fossil and extant mandibles are composed of the same tissue, we used the same settings for material properties across the entire mandible in both extant and extinct taxa. So long as all models share the same material properties, results of FEA can be comparable (Rayfield Reference Rayfield2007; Wroe Reference Wroe2008; Bright Reference Bright2014).
To set our analyses up as counter-lever experiments, we placed boundary constraints on the mandibular condyle and the most dorsal and ventral areas of muscle attachment (Tseng et al. Reference Tseng, Garcia-Lara, Flynn, Holmes, Rowe and Dickson2023). We used multipoint constraints defined with four degrees of freedom (for muscle points: U1 = U2 = U3 = UR1 = UR2 = UR3 = 0; for the mandibular condyle: U1 = U2 = U3 = UR3 = 0; U1 is the mediodistal axis, U2 is the dorsovental axis, and U3 is the axis along the jaw length; U describes translational movement, and UR describes rotational movement) (Tseng Reference Tseng2013; Gill et al. Reference Gill, Purnell, Crumpton, Brown, Gostling, Stampanoni and Rayfield2014). The mandibular condyle constraints allow only for the expected movement of the joint as it would occur in vivo.
Force loads were placed at the two bite points of interest: the canine and the carnassial. These points were chosen because they are two different points of the mandible (rostral vs. posterior) and have different functions (acquiring/subduing prey with the canine vs. chewing/processing food with the carnassial/molar area). The carnassial is the tooth most associated with the inferred diet and ecology of the mammals in this dataset (Greaves Reference Greaves1983; Pineda-Munoz et al. Reference Pineda-Munoz, Lazagabaster, Alroy and Evans2017; Hopkins et al. Reference Hopkins, Price and Chiono2022). Vulpavus profectus, a small, non-carnivoran carnivoramorphan and inferred mesocarnivore, was loaded 100 N at either the canine or carnassial. This 100 N load on Vulpavus was then scaled according to surface area of other mandibles to produce a comparable load for other models and allow a comparison of stress and strain on the mandible based on differences in mandibular shape (Dumont et al. Reference Dumont, Grosse and Slater2009). Stress and strain values were recorded as the volumetric average of the von Mises stress and effective Lagrange strain of the entire shape (volumetric average is similar to the mesh-weighted arithmetic mean from Marcé-Nogué et al. [Reference Marcé-Nogué, De Esteban-Trivigno, Püschel and Fortuny2017]).
Multivariate regression was used to extract the component of shape associated with each of the biomechanical metrics: the mechanical advantage of temporalis and masseteric bites at the canine and carnassial separately; the maximum dorsoventral bending force; the maximum labiolingual bending force and relative mandibular force at the canine, precarnassial, carnassial and postcarnssial areas; and average von Mises stress when biting on the canine and carnassial separately. These regressions tested which biomechanical metric had the highest explanatory power for mandibular shape. A phylogenetic generalized least square (PGLS) was also performed to test the relationship between these metrics and shape, correcting for phylogeny. A multivariate regression of shape onto centroid-size was done to estimate the allometric component of the relationship between mandibular shape and biomechanical variables. Canine stress and carnassial stress underwent a MANOVA of ecological and taxonomic categories to analyze the correlation of the stresses and the categories and was followed by a Tukey post hoc test to assess between-group differences between groups.
Convergence Testing
The degree of convergence was measured using Ct-metrics as outlined in Grossnickle et al. (Reference Grossnickle, Brightly, Weaver, Stanchak, Roston, Pevsner, Stayton, Polly and Law2024). Ct-metrics are derived from the C-metrics of Stayton (Reference Stayton2015) and measure whether the tips of the tree are closer in variable space than their ancestors were. Ct1 is the preferred Ct measure and is calculated as 1 − (D tip/D max.t), with D tip representing the distance between phylogenetic tips of focal taxa and D max.t representing the maximum distance between any tips or ancestral nodes of those lineages that has been closed by subsequent evolution. Positive Ct1 indicates convergences, with 1 being total convergence, and negative Ct1 indicates divergence. This was done with the R function calConvCt from the package convevol v. 2.2.1 (Brightly and Stayton Reference Brightly and Stayton2024). The calConvCt calculates the overall average Ct-metrics, group-specific Ct-metrics, and the group weighted means Ct-metrics (i.e., averaged giving equal weight to each group pairing as opposed to each taxon pairing so that one large group does not disproportionally influence results). Ct1 measures were acquired to test for convergence in mandibular stress from canine and carnassial bites among derived hypercarnivores and bone-crackers.
Results
Geometric Morphometrics Analysis
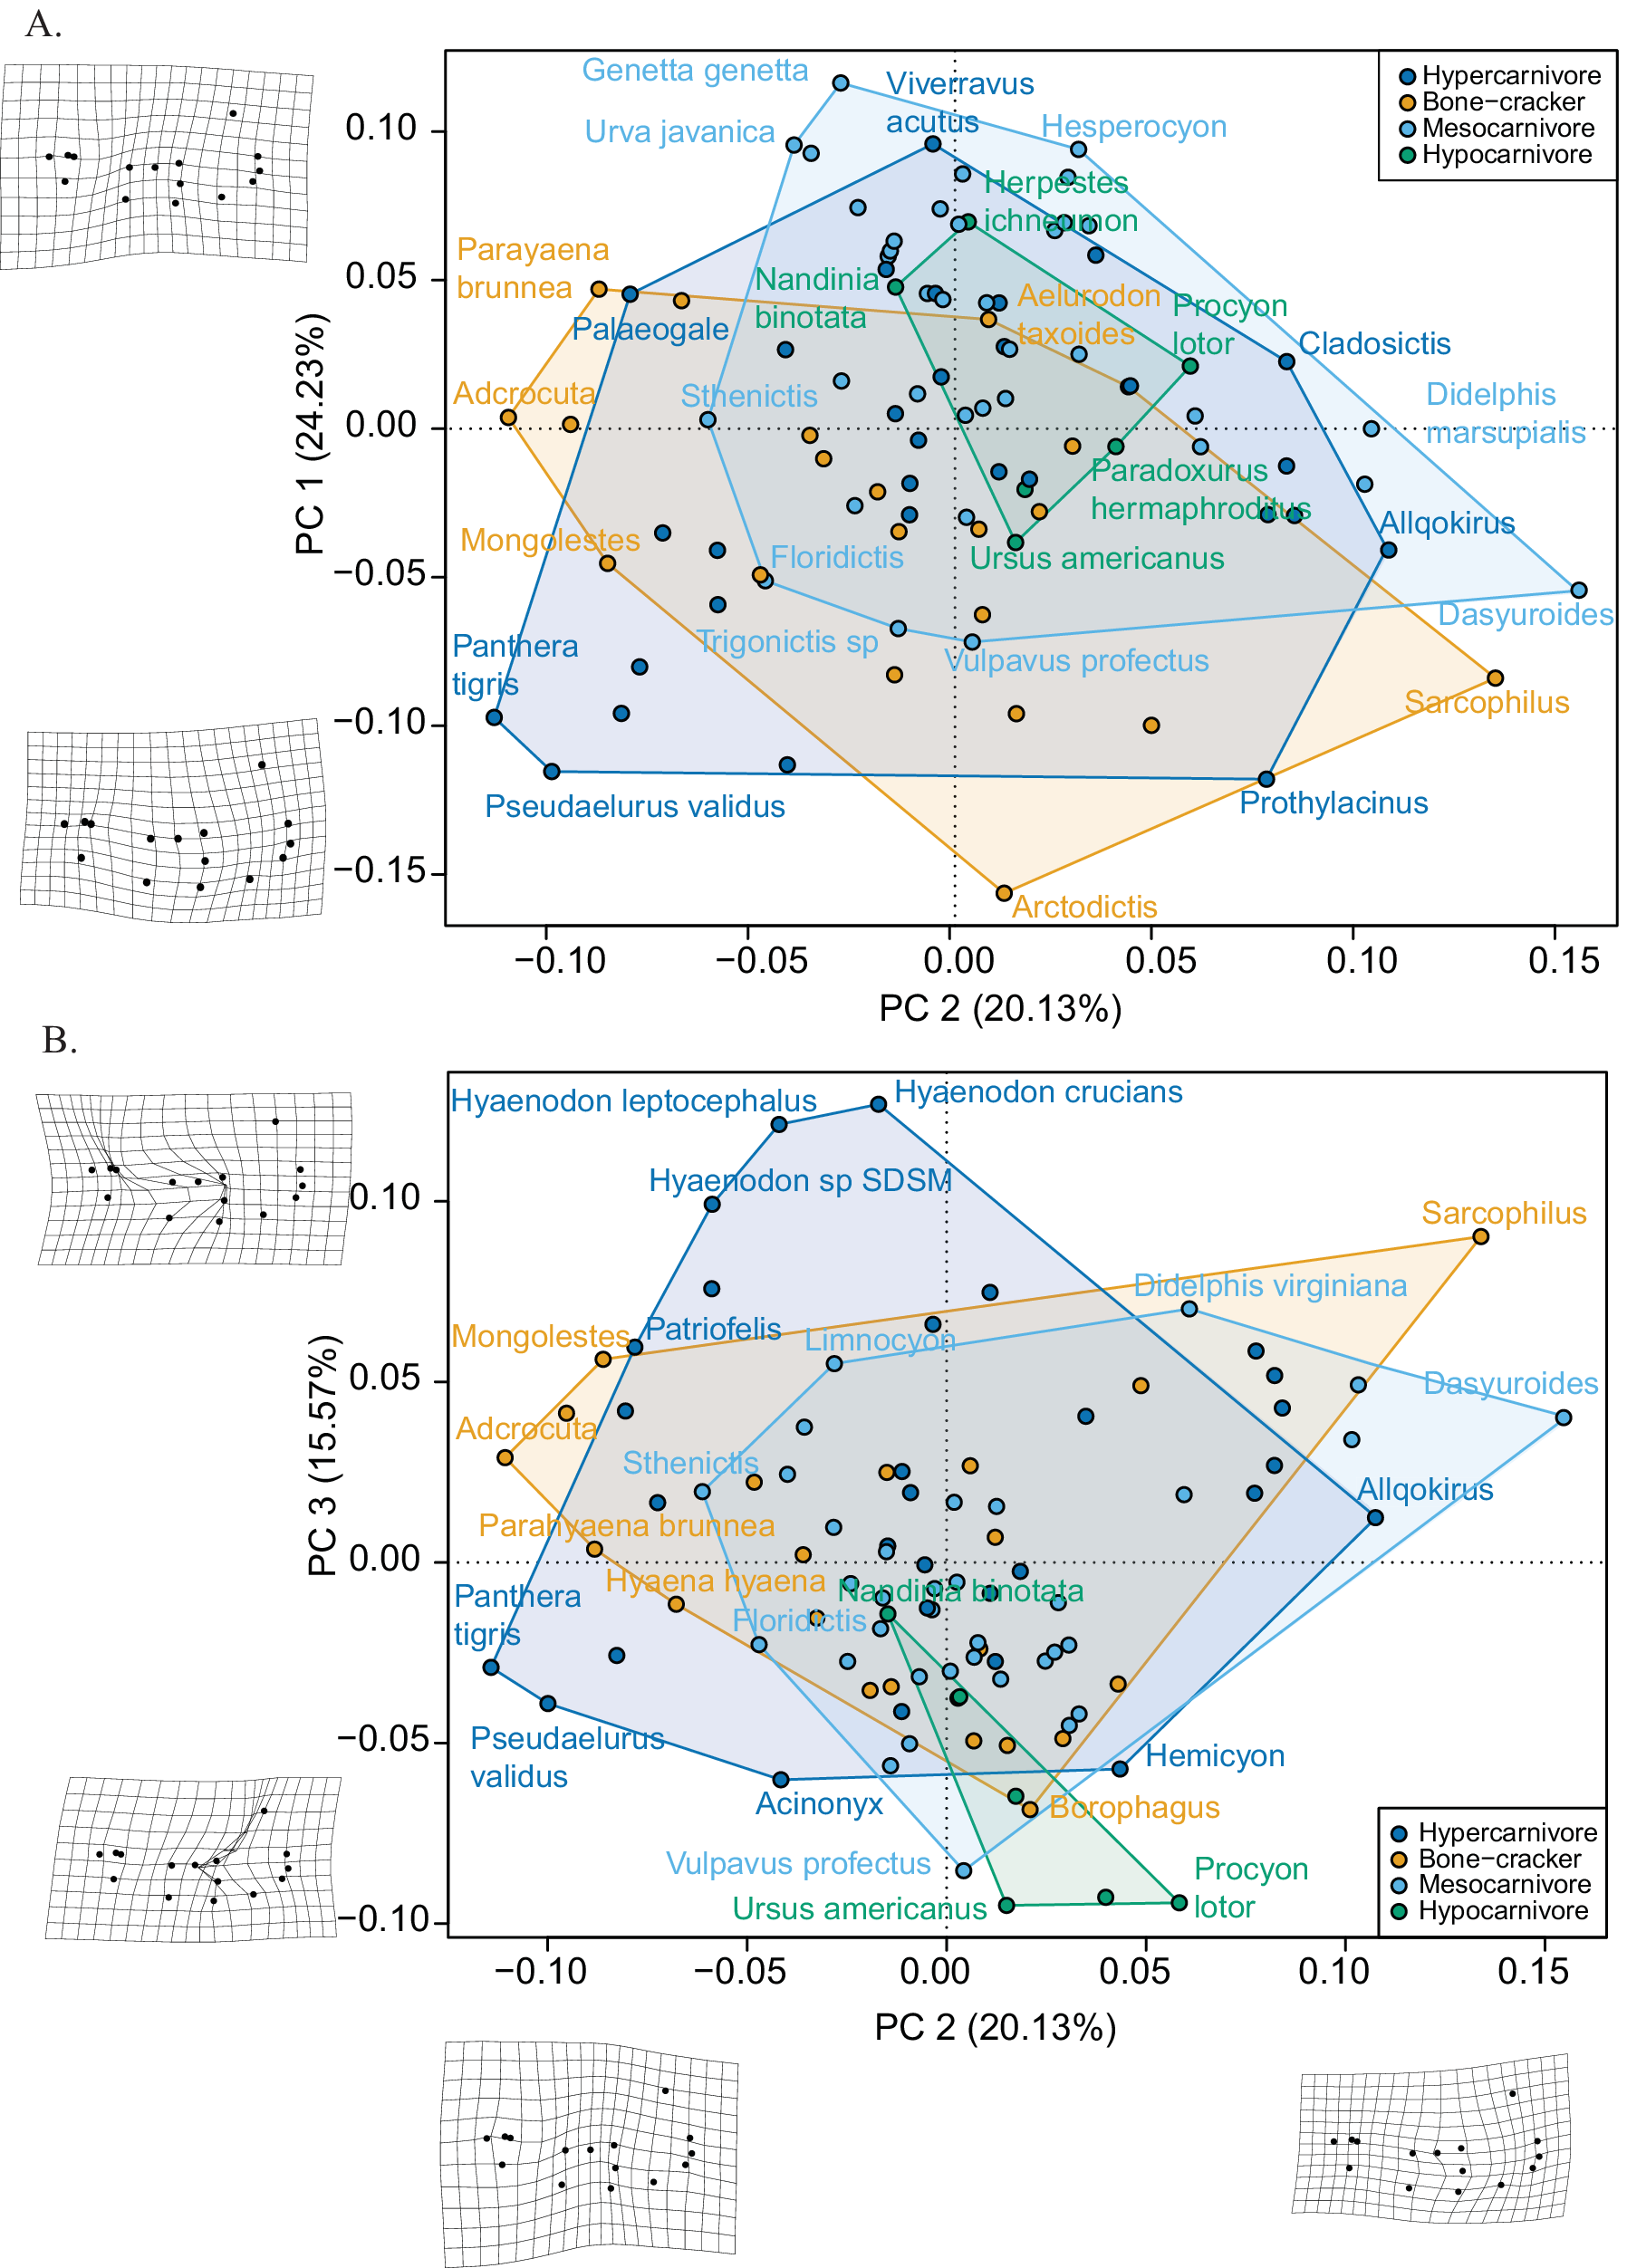
The primary differences among the carnivore groups are related to the relative position of the tooth row, the depth of the mandible, and the configuration of the processes at the posterior end. Procrustes distances of all specimens are used in a PCA and plotted onto a PCA plot with polygons around subsets to identify groups (Figs. 4, 5). PC 1 represents primarily the angle of the horizontal ramus of the jaw. Negative PC 1 represents a more angular jaw that is deeper with a thicker condyle. Positive PC 1 is a less angled horizontal ramus that is shallower and has a smaller condyle. PC 2 represents the length of the premolar area (landmarks 3, 4, 13, and 14) and the molar area (landmarks 4, 5, 6, 12, and 13). Positive PC 2 is a more anteriorly positioned premolar area and a larger molar area. Negative PC 2 is a more posteriorly positioned premolar area and a smaller molar with landmarks 4 and 6 coming closer to landmark 5. PC 3 represents the shape of the mandible between canine landmarks (1, 2, 3, and 14) and the molar landmarks (4 and 13) (the premolar row) as well as the closeness of landmark 5 between landmarks 4 and 6. Positive PC 3 has more rostral shift of the premolar row and negative PC 3 is a wider premolar row with landmarks 4 and 6 closer to landmark 5.
Principal components of shape for carnivorous therian mammal jaws with grouping based on ecology. Principal components compared include PC 1 vs. PC 2 (A) and PC 3 vs. PC 2 (B), keeping PC 2 on the x-axis.

Principal components of shape for carnivorous therian mammal jaws with grouping based on taxonomy. Principal components compared include PC 1 vs. PC 2 (A) and PC 3 vs. PC 2 (B), keeping PC 2 on the x-axis.

The PCA shows that species overlap among ecological groups and that different clades have possibly converged on these ecologies but there are some noticeable areas of uniqueness, as seen in Figure 4 (this is supported by a single-factor MANOVA on Procrustes distances with an R 2 = 0.12). On the positive half of PC 1, all ecological groups can be found, but mesocarnivores can be found farther along the positive end of the axis toward the periphery. The negative half of PC 1 has all ecological groups, but those categorized as hypercarnivores and bone-crackers are predominantly on this side compared with the positive half of PC 1 and reach farther toward the periphery. For PC 2, the negative end lacks most categorized hypocarnivores (the exception being Nandinia) and has categorized hypercarnivores and bone-crackers reaching farther toward the periphery, while the positive end has all ecological groups, with mesocarnivores reaching the periphery of the axis with Dasyuroides and bone-crackers with Sarcophilus. The negative end of PC 3 has all ecological groups, with most mesocarnivores and all hypocarnivores on this end, and both reach the farthest end of the axis. The positive end of PC 3 has hypercarnivores and bone-crackers reaching toward the periphery of the axis. Hypocarnivores are the most distinctive ecological group, with most being separated from other groups with PC 2 and PC 3 (except Herpestes ichneumon and Nandinia). Hypercarnivores and bone-crackers are the next most distinctive, being separated on PC 2 and PC 3 for the former and PC 1 and PC 2 for the latter, with certain quadrants having little presence (negative PC 2 and positive PC 3 for hypercarnivores and negative PC 1 and PC 2 for bone-crackers). Mesocarnivores generally range around the center of morphospace with more taxa on one end of either PC 1 or PC 3 when looking with PC 2 and mesocarnivorous metatherians pulling it toward the positive end of PC 2. Being near the center could indicate that they possibly define the mean shape. An UPGMA tree of mandibular morphology shows that categorized hypocarnivores are the most different morphologically, and hypercarnivores and bone-crackers are more similar to one another than mesocarnivores (Supplementary Fig. S1).
The same plots are labeled with taxonomic groups in Figure 5, which shows that the hypercarnivores are composed of specialized members of several clades that converged on the same area of morphospace (placental hypercarnivores occupying negative PC 2 morphospace and metatherians in general occupying mostly the quadrant of positive PC 2 and negative PC 1 morphospace). Stem carnivoramorphans occupy a narrow space in negative PC 2 and mostly in positive PC 1. Caniforms and hyaenodonts are primarily around the center of morphospace but with mesonychids slightly off-center mostly in the negative PC 1/PC 2 quadrant. This may be because both clades (except for Limncyoninae in Hyaenodonta and Mongolestes) still retain the plesiomorphic three-molar jaw morphology among placental mammals. Oxyaenids are closer to felids in morphospace. When looking at PC 2 and PC 3, all carnivoramorphs can be primarily separated from non-carnivoramorphs on negative PC 3 and negative PC 2, with mesonychids and oxyaenids between them and the rest of the non-carnivoramorph groups (Fig. 4D).
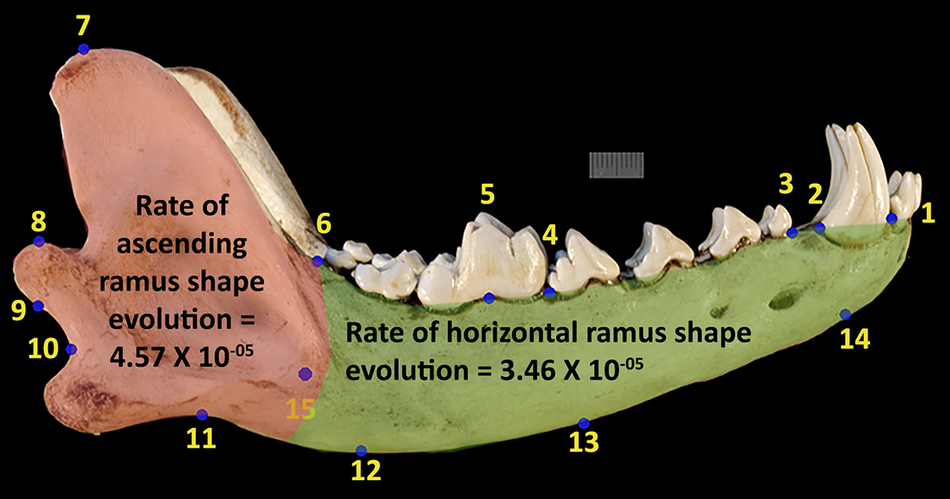
The subdivided landmarks for the compare.multi.evol.rates function show a significant difference in rates of evolution, with ascending ramus having faster rates of shape change versus the horizontal ramus (Fig. 6). This difference in rates of morphological evolution is approximately 1:3 for the ascending versus the horizontal ramus.
Landmark scheme figure from Fig. 2 but with highlighted areas designating landmarks associated with the ascending ramus in red and the horizontal ramus in green with rates of evolution listed. The ratio of these rates is approximately 1:3.

Linear Functional Measurements and Beam Analysis
Mechanical advantage and beam analysis metrics of each taxon were regressed onto the Procrustes distances of the respective taxa, showing the former has higher explanatory power (Table 1). R 2 values of each individual were generally less than 0.10. When summed according to each metric category (DBF, LBF, RMF, or mechanical advantage), mechanical advantage has the most explanatory power (0.35) and relative mandibular force has the least explanatory power (0.17). The explanatory power of most of the beam analysis metrics is greatly improved under a MANCOVA when phylogeny is considered. PGLS tests with the mechanical advantage and beam analysis metrics showed increased R 2 values in comparison to the initial regression that were significant except for the RMF of the canine which decreased (Table 2).
List of p-values and R 2 values of the respective functional metrics regressed onto Procrustes-aligned mandible shape. DBF, dorsoventral bending force (resistance to dorsoventral forces); FES, finite element analysis; LBF, laterolingual bending force (resistant to laterolingual forces); MA, mechanical advantage; RMF, relative mandibular force.

List of p-values and R 2 values of the respective metrics from phylogenetic generalized least squares (PGLS) onto Procrustes-aligned mandible shape. DBF, dorsoventral bending force (resistance to dorsoventral forces); LBF, laterolingual bending force (resistant to laterolingual forces); RMF, relative mandibular force; MA, mechanical advantage.

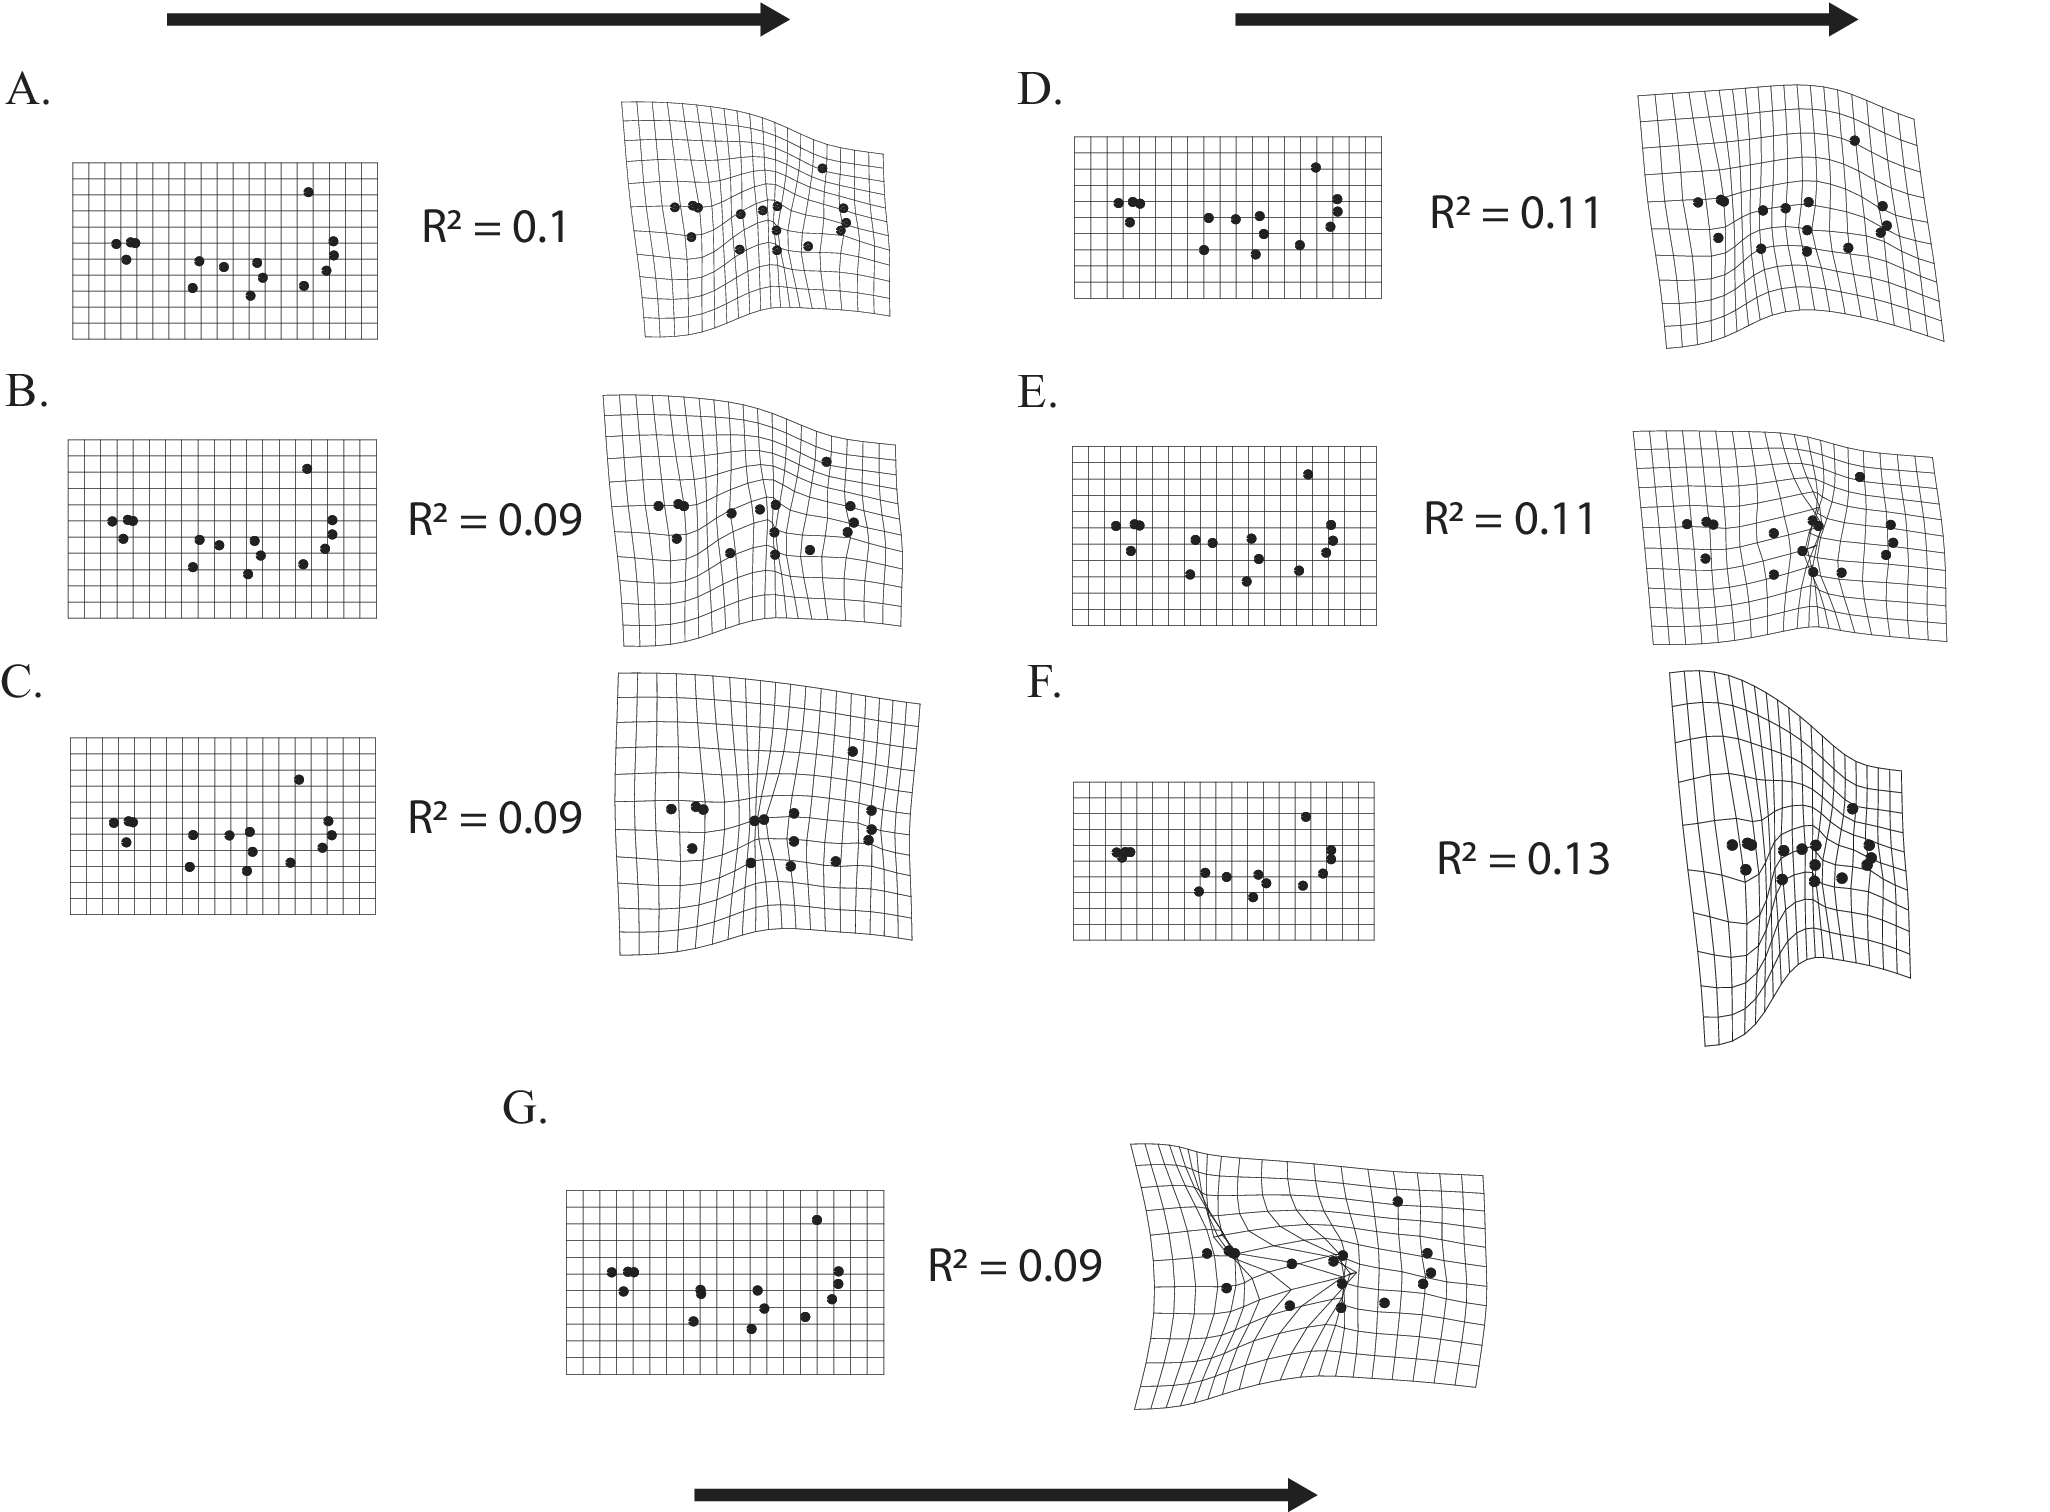
The regressed functional metrics are visualized with the landmarked shape to demonstrate the deformation of shape via splines as each metric increased in value (Fig. 7). The metric with the highest explanatory power is the mechanical advantage of the canine tooth with the temporalis muscle (with the RMF of the canine coming in a close second), and the metric with the least explanatory power is the relative mandibular force around the precarnassial area (Table 1). It should be noted that the mechanical advantage of the carnassial and masseter may be indicative of diet, as the taxa with highest values are hypercarnivores, and the taxa with the lowest values are hypocarnivores. The relative mandibular force of the premolar appears to be somewhat related to body size, as the large metatherian carnivore Arctodictis has the highest value, while the much smaller Allqokirus has the lowest value. However, a multivariate regression of shape on centroid size reveals a weak and nonsignificant effect from allometry on the shape data (R 2 = 0.02 and p-value = 0.075). Generally, as biomechanical values increase, mandibles undergo shortening and thickening with increases in muscle attachment areas such as coronoid height and increasing carnassial blade length (Fig. 7). Masseteric area appears to be more controlled by the posterior side of the dentition than the more rostral side.
Spline deformations of mandible strength per functional metric with its associated R 2 value. Arrows indicate changes in mandibular shape from a weaker to stronger mandible. A, Dorsoventral bending force at the canine. B, Lateromedial bending force at the postcarnassial. C, Relative mandibular force at the canine. D, Mechanical advantage of the canine-temporalis lever system. E, Mechanical advantage of the carnassial-masseter lever system. F, Volumetric average stress from the canine load. G, Volumetric average stress from the carnassial load.

Finite Element Analysis
An analysis of variance (ANOVA) shows that the canine stress and strain on the mandibles is significantly different among the different dietary categories of mesocarnivore, hypercarnivore, hypocarnivore, and bone-crackers (p-value < 0.05). On average, mesocarnivores have the highest stress from the canine load, followed by hypercarnivores, hypocarnivores, and bone-crackers, and hypocarnivores have the highest stress from the carnassial, followed by mesocarnivores, bone-crackers, and hypercarnivores (Table 3). This difference between these groups is more apparent in stress and strain on loads from the canine bite as opposed to the carnassial bite. Between-group differences are significant in the canine bite stress between mesocarnivores and bone-crackers (adjusted p-value < 0.01), and there are no significant differences between groups for the carnassial bite stress (Table 4). In terms of the differences between the different clades, stress and strain on the mandible is only significantly different for the carnassial bite and is not significantly different for the stress and strain from the canine bite (p-value = 0.27) (Table 3). This is also true for between-group differences, as there are significant differences in the carnassial bite stress between Feliformia and Caniformia (adjusted p-value < 0.01), Hyaenodonta and Caniformia (adjusted p-value < 0.01), Mesonychia and Caniformia (adjusted p-value = 0.01), and Metatheria and Caniformia (adjusted p-value < 0.01) (Table 4). The highest stress on the carnassial among the taxonomic grouping is with the non-carnivoran carnivoramorphans, followed by caniforms, feliforms, hyaenodontans, metatherians, mesonychians, and oxyaenodontans. For larger cladistic groupings, carnivoramorphans still have the highest stress from the carnassial load followed by creodonts, metatherians, and mesonychians.
List of group means of the volumetric average von Mises stresses and effective Lagrange strain of the mandible from canine and carnassial loads with groups based on either ecology or clade.

List of between-group pair comparisons of the volumetric average von Mises stresses of the mandible from canine and carnassial loads within ecological and taxonomic groups from a Tukey post hoc test. Numbers in bold show significant differences between groups.

When regressed onto Procrustes-aligned shape data, stress and strain metrics are equally capable of explaining variation in shape (R 2 ~ 0.12 and p-value < 0.01 for both) and are comparable to the explanatory power of the mechanical advantage metric (Table 1). Canine loads are slightly better at explaining shape than the carnassial loads (the latter of which is R 2 ~ 0.095 and p-value <0.01). PGLS of stress and strain data increases the R 2 value and maintains significance (R 2 = 0.25 for canine stress and R 2 = 0.10 for carnassial stress with both p-values < 0.01) (Table 2). Interactions between these metrics and either ecology or phylogeny have low explanatory power. As stress on the mandible decreases, the shape of the mandible changes in that it undergoes shortening, becomes flatter ventrally, with a reduction in postcarnassial area and a more rostral-orientated masseteric fossa (Fig. 7F,G).
Convergence Testing
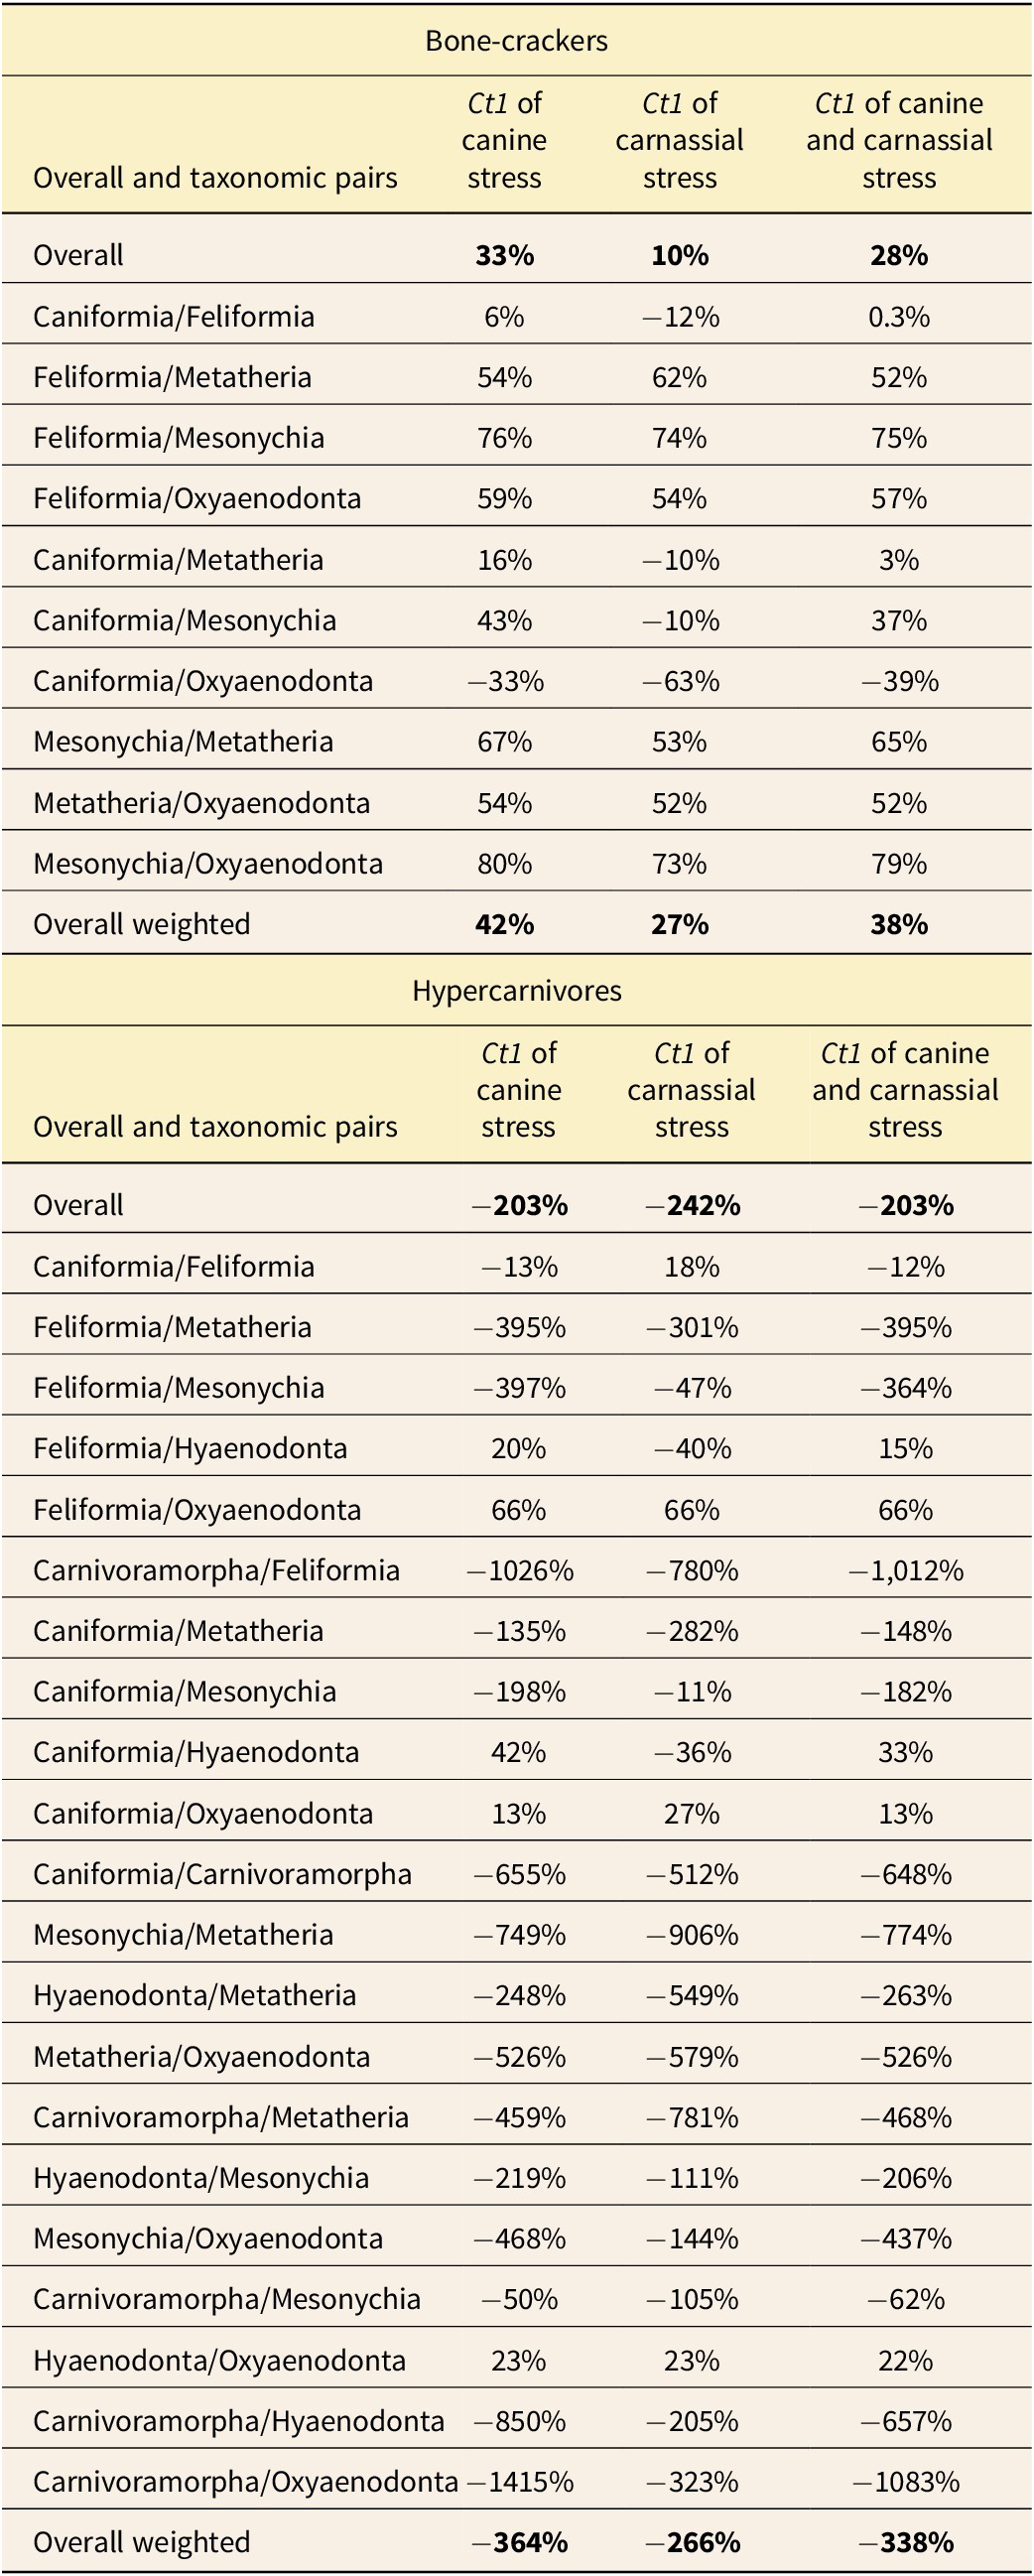
For bone-cracking taxa, there is evidence of overall convergence in stress from the canine bite with overall Ct1 = 33% and a taxonomic group weighted Ct1 = 42% (Table 5). For stress from the carnassial bite, bone-cracking taxa have weaker convergence with an overall Ct1 = 10% and a taxonomic group weighted Ct1 = 27%. When the stresses are considered together, overall Ct1 = 28% and taxonomic group weighted Ct1 = 38%. Looking at between-group differences, evidence of convergence from Ct1 with both stresses include Caniformia–Feliformia, Feliformia–Metatheria, Feliformia–Mesonychia, Feliformia–Oxyaenodonta, Caniformia–Mesonychia, Caniformia–Oxyaenodonta, Mesonychia–Metatheria, and Metatheria–Oxyaenodonta, with Caniformia–Oxyaenodonta being the only divergent pairing.
Printed Ct1 measures from the convergence testing of the volumetric average von Mises stresses for canine and carnassial among bone-crackers and hypercarnivores of taxonomic groups. Bold highlights overall values.

For categorized hypercarnivorous taxa (non-bone-cracking taxa), there is evidence of divergence from the stress from the canine bite for both overall and taxonomic group weighted Ct1 (i.e., Ct1 < 0). Similar results of divergence are found with the stress from the carnassial bite for both overall and taxonomic group weighted Ct1. When the stresses are considered together, there is still evidence of divergence from overall and taxonomic group weighted Ct1. Looking at between-group differences, evidence of convergence between groups includes Feliformia–Hyaenodonta, Feliformia–Oxyaenodonta, Caniformia–Hyaenodonta, Caniformia–Oxyaenodonta, and Hyaenodonta–Oxyaenodonta. Evidence of divergence is in the remaining possible between groups (e.g., Caniformia–Feliformia) (Supplementary Table S2).
Discussion
Biomechanical Drivers of Shape
Comparative rates of shape evolution showed that the ascending ramus (the posterior portion of the mandible with muscular attachments) undergoes higher rates of evolutionary change in morphology than the horizontal ramus of the mandible. The ascending ramus is associated with the insertion of the abductor masticatory muscles such as the temporalis and the masseter. The orientation and proportional size of these masticatory muscles would highly influence the shape of the ascending ramus. For example, the shape of the coronoid process would be related to the temporalis muscles and the masseteric fossa and the angular process to the masseter muscles (Ross et al. Reference Ross, Patel, Slice, Strait, Dechow, Richmond and Spencer2005; Hart et al. Reference Hart, Nimphius, Rantalainen, Ireland, Siafarikas and Newton2017; Perry and Prufrock Reference Perry and Prufrock2018; Hartstone-Rose et al. Reference Hartstone-Rose, Hertzig and Dickinson2019, Reference Hartstone-Rose, Dickinson, Deutsch, Worden and Hirschkorn2022). The shape of the horizontal ramus would likely be influenced by toothrow length and the functional demands of the mandible for certain ecologies such as length for capturing prey or depth and thickness to resist strong forces in biting. If this is the case, it would be likely that functional and biomechanical metrics more associated with the ascending ramus, such as masticatory muscle size and orientation, would have greater explanatory power on the variation of morphology of the mandible.
Linear regression of the metrics on shape showed that, on average, the mechanical advantage measurements have higher explanatory power than any of the beam analysis metrics. This greater explanatory power may be because the in-lever for the mechanical advantage measurements captures muscle orientation and input force and includes the ascending ramus in its calculations. However, of all the functional metrics used, average von Mises stress on the mandible had the highest explanatory power, because FEA captures the average von Mises stress by volume of the entire mandible. This would mean that von Mises stress measurements had a greater representation of the mandibular shape than the mechanical advantage, which reduces mandibular shape to the in-lever and out-lever of the mandible.
For the beam analysis, the measurements around the canine had higher R 2 values on shape than in other areas of the mandible (Table 1). This is also true for the finite element analysis, as the average stress of the mandible at the canine had a higher R 2 than at the main carnassial. The increase in explanatory power for metrics around the canine may be due to the fact that the rostral portion of the mandible that includes the canine is associated with prey capture or subduing (i.e., the “throat-bite” of large felids; Van Valkenburgh Reference Van Valkenburgh1999, Reference Van Valkenburgh2007), which, given the size of the carnivore and its typical prey size, could result in different shapes in that portion of the mandible for different functions or lifestyles.
However, the situation is more complex for the mechanical advantage measurements, as the canine-temporalis had better explanatory power than carnassial-masseter, but the latter had higher explanatory power than canine-masseter. This difference could be due to the different demands associated with the canine and molars and the respective masticatory muscles. In carnivores, the temporalis is often the larger of the two muscle groups, with its main purpose being for mandible elevation to produce a strong bite force, whereas the masseter is used for elevation and side-to-side motion in conjunction with the medial pterygoid muscles (Tseng et al. Reference Tseng, Antón and Salesa2011; Perry and Prufrock Reference Perry and Prufrock2018; Hartstone-Rose et al. Reference Hartstone-Rose, Dickinson, Deutsch, Worden and Hirschkorn2022). The side-to-side motion is more likely to be experienced with the function of the molars to process foods, whereas the canines are more associated with prey capture via closing. Additionally, to fully occlude jaws, side-to-side movement must be quite limited, so the upper and lower canines can slide past each other. The canines being associated with prey capture via closing may also provide an explanation as to why average volumetric stress on the mandible via the canine bite better explains shape. Many therian carnivores acquire prey with their jaws and need to be able to handle the forces caused by struggling prey (Christiansen and Adolfssen Reference Christiansen and Adolfssen2005).
Generally, a biomechanically stronger jaw (in this case, greater resistance to bending, torsion, and stress, and better transmitting muscle force) is associated with jaw shape that exhibited shortening, greater depth, greater areas of muscle attachment (including coronoid height and the rostral extent of the masseter), and an increase in carnassial blade length (Fig. 6). These features are generally adaptations for a more hypercarnivorous or bone-cracking ecology (or higher bite forces in general; Christiansen Reference Christiansen2008; Prevosti et al. Reference Prevosti, Turazzini, Ercoli and Hingst-Zaher2012; Echarri et al. Reference Echarri, Ercoli, Chemisquy, Turazzini and Prevosti2017), such as the hypercarnivorous mustelids (e.g., Mustela nivalis, Gulo gulo), the mesonychids, and felids (e.g., Pseudaelurus) from this study. In this study, many of the taxa that are hypercarnivorous shared these features of a stronger jaw, a greater mandibular depth, greater areas of muscle attachment (temporalis with the coronoid process or deep masseter with the mandibular fossa), increases in carnassial blade length, and shortening of the mandible. For the last one, this is more apparent in Carnivoramorpha and Metatheria such as Pseudaelurus and Arctodictis, respectively, than in the other groups, but is noticeable in Mesonychia with Mongolestes. In short, it appears that these results confirm that some biomechanical functions, such as stress on the mandible and the mechanical advantage of the canine and the temporalis muscle, do converge with diet type.
Phylogeny and Many-to-One Function in Carnivory
Mandibular shape is more strongly correlated with taxonomy and phylogenetic history than with its ecological role, and this correlation is reflected in the PCA of the shape of the mandible (Figs. 4, 5). This correlation with phylogenetic history had been shown to be the case in a prior study by Meloro and O’Higgins (Reference Meloro and O’Higgins2011) using 2D geometric morphometrics on the mandibles of “fissiped” carnivorans. Influences of this may be due to characteristics such as carnassial placement, as “creodonts” and metatherians have their main carnassial positioned more posteriorly than carnivorans and the “carnassial” for mesonychids was placed more posteriorly in landmark placing. Greaves (Reference Greaves1983) found that carnassial placement in Carnivora is based on the optimization of mechanical advantage to have the highest force while having room for food. Non-carnivoran carnivores such as metatherians and creodonts still hold to this principle to an extent with longer mandibles. Another influence on mandibular shape regarding carnassial length in Carnivoramorpha is that there was an early diversification into several carnassial types that are strongly associated with extant family-level clades (e.g., Canidae, Felidae, Mustelidae; Hopkins et al., Reference Hopkins, Price and Chiono2022). While taxonomy better explains the differences in mandibular shape in the taxa of this study, the explanatory power of the biomechanical metrics on shape that is within the normal means of the explanation of function on morphology captured by geometric morphometrics, as shown in a study on marmot mandibles by Caumul and Polly (Reference Caumul and Polly2005). While phylogenetic history has a large role in shaping mandibular evolution, functionality is still an influence and may have a greater one in lower clades.
In Figure 4, categorized ecological groups such as hypercarnivores and bone-crackers occupied a large portion of morphospace. This large occupation of morphospace may indicate that there are many ways in which deeply phylogenetically separated groups of therian carnivores achieved specialized ecologies such as hypercarnivory and bone-cracking in mandibular shape despite phylogenetic constraints. In this case, evolutionary starting points that may influence the variation available in mandibular shape are likely to be ancestral dental formula and shape. Examples of this include metatherians having four lower molars and three premolars as opposed to three molars and four premolars in eutherians, mesonychians being ancestrally omnivorous or herbivorous and losing their shearing surface through their evolutionary history (Szalay Reference Szalay1969), creodonts having all their lower molars carnassialized, and carnivoramorphans only having one carnassialized molar. However, the data were still generally able to separate the ecologies by their biomechanical metrics such as von Mises stress from loads on the mandible, although this is truer in the canine when looking between bone-crackers and mesocarnivores following a Tukey post hoc test. This separation of ecologies could indicate that there are common functional requirements still required for these ecologies, but these can be fulfilled by different mandibular shapes.
Alongside the results of the PCA of shape seen in Figure 4, it appears that bone-crackers of different shapes have indeed converged on similar amounts of stress on the mandible, although more so with canine biting versus carnassial biting. This could be interpreted as evidence of a many-to-one form–function relationship of the mandibles of bone-cracking carnivores, as many shapes are able to converge on similar amounts of reduced stress on the mandible. Between-group difference analysis supported this, as most taxonomic groups with bone-cracking carnivores showed convergence among one another, except for certain Caniformia pairings depending on canine stress or carnassial stress.
However, non-bone-cracking hypercarnivores overall showed divergence and did not strongly indicate many-to-one mapping of mandibular form and function. The divergence in stress among non-bone-cracking hypercarnivores could be attributed to phylogenetic history in mandibular shape and ancestral tooth count and diet, as mentioned previously. Between-group differences showed convergence in stress results among some taxonomic groups that have a true carnassial on the last tooth (Feliformia, Hyaenodonta, and Oxyaenodonta) or have three molars that include at least one true carnassial (Caniformia and Hyaenodonta). These three groups occupied distinct areas of morphospace on the first PCs (Fig. 5). It could be interpreted that hypercarnivory may have many-to-one mapping for these specific groups. However, the lack of significant between-group differences in carnassial stress between ecological groups should be noted with this interpretation, and additional analyses among these groups may be necessary.
Another aspect to note is that, with the large phylogenetic sampling, the mesocarnivores may be a group of generalists that have different shapes among them. Aspects of morphological shape that would be expected to be shared among generalist mesocarnivores would include a rostrocaudally longer and dorsoventrally shallower horizontal ramus in comparison to the length of the mandible (Van Valkenburgh et al. Reference Van Valkenburgh, Wang and Damuth2004; Van Valkenburgh Reference Van Valkenburgh2007; Prevosti et al. Reference Prevosti, Turazzini, Ercoli and Hingst-Zaher2012; Echarri et al. Reference Echarri, Ercoli, Chemisquy, Turazzini and Prevosti2017); this feature could also be a feature of small prey specialist hypercarnivores (Mitchell et al. Reference Mitchell, Sherratt and Weisbecker2024; Sansalone et al. Reference Sansalone, Wroe, Coates, Attard and Fruciano2024). However, it should also be noted that mesocarnivores may have variation between one another in the portion of their diet that is non-vertebrate material (i.e., one mesocarnivore might supplement that diet with more invertebrate material, while another mesocarnivore supplements it with more fruit or seeds) and have different morphological adaptations accordingly. It could be possible to look at the heterogeneity of mesocarnivores further with a larger sample of mesocarnivores with known differences in the non-vertebrate portion of their respective diets.
Conclusion
We tested a hypothesis of parallelism and many-to-one mapping of form to function in carnivore jaws and predicted that species that are ecologically similar will have similar patterns of stress and strain on the mandible even if they plot separately on mandibular morphospace. Our analyses showed that even though the form of the mandible is phylogenetically varied for any given dietary group, there is indeed convergence in biomechanical function as measured by stress and strain for bone-cracking specialists and certain groups of hypercarnivores such as Feliformia, Hyaenodonta, Oxyaenodonta, and sometimes Caniformia. We found that even though mandibular shape tended to be distinctive in the more derived ecological groups and that there was some degree of evolutionary convergence on those forms and functions, the shape groupings tended to be more taxonomic than ecological. Hypercarnivores and bone-crackers tend to plot in far spaces of morphospace based on the first two principal components. The dietary groups tend to reach certain areas in the morphospace for the first three PCs, but there are some phylogenetic distinctions within groups observed, such as “Creodonta” clustering together in a small part of the mesocarnivore cluster, but carnivorans being widely dispersed. It should be noted that mesocarnivores occupying the center of the first PC is not indicative that they are similar to the overall mean shape of the mandibles. The large morphospace occupation of hypercarnivores and bone-crackers may be indicative of different shapes in mandibles that can be effective at occupying a highly carnivorous ecologic niche. This is partially supported by the convergence testing of stress in bone-crackers and certain hypercarnivore groups. Additionally, generally early taxa categorized as mesocarnivorous tend to have higher stress on the mandible than later hypercarnivorous taxa in their respective lineages.
Nevertheless, there are still some common biomechanical traits that influence mandibular shape for certain niches, such as a trend of shortening of the mandible and increase in jaw muscle areas such as the ascending ramus in the evolution toward hypercarnivory. Biomechanical factors that are better at explaining mandibular shape are those that use the ascending ramus as a part of its metric, such as mechanical advantage and stress and strain on the mandible. Typically, a higher mechanical advantage and lower stress on the mandible are indicative of a mandibular shape that is typical of a hypercarnivorous diet and that can both transmit the force from the closing jaws more effectively and better resist those forces. Additionally, biomechanical factors that involve the canine have greater explanatory power due to the variability in that area for capturing and subduing prey.
Acknowledgments
The authors would like to acknowledge the various curators and museum workers who helped make data collection possible during the COVID-19 pandemic.
Competing Interests
The authors of this paper have no competing interests.
Data Availability Statement
Supplementary Fig. S1, Tables S1 and S2, and the therian mandible code are available on Dryad at https://doi.org/10.5061/dryad.d7wm37qd7 and Zenodo at https://doi.org/10.5281/zenodo.15882751.
Funding Statement
Funding sources include the Indiana University Earth and Atmospheric Sciences Galloway/Perry/Horowitz Fellowship and the AmeriCorps Education Award.


 Open access