


An important reason for many consumers to buy organic products is the assumption that these are healthier than conventionally produced products. However, until now, limited research has been performed to study the effect of organic food on health. Most studies on organic food are dealing with differences in nutrient content of organic v. conventional products. Organic food is defined as originating from certified ‘organic’ production according to International Federation of Organic Agriculture Movements standards(1), which exclude the use of synthetic inputs such as synthetic fertilisers and crop protectives, as well as of GM seeds, synthetic additives and irradiation.
Several recent literature reviews have concluded that there are on average higher levels of nutritionally desirable compounds like vitamin C, antioxidants, polyphenols and DM. Conventional grains contain on average higher levels of proteins. Furthermore, equal or lower levels of undesirable compounds like pesticides, nitrates and mycotoxins are found in organic products(Reference Hoogenboom, Bokhorst and Northolt2–Reference Woese, Lange and Boess7). The variation in nutritional content of organic products is large, and differences over years within one production system may be larger than differences between production systems(Reference Chassy, Bui and Renoud8, Reference Jørgensen, Brandt and Lauridsen9). Though differences in nutritional content may exist, results from such studies can only speculatively be connected to health effects. Little is known about factual effects of organic food on physiological processes in consumers.
Based on conclusions of an expert meeting of the Organic Food Quality and Health Association(Reference Huber10), potential effects of organic feed were hypothesised to be found in the immune system of young organisms. It is known that via the gut, food might influence the immune system in the developing organisms(Reference Noverr and Huffnagle11–Reference Scrimshaw and SanGiovanni13). However, a broader exploration of effects, besides immune parameters, was considered to be valuable. Subsequently, a study in rats(Reference Finamore, Britti and Roselli14) showed a higher proliferative response of lymphocytes in vulnerable, malnourished animals fed organic wheat, than in those fed conventionally produced wheat. Another rat study(Reference Lauridsen, Yong and Halekoh15) compared three isoenergetic and isonutritious feeds from products derived from either low fertiliser input without pesticides (described as organic), low fertiliser input plus pesticides or high fertiliser input with pesticides (described as ‘conventional’), and found a higher serum IgG concentration and less adipose tissue in animals fed with the low fertiliser input, both with and without pesticides. Furthermore, the rats fed the organic diet had a higher day time activity compared to animals on the other two diets. Plasma concentrations of oleic and linoleic acids, and γ- and α-tocopherol differed between organic and conventional diets, despite similar fatty acid and vitamin E content in the feeds.
These first studies indicate that differences in health parameters may occur as a result of the consumption of feed from different cultivation systems. Before intervention studies can be performed in human subjects, these potential health effects need to be explored further and good biomarkers of health need to be defined. The present paper describes the results of a large intervention study to identify biomarkers of the effect of organic feed on health in chickens, focusing on immune responses, innate (humoral: natural antibodies (AB)(Reference Baumgarth, Tung and Herzenberg16) and alternative complement; cellular: monocytes) as well as specific compartment (humoral: vaccine responses and classical complement; cellular: T-cells), growth and metabolism. It was shown that the response of the chicken fed on either organic or conventional feed showed remarkable differences.
Materials and methods
Animals and housing
The study comprised a blinded animal feeding experiment in two generations of chicken fed with feed from either organically or conventionally produced ingredients. National and institutional guidelines for care and use of experimental animals were observed, and the study design was approved by the Animal Welfare Committee of Wageningen University, The Netherlands.
The animals were chickens from the Wageningen Selection Lines, ISA Brown Warren medium heavy layer hens, which were divergently selected during twenty-five generations for either their primary high (H-line) or low (L-line) AB response to sheep red blood cells immunisation at 35 d of age(Reference Kreukniet and Van der Zijpp17, Reference Parmentier and Nieuwland18). These chicken lines differ in almost every aspect of innate and specific humoral and cellular immunity(Reference Parmentier, Lammers and Hoekman19). Next to these selected chicken lines, a randomly bred control group (C-line) of chickens, resembling the original parental stock, was included. A two-generation design was chosen as it was assumed that due to epigenetic mechanisms, the nutritional status of the mother may influence various physiological parameters of the chicks from the next generation(Reference Symonds, Stephenson and Gardner20, Reference Demmelmair, Von Rosen and Koletzko21) Per line (H-, L- and C-lines) chickens of the first experimental generation of seventy-two hens were randomly assigned to the organic or conventional feed group. All animals were fed a normal commercially obtained chicken diet till 11 weeks of age. From 11 weeks of age onwards, the animals received identically composed experimental diets, based on either organic or conventional products. Parallel, a group of twenty-two roosters from the same lines were raised with the experimental feeds (three to four per group) to produce the second experimental generation through artificial insemination.
The second generation consisted of 150 chickens, divided in six groups corresponding with the H-, L- and C-lines, all with an organic and conventional feed group, to obtain twenty-five animals per group. The total amount of animals in the second generation was reduced to 145 due to the presence of misclassified rooster chicks. This resulted in the final groups of twenty-two to twenty-five animals per line-feed combination, twenty-six animals being kept when misclassifications became apparent, to obtain an average of twenty-five animals per line-feed combination.
The second generation of the six line-feed combinations received the experimental feeds from hatch till the end of the experiment. Both generations had ad libitum access to feed and water. Fresh water was available through a water pipe with drinking nipples.
The first generation of chickens was housed in individual battery cages to ensure identification of the eggs for the second generation. The second generation was housed in spacious and enriched indoor runs (2·28 m2) in groups of six animals, two of each line, to minimise the risk of feather pecking. According to routine schemes of Wageningen University, temperature was between 16 and 21°C, light exposure was increasing from 8 to16 hours and from 500 to 1900 lux.
Chicken received vaccinations according to commercial schedules(22), though the number of vaccinations was limited as much as possible in order to reduce influencing immune parameters as well as stress. The first generation was vaccinated against Mareks disease, infectious bronchitis, Newcastle disease (NCD), infectious bursal disease, pox diphtheria wing web, infectious laryngotracheitis and myoclonia congenita. The second generation was vaccinated against Mareks disease, infectious bronchitis, NCD, infectious bursal disease and pox diphtheria wing web, and received a dietary anticoccidium (Paracox-8) due to the risk of coccidiosis connected with floor housing.
At 9 weeks of age, all animals of the second generation received an intramuscular injection in the breast muscle with 1 mg of the non-pathogenic, T-cell-dependent protein keyhole limpet haemocyanin (KLH) in 1 ml PBS (pH 7·2) per animal, serving as an immune challenge. The second generation was sacrificed at 94 d (13·3 weeks) of age.
Experimental diets
Feeds were composed of six ingredients: wheat; barley; triticale; peas; maize; soya that were produced either organically or conventionally. Products were obtained according to ‘farmer approach resourcing’ from neighbouring farm pairs of conventional and certified organic farms, preferably known as ‘best practice farms’, with the same basic soil and climatic conditions and preferably the same variety per product. Ingredients were obtained from The Netherlands, Austria and Denmark. Before ingredients were used for feed production, they were prescreened for residues of (apolar) pesticides or mycotoxins. Ingredients contaminated with mycotoxins above the maximum residue limit were omitted for feed production. Pesticides were not detected.
Three feeds, a starter, a grower and a layer feed, were composed for the different development stages of the chicken according to existing standards for organic chicken feed(23) by a feed manufacturer (Kruyt, Gouda, The Netherlands). Ingredients were stored at this firm, in dry and dark conditions, at a temperature of 10–17°C. An exception was the soya that was stored in Wageningen, where it was toasted before further processing, in order to inactivate the antinutritional factors. Every 6 weeks, a fresh badge of feed was produced.
In the different feeds, the ingredients wheat, barley, triticale, peas, maize and soya were represented in different proportions (Table 1). To prevent shortages in the nutritional needs, the feed was supplemented with potato protein, the amino acid methionine, chalk, grid, salt, NaCO3 and a commercial mix of vitamins and minerals. After manufacturing, feed samples were tested on protein composition, in order to prevent shortages of essential amino acids. If a shortage existed, an amino acid was supplemented up to the minimal required level. Other existing differences, either in nutrient content or bacterial load, were accepted as they were considered to reflect reality. The feed was presented to the animals as a composite flour. Feeds were coded either A or B. During the whole project, samples were kept coded so that all persons involved in the study, both in the analyses of feeds and in the feeding experiment, were unaware with respect to the origin of the samples. To avoid any bias, the samples were only deblinded after all results of the analyses of the ingredients and the feeds as well as the animals were available, interpreted, agreed upon and described in a draft report.
Feed composition per age group*
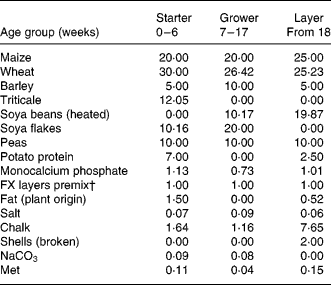
* Numbers reflect the percentage of the ingredient in the total feed. The first generation consumed grower and layer feeds, the second generation consumed starter and grower feeds.
† FARMIX (Trouw Company, The Netherlands).
The organically cultivated feed will further be described as ‘organic feed’ and the animals as ‘organic animals’ or ‘organic group’; the conventionally cultivated feed will be described as ‘conventional feed’ and the animals as ‘conventional animals’ or ‘conventional group’.
Chemical and microbial analyses of the feeds
The feeds and feed ingredients were analysed for macro- and micronutrients, i.e. vitamins and trace elements/heavy metals/minerals, bacterial content and endotoxins. All analyses were performed according to standard operating procedures at TNO Quality of Life. Analyses were performed before the feed was supplemented with amino acids (see paragraph on the experimental diets), except for two feeds, where for logistic reasons this was not possible before supplementing.
Ash content. Samples, after preheating, were heated at high temperature. The residue was weighed.
Total carbohydrates. Samples were rendered soluble in boiling water. Amylum was converted to soluble carbohydrates. The carbohydrates were hydrolysed to monosaccharides and subsequently analysed by the Luff–Schoorl method(Reference Schoorl24).
Raw fibre. Samples were boiled in acid and diluted in alkaline solution. Remaining solid substances were incinerated.
Crude fibre. Samples were hydrolysed with HCl and subsequently extracted with petroleum diethyl ether. The extract was evaporated and the residue was weighed.
Moisture. Samples were dried and weighed before and after drying.
Protein. The protein content was determined by the Kjeldahl method. Samples were destructed converting organic nitrogen to ammonium. Ammonium was converted to ammonia. Protein content was calculated from the nitrogen amount.
Fatty acids. Fat was saponified and subsequently transformed to fatty acid methyl esters using methanol and BF3 (alkaline conditions; NEN-EN-ISO 5509:2000, NEN-EN-ISO 5508:1995). The fatty acid methyl esters were analysed by GC with flame ionisation detector. Quantification was carried out using external calibration of reference compounds.
Amino acids. All proteins in the samples were hydrolysed by boiling in HCl. The resulting amino acids were subsequently separated by ion chromatography, derivatised post-column and quantified using an amino acid analyser(Reference Schram, Dustin and Moore25). For tryptophan, the hydrolysis was carried out with barium hydroxide. Analysis was performed with HPLC with fluorescence detection(Reference Slump and Schreuder26).
Chloride. Samples were extracted with water and diluted in HNO3. The amount of chloride (Cl) was determined potentiometrically.
Vitamin E (α-, β-, γ- and δ-tocopherol). After saponification of the sample, tocopherols were extracted and analysed by HPLC with fluorescence detection(Reference Fragner27).
Total folate. Sample extracts were added to culture medium. From the growth of bacteria, the total folate concentration was determined(Reference Williams28).
Trace elements, heavy metals and minerals (cadmium, chromium, iodine, iron, lead, manganese, selenium and arsenic).
Samples were destructed by HNO3 digestion or incineration. The resulting solutions were analysed either by inductively coupled plasma atomic emission spectrometry (NPR 6425:1995) or inductively coupled plasma MS (EPA method 6020). All experiments were carried out in duplicate. If the duplicate analysis showed a difference larger than 10 %, the analysis was repeated. The mean values of the duplo were reported.
For all separate ingredients of the feeds: wheat; triticale; barley; peas; maize; soya, the same analyses were performed. Additionally, bioactive compounds were measured (carotenoids, flavonoids, catechins and phytosterols).
Microbial diversity as well as endotoxins were analysed on ingredients and feed. Enterobacteriaceae were measured on a violet red bile glucose agar, incubation at 37°C for 24 h. Moulds were analysed on oxytetracycline gist glucose agar at 25°C for 5 d. Endotoxin in the extracts was measured with the kinetic Limulus amebocyte lysate test kit (Bio-Whittaker/Cambrex; Kinetic-QCL; LAL lot no. 3L433E).
In vivo measurements on the animals
General health parameters
Fig. 1 presents the time line of the observations and measurements relative to the feeding and age of the first and second generation of animals. The animals were seen by the caretaker daily and abnormalities were registered. Weight and feed intake were measured weekly, onset, and amount of egg production in the first generation was registered.
Time frame of first and second generation chickens with vaccinations ( ), original feed (OF), feed changes (F) and blood sampling (B).

A routine blood check was performed at 6 weeks of ten chickens on Avian Influenza, Mycoplasma synoviae, Mycoplasma gallisepticum and Salmonella spp. No infections were observed.
According to the schedule in Fig. 1, blood was sampled at five time points in the first generation as well as in the second generation. Moments were chosen before and after ‘life events’ of the animals, being in the first generation the change from commercial towards experimental feed at 11 weeks of age, and in the second generation the KLH challenge at 9 weeks of age. Serum and plasma from heparinised blood were collected and stored at − 20°C until further analysis. The second generation was seen at 10 weeks of age by a poultry veterinarian to evaluate general health and feather development.
At 13·3 weeks of age (94 d), life of the animals of the second generation was terminated by cervical dislocation. The animals were weighed after which they were dissected. The body was inspected for abnormalities, and the complete gastrointestinal tract from distal oesophagus till cloaca, including the omentum, liver and gall bladder, spleen and bursa, was taken out and separated. The liver was separated from the gall bladder, weighed, divided and part was prepared for metabolomics in liquid nitrogen, and part for histological analysis in 10 % formalin.
The spleen was divided and prepared for histological analysis and biobanking. The gastrointestinal tract, without liver, gall bladder and spleen, was weighed after the stomachs had been emptied. For practical reasons, the rest of the gut was left filled as it was. The two stomachs, ventriculus and proventriculus, and the bursa were taken off and prepared for histological analysis. From the gastrointestinal tract, samples were prepared of duodenum, jejunum and caecum for genomics, as well as for histological analysis. Thymus, heart, lungs, kidneys, pancreas, ovaries and some bones were prepared for histological analysis. Tissues not used in the first round of analyses were biobanked for either histology or genomics. From thirty-six animals, brains were taken out and prepared in hapten for biobanking. The rest of the tissue was discarded.
Immunological parameters
Immunological parameters consisted of cellular and humoral components of both innate and specific immunity. In the first generation, cellular parameters were analysed at weeks − 2, 1, 4 and 8 in relation to the feed change; humoral parameters were analysed at weeks − 2, 1, 4, 8 and 22. In the second generation, cellular parameters were analysed at weeks − 1, 1 and 4 in relation to the KLH challenge; humoral parameters were analysed at weeks − 1, 1, 2, 3, 4.
To determine effects of different feeds on responsiveness in blood monocytes, monocyte activity was measured in a NO assay. Mononuclear cells were isolated from heparinised blood using a histopaque density gradient. In brief, triplicate cultures with 106 cells per well were incubated in ninety-six-well flat-bottom plates for 72 h at 4°C with 5 % CO2 with or without ( = control) lipopolysaccharide (LPS) in 200 μl Roswell Park Memorial Institute medium. After incubation, 50 μl culture medium was mixed for 10 min at room temperature with 50 μl Griess reagents in a ninety-six-well flat-bottom plate. Extinctions were measured at 540 nm. Monocyte reactivity was calculated using a nitrite calibration and expressed as μm NO production. Levels of natural AB binding LPS or lipoteichoic acid, or specific AB to KLH and vaccines in plasma from all birds at several moments were measured by indirect ELISA as described by Ploegaert et al. (Reference Ploegaert, De Vries Reilingh and Nieuwland29). Levels of both classical and alternative complement activity in all birds at several moments were determined as described previously(Reference Parmentier, Baelmans and Savelkoul30).
To determine the effects of different feeds on specific cellular reactivity in situ, a lymphocyte stimulation test was used with concanavalin A for T-cell and LPS for B-cell stimulation according to earlier described methods(Reference Parmentier, Siemonsma and Nieuwland31). Additionally, lymphocyte proliferation in reaction to feed extracts was measured in vitro by lymphocyte stimulation test.
Metabolomics analyses
Metabolomics analyses were performed on plasma obtained before and after the KLH challenge at weeks − 1, 1 and 3 and on liver tissue after dissection (week 4). All animals of both C-groups and of a limited number (six) of both H- and L-line groups were analysed by TNO Quality of Life.
The plasma and liver samples were analysed by different analytical methods covering a wide range of classes of metabolites:
GC–MS
Plasma (100 μl) or liver (10 mg) samples were, respectively, deproteinised and extracted with methanol and subsequently derivatised, i.e. oximation and silylation. The derivatised samples are analysed by GC–MS. Classes of metabolites that can be analysed with this method are amino acids, mono- and disaccharides, organic acids, amines, alcohols etc. For more details, see Koek et al. (Reference Koek, Muilwijk and Van der Werf32).
Lipid liquid chromatography–MS
Plasma (10 μl) and liver (5 mg) samples were extracted with isopropanol. After centrifugation, the supernatant was analysed by reversed-phase liquid chromatography–MS (LC–MS) using a water–MeOH gradient and electrospray ionisation in the positive mode. With this method, various classes of lipids can be analysed, e.g. diglycerides, TAG, cholesteryl esters, phosphatidylcholines, lysophosphatidylcholines (LPC) and sphingomyelins. For more details, see Verhoeckx et al. (Reference Verhoeckx, Bijlsma and Jespersen33).
Bile acids/NEFA liquid chromatography–MS
Plasma (50 μl) and liver (5 mg) samples were extracted with methanol. The resulting extract was analysed by reversed-phase LC–MS using a water–MeOH gradient, C18 column and electrospray ionisation in the negative mode. With this method, NEFA and bile acids can be analysed as well as several unknown metabolites. For more details, see Bobeldijk et al. (Reference Bobeldijk, Hekman and De Vries-van der Weij34).
Samples were analysed using standardised protocols, including randomisation, internal standards and quality control samples. Data preprocessing was carried out by composing target lists for all platforms based on retention time and mass-to-charge ratio (m/z), and the peaks of all components were integrated. All peak areas were subsequently normalised using internal standards. These target lists were used for further statistical analysis.
Genomics analyses
Gene expression was analysed in jejuni samples obtained after dissection, using whole genome chicken cDNA arrays. All animals of both C-groups and a limited number (six) of both H- and L-line groups were analysed by Wageningen UR – Central Veterinary Institute, as described by Van Hemert et al. (Reference Van Hemert, Hoekman and Smits35).
A post-mortem evaluation was performed by pathologists of RIKILT on all the animals of both C-groups and on a limited number (six) of both H- and L-line groups. After fixation, the tissues were routinely processed and embedded in paraffin wax. The thymus and bursa were weighed and all gross pathological alterations were described during processing of the tissues. Sections of 4 μm were cut on a microtome (Leica RM 2165) once for each formalin-fixed tissue specimen and dried overnight in a stove at 35°C. The sections were stained with Mayer's haematoxylin and eosin. For staining T-lymphocytes in the intestines, an immunohistochemical method with anti-CD8 (Rabbit polyclonal AB, Lab Vision Immunologica, Duiven, The Netherlands) was used. Moreover, for apoptosis, sections were stained using ApopTag peroxidase in situ apoptosis detection kit (MP Biomedicals, Amsterdam, The Netherlands). Immunohistochemical staining was performed with an automatic immunostainer (Ventana Benchmark, Ventana Medical Systems, Illkirch Cedex, France). The sections of the duodenum and jejunum were scored for the villus length/crypt length ratio by measuring the length of three villi and three crypts per section from which the mean value was calculated. Measurements were performed using Leica Quips image analysing system (Leica Image Systems, Cambridge, UK).
Statistical methods
Univariate statistics were computed for measurements on chickens grouped by organic and conventional feed: mean; standard error of the mean; standard deviation; 95 % CI for the mean, median, minimum and maximum. Mean differences between the two feed groups were tested with ANOVA(Reference Dunn and Clark36), two-sample t test with pooled variance(Reference Kreyszig37) and Wilcoxon rank sum test for equal medians(Reference Hollander and Wolfe38).
Metabolomics data were analysed with principal component analysis to explore the structure of the variables(Reference Krzanowski39) and their relation with the chicken lines and feed. In metabolomics data, the number of variables was reduced. The best twenty variables enabling to discriminate between the organic and conventional feed groups were selected for each platform using cross-validated linear discriminant analysis(Reference Fisher40) on all available time points per variable. The mutual relationships between the predictive variables were explored with principal component analysis on standard normalised variables (z-scores). To facilitate interpretation with respect to the influence of the two feeds, partial least squares discriminant analysis(Reference Barker and Rayens41, Reference Wold, Jöreskog and Wold42) was applied (results not shown here). Results are considered significant at a P < 0·05 level. All data analysis was performed with Matlab software (version 7.3.0 R2006b, The Mathworks, Natick, MA, USA).
Results
Diets
Results of analyses of the feeds are presented in Table 2.
Analyses of the starter, grower and layer feeds of conventional and organic origin of the first and second generations

Conv., conventional; Org., organic.
* Analyses were performed after the feed was supplemented with some essential amino acids up to the required level.
† ≥ 10 % higher than the conventional or organic feed.
‡ ≥ 20 % higher than the conventional or organic feed.
Comparison of the nutritional content of the organic and conventional feeds showed most consistent differences in the amount of proteins and several amino acids, which was about 10 % higher in the conventional feed. This was due to higher levels of proteins in conventional wheat, soya and barley (results not shown). Some differences in fat and carbohydrate content between the conventionally and organically produced feeds were found, though differences were lower than 10 %. The only exception was the fat content in the grower feed of the second generation, being fed in the period of the KLH challenge, which was 15 % higher in the organic feed, with higher levels of the unsaturated C18 fatty acids. Differences in fat content of the feeds were especially due to the higher amount of fats in organically produced soya. The two feeds were energetically approximately equal as shown by the values for metabolisable energy, while the lower content of protein in the organic feed was energetically compensated by the other macronutrients. Further several, not always consistent, micronutrial differences were observed (Table 2).
Lower levels of LPS endotoxins were found in organic than in conventional starter feeds (11·5 v. 13·9 endotoxin unit/mg) and grower feeds (14·5 v. 19·0 endotoxin unit/mg) of the second generation. The counts of gram-negative bacteria, however, were found to be higher in organic ingredients of all feeds, although in varying amounts. Within the starter, grower or layer feed groups, the difference in Enterobacteriaceae levels between the organic and conventional production varied a factor 1·2–10. The largest difference was found in the first batch of first generation layer feed (5·3 × 104v. 5·3 × 103 colony-forming unit/g). In the second generation, the observed levels in the organic v. conventional feeds were 2·7 × 104v. 1·4 × 104 colony-forming unit/g in the starter feed and 9·5 × 103v. 1·8 × 103 in the grower feed.
Observations on the animals
General health parameters
First generation
Body weight and growth rate did not differ significantly between the feed groups; the H-line showing the lowest; C-line in between; the L-line the highest average body weight.
Table 3 displays the weights of the animals of the first generation at 13 weeks of age, which is the age at which the animals of the second generation were sacrificed, as well as the weights at 31 weeks of the first generation, when eggs were gathered for brooding.
(Mean values and standard deviations)
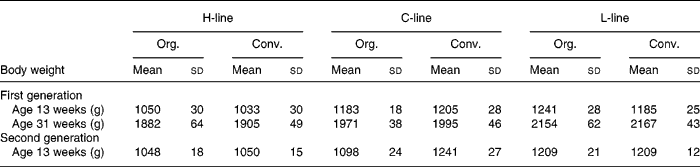
Org., organic; Conv., conventional.
Feed intake did not differ between lines in the first generation. Onset of egg laying was slightly earlier among the C-line animals than in the H- and L-lines; the animals on the organic feed started egg laying slightly, but not significantly, earlier. Number, weight and quality of the eggs did not differ significantly between the feed groups.
Second generation
All animals of the second generation were diagnosed as being perfectly healthy at 10 weeks by a poultry veterinarian. Feather development was slightly faster in the conventional group, but the difference could not be objectified by feather length measurements.
Feed intake of the second generation is shown in Fig. 2. In the second generation, feed intake was measured per run, each run housing a group of six animals, with two animals of each of the three lines. Accordingly, feed intake could not be discriminated between lines.
Feed intake per week. Second generation high, control and low chicken lines together. (●), Organic feed; (○), conventional feed. K, keyhole limpet haemocyanin challenge. Values are means (n 13 runs of six animals) with standard errors of the mean represented by vertical bars; significant differences are indicated by stars (P < 0·05).
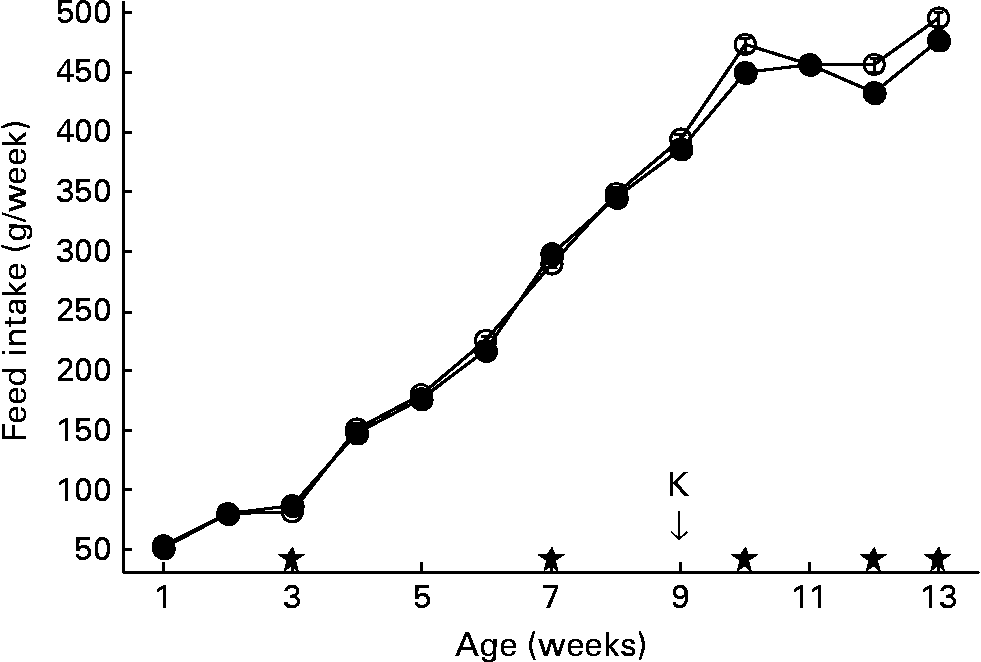
At week 7, the feed was changed from starter to grower feed. After the change to grower feed, intake of the conventional feed started to increase, being significantly higher than the intake of organic feed in weeks 10, 12 and 13. After 13 weeks, animals fed conventional feed cumulatively consumed about 80 g more feed compared to animals on organic feed (3686 g v. 3607 g).
Body weight of the second generation of all lines is shown in Fig. 3. A difference in body weight, related to the diet treatments appeared, the body weight of the C-line animals on conventional feed being significantly higher than the body weight of the animals on organic feed, and the difference increasing during lifespan. Table 3 shows the weights of the animals of the second generation at 13 weeks, in comparison to the first generation. At 13 weeks, the conventional C-line animals weighed significantly more than the organic C-line animals, the difference being larger than in the first generation. In the H- and L-lines, hardly any diet effects on body weight were found. H-line animals on organic feed were significantly heavier only in the first week. L-line animals on the conventional feed were heavier during the first 3 weeks, after that there was no significant difference (Fig. 3).
Body weight. Second generation high, control and low chicken lines. (●), Organic feed; (○), conventional feed. K, keyhole limpet haemocyanin challenge. Values are means (n 22–26) with standard errors of the mean represented by vertical bars; significant differences are indicated by stars (P < 0·05).

Growth rate of the second generation of all three lines is shown in Fig. 4. After the challenge, growth rates differed significantly between the diet treatments in all lines. The animals of the C-line on conventional feed were significantly ahead compared to the animals on organic feed till week 8. After the challenge, which took place in week 9, growth started to decline in week 10 in both feed groups for a period of 2 weeks, which was significantly stronger in the organic group than in the conventional group in week 12. From week 12 onwards, the growth of the organic animals showed an acceleration and overtook significantly the growth rate of the conventional animals, till life termination at week 13·3.
Growth rate of body weight. Second generation high, control and low chicken lines. (●), Organic feed; (○), conventional feed. K, keyhole limpet haemocyanin challenge. Values are means (n 22–26) with standard errors of the mean represented by vertical bars; significant differences are indicated by stars (P < 0·05).

Growth of H- and L-line animals was similar between the feed groups till week 12, also in the decline of growth after the challenge. In week 13, both the H- and L-line animals on organic feed showed a stronger ‘catch-up growth’, leaving the animals on conventional feed behind.
Immune parameters
Clear differences were observed between the different line-feed groups, which were related to the different chicken lines, the different feeds and the changes in feed.
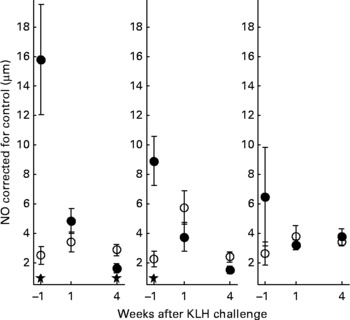
With regard to the first generation, it is worth mentioning that production of AB levels to the NCD vaccine, representing the specific component of the immune system, was significantly increased in animals on organic feed of the L-line, up to a level comparable of the H-line birds (Fig. 5). In the second generation, titres of natural AB binding to LPS, representing an innate component of the immune system, showed a strong rise in the weeks following the KLH challenge in all groups of animals. It was regardless of the type of feed highest in the H-line, followed by the C-line and lowest in the L-line (Fig. 6). The C-line showed a differential response wherein the animals on organic feed showed the highest response at 2 weeks after the challenge followed by a gradual decrease, while the animals on conventional feed showed a response that was still increasing at week 4. The (control corrected) LPS-stimulated monocyte reactivity, representing a cellular component of the innate immune system, was significantly higher in the organic animals of the H- and C-lines 1 week before the challenge, which was 1 week after the change from starter to grower feed (Fig. 7).
Newcastle disease-specific antibody titres. First generation high control and low chicken lines. (●), Organic feed; (○), conventional feed. Values are means (n 11–13) with standard errors of the mean represented by vertical bars; significant differences are indicated by stars (P < 0·05).

Lipopolysaccharide binding natural antibodies. Second generation high control and low chicken lines. (●), Organic feed; (○), conventional feed. KLH, keyhole limpet haemocyanin. Values are means (n 21–26) with standard errors of the mean represented by vertical bars; significant differences are indicated by stars (P < 0·05).
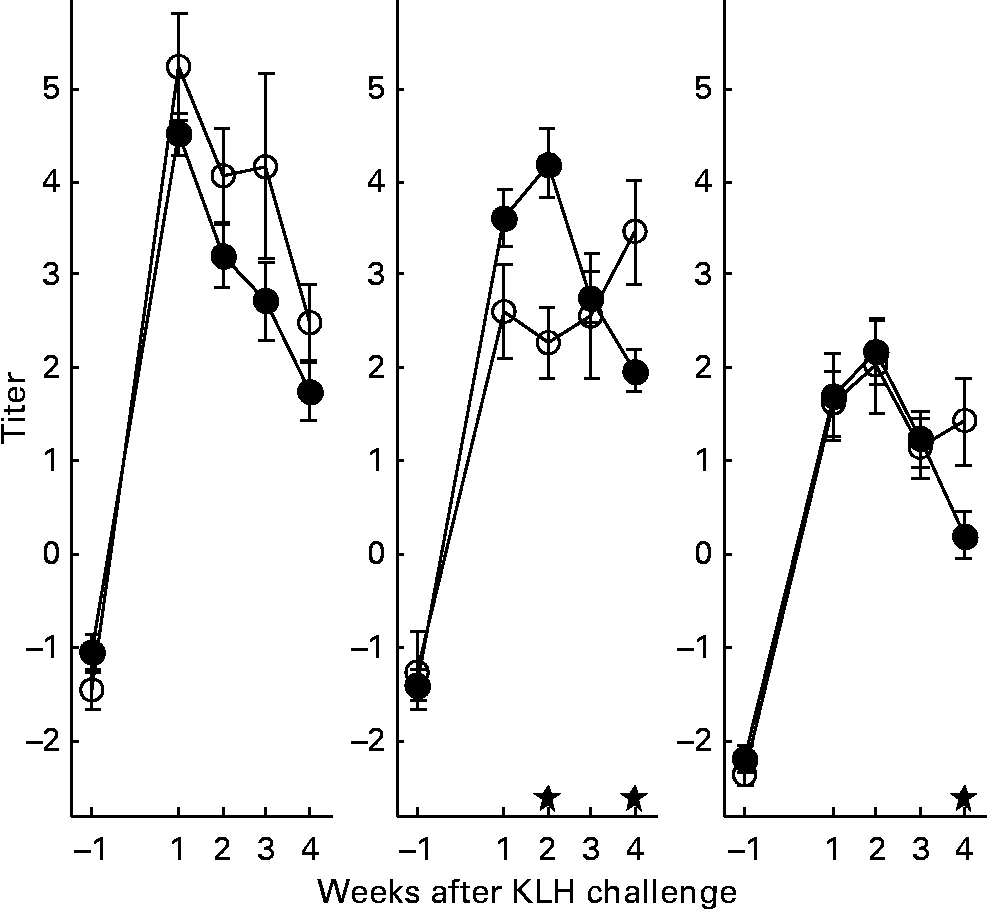
Control-corrected lipopolysaccharide-stimulated NO production in monocytes. Second generation high, control and low chicken lines. (●), Organic feed; (○), conventional feed. KLH, keyhole limpet haemocyanin. Values are means (n 16–26) with standard errors of the mean represented by vertical bars; significant differences are indicated by stars (P < 0·05).
The KLH-specific AB titres, reflecting the specific immune system, showed a strong rise in all lines after the KLH challenge, but did not show differences between the feed groups (data not shown). However, the AB levels on the NCD vaccine showed an effect of the KLH challenge by an increase in titres, divergent in height for the different lines (Fig. 8). The response of the animals on the organic feed showed a peak, stronger than that of the animals on conventional feed, at week 2 (H- and L-lines) or 3 (C-line), followed by a decrease. The reactivity of the classical complement system was significantly stronger in all organic animals at 1 week after the challenge (Fig. 9). In the lymphocyte stimulation test in whole blood, representing the cellular component of the specific immune system, the B-lymphocyte response was significantly higher, and the T-lymphocyte response was higher but NS, of the organic animals in the week after the KLH challenge (data not shown). In the lymphocyte stimulation assay ex vivo, addition of feed extracts of the organic and conventional feeds to Con A stimulated whole blood cell cultures at 3 weeks after the challenge did result in significantly more proliferation of T-cells of animals on the organic feed compared to animals on the conventional feed (data not shown).
Newcastle disease-specific antibody titres in serum. Second generation high, control and low chicken lines. (●), Organic feed; (○), conventional feed. KLH, keyhole limpet haemocyanin. Values are means (n 21–26) with standard errors of the mean represented by vertical bars; significant differences are indicated by stars (P < 0·05).

CH50 activity of serum after classical complement activation. Second generation high, control and low chicken lines. (●), Organic feed; (○), conventional feed; CH50, haemolytic complement (units per ml), the dilution of serum required to lyse 50% of the erythrocytes in the assay; KLH, keyhole limpet haemocyanin. Values are means (n 22–26) with standard errors of the mean represented by vertical bars; significant differences are indicated by stars (P < 0·05).

Metabolomics
Plasma
All three analytical platforms showed significant differences in metabolite concentrations between the organic and conventional groups, whereas only the GC–MS method allowed for a clear separation of the animals according to their genetic background. The lipid LC–MS method showed the most strong treatment differences in the discriminant analysis (Fig. 10). A general pattern could be observed for the plasma lipids, where the organic group showed significant lower lipid concentrations compared to the conventional group 1 week before the challenge, whereas higher concentrations at the time points after the challenge (weeks 1 and 3). Notably, seven out of eleven plasma LPC measured were identified as highly discriminating metabolites between treatments. The LPC with the largest differences between the feed groups were LPC18 : 0 and LPC16 : 0. Their response pattern was comparable in the different chicken line-feed groups: LPC in the organic group had highest concentrations after the challenge, whereas LPC levels in the conventional group decreased after the challenge. Other compounds that strongly discriminated between the two treatments were phosphatidylcholines and cholesterol esters. The general pattern of response was identical to the pattern observed for the LPC.
Second generation C-line. Plasma lipid liquid chromatography–MS discriminant weights of discriminant function. Discriminant analysis for treatment on lipid platform (n 42). LPC, lysophosphatidylcholine; ChE, cholesteryl ester; PC, phosphatidylcholine; SPM, sphingo myelin. The ░ bars show the discriminant weights on time point − 1, the ■ bars on time point +1 and the □ bars on time point +3. On the right hand side, the cross-validated rate of correct classification is shown for each metabolite.

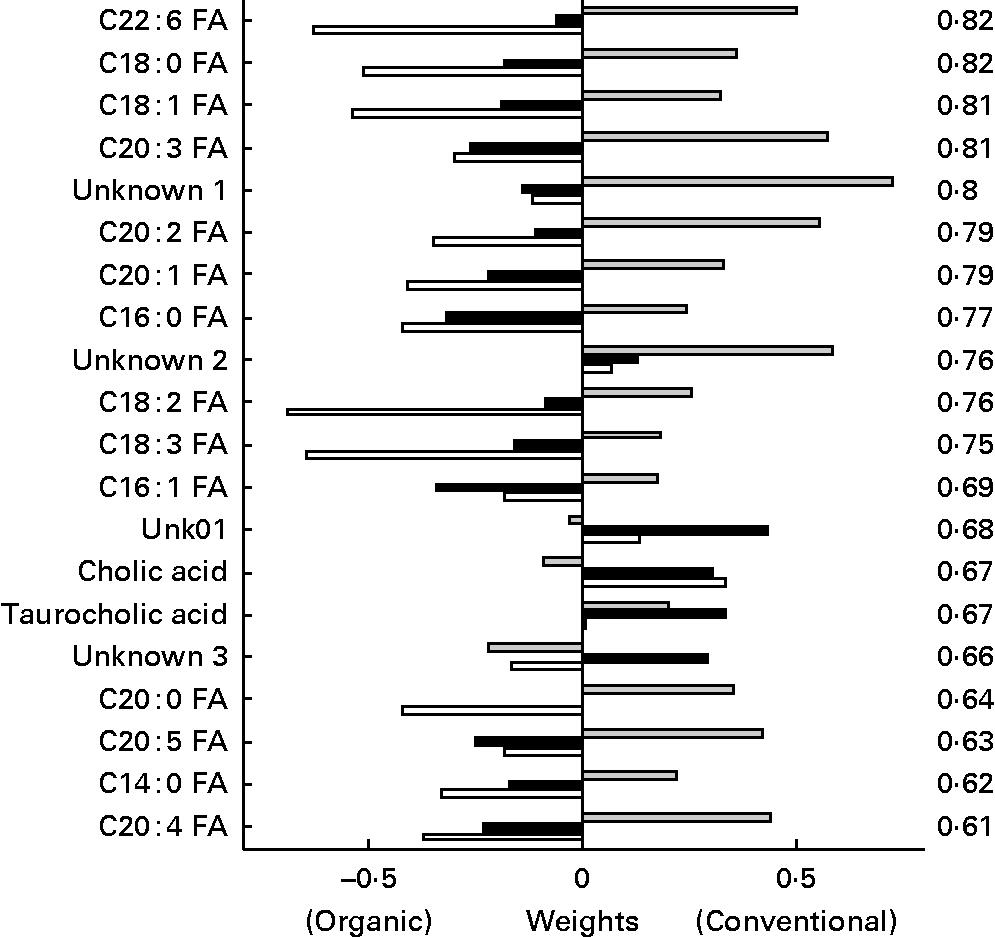
In the discriminant analysis of the bile acids/NEFA LC method (Fig. 11), a general pattern could be observed for the plasma NEFA. In general, NEFA showed similar concentrations in the two feed groups 1 week before the challenge, but were significant higher in the organic group compared to the conventional group in the weeks after the challenge with highest levels at t = 1. The NEFA C22 : 6, C18 : 0, C18 : 1 and C20 : 3 were found as most discriminating between the organic and conventional chicken lines. Only two bile acids (taurocholic and cholic acids) out of fifteen measured were found among the top twenty discriminating metabolites, having a lower discriminating power than most NEFA.
Second generation control line chickens. Plasma bile acid/NEFA discriminant weights of discriminant function. Discriminant analysis for treatment on lipid platform (n 41). The ░ bars show the discriminant weights on time point − 1, the ■ bars on time point +1 and the □ bars on time point +3. On the right hand side, the cross-validated rate of correct classification is shown for each metabolite. FA, fatty acid.
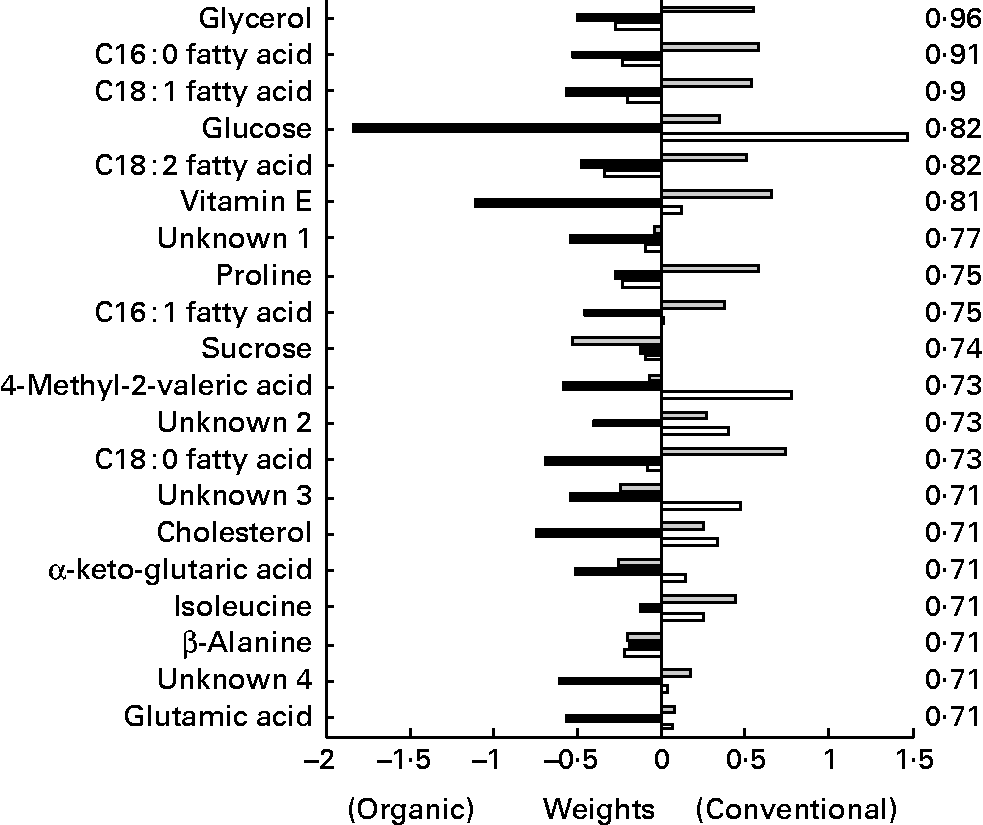
The metabolites from the GC–MS method (Fig. 12) allowed a relatively clear separation between the different chicken lines, as well as according to their treatment. Upon closer inspection of the partial least squares models, the metabolites lysine, glycerol and α-ketoglutaric acid were most related to line differences, while glycerol and the NEFA C16 : 1, C18 : 1 and C18 : 2 were most related to treatment differences. Glycerol and the NEFA of the organically fed animals had significant higher concentrations at the time points after the challenge compared to the conventional animals.
Second generation C-line. Plasma GC–MS discriminant weights of discriminant function. Discriminant analysis for treatment on lipid platform (n 42). The ░ bars show the discriminant weights on time point − 1, the ■ bars on time point +1 and the □ bars on time point +3. On the right hand side, the cross-validated rate of correct classification is shown for each metabolite.
Liver
Only metabolites analysed with the GC–MS platform showed significant concentration differences between the treatments in liver samples. None of the metabolites analysed with the three metabolic platforms allowed for a significant discrimination between the genetic backgrounds of the animals. Liver samples from the organic animals had higher concentrations of glyceric acid, alanine, monomethyl phosphate and the sugars ribose, ribulose and fructose compared to the conventional animals. Furthermore, the amino acids alanine and methionine, vitamin E and α-ketoglutaric acid were increased in livers of the organic animals.
Genomics
After analysis, thirty genes were found to be differentially regulated between the two feed groups, independent of their genetic background. Out of these thirty genes, seven were involved in cholesterol biosynthesis. Genes involved in cholesterol biosynthesis were upregulated in jejuni from the organically fed animals. Other genes found to be regulated were involved in immunological processes, like B–G protein (part of chicken myosin heavy chain), chemokine ah221, and the immunoglobulin heavy chain. Microarray data were confirmed using qPCR analysis(Reference De Greeff, Huber and Van de Vijver43).
Post-mortem results
The veterinarian dissecting the animals did not perceive abnormalities, but observed some more fat tissue in the animals on conventional feed. In general, the histological observations showed a variation that normally can be expected in the animals. In the C-line animals, the relative weight of the bursa was significantly higher in the animals on organic feed. In the H-line, the relative gastrointestinal weight was higher in the organic animals. Some animals on the conventional feed showed fat deposits in the submucosa of the caecum.
Discussion
The present study investigated effects of two identically composed feeds from different agricultural production systems, using a chicken model for future studies in human subjects. It focused on differences caused by feeds, whereas all other factors that normally differ between organic and conventional husbandry systems such as housing, space per animal, temperature changes through outdoor allowance, etc. were kept the same. The present study showed differences in body weight, growth rate, immune, physiological, metabolic and gene regulation parameters.
The present study is the first largest study in animals investigating the effect of feeds from different agricultural systems, using animals from different immunological lines. The study contributes to the discussion on the effect of organic food on health, because of its large number of animals (n 150) and the use of three selection lines over two generations.
In the present study, the choice was made to collect ingredients from neighbouring organic and conventional farms. Both organic and conventional farming systems have their varieties suitable for their specific agricultural systems, so we accepted such difference in varieties. This was the case for wheat, barley and triticale. Some authors argue that comparisons between organic and conventional products should be solely performed with products from controlled field trials, using the same varieties(Reference Harker44). However, such trials never represent the complete agricultural system and it can be disputed how representative the use of the same varieties is. Other authors describe the need of different varieties, specifically adapted with their root systems to the different fertilisation practices in either organic or conventional agricultural systems(Reference Lorenza and Bernardo45–Reference Lammerts van Bueren, Struik and Jacobsen49). We considered choosing ‘best practice farm pairs’, representing the full systems, the best alternative.
It is well known that within organic produce, there is, like in conventional produce, a large variation in product quality(Reference Brandt4). Therefore, it cannot be excluded that similar differences would have been found if different batches within one cultivation system were compared, rather than the present comparison of two cultivation systems.
The aim was to identify biomarkers for future human intervention studies. The results of the present study cannot be directly extrapolated to human subjects. Chickens do not have differentiated, organised lymph nodes like mammalians have, but the avian immune system is besides that comparable to the mammalian immune system. It is the immune system of chicken that has provided most basic insights in immunology(Reference Davis50). Because of the availability of selected chicken lines, interactions between genetic background and feed could also be found. The high line consisted of high immune responders, the control line represented a random selection of the average chicken population, and the low liners show much lower immune responses.
By choosing a two-generation design, we could limit the effect of maternal or paternal conventional feed intake. The main group of interest was the second generation of chickens. By including immunological analyses of the first generation, we could compare effects from first time exposure of the animals to the experimental feeds, as occurred in the first generation, with effects of secondary exposure to the feeds by the chicks of the second generation. These animals may already have been epigenetically influenced by the nutritional status of their parents. It was clear that the high and low responder groups reacted overall differently to similar feed intakes than the control line. For body weight, hardly an effect of the different types of feed could be observed in the two extreme lines, although they showed the previously described differences in body weight, relating to the different AB responses(Reference Parmentier and Nieuwland18). It seems that their genetic constitution prevented them in reacting flexible to changing (phenotypical) influences, whereas the control line displayed the ability to react to feed intake. Only in the last week of the experiment, in response to the challenge, a discriminating effect between the feed groups was seen in the growth curves of both the H- and L-lines.
All animals were healthy, as both feeds were sufficient nutritious. Though differences between the conventional and organic feeds were not large besides a 10 % higher content of protein in the conventional feed, and the amount of metabolisable energy was comparable, the present study showed differences between feed groups in body weight and growth rate in several immune parameters and in genomics and metabolomics measurements.
Body weights differed significantly for the C-line animals, the conventionally fed group being heavier during the whole period. Several factors might have influenced the body weight of the animals, of which energy intake and the available amount of amino acids are most influential. Of these, the sulphur containing amino acids methionine, cysteine and lysine are most essential(Reference Eits, Kwakkel and Verstegen51, Reference Kwakkel52). The organically fed animals ate more in weeks 3 and 7, while the conventionally fed animals ate more in weeks 10, 12 and 13. As described, the metabolisable energy was approximately the same, but the protein content and several amino acids in the conventional diet were 10 % higher. The bioavailability of amino acids was evaluated in the starter feed, and among the amino acids, there were no limiting factors.
The difference in feed intake and/or the difference in protein content might explain differences in growth. In the Lauridsen rat study(Reference Lauridsen, Yong and Halekoh15), however, the rats on a diet from production with high fertilisation with pesticides (comparable to conventional) displayed more fat tissue and (NS) higher body weights, though feeds were made isoenergetic, as well as supplemented till equal levels of protein. These results could not be explained.
Concerning the immune system, in the first generation, the L-line animals on organic feed displayed a significant increase in NCD vaccine-specific AB titres. In this group of animals with a lower immune responsiveness, this is a remarkable effect in the specific immune system. In the second generation, the animals on organic feed appeared to have a stronger immune competence in the innate immune system than the animals on conventional feed, mostly in the C-line, but also several times in the H- and L-lines, reflected by the enhanced responses of monocytes before the challenge, 1 week after a feed change from starter to grower feed, and by the higher levels of LPS-binding natural AB titres after the challenge. The challenge activated the specific immune system stronger, reflected by the increased NCD-specific vaccination titres and the activation of the classical complement route after the challenge. KLH-specific titres were high after the challenge in all animals but not discriminating between the feed groups. To our opinion, this does not reject our proof of principle that the organic feed is immune modulating. We think it might be too simplified to expect uniform effects in all parameters. Though specific isotypes were not distinguished, it is not unlikely that the enhanced NCD vaccine titres may rest on enhanced IgG levels, comparable to the Lauridsen study.
Plasma metabolomics analysis showed a distinct metabolic pattern after the KLH challenge, which was in accordance with the immunological findings. Especially, intermediates of lipid metabolism showed most pronounced differences in the organic group. Increased concentrations of LPC, NEFA and glycerol could be recognised as remains of an acute phase reaction (APR; Khovidhunkit et al. (Reference Khovidhunkit, Kim and Memon53)). An APR, caused by injection of an immunogenic protein, increases TAG metabolism and fatty acid turnover, resulting in increased plasma levels of NEFA and glycerol(Reference Khovidhunkit, Kim and Memon53). Increased levels of plasma LPC and saturated LPC can be caused by a transient increased activity of secretory phospholipase A2(Reference Six and Dennis54) in APR. In the lipid platform, increased amounts of cholesterol esters and phosphatidylcholines were found, probably related to APR(Reference Khovidhunkit, Kim and Memon53).
The increased gene activity of the cholesterol pathway as found in the jejunum of the organic animals by genomics analyses(Reference De Greeff, Huber and Van de Vijver43) can, however, not be explained by this APR, as that reaction occurred soon after the challenge, 4 weeks before the sampling of the jejunum.
The different parameters indicate immune modulation by the feeds and tendencies towards an enhanced immune responsiveness or immune competence of the animals on organic feed. In the first generation, the effect is mainly found in the specific immune system, especially in the low line animals, while, in the second generation, it appears mainly in the innate immune system, but also in the specific part. It becomes increasingly clear that innate and specific immune responses are intimately interconnected(Reference Kapsenberg55). The first generation animals received the experimental diets at an age that the innate immune system has been repeatedly challenged. Whether enhanced sensitivity of the innate system of the second generation animals that received the diets early after hatch is based on a dietary challenge of a naïve immune system remains to be established.
The cause of the enhanced immune responsiveness in the organic animals before, but especially appearing after the challenge, is unclear. The organic feed contained more immune-stimulating gram-negative bacteria, but at the same time lower levels of immune-stimulating LPS were measured, a contradiction we have no explanation for. The organic feed contained more moulds, which might bring immune-stimulating β-glucans, but these were not measured. It is questionable whether all effects can be explained by the difference in bacterial load, as differences between the feeds were limited and the quantitative additions through the feed are relatively small compared to the bacterial load already present in the gut system of the animals.
A lower body weight (gain) in chicken has been related with an enhanced status of the immune system(Reference Parmentier and Nieuwland18, Reference Ploegaert, De Vries Reilingh and Nieuwland29, Reference Parmentier, Bronkhorst and Nieuwland56, Reference Klasing and Korver57). In the present study, the weight development of the organic C-line animals was comparable to that of the H-line, whereas in the conventional C-line it was comparable to the L-line, which suggests that the lower body weight gain in the organically fed birds could be related with an enhanced immune reactivity.
The question remains how enhanced (immune) reactivity to the immune challenge of the animals fed organic feed should be evaluated from a perspective of health. A baseline reaction on KLH in chicken is not known. In mice, Demas et al. (Reference Demas, Chefer and Talan58) described the effect of KLH, as provoking an increased metabolism, increased body temperature (fever among several animals), accompanied by body catabolism connected to anorexia. Demas et al. interpret this process as energy costs of mounting an immune response. The observed symptoms in our animals reflect the ones described by Demas et al. Body temperature was not measured, but parameters in the metabolomics as well as in the immunological analyses indicated an APR, most strongly in the animals fed organic feed. An APR is not always considered positive as it can be devastating for the organism(Reference Gruys, Toussaint and Niewold59). In the present study, the growth rate is indicative for a positive performance of the animals after the APR. After the depression of growth, in all animals during 2 weeks after the challenge, animals on both diets started to grow again, first those on the conventional feed, then the animals on the organic feed showed an increased catch-up growth, which appeared in all three lines. It might reflect the activated pentose phosphate pathway in the liver recognised by the increased concentrations of the sugar metabolites ribose, ribulose and fructose in the livers of the organic animals. In human medical literature, catch-up growth is taken as a clinical sign of recovery after illness for children described by Adamkin(Reference Adamkin60) and Rivkees(Reference Rivkees61). Future studies should follow growth patterns after a challenge during a longer period than the present study did, to be able to evaluate the performance of the organism.
The aim of the present study was to identify biomarkers that indicate potential health effects from organic food. These were identified in various different parameters such as feed intake, body weight and growth rate, in immunological, physiological and metabolic parameters, several of these differing most pronounced after the challenge. The genomics results are remarkable but cannot be connected to the other results yet. The results of the present study showed a tendency, which is slightly similar to some results from previous animal studies with organic feed, although these were quite different in study design. Lauridsen et al.(Reference Lauridsen, Yong and Halekoh15) found more body fat in rats on a conventional diet and higher IgG AB titres in the animals on an organic diet. Finamore et al.(Reference Finamore, Britti and Roselli14) found a higher responsiveness of the lymphocytes in rats fed organic wheat than in animals fed conventional wheat, when the animals were malnourished. Finally, Kummeling et al.(Reference Kummeling, Thijs and Huber62) found in a prospective study in children a reduced risk for eczema at 2 years of age, associated with the consumption of organic dairy. From the present data, we conclude that diets from different origin, i.e. organic v. conventional production systems, can induce physiological changes in two generations of chickens. Further studies should establish these findings and should unravel the mechanisms underlying our observations.
Acknowledgements
The present study was financially supported by the Dutch Ministry of Agriculture, Nature and Food Quality, the Ministry of Economic affairs, the Rabobank and the Triodos Bank. The authors thank Mr R. Verkerk and Mrs M. Scheer and colleagues for their excellent care of the chickens; Mrs A. de Vries for her project assistance; Mrs R. Adriaansen-Tennekes, Mrs G. de Vries Reilingh and Mr M. Nieuwland for their immunological analyses; Mrs E. de Haan and colleagues for their analyses on the feed ingredients; Dr A. Freidig for interpretation of the metabolomics results; Dr A. de Greeff and Dr A. Rebel for the nutrigenomics investigations; and the many other people who contributed with their efforts to the present study. M. H., R. A. P. H., H. S. and J. v. d. G. designed the study. M. H. drafted the manuscript with input from L.v. d. V. and L. C. on feed (analyses), from H. P. and H. S. on immunology, from L. C. and S. W. on metabolomics, from D. N. on statistics, from R. A. P. H. on toxicology; all co-authors contributed to the discussion. All co-authors participated in critically revising the manuscript. None of the authors had any conflict of interest.



