


Introduction
Nutrition underpins sports performance. The dietary intake (DI) of team sport athletes (TSA) has immediate and long-term implications on sports performance, adaptive response to training, injury status, recovery, body composition and general health.(Reference Thomas, Erdman and Burke1–Reference Mountjoy, Ackerman and Bailey3) Adequate nutrition knowledge (NK) appears to be an important aspect of TSA meeting their nutritional requirements,(Reference Alaunyte, Perry and Aubrey4–Reference Vázquez-Espino, Rodas-Font and Farran-Codina6) yet limited research has examined the NK of TSA using validated tools. The current literature suggests that significant gaps exist in TSA NK, with athletes typically achieving a score in NK questionnaires that corresponds with ‘average’ or ‘poor’ NK. NK is particularly lacking within areas of sports nutrition, micronutrients and supplements. These gaps in NK are observed across different levels of participation, gender and multiple team-based sports including; rugby,(Reference Hitendre, Jordan, Theodorakopoulos and White7) soccer,(Reference Staśkiewicz, Grochowska-Niedworok and Zydek8) Australian rules football,(Reference Jenner, Trakman, Coutts, Kempton, Ryan, Forsyth and Belski9) volleyball,(Reference Danh, Nucci, Andrew Doyle and Feresin10) basketball,(Reference Vázquez-Espino, Rodas-Font and Farran-Codina6) baseball,(Reference Andrews, Wojcik, Boyd and Bowers11) Gaelic football, hurling and camogie.(Reference Renard, Kelly, Chéilleachair and Catháin12–Reference O’Brien, Collins and Amirabdollhian15) The assessment of NK in TSA populations historically suffers from several methodological weaknesses, including utilisation of a multiplicity of questionnaires ranging from general NK(Reference Alaunyte, Perry and Aubrey4,Reference Noronha, Santos and Santos16) to sport specific,(Reference McCrink, McSorley, Grant, McNeilly and Magee13,Reference O’Brien, Collins and Amirabdollhian15) with varying levels of validity.(Reference Trakman, Forsyth, Devlin and Belski17,Reference Trakman, Forsyth, Hoye and Belski18) Furthermore, there is a paucity of research investigating NK in some team sports including Gaelic field sports.
The aim of this study was to assess the NK of TSA from a range of team sports including Gaelic football, hurling and camogie (H&C), soccer and rugby, using the validated Nutrition for Sport Knowledge Questionnaire (NSKQ).(Reference Trakman, Forsyth, Hoye and Belski18,Reference Trakman, Brown, Forsyth and Belski19) A secondary aim was to examine the associations between NK and demographic factors, sport, participation level and access to nutritional support. While sub-optimal NK has been previously identified within various athlete populations, much of this research has a singular focus on a specific sport and/or gender, many of these studies are also limited by a lack of validated sport nutrition specific tools and typically small sample sizes. This study aims to address these gaps by providing a comprehensive assessment of NK, in a large diverse cohort of male and female TSA from a variety of sports including under-represented traditional Irish sports using a robust, validated sport nutrition questionnaire. NK in the context of this study is defined as TSA level of correct understanding of sport specific nutrition topics, as measured and quantified by their overall total score and score in each NSKQ sub-section. It is important to acknowledge that while adequate NK may be a prerequisite component for optimal DI, the translation of NK into dietary behaviour change is a multifactorial process.
Methods
Experimental design
A cross-sectional observational design was used, whereby participants were recruited to this study through clubs. Recruitment posters were distributed to local gyms, home grounds and online after permission had been sought from the coach/management. Eligible participants were then asked to complete the NSKQ via the online platform REDCap, with data collected at one time point. This research was conducted in accordance with the Declaration of Helsinki and was approved by Ulster University’s School of Biomedical Sciences Ethics Filter Committee (FCBMS-19-017). Informed consent was obtained from all participants.
Participants
Inclusion criteria included apparently healthy male/female TSA competing in Gaelic football, H&C, rugby or soccer, aged between 18–40 years, training/competing at least twice a week. Participants were recruited from elite (County, Country, Province, Professional) and non-elite (Club, University) levels of participation.
Nutritional knowledge questionnaire
The validated NSKQ was used to assess NK of the TSA.(Reference Trakman, Forsyth, Hoye and Belski18–Reference Trakman, Forsyth, Middleton, Hoye, Jenner, Keenan and Belski20) Demographic questions, adapted to the relevant sport, were included at the beginning of the questionnaire and were used to collected data on aspects including age, education level, years playing selected sport and hours of training per week. In addition, players were asked about nutrition support provided and the type of nutrition support they would find most useful. The questionnaire was administered via the online platform REDCap. The NSKQ takes approximately 25 minutes to complete and consists of 87 questions, separated into six sub-sections: weight management (n = 12), macronutrients (n = 30), micronutrients (n = 13), sports nutrition (n = 12), supplementation (n = 12), and alcohol (n = 8). Scoring of the NSKQ was categorised according to,(Reference Jenner, Trakman, Coutts, Kempton, Ryan, Forsyth and Belski9) with scores of 0–49% considered reflective of ‘poor’ NK, 50–64% ‘average’ NK, 65–75% ‘good’ NK and 76–100% ‘excellent’ knowledge.
Anthropometrics
Height (m) and weight (kg) of the athletes was self-reported within the online questionnaire. Body mass index (BMI) was calculated as weight (kg)/height (m2).
Statistical analysis
Statistical analyses were performed using SPSS (IBM SPSS Statistics for Windows, Version 26.0 Armonk, NY: IBM Corp.) To test for normality of data the Shapiro-Wilk and Q–Q plots were used to ensure appropriate testing and reporting of data. Mean ± SD was used to report normal data, while median (interquartile range) was used for distributions that violated the assumption of normality. One-way ANOVA was used to determine significant differences in NK scores between sports. Independent-samples t-tests were used to compare differences in scores between gender and differences in scores between levels of participation. The level of significance was set at p < .05. A Spearman’s rank-order correlation analysis was conducted to examine associations between total NSKQ score and other continuous variables.
Results
Demographics
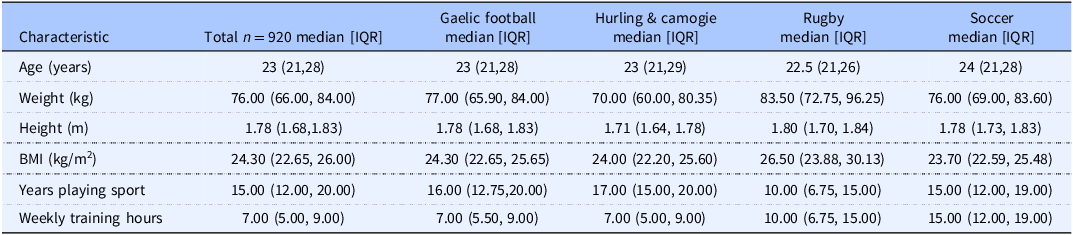
A total of 920 players completed the study (male n = 576 (62.6%), female n = 344 (37.4%)) with representation from Gaelic football n = 576 (62.6%), H&C n = 133 (14.5%), rugby n = 107 (11.6%) and soccer n = 104 (11.3%). 343(37.3%) participants competed at elite level and 577 (62.7%) at non-elite level. Demographics of the total cohort (n = 920) are presented in Table 1.
Demographic characteristics of team sport athletes

Table 1. Long description
The table presents demographic characteristics of 920 team sport athletes, including age, weight, height, body mass index, years playing sport, and weekly training hours. It compares data across Gaelic football, hurling and camogie, rugby, and soccer. The table has 6 rows and 5 columns, with headers for each characteristic and sport. Notable trends include variations in weight, height, and BMI across sports, with rugby players generally having higher values. Weekly training hours also differ, with soccer players training the most. The data is presented as median values with interquartile ranges.
Overall TSA NK
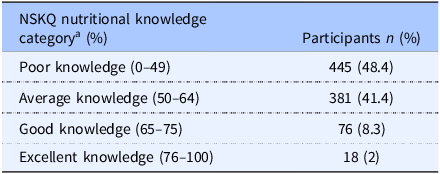
A total of 920 participants completed the NSKQ. The mean total score (50.4 ± 12.78%) fell just within the ‘average’ NK classification, 89.8% (n = 826) obtained a total score categorised as either ‘poor’ or ‘average’. The NK of most participants fell within the ‘poor’ classification and only 2% of participants obtained a NK score >75%, representative of having ‘excellent’ NK (Table 2). Within the NSKQ sub-sections, mean scores were particularly low within micronutrients (42.77 ± 19.89%), sports nutrition (46.93 ± 17.55%) and supplementation (35.42 ± 18.86%) sub-sections, reflective of ‘poor’ NK. A Spearman’s rank-order correlation analysis was conducted to examine associations between total score and other continuous variables. No meaningful associations between total NK score and age, height, weight, BMI or years playing were observed. A weak positive correlation was observed between total NK score and hours of training per week (r = .163, p ≤ .001).
Team sport athletes’ categorised nutritional knowledge scores

Table 2. Long description
The table presents the nutritional knowledge scores of team sport athletes, categorized into four levels: poor knowledge, average knowledge, good knowledge, and excellent knowledge. It consists of two columns: one for the nutritional knowledge category and one for the number and percentage of participants. The categories are defined by percentage ranges: poor knowledge (0-49 percentage), average knowledge (50-64 percentage), good knowledge (65-75 percentage), and excellent knowledge (76-100 percentage). The table shows that 48.4 percentage of participants have poor knowledge, 41.4 percentage have average knowledge, 8.3 percentage have good knowledge, and 2 percentage have excellent knowledge. The data highlights that a significant majority of participants fall within the poor and average knowledge categories.
aNSKQ scoring classification.(Reference Trakman, Forsyth, Hoye and Belski18–Reference Trakman, Forsyth, Middleton, Hoye, Jenner, Keenan and Belski20)
Comparison of NK between sports
A significant difference was observed between sports in total score (p =.002) and the following sub-sections; weight management (p =.002), micronutrients (p ≤.001) and supplements (p =.004) (Figure 1). Rugby (54.55 ± 11.77%) had a significantly higher total score compared to both Gaelic football (50.18 ± 12.93%) (p =.006) and H&C (48.24 ± 13.39%) (p = < .001). Total scores fell within the ‘average’ classification for all sports except H&C which had a mean total score reflective of ‘poor’ NK. Although the difference in total scores between sports was statistically significant, the effect size was small (eta η 2 = .017), explaining only 1.7% of variance. Comparisons between sub-sections revealed several significant differences between sports, rugby players scored significantly higher in the weight management (61.77 ± 17.62%), macronutrient (59.13 ± 13.10%), micronutrient (49.10 ± 18.66%) and supplement (41.67 ± 19.79%) sub-sections in comparison to H&C players (weight management 53.44 ± 16.32%, macronutrient 52.71 ± 17.37%, micronutrient 39.63 ± 18.70% and supplement 34.84 ± 19.24% sub-sections). Furthermore, rugby players scored significantly higher in the micronutrient sub-section in comparison to Gaelic football (41.93 ± 20.24%). Rugby players also scored significantly higher in comparison to, Gaelic football (34.61 ± 18.62%) and soccer (34.22 ± 17.77%) within the supplement sub-section. All significant differences within sub-sections remained within the same scoring classification.
Nutritional knowledge (NK) of team sport athletes stratified by sport as assessed by the Nutrition for Sport Knowledge Questionnaire (NSKQ). Different superscript letters indicate significant differences between sports (p < .05, one-way ANOVA with Tukey HSD post hoc analysis).

Figure 1. Long description
The bar graph compares nutritional knowledge (NK) scores across different sports, including Gaelic football, hurling and camogie, rugby, and soccer. The x-axis represents NSKQ sub-sections: Total Score, Weight Management, Macronutrients, Micronutrients, Sports Nutrition, Supplements, and Alcohol. The y-axis shows the NSKQ score in percentage. The graph features grouped vertical bars for each sport, with different colors representing the Total Cohort, Gaelic Football, Hurling & Camogie, Rugby, and Soccer. Each bar indicates the average NK score for the respective sport and sub-section. Significant differences between sports are marked with different superscript letters (a, b). The data shows variations in NK scores across different sports and sub-sections, with some sports scoring higher in specific areas. All values are approximated.
Comparison of NK and gender
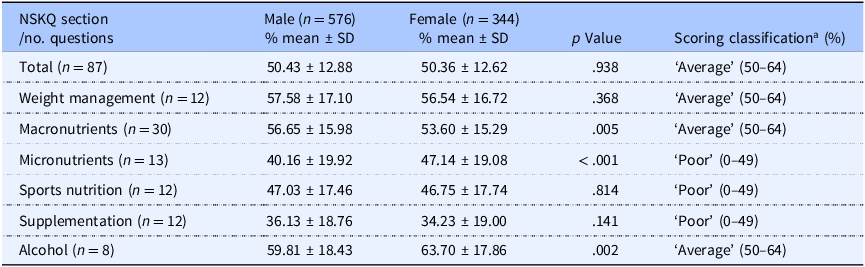
An independent samples t-test was used to compare NK between gender (Table 3). Mean total score was not significantly different between males and females. Significant differences were observed in 3 of the sub-sections. For macronutrients, males scored higher than females (d = 0.19, 95% CI [0.06, 0.33]), in contrast, females scored higher in the micronutrient (d = –0.36, 95% CI [–0.49, –0.22]) and alcohol sub-sections (d = –0.21, 95% CI [–0.35, –0.08]). Cohen’s d indicated the magnitude of difference was small for each, with no change in scoring classification within each sub-section.
Nutritional knowledge of team sport athletes stratified by gender

Table 3. Long description
The table presents a comparison of nutritional knowledge (NK) between male and female team sport athletes. It includes mean scores and standard deviations for various sections such as weight management, macronutrients, micronutrients, sports nutrition, supplementation, and alcohol. The table has 87 rows and 7 columns, with columns for male and female mean scores, standard deviations, p-values, and scoring classifications. Notable trends include males scoring higher in macronutrients and females scoring higher in micronutrients and alcohol sub-sections. The scoring classifications remain unchanged despite these differences.
aNSKQ scoring classification.(Reference Trakman, Forsyth, Hoye and Belski18–Reference Trakman, Forsyth, Middleton, Hoye, Jenner, Keenan and Belski20)
aSignificant difference p <.05 (Independent Samples T-Test).
Comparison of NK and participation level
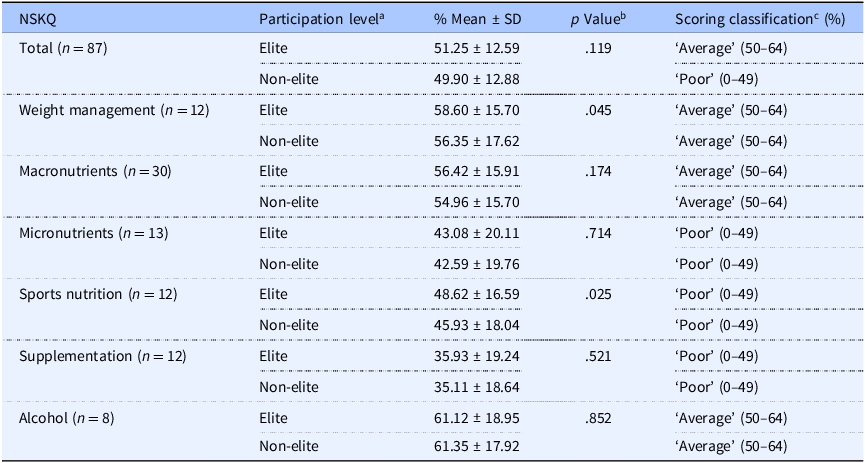
Mean total scores were not significantly different between elite and non-elite players (Table 4). Elite players scored significantly higher in the weight management and sports nutrition sub-sections in comparison to non-elite players (Table 4) albeit the magnitude of difference was very small; weight management (d = 0.13, 95% CI [–0.00, 0.27]), sports nutrition (d = 0.15, 95% CI [0.02, 0.29]).
Nutritional knowledge of team sport athletes stratified by participation level

Table 4. Long description
The table presents nutritional knowledge scores of team sport athletes, categorized by participation level into elite and non-elite groups. It includes data on total scores and various sub-sections such as weight management, macronutrients, micronutrients, sports nutrition, supplementation, and alcohol. The table has 87 rows and 5 columns, with headers for NSKQ, Participation level, percentage Mean plus or minus SD, p Value, and Scoring classification. Notable trends include elite players scoring higher in weight management and sports nutrition sub-sections compared to non-elite players, with significant differences in these areas. The scoring classification ranges from poor to average, with specific percentage ranges provided for each category.
aElite (County, Country, Province, Professional) n = 343(37.3%) and non-elite (Club, University) n = 577(62.7%).
bSignificant difference p <.05 (Independent Samples T-Test).
cNSKQ scoring classification.(Reference Trakman, Forsyth, Hoye and Belski18–Reference Trakman, Forsyth, Middleton, Hoye, Jenner, Keenan and Belski20)
Demographic questionnaire
When asked, ‘ever completed formal studies in Nutrition’, 91.7% answered ‘no’ and only 8.3% answered ‘yes’. When asked ‘Do you think sporting organisations should provide members access to nutritional info or Nutritionists/Dietitians’ (completion rate n = 911/920 (99%)), 74.9% of participants answered ‘yes, nutrition information and access to Nutritionist/Dietitian’, while 19% answered ‘yes, nutritional information only’ and 5.1% answered ‘neither of above’. When asked ‘Does your club provide you with access to nutrition information or Nutritionists/Dietitians’ (completion rate n = 917/920 (99.7%)), 64.3% of participants had no access to either nutritional information or a nutritionist/dietitian, 24.1% had access to nutritional information only and 11.2% had access to nutritional information and a nutritionist/dietitian. When examining the distribution of responses by sport and level of participation, it was observed that the lowest percentage of participants within each group had access to nutritional information and a nutritionist/dietitian; soccer 8.7%, Gaelic football 12.7%, H&C 10.7%, rugby 6.5%, elite 14%, non-elite 9.6%. Participants were also asked to rank which nutritional resource would be most useful to them; the top ranked resource was ‘access to nutritional info relevant to sports/training nutrition’ (46.1%) though a close second was ‘individual consultations by nutritionists/dietitians’ (41.5%). The lowest ranked nutritional resource by participants was ‘access to group presentations by nutritionists/dietitians’ (8.5%). No significant difference between total or sub-section scores and level of access to nutritional information and nutritionists/dietitians was found as determined using one-way ANOVA.
Discussion
Key findings indicate that NK amongst TSA remains sub-optimal. For the total cohort, the mean total score fell within the ‘average’ classification, although participants consistently demonstrated ‘poor’ NK in the micronutrients, sports nutrition, and supplementation sub-sections. Significant between sport differences were detected for total score and the weight management, micronutrients, and supplements sub-sections, but the effect sizes were small, indicating limited practical significance. These deficits in NK were evident across sports, participation levels, and demographic groups, aligning with patterns previously observed within the current available literature.(Reference Hitendre, Jordan, Theodorakopoulos and White7,Reference Staśkiewicz, Grochowska-Niedworok and Zydek8,Reference Danh, Nucci, Andrew Doyle and Feresin10,Reference Renard, Kelly, Chéilleachair and Catháin12–Reference O’Brien, Collins and Amirabdollhian15,Reference Jenner, Devlin, Forsyth and Belski21) Also consistent with previous research, participants demonstrated the weakest NK within the supplementation sub-section.(Reference Hitendre, Jordan, Theodorakopoulos and White7,Reference Murphy and O’Reilly14,Reference O’Brien, Collins and Amirabdollhian15) Inadequate supplement knowledge among TSA may heighten susceptibility to misleading marketing strategies, potentially increasing the likelihood of using ineffective, harmful, or prohibited substances.(Reference Garthe and Maughan22) Additionally, no meaningful associations were observed between total score and age or years playing. A weak positive correlation was observed between total score and hours of training per week but again the effect size was small meaning the practical importance of this relationship appears minimal.
Differences in nutritional knowledge across sports
Gaelic footballers had a mean total score categorised as ‘average’ and scored ‘poor’ in the micronutrients, sports nutrition and supplements sub-sections. Similar results have been observed in both elite and non-elite Gaelic footballers within the limited available literature. In a study investigating the DI, NK and hydration status of non-elite Gaelic footballers (n = 24) participants’ mean total NK score was categorised as ‘poor’ (40.2 ± 12.4%), NK was assessed using the NSKQ. Except for the alcohol sub-section, mean scores across all NSKQ sub-sections also fell within the ‘poor’ category. Although based on a relatively small sample, these findings align with those observed in the present study.(Reference McCrink, McSorley, Grant, McNeilly and Magee13) Observations from this cross-sectional study, may indicate an association between ‘poor’ NK and suboptimal DI in terms of under-fuelling and micronutrient inadequacies though further longitudinal research on this relationship is needed.(Reference McCrink, McSorley, Grant, McNeilly and Magee13) Comparable NK scores have been observed in female Gaelic footballers, however direct comparison with the present findings is limited as NK assessment was completed utilising the validated Abridged Nutrition for Sport Knowledge Questionnaire (A-NSKQ(Reference Renard, Kelly, Chéilleachair and Catháin12)). Within the female cohort examined, the lowest scores were observed within the micronutrients sub-section. In elite male Gaelic footballers (n = 100) ‘poor’ NK (mean total NK score 47.6 ± 12.3%) has also been observed.(Reference O’Brien, Collins and Amirabdollhian15) An online version of the NSKQ was used to assess NK, similar to the results observed within this study, participants’ scores reflected ‘poor’ NK within the micronutrients (34.2 ± 11.9%), sports nutrition (42.3 ± 13.4%) and supplements (39.4 ± 14.0%) sub-sections.(Reference O’Brien, Collins and Amirabdollhian15)
There is a clear paucity of research investigating the NK of H&C athletes at present. Within the available small number of studies which do address this topic, it is reported that H&C athletes have sub-optimal NK, echoing the ‘poor’ scoring of H&C athletes within this study. A study evaluating the NK in female Gaelic games players utilising the validated A-NSKQ found that camogie players (n = 114) achieved a mean score categorised as ‘poor’ (46.3 ± 11.3%).(Reference Renard, Kelly, Chéilleachair and Catháin12) Comparable findings have been reported in hurlers, in a study assessing both the NK and DI of hurlers (n = 265) using a validated Sports Nutrition Knowledge Questionnaire, NK was found to be sub-optimal (mean NK 48.8%). Furthermore, no significant difference was found in total scores between elite and sub elite hurlers (n = 129 elite, n = 136 sub-elite). In line with our findings, participants scored lowest (27.3%) in the supplement sub-section.(Reference Murphy and O’Reilly14)
Rugby players had a mean total score categorised as ‘average’. Interestingly, rugby players achieved the highest total score between the sport groups but had the lowest percentage of participants with access to nutritional information and a nutritionist/dietitians, at only 6.5%. Mean total score was categorised as ‘average’ the same as both soccer and Gaelic football and just slightly above the cut-off for ‘poor’ <49%. Rugby players scored ‘poor’ in the following sub-sections; micronutrients, sports nutrition and supplements. Many of the studies assessing the NK of rugby players across gender and level of participation suffer from common methodological weaknesses, such as use of non-validated and/or non-sport specific nutrition questionnaires,(Reference Alaunyte, Perry and Aubrey4) therefore limiting possible comparisons across the literature to the results observed within this study. One study which used a modified version of the NSKQ to assess NK in semi pro Rugby players (n = 24) found similar results to those observed within this study. Participants’ mean total score was categorised as ‘average’ (53.7 ± 11.9%), mean scores within sub-sections were also similar in micronutrients (‘poor’ 32.3 ± 20.5%), sports nutrition (‘average’ 55.8 ± 16.4%) and supplements (‘poor’ 42.9 ± 18.0%) sub-sections.(Reference Hitendre, Jordan, Theodorakopoulos and White7) Rugby players typically train for size and strength due to the demands of their sport(Reference Jones, Smith, Macnaughton and French23) and often have intakes of protein above sports nutrition recommendations.(Reference MacKenzie, Slater, King and Byrne24) This behaviour may be driven by a multitude of factors: performance goals, team culture, and influential staff,(Reference Stokes, Hughes, Shaw, O’Connor and Beck25) possibly explaining the slightly higher scores in NK, reflective in scoring in sub-sections such as macronutrients where rugby players scored highest (59.13 ± 13.10%) between the sports within this study.
Soccer players had a mean total score categorised as ‘average’ and scored ‘poor’ in the micronutrients, sports nutrition and supplements sub-sections. NK in elite and non-elite soccer players has been more extensively researched compared to some of the other sports featured within this study, however many have methodological limitations such as the use of non-validated and general NK questionnaires rather than sport specific.(Reference Noronha, Santos and Santos16,Reference Andrews and Itsiopoulos26,Reference Devlin, Leveritt, Kingsley and Belski27) A study on elite level professional soccer players (n = 38) found similar results observed within this study, using a version of the NSKQ consisting of 87 questions and 5 sub-sections. Participants mean total score (51.49%) was categorised as ‘average’, participants also scored particularly poorly in the micronutrients and supplementation sub-sections.(Reference Staśkiewicz, Grochowska-Niedworok and Zydek8)
Comparisons of demographic and training-related variables
Total scores for both male and female participants were categorised as ‘average’, although were just over the cut-off point for ‘poor’ NK (<49%); no significant difference was observed within sub-sections. These results are comparable to current literature with both male and female TSA scoring either ‘poor’ or on the low range of ‘average’.(Reference Danh, Nucci, Andrew Doyle and Feresin10,Reference McCrink, McSorley, Grant, McNeilly and Magee13,Reference Jenner, Devlin, Forsyth and Belski21) While total scores were similar between male and female participants the observed sub-section differences; males scoring higher in macronutrients and females scoring higher in micronutrients and alcohol may warrant consideration. This pattern may reflect social and/or cultural influences on food choices and health interests. For instance, as suggested earlier, males in sports such as rugby with a well-established weight training culture may focus on protein and macronutrient intake for muscle growth,(Reference Jones, Smith, Macnaughton and French23–Reference Stokes, Hughes, Shaw, O’Connor and Beck25) reflected in a higher score within the NSKQ macronutrients sub-section. However, the small effect sizes suggest these differences, while statistically significant, are of limited practical relevance.
When comparing levels of participation, mean total score for elite TSA was ‘average’ while non-elite was ‘poor’. A significant difference was observed within the weight management and sports nutrition sub-sections, elite TSA scored higher in both although the magnitude of difference was very small and there was no change in scoring classification within each sub-section. These findings are consistent with previous research using validated NK questionnaires to evaluate NK among TSA both elite(Reference Staśkiewicz, Grochowska-Niedworok and Zydek8,Reference Jenner, Trakman, Coutts, Kempton, Ryan, Forsyth and Belski9,Reference O’Brien, Collins and Amirabdollhian15) and non-elite levels(Reference Hitendre, Jordan, Theodorakopoulos and White7,Reference Danh, Nucci, Andrew Doyle and Feresin10,Reference McCrink, McSorley, Grant, McNeilly and Magee13) within their respected sport. The lack of meaningful difference in total NK scores between elite and non-elite TSA was unexpected, due to the assumption of greater resource access at elite level. These findings suggest just competing at a higher participation level does not automatically translate to superior NK. This may imply that elite teams’ nutrition support if it exists maybe underutilised and/or non-standardised, reinforcing the need for standardised and structured nutrition education for all levels of participation.
The level of access TSA have to nutritional resources varies across teams, socioeconomic backgrounds and gender. When asked to rank nutritional resources, participants placed the highest value on access to sport-specific nutritional information, closely followed by opportunities for individual consultations with nutritionists/dietitians. Similarly in a study of non-elite Gaelic footballers the majority (87.5%) of participants responded that they would like clubs to provide access to Nutritionists/Dietitians(Reference McCrink, McSorley, Grant, McNeilly and Magee13). Unfortunately, due to time and cost barriers, individual consultations with nutritionists/dietitians may be unrealistic for many teams, however an educational intervention (EI) which provides access to nutritional information relevant to individual sports/training demands is a possibility.(Reference Sánchez-Díaz, Yanci, Castillo, Scanlan and Raya-González28,Reference Tektunalı Akman, Gönen Aydın and Ersoy29) However, an effective, accurate and reliable intervention to provide nutritional information is still not widely available or scalable. Interestingly only 8.5% of participants ranked group presentations by nutritionists/dietitians as the most valuable access. Although this is typically the standard, traditional nutritional support that most TSA are exposed to, despite the literature suggesting these methods of nutritional support have mixed results with TSA.(Reference Tam, Beck, Manore, Gifford, Flood and O’Connor30) The absence of a significant association between NK and reported access to nutritional support suggests that simply having access to resources may be insufficient to improve TSA NK. Some of the critical factors underpinning success (improving NK) may be the quality, relevance and athlete engagement with those resources/interventions. Additionally, it is possible that the nutritional information currently provided to these TSA is not effectively retained or that access is too infrequent to have a measurable impact on NSKQ scores.
Furthermore, a strong desire for nutritional support was evident, 74.9% of participants indicating that team sport organisations should provide members access to nutritional info or Nutritionists/Dietitians. While a clear desire for access to nutritional resources amongst TSA was observed, this perceived need was not reflected in actual provision, 64.3% of athletes reported having no access to either nutritional information or a nutritionist/dietitian, while only 11.2% had access to both. Across sports and participation levels, access to nutritional support was consistently low (soccer 8.7%, Gaelic football 12.7%, H&C 10.7%, rugby 6.5%; elite 14.0%, non-elite 9.6%). This discrepancy between TSA desire for and access to nutritional support, underscores the need for greater integration of qualified sports nutrition professionals within team sport settings and a need for effective interventions that overcome the barriers limiting this access.
Practical applications
Nutritional periodisation and a good NK are the basic tools TSA need to move towards a proactive approach to sports nutrition. Nutrition for TSA is typically reactive, but it should be predominantly proactive as even at elite level where food provision is often organised, it is not feasible/realistic for nutritionists to be present at all mealtimes. The overarching objective should be to cultivate TSA capacity for autonomous and evidence-based dietary decision making. Improved NK may enable TSA to engage in proactive and anticipatory dietary planning, rather than adopting a reactive approach to immediate situational demands.
TSA observed within this study had a desire for additional nutritional support, meaning their needs are not being met. Currently there is limited research on the optimal EI to improve NK in TSA. Traditional lectures and one-on-one counselling are the most common form of EI observed within the literature,(Reference Tam, Beck, Manore, Gifford, Flood and O’Connor30) though given the barriers of access to these, a more scalable and affordable alternative EI may be needed. The success of a nutritional EI to elicit a behaviour change is multifactorial and although NK plays a role it is not the sole factor; desire, motivation and a willingness to change are also essential components. The results of this study support the consensus that NK is sub-optimal amongst TSA populations, highlighting the need for an innovative, scalable solution that is in-line with the modern era. If this gap is not addressed by researchers, sports nutritionists and the wider sports nutrition community, it exposes TSA to the risk of seeking information from less reliable sources.
Strengths and limitations
One methodological limitation with the NSKQ is that the questions provide only written descriptions. Not all athletes may fully understand these descriptions, for example, question ‘Q2.2’ gives measurements in ‘cups’ whilst ‘Q2.3’ gives measurements ‘grams’. The addition of visual pictures representative of food quantities may further enhance this questionnaire, improving accessibility and interpretation to a wider audience. Furthermore, the reliance on self-reported height and weight data to calculate BMI is a limitation, this method is susceptible to recall bias and personal/social desirability. A potential uncontrolled confounder affecting NK was that some data collection spanned over the COVID-19 pandemic (January 2021–August 2025), during which participants access to resources may have changed. Notwithstanding these limitations, this study provides a valuable insight into the NK of TSA. A major strength of this study was the large sample size, from different sports including comparatively underrepresented traditional Irish GAA team sports, across different levels of participation. Another strength was the use of the validated NSKQ developed in 2017,(Reference Trakman, Forsyth, Hoye and Belski18) updated in 2019.(Reference Trakman, Brown, Forsyth and Belski19) Each sub-section can be administered and interpreted independently, practically this presents an advantage for evaluating specific areas of NK. When comparing the results from this study to the literature, the discussion focused on studies which utilised the NSKQ and variations where possible.
Conclusion
The results of this study align with current literature demonstrating that the NK of TSA is sub-optimal. The magnitude of any difference in scores within this study was small across sports and on average each sports group failed to achieve a NK scoring classification of either ‘good’ or ‘excellent’ in total score or any sub-section. Players’ knowledge was particularly poor within the areas of micronutrients, sports nutrition and supplementation. Worryingly, poor scoring within these sub-sections may expose TSA populations to higher risks of deficiencies in DI and higher likelihood of potentially using ineffective, harmful or even banned substances. The desire for TSA to acquire additional nutritional resources cannot be understated, while NK is a key component of dietary behaviour, desire (seeking out information), motivation and a willingness to accept change also have a vital role to play. Good NK may allow TSA to be proactive and predictive with their dietary behaviour rather than reactive. Therefore, an appropriate EI should be designed and implemented to improve NK, which may subsequently improve DI, health and performance.
Novelty statement
Uniquely this study offers insight into the NK of male and female TSA across a large and diverse cohort. NK was assessed using a validated questionnaire (NSKQ) and included both widely studied team sports and comparatively under-represented traditional Irish GAA sports, from both elite and non-elite levels of participation.
Acknowledgments
The study was designed by E. M. McSorley, P. J. Magee and A. M. McNeilly, data was collected by C. V. McDonald and the students acknowledged below and analysed by C. V. McDonald; data interpretation and manuscript preparation were undertaken by C. V. McDonald, E. M. McSorley, P. J. Magee and A. M. McNeilly. All authors approved the final version of the paper. The authors have no conflicts of interest to declare.
The authors acknowledge the following students that contributed to the collection of data included within the current paper: Clodagh Skelly, Niall Loughlin, Bronagh O’Kane, Ella McVeigh, Ella Cooney, Leah O’Neill, Robyn Alexander, Katie Doherty, Sara Lucas, Cara Chism, Sarah Brennan, Anna McCormack, Charlotte Bell, Cai Armstrong, Joshua Johnson, Linda Cope, Ruairi McCann, Kate Byrne, Gary Cullinane, Jolene Rowland, Aoibheann Swail, Nora Goodwin, Daniel McIlrath, Caitlin Fallis, Caragh Fitzpatrick, Ellen McKergan, Niall Carr, Alison Stewart, Eimear Crawford, Niamh Davis, Majella Walsh, Shane McConville, Maeve Hughes, Amy Fry, Kathryn Donaghy, Michaela Devlin, Gary McKeever, Shannon Reid, Eimear Crawford, Erin Whitla, Emma Cousins.
We thank all of the university sports teams and club players that participated in the study.
Funding statement
This manuscript has been funded by the Department for the Economy providing studentship as part of a PhD project at Ulster University.


 Open access