

Introduction
The general warming trend during the 20th century and into the 21st century is now well documented. Scientific evidence verifies that Earth’s globally averaged surface temperature is increasing. The Intergovernmental Panel on Climate Change (IPCC) report (Reference SolomonSolomon and others, 2007) suggests that human activities are contributing significantly to observed changes in the Earth system. Although not all regions have warmed, the globally averaged temperature has increased ~0.7˚C since 1900 (Reference Hansen, Sako, Ruedy, Lo, Lea and Medina-ElizadeHansen and others, 2006). The best interpretation of proxy records from borehole temperatures, stable isotopes from ice cores, tree-ring data, etc., suggests that the 1990s was the warmest decade in the last 1800 years (Reference Jones and MannJones and Mann, 2004; Reference MannMann and others, 2009).
On decadal and longer timescales, climate models predict that greenhouse-gas-forced warming will drive temperatures to rise faster at higher elevations and that this vertical amplification will be greatest in the tropics due to upper-tropospheric humidity and water-vapor feedback (Reference Ramaswamy, Karl, Hassol, Miller and MurrayRamaswamy and others, 2006; Reference Randall and SolomonRandall and others, 2007). Results from general circulation models (GCMs) indicate that the combined water-vapor/lapse-rate feedback provides the largest positive radiative feedback and that it alone roughly doubles the warming in response to forcing by greenhouse-gas increases. As a result, the projected changes in mean annual free-air temperatures show twice as much warming at higher elevations in the tropics as is predicted at the Earth’s surface (Reference Bradley, Vuille, Diaz and VergaraBradley and others, 2006). Moreover, some high-elevation tropical glaciers appear to be responding already to these enhanced temperatures, which may account for the accelerating rate of glacier loss at some of these sites (Reference Coudrain, Francou and KundzewiczCoudrain and others, 2005; Reference ThompsonThompson and others, 2006). As these processes continue and snow is removed, the less reflective exposed ice melts. Once underway, melting requires 7.5 times less energy than sublimation. As the ice disappears and more of the darker land surface is in turn exposed, absorption of the intense higher-elevation radiation increases, thus accelerating the changes underway through positive feedbacks (Reference Bradley, Vuille, Diaz and VergaraBradley and others, 2006). These projections are consistent with the recently documented rise of the freezing-level height (FHL) in the tropical atmosphere (the free-air 0˚C isotherm) across the tropics and a warming trend of ~0.1˚C per decade over the last 50 years based on high-elevation surface temperatures and upper-air data (Reference Bradley, Keimig, Diaz and HardyBradley and others, 2009).
Several studies of glacier mass balance in the tropics, particularly in the Andes, have demonstrated that El Niño Southern Oscillation (ENSO) is an important influence (Reference Francou, Ribstein, Saravia and TiriauFrancou and others, 1995, Reference Francou, Vuille, Favier and Cáceres2004, Reference Francou, Ribstein, Wagnon, Ramirez, Pouyaud, Huber, Bugmann and Reasoner2005; Reference Ribstein, Tiriau, Francou and SaraviaRibstein and others, 1995; Reference Arnaud, Muller, Vuille and RibsteinArnaud and others, 2001). A combination of warmer air temperatures over higher elevations, lower amounts of precipitation during the wet season (more arriving as rain at lower elevations near the glacier margins) and less cloud cover contributes to higher rates of ice ablation. The 1000--200 hPa average air-temperature anomalies show that the warming during an El Niño event spreads nearly uniformly throughout the tropics (Reference Chiang and SobelChiang and Sobel, 2002). Although the effect of the current warming trend on the frequency and intensity of future ENSOs is uncertain (Reference CollinsCollins and others, 2010), the accelerating retreat of the tropical Andean glaciers is almost certainly linked to the combined effects of the persistent warming and the periodic occurrences of El Niño.
Ice-core records from Africa, Alaska, Antarctica, Bolivia, China, Greenland, Peru, Russia and Indonesia have made it possible to study atmospheric and oceanic processes linking the polar regions to the lower latitudes where human activities are most concentrated. For over 30 years the Ice Core Paleoclimate Research Group (ICPRG) at The Ohio State University’s Byrd Polar Research Center has successfully extracted information on past climatic and environmental changes from ice cores drilled around the world, often under very harsh and logistically challenging conditions. Much of this work has been conducted on tropical mountain glaciers in the Andes, the Himalaya, on Kilimanjaro and more recently in Papua, Indonesia. These low-latitude climate records constitute a critical component of the principal objective of our program: the acquisition of a global array of ice cores that provide high-resolution climatic and environmental histories that will contribute to our understanding of the complex interactions within Earth’s climate system.
Improved predictive capability requires better quantification of physical and chemical linkages in the Earth system along with the complex feedbacks that may dampen or accelerate an initial forcing. Ice-core data allow detailed reconstruction of both climate variability and climate forcings (e.g. volcanic activity, solar activity) in addition to timing of the most recent glaciations for different latitudes and elevations. Tropical ice cores offer long-term perspectives on variability in precipitation, temperature, aridity and atmospheric and oceanic circulation that are unavailable from other proxy sources. Information from ice cores contributes prominently to Earth’s paleoclimate record, the ultimate yardstick against which the significance of present and projected anthropogenic effects must be assessed. The results from these analyses, as well as those from glacier area and volume measurements, have meaningful implications for understanding climate change and potential impacts on water resources and the social and economic consequences. It is scientifically and socially imperative that we understand the drivers and responses of the past and present tropical climate regime and attain a better grasp of the climatic factors that control the recent and accelerating loss of permanent ice fields throughout the tropics.
Tropical Ice-Core Evidence Of ENSO
Most of the meteorological and climatic events and perturbations affecting Earth’s surface originate in, or are amplified by, ocean/atmosphere interactions in tropical latitudes. The tropics are Earth’s ‘heat engine’, where the warmest upper level and sea surface temperatures (SSTs) occur (Fig. 1a and b). The energy associated with these warm temperatures gives rise to intense convective precipitation (Fig. 1c) and is crucial for the evolution of phenomena such as ENSO, the monsoonal systems of Asia and Africa and, on shorter timescales, hurricanes and other tropical disturbances that distribute the tropical energy (heat) poleward.
The warmest (a) upper-level air temperatures and (b) sea surface temperatures are located in the tropical latitudes, as are (c) the regions of most intense precipitation (modified after Reference SobelSobel, 2002). The Northern Hemisphere winter (December through February) averages are shown along with the tropical ice-core sites (triangles). ECMWF: European Centre for Medium-Range Weather Forecasts.

Much of the precipitation that falls on the eastern side of the Peruvian Andes comes from the tropical Atlantic Ocean via the Amazon basin. This source has remained consistent since the Last Glacial Maximum, as shown by the mountain snowlines that were tilted towards the Amazon basin then as they are now (Reference Klein, Isacks and BloomKlein and others, 1995). However, δ18O variations in the tropical ice cores from Peru are linked to ENSO variability (Reference Thompson, Mosley-Thompson and ArnaoThompson and others, 1984; Reference Henderson, Thompson and LinHenderson and others, 1999; Reference Bradley, Vuille, Hardy and ThompsonBradley and others, 2003). Ice fields in the tropical Andes contain visibly distinct annual laminations due to the abundant and extreme seasonal variability of precipitation (Thompson, 2000; Reference Thompson, Henderson, Mosley-Thompson, Lin, Diaz and MarkgrafThompson and others, 2000b). Such seasonal variations are illustrated in the high-resolution record of δ18O, dust and nitrate concentrations of the most recent 100 years of the Huascarán ice core (Fig. 2). Note a general tendency toward isotopic enrichment during strong ENSO events. Ice fields in the central Himalaya, such as Dasuopu glacier, receive high amounts of snowfall during the monsoon season and likewise contain well-defined seasonal oscillations in δ18O that reflect SST variations in the eastern equatorial Pacific Ocean (Reference Thompson, Yao, Mosley-Thompson, Davis, Henderson and LinThompson and others, 2000a; Reference Bradley, Vuille, Hardy and ThompsonBradley and others, 2003). This offers the prospect of reconstructing a record of low-latitude circulation anomalies from a network of trans-Pacific basin ice cores. Thus, this widespread collection of records is analogous to an array of long-term meteorological stations throughout the tropics, making it possible to study the history of ENSO variability.
The δ18O, mineral dust concentrations and nitrate concentrations from 1893 to 1993 in the Huascarán ice-core record show distinct seasonal variations. Years with enriched isotopic ratios often occur during strong to very strong El Niño events (Reference QuinnQuinn, 1993), which are shown as rectangles with solid fill; open rectangles indicate moderate El Niño events.

Oxygen isotopic variations in ice cores from the Andes and the Himalaya have recently been shown to reflect SSTs across the eastern equatorial Pacific Ocean. Above-average SSTs in the Pacific Ocean, particularly the eastern tropical Pacific, are linked with isotopically heavier snow and associated with higher atmospheric freezing levels (Reference Bradley, Vuille, Hardy and ThompsonBradley and others, 2003, Reference Bradley, Keimig, Diaz and Hardy2009). Moreover, all tropical ice cores with annual resolution show significant correlations with SSTs in the NINO4 region of the eastern equatorial Pacific Ocean. The eastern tropical tropospheric temperature connection can be seen in the correlation fields between the monthly surface and USU T2 satellite-derived tropospheric temperature anomalies from 1979 to 2003 (Reference Christy and SpencerChristy and Spencer, 2003) due to the prominence of the ENSO phenomenon in this region (Reference Ramaswamy, Karl, Hassol, Miller and MurrayRamaswamy and others, 2006). These temperature anomalies extend over the tropical Andes where the Quelccaya, Huascarán and Coropuna ice-core records originated. Over the tropics as a whole, FLH is closely related to mean SSTs, with interannual variations in FLH controlled by the phase of ENSO variability (Reference Bradley, Keimig, Diaz and HardyBradley and others, 2009). Figure 3a compares the time series of extended reconstructed SSTs from 1856 to 1996 in the NINO4 region (5˚N to 5˚S, 150˚W to 160˚E) (Reference Kaplan, Cane, Kushnir, Clement, Blumenthal and RajagopalanKaplan and others, 1998; Reference Reynolds, Rayner, Smith, Stokes and WangReynolds and others, 2002), averaged from July to June of the following year, with a composite of annually averaged (austral winter to austral winter) δ18O records from four tropical ice cores: Quelccaya (14˚S), Huascarán (9˚S) and Coropuna (15˚S) from the tropical Andes of Peru and Dasuopu (28˚ N) from the central Himalaya. The significant correlation between these two time series from 1856 to 1996 (Fig. 3a) strongly implies that tropical ice cores from regions that experience distinct wet and dry seasons and high rates of wet-season precipitation contain reasonable records of equatorial Pacific SSTs. When the long-term warming trends in both time series are removed (Fig. 3b), the correlation remains highly significant. Given the link between FLH and tropical SSTs, the ice-core data suggest that the general trend of FLH change, although oscillating at quasi-decadal cycles, has been positive since the mid-19th century. These tropical records reveal not only the variability of ENSO through time, but also changes in the height of the tropical freezing level.
(a) Comparison of the thermal year (July–June) averages of extended reconstructed SST (ERSST) over NINO4 (darker line) (Reference Kaplan, Cane, Kushnir, Clement, Blumenthal and RajagopalanKaplan and others, 1998; Reference Smith and ReynoldsSmith and Reynolds, 2004) with the composite of the δ18O time series for tropical ice cores in the Peruvian Andes and the Himalaya (lighter line). (b) Same as (a) but both time series have been detrended.

Intensified Warming at High Elevation: Evidence and Impacts
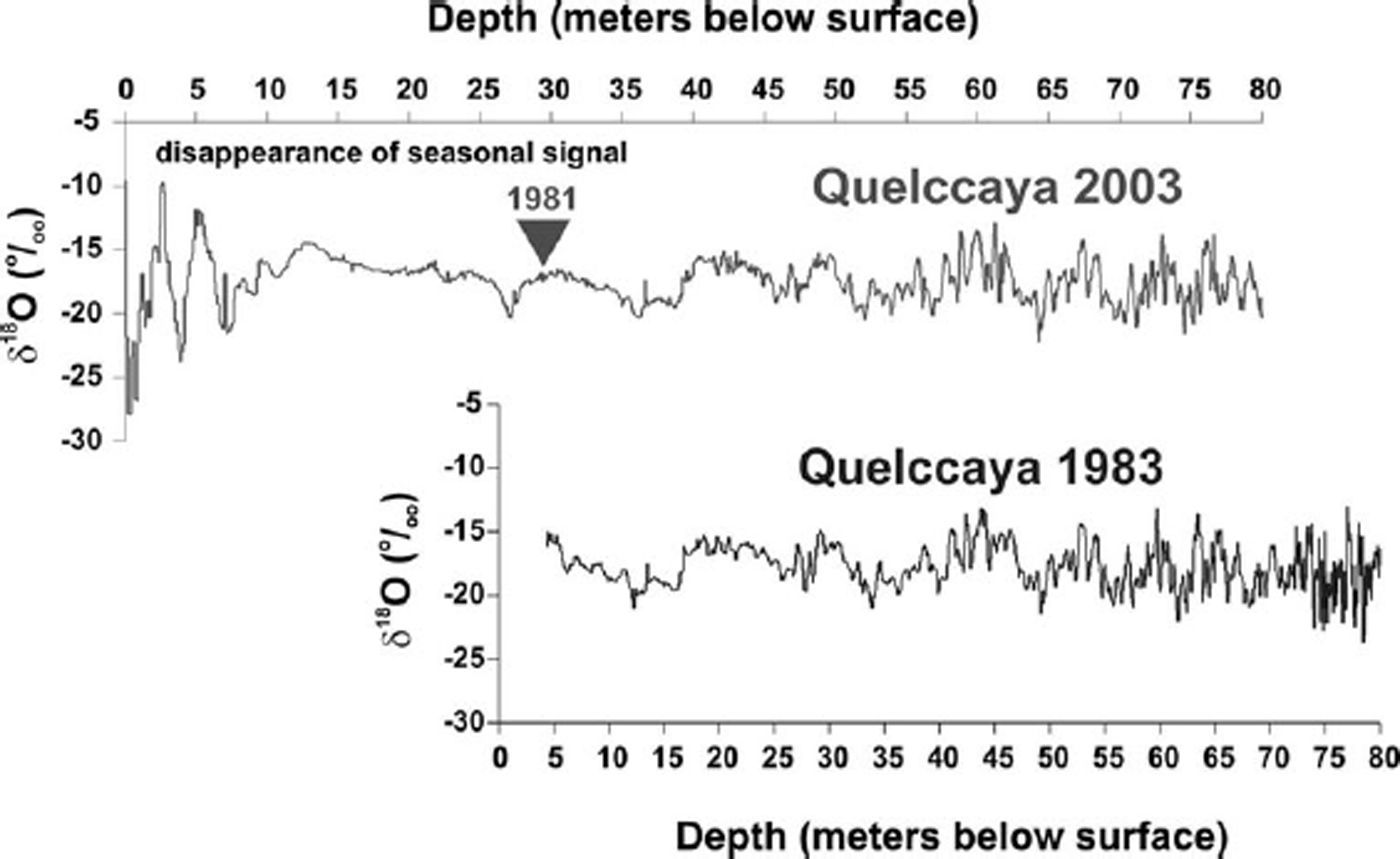
As temperatures warm in the tropics the lower-elevation ice fields are subject to increased seasonal melting which obliterates the seasonal variability of δ18O. In 1983, ice cores to bedrock were drilled on Quelccaya ice cap in the Cordillera Vilcanota of southern Peru, which has been monitored continually since. In 2003, ice cores were again drilled to bedrock and these reveal that the percolation of meltwater throughout the accumulating snowpack has vertically homogenized the seasonal changes in δ18O (Fig. 4) and enriched the mean values by ~3% from 1976 to 2000. This enrichment signals a strong recent warming recorded through 2000. From 2000 to 2003 the more depleted isotopic values result from higher sample density (i.e. number of samples per year) towards the top of the core and the seasonal distribution of precipitation on the ice cap (i.e. 80% of snow falls during the wet season). While the melting has impacted the δ18O record in Quelccaya’s upper firn layers, the record is still preserved below 40m (the depth of the firn/ice transition) where ice temperatures remain below freezing throughout the year (Reference Thompson, Mosley-Thompson, Dansgaard and GrootesThompson and others, 1986, Reference Thompson2006). This is consistent with results from analyses of earlier shallow cores in the Cordillera Blanca of northern Peru and in cores collected along elevation transects on Quelccaya in successive years. The results confirm that as the 0˚C isotherm increased in elevation, the seasonal δ18O signal was smoothed by meltwater percolation and annual averages were enriched (Thompson and others, 1993; Reference Davis, Thompson, Mosley-Thompson, Lin, Mikhalenko and DaiDavis and others, 1995).
Comparison of δ18O records from an ice core drilled on the summit of Quelccaya ice cap in 2003 with a core drilled in the same location 20 years earlier showing smoothing of the isotopic signal in the post-1983 period and excellent preservation of the pre-1983 record in the 2003 core.
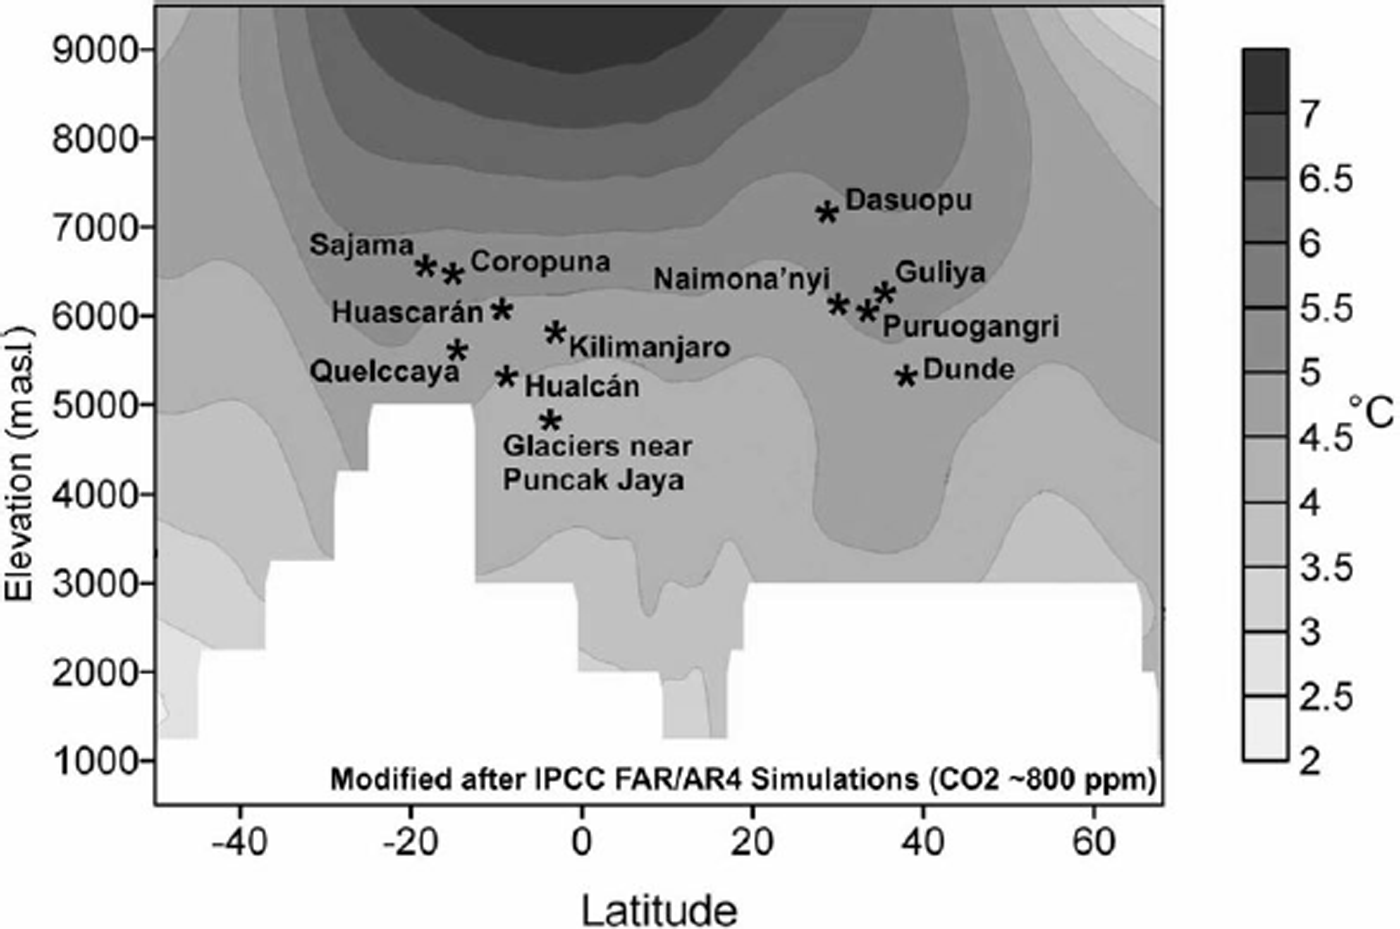
As stated above, greenhouse-gas-forced warming is doubled by the combined water-vapor/lapse-rate feedback which forces the largest positive radiative feedback in the atmosphere (Reference Ramaswamy, Karl, Hassol, Miller and MurrayRamaswamy and others, 2006). As a result, the projected changes in mean annual free-air temperatures between 1990–99 and 2090–99, using CO2 levels from IPCC Fourth Assessment Report scenario A2 (Fig. 5), show twice as much warming in the mid- to upper troposphere in the tropics as is predicted for Earth’s surface (Reference Bradley, Vuille, Diaz and VergaraBradley and others, 2006). This is supported by temporally long high-resolution tropical ice-core records collected at several sites over a range of elevations. The records indicate that temperatures on and near the surface of glaciers increase more at higher elevations.
The results of eight Global Climate Models from the IPCC (Reference SolomonSolomon and others, 2007) showing projected changes in mean annual free-air temperatures from 1990–99 to 2090–99 along a north–south transect over the American Cordillera (Reference Bradley, Vuille, Diaz and VergaraBradley and others, 2006). The altitudes and latitudes of 12 tropical ice-core sites are shown, demonstrating that the higher-elevation sites are projected to experience greater warming than the lower sites. Reprinted with permission from the American Association for the Advancement of Science (AAAS) and modified with permission from R.S. Bradley.
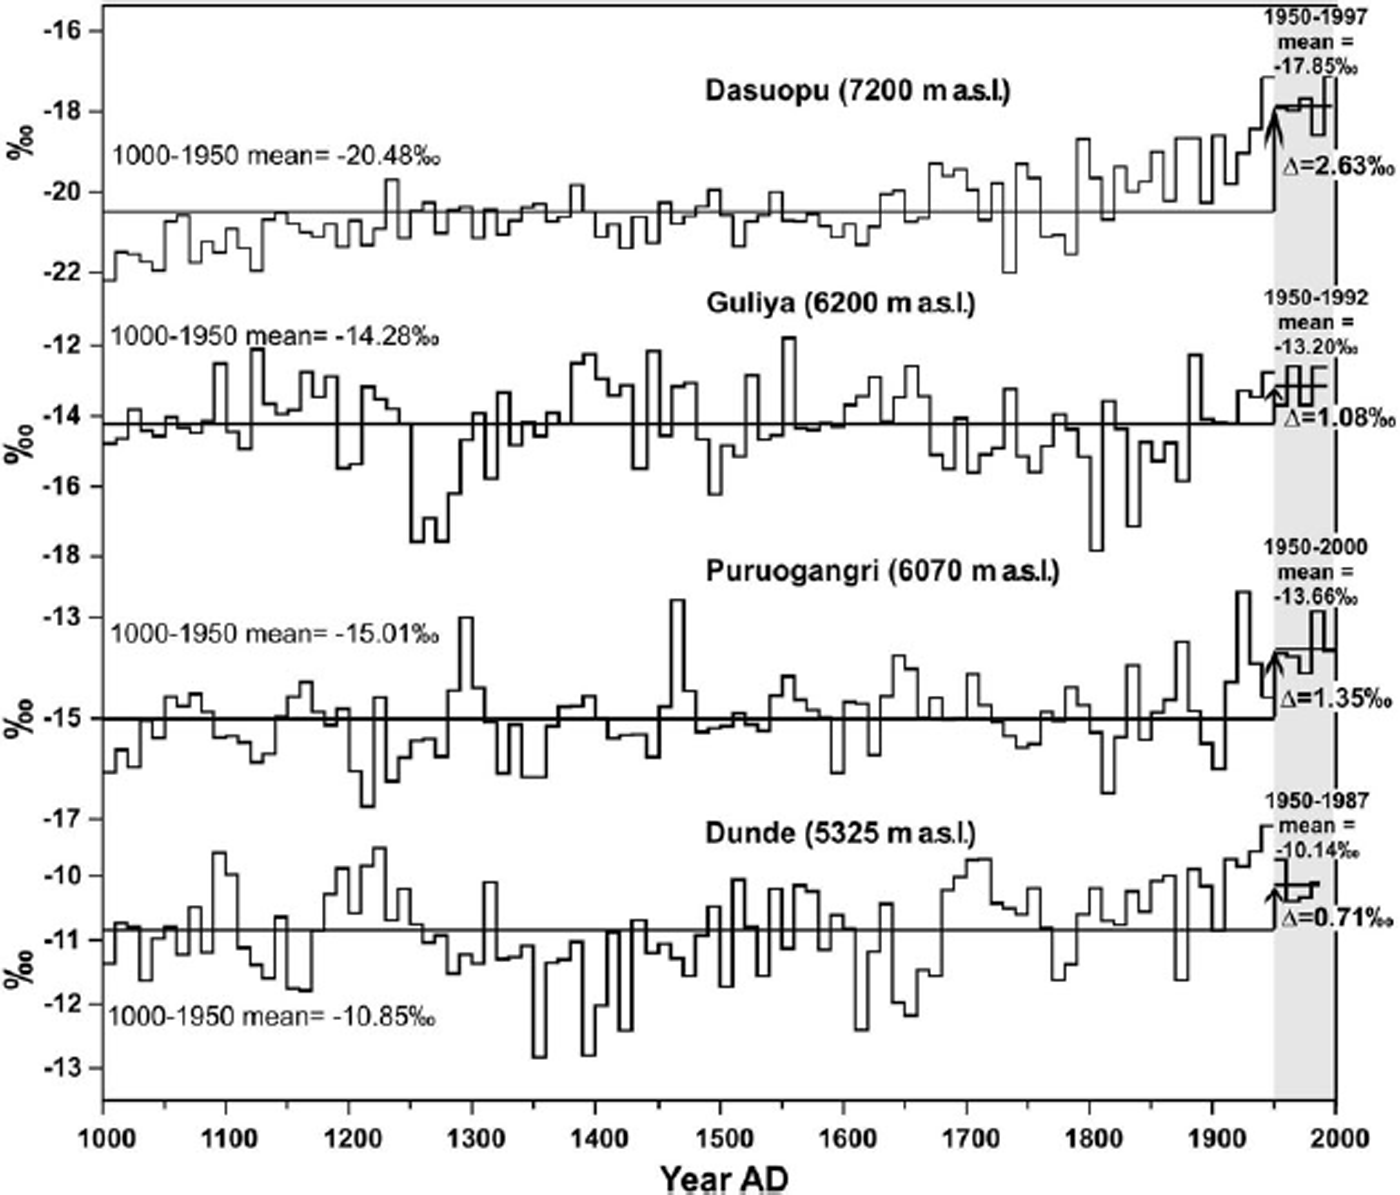
Over the past 25 years the ICPRG has collected ice cores from five sites across the Tibetan Plateau. Figure 6 illustrates the 1000 year record of δ18O variations from four of these ice fields. Naimona’nyi is not included, as recent melting at the glacier surface has removed the upper 40–50 years of the record (Reference KehrwaldKehrwald and others, 2008). The data (Fig. 6) illustrate the effect of the recent warming across the Plateau on the mean δ18O values since AD 1950, including an 18O enrichment that is enhanced with altitude. The average values of δ18O from AD 1000 to AD 1950 are –10.85% for Dunde (5325ma.s.l.), –15.01% for Puruogangri (6070m a.s.l.), –14.28% for Guliya (6200ma.s.l.) and –20.48% for Dasuopu (7200ma.s.l.). From AD 1950 to the top of these four records, the δ18O averages have been increasing relative to the past 950 years, with the greatest enrichment at the highest-elevation site (Dasuopu), presumably where the greatest warming is occurring. These trends are consistent with instrumental temperature records since the 1950s across the Plateau (Reference Liu and ChenLiu and Chen, 2000) as well as with the model predictions of the vertical amplification of temperatures in the tropics (Fig. 5).
1000 year records of δ18O variations, shown as decadal averages, from four Tibetan Plateau ice cores. The means from AD 1000 to AD 1950 are shown independently of the means from AD 1950 to the top of each record. The differences between the 1000–1950 means and the 1950–top means tend to increase with the altitude of the ice-core site.
Recent warming and retreat of tropical alpine ice fields
The rate at which a glacier responds to climate change is inversely proportional to its size. A large glacier will respond more slowly than a small glacier, taking longer to shrink in a warmer/drier climate or to grow in a cooler/wetter climate.
However, some glaciers are also more strongly controlled by ice-flow dynamics (i.e. surging) than by climate variations (Reference HewittHewitt, 1969; Reference Meier and PostMeier and Post, 1987; Reference KargelKargel and others, 2005; Reference VinceVince, 2010). Reference RaymondRaymond (1987) pointed out that the relationship between surging glaciers and climate is poorly understood. The duration of surge cycles may be controlled in part by climatic factors as well as by glacier size and topography, subglacial drainage patterns, glacier area distribution at various elevation ranges and the magnitude of previous surge events. Over sub-decadal timescales, glaciers show rapid changes in response to fluctuations in snowfall amounts as well as temperature, but over multi-decadal timescales temperature tends to be the dominant factor. For example, during the 1990s increased winter snowfall due to a persistently positive phase of the winter North Atlantic Oscillation caused Scandinavian maritime glaciers to advance despite rising temperatures (Reference Nesje, Lie and DahlNesje and others, 2000). However, in 1999, snowfall returned to previous levels while temperatures continued to rise. Those glaciers have since been retreating.
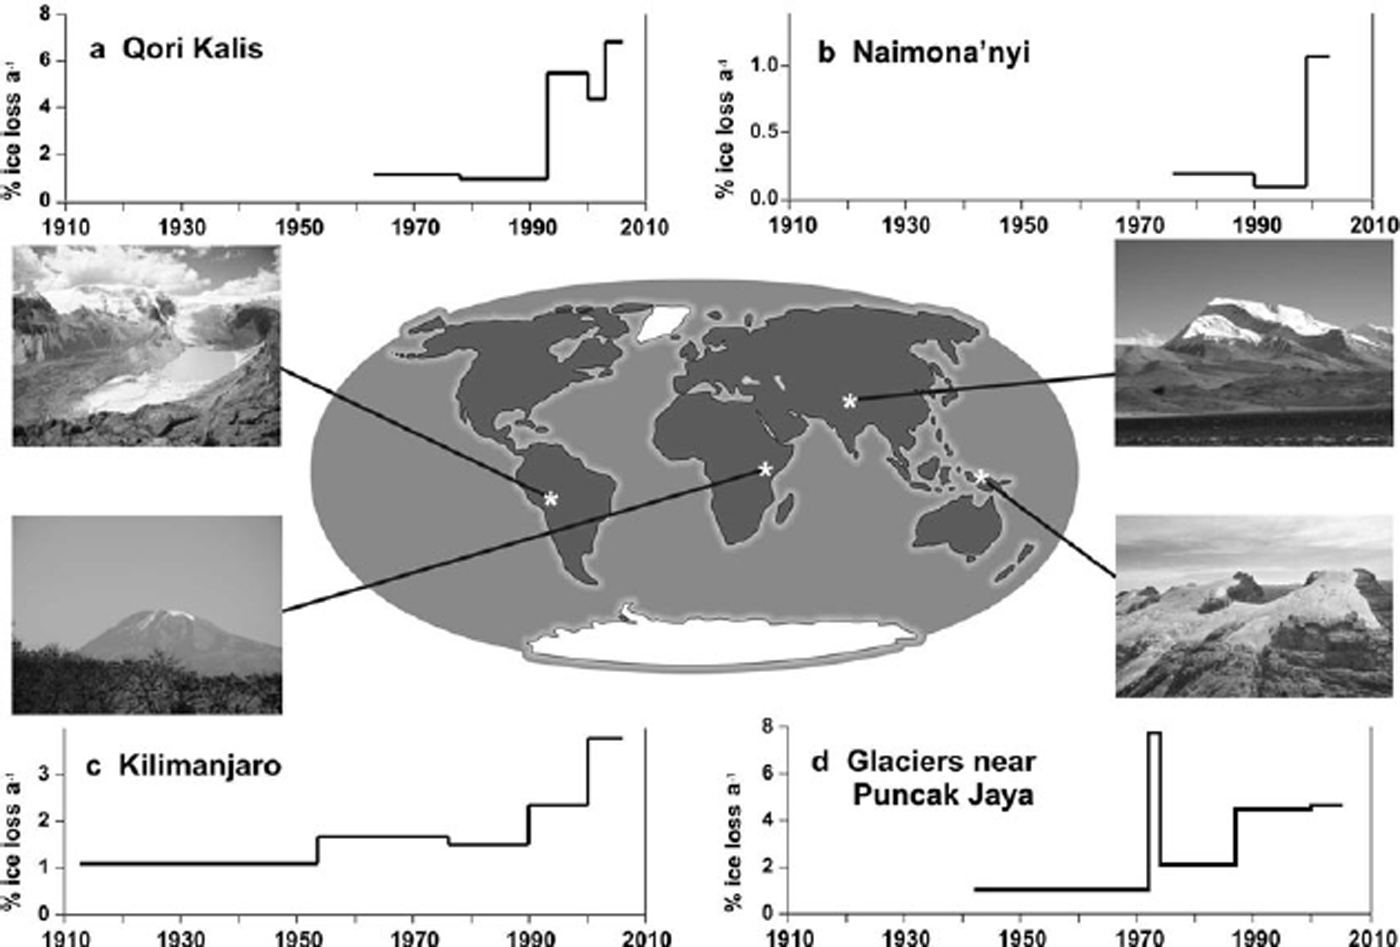
Tropical ice masses are particularly sensitive to small changes in ambient temperatures, as they already exist very close to the melting point. There is mounting evidence for a recent strong warming in the tropics, which is signaled by the rapid retreat and even disappearance of ice caps and glaciers at high elevations. Paleoclimate (δ18O and mass-balance) information from Peruvian and Himalayan glaciers provides strong evidence that precipitation changes are not the primary driver of the recent acceleration of ice retreat in these regions (fig. 5 in Reference ThompsonThompson and others, 2006). Recent research (Reference Cogley and AdamsCogley and Adams, 1998; Reference Dyurgerov and MeierDyurgerov and Meier, 2000; Reference AlversonAlverson and others, 2001; Reference ThompsonThompson and others, 2002, Reference Thompson, Mosley-Thompson, Davis, Lin, Henderson and Mashiotta2003, Reference Thompson2006; Reference Coudrain, Francou and KundzewiczCoudrain and others, 2005; Reference Soruco, Vincent, Francou and GonzalezSoruco and others, 2009) indicates that many tropical ice caps may disappear within the first half of the 21st century if the current rates of retreat continue or accelerate. This acceleration is already well underway on Quelccaya ice cap (Reference ThompsonThompson and others, 2006), Naimona’nyi glacier in the western Himalaya (Reference Ye, Yao, Kang, Chen and WangYe and others, 2006), Kilimanjaro (Reference Thompson, Brecher, Mosley-Thompson, Hardy and MarkThompson and others, 2009) and Puncak Jaya (Reference Klein and KincaidKlein and Kincaid, 2006; Reference KincaidKincaid, 2007), as shown in Figure 7a–d and discussed in more detail below. Glaciers in the Ruwenzori of Uganda (Reference TaylorTaylor and others, 2006) are also disappearing.
Rate of ice loss per year from four tropical glaciers: (a) Qori Kalis, Peru (Reference ThompsonThompson and others 2006), (b) Naimona’nyi, western Himalaya (Reference Ye, Yao, Kang, Chen and WangYe and others, 2006), (c) Kilimanjaro, Tanzania (Reference Thompson, Brecher, Mosley-Thompson, Hardy and MarkThompson and others, 2009), and (d) the glaciers near Puncak Jaya, Papua, Indonesia (Reference Klein and KincaidKlein and Kincaid, 2006; Reference KincaidKincaid, 2007).
Quelccaya ice cap
The retreat of tropical Andean glaciers is widespread and accelerating (Reference Francou, Ribstein, Wagnon, Ramirez, Pouyaud, Huber, Bugmann and ReasonerFrancou and others, 2005; Reference Soruco, Vincent, Francou and GonzalezSoruco and others, 2009). A case in point is Qori Kalis, the largest outlet glacier of Quelccaya ice cap in Peru, which has been evaluated by terrestrial photogrammetry since 1978 (Reference Thompson, Henderson, Mosley-Thompson, Lin, Diaz and MarkgrafThompson and others, 2000b, Reference Thompson2006). These observations, along with a map produced from aerial photographs taken in 1963, have allowed calculations of the changes in both area and volume over the last 47 years. Qori Kalis has been retreating ten times faster in the last 15 years than it did during the first 15 years of measurements, with the rate of retreat accelerating substantially in the 1990s (Fig. 8a). Over the period that we have studied this glacier, its length has decreased with the growth of its proglacial lake (Fig. 8a and b). Since 1991, the surface area of the lake has grown from ~6ha to ~34 ha and in 2004 it was 60 m deep. The growth of this lake is synchronous with the expansion of many lakes around the retreating margins of the entire ice cap. Satellite images (Advanced Spaceborne Thermal Emission and Reflection Radiometer (ASTER), SPOT 1 through 5 and Landsat) taken over the study period not only show that Quelccaya and Qori Kalis have been retreating, but that their rates of area loss are highly correlated (r = 0.92, Fig. 8b). This current glacier contraction is unusual in the perspective of the last 5000 years, as revealed by radiocarbon dates on rooted soft-bodied plants recently exposed along the retreating ice margins (Reference ThompsonThompson and others, 2006; Reference Buffen, Thompson, Mosley-Thompson and HuhBuffen and others, 2009).
(a) Changes in the length and area of Quelccaya’s outlet glacier, Qori Kalis, since 1963, and the concomitant growth of the proglacial lake. The inset in the upper right corner demonstrates that the retreat of Qori Kalis is consistent with that of other Peruvian glaciers. (b) The comparison of the normalized areas of Quelccaya ice cap and Glaciar Qori Kalis shows that they have been shrinking at rates that are significantly correlated. Courtesy of T. Albert.

Ice-core records also provide a long-term average net balance for these ice fields. The Summit Dome core from Quelccaya ice cap was drilled in 2003 and yields an average net balance over the last 1000 years of ~1.10mw.e., while the mean for the last 100 years is ~1.20mw.e. The impact of this small increase in precipitation is more than offset by that from the recent increase in temperature, since both Glaciar Qori Kalis and Quelccaya ice cap are not only retreating but their rates of retreat are accelerating.
The Tibetan Plateau, the Himalaya and Naimona’nyi glacier
The Tibetan Plateau is a very large and climatologically and topographically complex region. Meteorological records from the Plateau and the Himalaya are scarce and of relatively short duration, most beginning in the mid-1950s to early 1960s; however, those that do exist show that surface temperatures are rising faster at higher elevations than at lower elevations (Reference Liu and ChenLiu and Chen, 2000). On average, the annual temperature on the Plateau has been increasing at a rate of 0.16˚C per decade, with winter temperatures rising 0.32˚C per decade.
Among the ~15 000 glaciers in the Himalaya (Reference Kotlyakov and KotlyakovKotlyakov, 1996; Reference Ding, Liu, Li and ShangguanDing and others, 2006; Reference Cruz, Parry, Canziani, Palutikof, van der Linden and HansonCruz and others, 2007), the largest are responding to changes that occurred 100 years ago. Over the last quarter-century our research program has investigated glaciers across the Tibetan Plateau and on the Tibetan side of the Himalaya. From the Qilian Shan on the northeast side of the Plateau, to the Kunlun Shan in the west, to the northern slopes of the central and western Himalaya, all the glaciers and ice caps that we have studied are retreating. Glaciologists at the Institute of Tibetan Plateau Research in Beijing have been monitoring 612 glaciers across the high Asian region since 1980. They found that from 1980 to 1990, 90% were retreating, and from 1990 to 2005 this increased to 95% (Reference Yao, Pu, Lu, Wang and YuYao and others, 2007). During the analysis of ice cores recovered in 2006 from Naimona’nyi glacier in the western Himalaya, we discovered the absence of radioactive bomb horizons from the early 1950s and 1960s, which indicates that over 50 years of ice accumulation had been lost from the surface (Reference KehrwaldKehrwald and others, 2008). The mass loss documented in the ice-core records from Naimona’nyi is consistent with the integrated glacier spatial retreat data from ASTER and the Landsat series of satellite imagery at four different times (1976, 1990, 1999 and 2003) (Reference Ye, Yao, Kang, Chen and WangYe and others, 2006), from which we conclude that the rate of retreat has accelerated greatly in recent years (Fig. 7b). From 2003 to 2009 the average ice loss from the Asian high ice fields, as measured by Gravity Recovery and Climate Experiment (GRACE) satellite observations, had accelerated twice as fast as in the four prior decades, but the loss was not consistent over space and time (Reference Matsuo and HekiMatsuo and Heki, 2010). Ice retreat in the Himalaya slowed slightly over this period, while loss in the mountains to the northwest increased markedly.
Thus, based on the surface temperature measurements, satellite-based studies, the ground-based studies on glaciers and ice-core results, the evidence is mounting for a persistent warming over the Tibetan Plateau, particularly in the Tibetan Himalaya, resulting in an inevitable loss of ice in the high mountain ranges.
Kilimanjaro
The total surface area of the ice fields on top of Kilimanjaro in Tanzania has been decreasing since the first known photograph was taken in 1912. The three remaining ice fields on the summit and on the slopes (Northern Ice Field, Southern Ice Field and Furtwängler Glacier) are shrinking laterally and thinning rapidly. Summit ice cover (areal extent) decreased ~1% a–1 from 1912 to 1953 and ~2.5% a–1 from 1989 to 2007 (Fig. 7c). Of the ice cover present in 1912, 86% has disappeared, and 27% of that present in 2000 is now gone. Furtwängler Glacier has thinned ~50% between 2000 and 2009 (Reference Thompson, Brecher, Mosley-Thompson, Hardy and MarkThompson and others, 2009). Ice-volume changes (2000–07) calculated for the Northern Ice Field and Furtwängler Glacier reveal that they are losing nearly equivalent ice volumes (46% vs 54%) due to thinning and lateral shrinking, respectively. Although ice loss on Kilimanjaro has been estimated by aerial photography and satellite imagery (Reference ThompsonThompson and others, 2002, Reference Thompson, Brecher, Mosley-Thompson, Hardy and Mark2009; Reference Cullen, Mölg, Kaser, Hussein, Steffen and HardyCullen and others, 2003), ground observations are essential for verifying and refining the actual extent of the changes. As documented in Reference Thompson, Brecher, Mosley-Thompson, Hardy and MarkThompson and others (2009), aerial views alone could be underestimating ice loss by up to 50%.
Glaciers near Puncak Jaya, Papua, Indonesia
Several small glaciers exist in the vicinity of Puncak Jaya (4˚05’ S, 137˚10’ E; 4884ma.s.l.) in Papua on the island of New Guinea. Systematic studies were first conducted on these glaciers in the 1970s (Reference AllisonAllison, 1975; Reference Allison, Peterson, Hope, Peterson, Radok and AllisonAllison and Peterson, 1976; Reference Allison and KrussAllison and Kruss, 1977). In 1972, mass-balance measurements made above 4625m on Carstensz Glacier ranged from 1.3 to 2.4 ma–1w.e., with a mean value of 1.7mw.e. Measurements made from IKONOS satellite images (Reference Klein and KincaidKlein and Kincaid, 2006) show that the surface area of the ice near Puncak Jaya decreased from 2.326 to 2.152 km2, or by 7.48%, between 2000 and 2002. From 1850 to 2005, these glaciers retreated from 19.3 km2 in area to 1.72 km2, amounting to a 91% surface area loss since the maximum extent during the Little Ice Age (Reference KincaidKincaid, 2007). Between 1972 and 1987, mean monthly atmospheric temperature was the only climate variable that changed in a statistically significant way (+0.24˚C), with a magnitude great enough to strongly affect ice loss on these glaciers. Moreover, the rate of retreat accelerated from 1988 to 2005 while precipitation actually increased. This may be due in part to the amount of precipitation now falling as rain rather than as snow. Interestingly, from 1913 to the present, the percent of ice loss on these glaciers is consistent with that of Kilimanjaro, which has a comparable ice volume but is located in a much drier tropical environment. In May and June 2010, the ICPRG successfully recovered two ice cores to bedrock (30 and 32 m long) and a third core 26m long from the Northwall Firn near Puncak Jaya. We anticipate that these cores will provide a climate history against which the current ice retreat can be assessed.
Impacts on Water Resources
The loss of glaciers and ice caps in the tropical Andes of Peru, where over 70% of the world’s tropical glaciers reside, as well as those throughout the Himalaya will have the greatest direct impact on local populations through changes in water supplies, particularly in the dry season. The glacial-fed streams in the Andes are essential for hydroelectric production, irrigation and municipal water supplies. Beside the larger-scale impacts that are yet to unfold, people who live in areas affected by the changes in these glaciers are already beginning to experience the consequences. Our personal observations around Quelccaya ice cap provide a clear example. In 1974 when we first visited the ice cap we chose a camp site that was located centrally on the western margin as it had a stream that provided a continuous water supply for the camp. During our repeated visits throughout the 1970s we often saw the stream freeze overnight. As we continued to visit Quelccaya regularly from 1974 to 2006, this stream grew in size and a new lake formed above the camp (Fig. 9a). When we visited the site in 2007 we were surprised to find that the base-camp stream was dry and the lake had drained (Fig. 9b) to the south under the retreating ice. Consequently the valley to the south of camp was flooded, while the valley to the north was quite dry. Since then the alpaca moss Distichia muscoides (Fig. 9c) has died and the local Quechua people can no longer graze their livestock there. Moreover, the formation of these high-altitude glacier lakes represents a new geologic hazard for the people who live in the valleys below. Figure 10a shows the Qori Kalis valley in 2005 and Figure 10b shows the same valley in March 2006 after an avalanche from the ice cap into the lake caused it to breach the moraine dam, drowning grazing alpaca in the valley below. This new geologic hazard did not exist until 1991 when the lake first formed. The Quechua people (Fig. 11), who already live at a basic subsistence level, are being adversely impacted by a dynamic and rapidly changing landscape as a result of the melting ice cap and its outlet glaciers.
(a) Lakes and stream above Quelccaya base camp in 2006. A new lake formed above the base camp (A, black oval) after 1983 but it drained in 2007 (b), flooding the valley to the south and leaving the valley to the north dry (B, white oval in (a)). (c) Large patches of alpaca moss, a plant that requires a continuous supply of water to survive, which are now dying around the base camp (B, white oval in (a)) due to stream diversion.

The Qori Kalis valley in (a) July 2005 and (b) July 2006. An avalanche of ice from the glacier in March 2006 caused the proglacial lake to breach the moraine and flood the valley below. The sediment deposits resulting from the flood are visible in (b) at the end of the lake.

This Quechua girl is a member of an indigenous southern Peruvian society that survives by subsistence farming and alpaca herding. Their lives and livelihoods, which are difficult under the best of conditions, are endangered by the loss of water resources under changing climate conditions.

Conclusions
Tropical glaciers integrate and respond to most key climatological variables such as temperature, precipitation, cloudiness, humidity and radiation. Both empirical meteorological data (Reference Bradley, Keimig, Diaz and HardyBradley and others, 2009) and longterm paleoclimate histories from stable-isotopic ratios and net balance records (Reference ThompsonThompson and others, 2006) document the warming of temperatures and increasing FLHs over the past 50 years that are occurring simultaneously with the retreat of the tropical ice caps. Individually, the mass balance of any glacier may be influenced by regional factors, such as deforestation. However, a common driver that is currently affecting tropical glaciers is the rising temperatures that are becoming more pronounced with increasing elevation. We need new regional circulation models that better reflect this condition.
Certainly there is much research that still needs to be conducted in the remote parts of the world. There are very few thickness profiles available from these glaciers, so it is very difficult to quantify the ice volume, and hence the water volume, retained in the world’s mountain ranges. However, we can deduce that there is enough water in reserve to contribute to short-term sea-level rise within the next century if the current rate of mountain glacier retreat continues or accelerates (Reference MeierMeier and others, 2007; Reference Bahr, Dyurgerov and MeierBahr and others, 2009). Moreover, the melting of these glaciers near populated areas is already impacting the lives and livelihoods of the people who depend on the meltwater for crops and livestock and whose lives are endangered when glacial lake dams are breached.
Acknowledgements
We thank all the field and laboratory team members, many from the Byrd Polar Research Center, who have worked so diligently over the years to acquire these ice cores and extract their preserved climate histories. Funding has been provided by the US National Science Foundation’s Paleoclimate Program Award ATM-0502476 and ATM-08235863 and The Ohio State University’s Climate, Water and Carbon Program. This is Byrd Polar Research Center Contribution No. 1403.


