

Belgium was one of the few European countries lacking a systematic survey on the dietary habits of its inhabitants for many years. The last national study that included a dietary assessment was the Belgian Interuniversity Research on Nutrition and Health(1) study, held from 1980 to 1985. However, as dietary habits are changing continuously over time, it is important to be aware of current dietary patterns in order to develop effective policies on nutrition. Therefore, in 2004, the Ministry of Public Health, Environment and Food Safety initiated the first Belgian National Food Consumption Survey (BNFCS). One of the aims of the BNFCS is to monitor the adequacy of food intakes within the Belgian population. The objective of the present paper is to compare the usual food group intakes with the food-based dietary guidelines (FBDG) and to determine the proportion of the population meeting these recommendations. Differences in intakes between different subgroups of the population (as defined by sociodemographic and age variables) are also investigated.
FBDG were developed(2) and used internationally to express the principles of a balanced diet in terms of foods(Reference Aranceta and Serra-Majem3–Reference Moschandreas and Kafatos10) and to reduce the prevalence of obesity(Reference McCarthy, Robson, Livingstone, Kiely, Flynn, Cran and Gibney11) and diet-related diseases. These guidelines are a more practical tool compared with the nutrient reference values, set at (inter-) national level(12, 13). In Belgium, a food triangle and a food pyramid were developed by the regional health authorities which are responsible for health promotion(Reference Absolonne, Sirjacobs, Guggenbühl and Colin14, 15).
Although both guidelines are similar, in the present paper food group intakes are compared with the recommendations proposed by the Flemish food triangle, since the latter describes the guidelines in terms of both the number of pieces and the amount (grams or millilitres). According to the food triangle a healthy diet is based on balance, variation and moderation.
The triangle is composed of eight food groups: water; grains and potatoes; vegetables; fruits; dairy (including cheese) and Ca-enriched soya products; meat, fish, eggs, legumes, nuts and meat substitutes; fats; and energy-dense, nutrient-poor foods.
The water food group includes water, coffee, tea and broth. All groups, except energy-dense, nutrient-poor foods, are necessary for a healthy diet. The bigger the surface of a particular food group in the triangle, the bigger the daily consumption of that food group should be relative to the other food groups.
In 2005 a new model was developed which takes physical activity into account as well(16). In this newly proposed model the dietary guidelines remain the same but an additional recommendation for physical activity, expressed by the base of the triangle, is added. According to this ‘active’ model, a person should accumulate at least half an hour of physical activity of at least moderate intensity on most if not all days of the week by performing the activity for at least 10 min at a time.
Design and methods
The study design of the present survey followed to a large extent the recommendations of the European Food Consumption Survey Method (EFCOSUM) project(Reference Brussaard, Johansson and Kearney17), which envisaged the formulation of recommendations to harmonise the methodology of collection of food consumption data across Europe. The study was approved by the ethical committee of the Scientific Institute of Public Health. An in-depth description of the study design and the methodology used is given elsewhere(Reference De Vriese, De Backer, De Henauw, Huybrechts, Kornitzer, Leveque, Moreau and Van Oyen18).
Sampling design
A representative sample of the Belgian population aged 15 years and older was randomly selected from the National Register. The sample size was defined by sample size calculations based on an estimated mean intake of different nutrients to fall within a 5 % interval around the true population mean with a 95 % probability.
The sampling method followed a multistage stratified procedure. The strata were categorised by four age groups (15–18 years, 19–59 years, 60–74 years, ≥75 years) and both genders. Belgium was divided into three regions and eleven provincial strata.
The participants were sampled in a way that the population densities of the region, the provinces and the municipalities were taken into account. For each selected individual, three individuals were selected beforehand who could serve as replacements in case the selected individual would not participate in the survey. The selected individuals and their substitutes lived in the same statistical sector of the same municipality, in a household of the same size and had the same age and gender.
Institutionalised persons, individuals unable to speak one of the three national languages (Dutch, French or German) and individuals physically or mentally unable to be interviewed were excluded.
Of the 7543 invited and contactable individuals, 42 % participated in the study. Participation rate was 40·6 % for men 43·4 % for women. The main reasons for not participating were lack of interest (54 %), lack of time (17 %) and health problems (12 %).
Study design
Participants were invited to take part in the study by a letter and leaflet. They were visited twice by a trained dietitian. At the first visit the participants completed a face-to-face questionnaire about general health, lifestyle and physical activity. Physical activity was evaluated according to the International Physical Activity Questionnaire (IPAQ)(19). A 24 h recall assessed the previous day’s dietary intake. During the second visit, two to eight weeks later, a second 24 h recall was performed. In the time between these two visits, participants were asked to complete an FFQ. The dietitians checked the questionnaires for completeness. The one-year survey was distributed equally over all seasons and days of the week.
Dietary assessment
During the 24 h recall the participants reported the types and quantities of all foods and beverages consumed during the preceding day. To obtain standardised 24 h recall interviews, the validated software package EPIC-SOFT was used, which is designed for uniform data collection in the ten countries participating in the European Prospective Investigation into Cancer and Nutrition (EPIC)(Reference Slimani and Valsta20).
The software enables very detailed descriptions and quantities of foods and supplements consumed and recipes used to be obtained in a standardised way. Quantification of the consumed foods is supported by a picture book that contains photographs of foods in different portion sizes.
All foods and ingredients reported were assigned to the appropriate triangle group and the quantity of all food groups consumed was expressed in g/d. To allow the comparison of portion sizes with the FBDG, the portion size of some reported foods had to be converted into an equivalent of another food using conversion factors proposed in the food guide(15). For rice, for example, the portion size had to be converted to an equivalent portion size of potatoes as the recommendation is expressed in g potatoes/d.
Statistical analyses
Because of day-to-day variations in individual food intakes, a large number of days of intake data are typically needed to determine usual food intakes. It is seldom feasible to collect these required long-term data for each person. Therefore, a statistical modelling method was needed that accounted for within-individual variation in food intakes while requiring relatively few days of intake data per individual. The present study used the Nusser method(Reference Nusser, Carriquiry, Dodd and Fuller21), which is recommended by the Institute of Medicine(22). With this method the total variance is adjusted for the intra-individual variances of day-to-day variability. In addition, data were transformed to a normal distribution. This statistical method for estimating usual intake distributions and the proportion below or above defined cut-off values was developed at Iowa State University(Reference Nusser, Carriquiry, Dodd and Fuller21, Reference Guenther, Kott and Carriquiry23). The software program used to carry out the method was Software for Intake Distribution Estimation (C-side)(24).
The reported food intakes were weighted and adjusted for interview day, season and, in the case of education level, adjusted for the age and sex distribution of the Belgian population.
To assess the percentage of persons consuming certain foods on a daily basis, FFQ data were used.
The IPAQ recommendations were used to calculate the percentage of persons physically active enough to experience health-enhancing effects(19). According to IPAQ, health-enhancing physical activity means vigorous-intensity activity on at least 3 d of the week achieving a minimum total physical activity of at least 1500 MET-min/week, or 7 d or more of any combination of walking, moderate-intensity or vigorous-intensity activities achieving a minimum total physical activity of at least 3000 MET-min/week. The MET (metabolic energy equivalent task) for an activity is a multiple of the RMR and MET-min are equivalent to kilocalories for a person weighing 60 kg.
Results
Mean usual daily intake of the major food groups
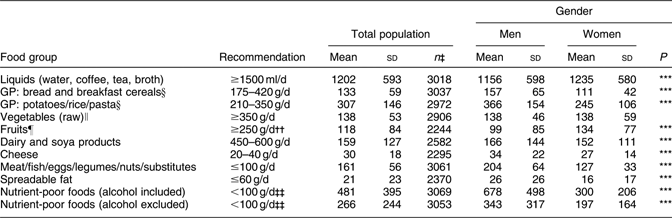
The mean daily intake of beverages (water, coffee, tea and broth) was 1202 (sd 593) ml. The youngest age group had the lowest daily consumption of beverages (P < 0·001) (Table 1).
Mean (SD) food intakes† (g/d) of the Belgian population, by age group, compared with the general recommendations of the Flemish food triangle(15)

GP, grains and potatoes.
Significance level of the differences between the four age groups, according to ANOVA (two-sided): *P < 0·05, **P < 0·01, ***P < 0·001.
†Mean food intakes are adjusted for interview day and season.
‡Number of persons consuming items of the specified food group at least once (of a total of 3083).
§These products belong to the same general food group (grains and potatoes) but two different recommendations were formulated because potatoes are usually consumed as part of a hot meal and thus practically can only be interchanged with pasta or rice, while bread and breakfast cereals are usually consumed as part of a cold meal and thus practically cannot be interchanged with potatoes, rice or pasta.
∥Excluding vegetable soups and juices (soups and juices cannot replace vegetables in terms of fibre, vitamin and mineral content).
¶Excluding fruit juices and olives (however, the recommendation states that maximum 1 piece of fruit (=125 g) per day may be interchanged with juice).
††The recommended intake for adolescents in the 15–18 year age group is ≥375 g/d.
‡‡According to the recommendation the intake should approach 0 g/d.
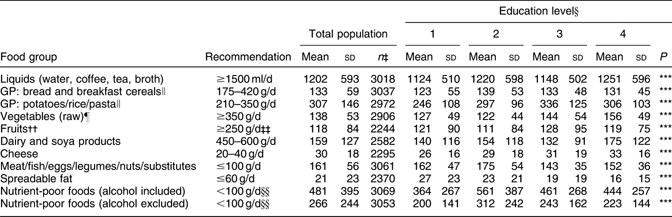
The majority of the Belgian population (82·3 %) consumed bread products or breakfast cereals on a daily basis and more than half of them (58·6 %) consumed potatoes, rice or pasta on a daily basis. The mean daily intake of bread and breakfast cereals was 133 (sd 59) g while the average intake of potatoes, rice and pasta was 307 (sd 146) g. Men consumed more of these starchy products than women (P < 0·001) (Table 2) and the consumption of these products decreased with age (P < 0·001) (Table 1).
Mean (SD) food intakes† (g/d) of the Belgian population, by gender, compared with the general recommendations of the Flemish food triangle(15)
GP, grains and potatoes.
Significance level of the differences between men and women according to the t test (two-sided): *P < 0·05, **P < 0·01, ***P < 0·001.
†Mean food intakes are adjusted for interview day and season.
‡Number of persons consuming items of the specified food group at least once (of a total of 3083).
§These products belong to the same general food group (grains and potatoes) but two different recommendations were formulated because potatoes are usually consumed as part of a hot meal and thus practically can only be interchanged with pasta or rice, while bread and breakfast cereals are usually consumed as part of a cold meal and thus practically cannot be interchanged with potatoes, rice or pasta.
∥Excluding vegetable soups and juices (soups and juices cannot replace vegetables in terms of fibre, vitamin and mineral content).
¶Excluding fruit juices and olives (however, the recommendation states that maximum 1 piece of fruit (=125 g) per day may be interchanged with juice).
††The recommended intake for adolescents in the 15–18 year age group is ≥375 g/d.
‡‡According to the recommendation the intake should approach 0 g/d.
Only 37·7 % of the Belgian population consumed vegetables on a daily basis. The mean daily intake of vegetables was 138 (sd 53) g. There was no real difference in daily intake by gender (P > 0·05) (Table 2), although women consumed vegetables more frequently than men (daily consumers: 43·8 % v. 31·3 %). The youngest and the oldest age groups consumed the least vegetables (P < 0·001) (Table 1). Persons with a higher secondary or higher education consumed more vegetables than persons with a lower secondary or vocational education (P < 0·001) (Table 3).
Mean (SD) food intakes† (g/d) of the Belgian population, by education level, compared with the general recommendations of the Flemish food triangle(15)
GP, grains and potatoes.
Significance level of the differences between the four education level groups according to ANOVA (two-sided): *P < 0·05, **P < 0·01, ***P < 0·001.
†Mean food intakes are adjusted for interview day, season and the age and sex distribution of the Belgian population.
‡Number of persons consuming items of the specified food group at least once (of a total of 3083).
§Education level: 1 = no education or only lower secondary education; 2 = vocational education; 3 = higher secondary education; 4 = higher education.
∥These products belong to the same general food group (grains and potatoes) but two different recommendations were formulated because potatoes are usually consumed as part of a hot meal and thus practically can only be interchanged with pasta or rice, while bread and breakfast cereals are usually consumed as part of a cold meal and thus practically cannot be interchanged with potatoes, rice or pasta.
¶Excluding vegetable soups and vegetable juices (soups and juices cannot replace vegetables in terms of fibre, vitamin and mineral content).
††Excluding fruit juices and olives (however, the recommendation states that maximum 1 piece of fruit (=125 g) per day may be interchanged with juice).
‡‡The recommended intake for adolescents in the age group 15–18 years is ≥375 g/d.
§§According to the recommendation the intake should approach 0 g/d, but this is not realistic.
Less than half of the population (47·3 %) consumed fruits on a daily basis. The mean daily intake of fruits was 118 (sd 84) g. Women consumed fruits more frequently than men (daily consumers: 56·1 % v. 38·0 %) and their mean daily fruit consumption was higher (P < 0·001) (Table 2). Fruit consumption increased somewhat with increasing age (P < 0·001) (Table 1).
About two-thirds of Belgians consumed dairy or Ca-enriched soya products on a daily basis, whereas 79·3 % of the Belgian population never consumed soya products. The mean daily intake of dairy and soya products (cheeses excluded) was 159 (sd 127) g. Women consumed these products more frequently than men (daily consumers: 77·0 % v. 71·2 %) but their mean daily intake was somewhat lower (P < 0·001) (Table 2). The average daily intake of dairy and soya products was highest among the youngest age group (P < 0·001) (Table 1).
Less than a quarter of the population consumed cheese on a daily basis but the average daily intake of cheese was 30 (sd 18) g, which is higher than the lower limit of the recommendation (20 g/d). The mean daily intake of cheese was somewhat lower for women than for men (P < 0.001) (Table 2) and increased with education level (P < 0·001) (Table 3).
In total 88·9 % of the population consumed meat, fish, eggs, legumes, nuts or meat substitutes at least once a day. The mean total daily intake amounted to 161 (sd 56) g. The mean daily intake of fish and crustaceans was 24 (sd 14) g. Men consumed more of these products than women (P < 0·001) (Table 2). Persons with a lower education (lower secondary or vocational) consumed more of these products than those with a higher education (P < 0·001) (Table 3).
More than half of the respondents used spreadable fats on a daily basis. The mean daily intake was 21 (sd 23) g and was lower for women than men (P < 0·001) (Table 2). The intake of spreadable fats increased with age (P < 0·001) (Table 1) and decreased with education level (P < 0·001) (Table 3).
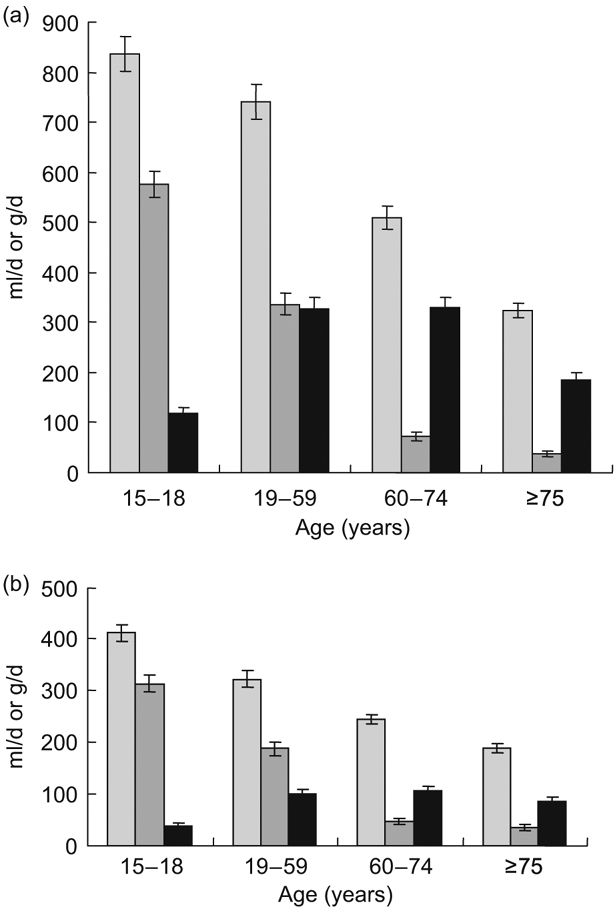
Nutrient-poor, energy-dense foods are not necessary in a balanced diet and are discouraged. However, the mean daily intake of these products was 481 (sd 395) g (alcohol included) and 266 (sd 244) g (alcohol excluded). Women consumed fewer energy-dense, nutrient-poor foods than men (P < 0·001) (Table 2). Persons with the lowest education level had the lowest consumption of these foods compared with the other education levels (P < 0·001) (Table 3). The consumption of energy-dense, nutrient-poor foods decreased clearly with age (P < 0·001) (Table 1). In particular, consumption of soft drinks was high within the 15–18 year age group (Fig. 1) and decreased with age. Men consumed more alcohol than women and the consumption of alcohol was lowest in the youngest and the oldest age groups (Fig. 1).
Daily intake (ml/d or g/d) of total nutrient-poor, energy-dense foods (░), soft drinks (▒) and alcoholic beverages (▪) for the male (a) and female (b) Belgian population by age group. Values are means with their standard deviations represented by vertical bars
Percentage of persons reaching the recommendations
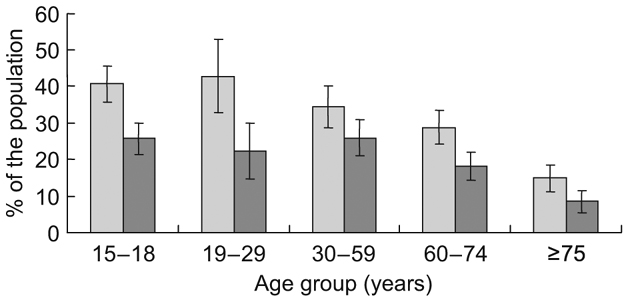
The base of the food triangle (Fig. 2) describes the recommendation for physical activity. According to the IPAQ guidelines, the major part of the population was inactive (41·1 %) or only minimally active (31·2 %). Only 27·7 % of the population was physically active enough to experience health-enhancing effects. The percentage of persons physically active enough to experience health-enhancing effects was higher for men than for women and was lowest among the oldest age group (Fig. 3).
The Flemish ‘active’ food triangle and the extent to which the average food intakes deviate from the recommendations. If the Belgian population attained all recommendations, all areas of the observed food triangle would have the same surface as the areas of the recommended food triangle. © VIG

Percentage of the Belgian population (░, men; ▓, women) physically active enough to experience health-enhancing effects, by age group. Values are means with their standard deviations represented by vertical bars
The mean daily intake of beverages (water, broth, coffee and tea) amounted to 80 % of the recommended intake. This recommendation was met by only 26·2 % of the Belgian population. Only 2·8 % of the men in the youngest age category (15–18 years) reached this recommendation.
Of the Belgian population 20·7 % met the recommendation of eating at least 175 g bread or breakfast cereals daily. Fewer women met this recommendation (7·3 %) than men (34·2 %). The majority of the Belgian population (72·9 %) reached the recommendation of eating at least 210 g potatoes, rice or pasta daily. Younger age groups met these recommendations better than the older age groups.
The mean intake of vegetables was inadequate (138 g/d) and far below the recommended intake of at least 350 g/d. Only one in 1000 persons met the recommendation. Even when vegetable soups and juices were included, only 13·0 % of women and 8·8 % of men complied with this recommendation. In the 15–18 year age group hardly anyone met the recommendation, even after including soups and juices.
The same applied for fruit consumption: the mean intake hardly reached 118 g/d while the lower limit of the recommendation is 250 g/d. Only 7·6 % of the population met this recommendation. Adolescents (15–18 years) are recommended to consume at least 375 g fruit daily. None of them met this recommendation. When fruit juices were included, only 21·6 % of the general population met the recommendation (250 g/d).
Only 3·4 % of the population met the recommendation of consuming at least 450 g dairy or Ca-enriched soya products daily. The mean daily intake of dairy and soya products was only 35 % of the lower limit of the recommendation.
However, the recommendation for cheese intake was more easily met: 68·1 % of the population consumed at least 20 g cheese daily but a quarter of the population exceeded the recommendation by eating more than 40 g/d. Men in particular exceed the recommendation (32·3 % v. 17·2 % for women).
The mean intake of meat, fish, eggs and meat substitutes exceeded the upper limit of the recommendation by 1·6 times. Only 11·9 % of the population met the recommendation and consumed less than 100 g of these products daily. Nevertheless, more than 20 % of women had an intake lower than 100 g/d and this amounted to 44·2 % in the age group 15–18 years.
The mean intake of fish and crustaceans was below the recommended daily intake of 30 g/d. Nearly 70 % of the Belgian population did not meet this recommendation. The female population was most at risk as nearly 75 % of women did not consume enough fish or crustaceans.
Regarding fats, a comparison is possible only with the recommended intake for spreadable fats (maximum of 5 g per slice of bread). In fact, the recommendation states that people should moderate their fat consumption. Compared with the upper limit of bread consumption (420 g/d), only 6·1 % of the population exceeded the recommendation of using more than 60 g spreadable fats/d.
Because nutrient-poor, energy-dense foods are not necessary for a healthy diet, the recommended daily intake is set at 0 g/d. The majority of the population (92·0 %) consumed more than 100 g of these products daily and 36·1 % consumed more than 500 g/d. Without including alcohol, these percentages are 75·9 % and 13·2 %, respectively.
Discussion
Main results: food intakes deviate from recommendations
Several major findings have emerged from the present study. Most importantly, the overall food intake of the Belgian population does not comply with the FBDG. The consumption of food products from the triangle tip is excessive while the average daily portions consumed from all other groups, except for meat products and substitutes, cheese, potatoes, rice and pasta, are below the recommendations.
The percentage of the population complying with the different food-based recommendations is low. With the exception of spreadable fat, cheese and potatoes/rice/pasta, not one of the recommendations is met by even half of the population.
For vegetables, fruits, dairy products and energy-dense, nutrient-poor foods, the percentage of the population meeting the recommendations is below 10 %. It should be noted that these apparent differences between intake and recommendations could be due to a certain extent to inadequate reporting (e.g. under-reporting). The percentage of energy under-reporting, using the equation of Goldberg et al.(25), is 14 % for women and 26 % for men.
Fruit and vegetable consumption is lowest in the youngest age group although their recommended fruit intake is higher than for other age groups. Their consumption of energy-dense, nutrient-poor foods, in particular soft drinks, is higher than in the other age groups. However, adolescents consume more potatoes, pasta and dairy products than the older age groups and they use less spreadable fats. In a study on Flemish adolescents (13–18 years) in 1997, it was found that their macronutrient intakes deviated significantly from the recommendations(Reference Matthys, De Henauw, Devos and De Backer26) and that their nutritional profile could be substantially improved by decreasing the portion sizes of fresh meat, high-fat margarine, high-fat cheese, pre-prepared baked goods, snack foods and processed foods including fast foods(Reference Matthys, De Henauw, Bellemans, De Maeyer and De Backer27).
There are also some gender differences: men consume more animal products like meat, fish, eggs, spreadable fats and dairy products, and more starchy products than women. Women consume more fruits.
Education level differences are only minor. Vegetable and cheese intake increases with education level, while the intake of spreadable fat and meat products decreases with education level.
Physical activity in Belgium is low: only about a quarter of the population is active enough to experience health-enhancing effects.
Comparison with other studies
In 2003 a dietary survey was organised in The Netherlands among 19–30-year-olds (n 750). As in the BNFCS, two 24 h recalls were taken and EPIC-SOFT was used(Reference Hulshof and Ocke28). The vegetable consumption in Belgium (age group 19–29 years) was low but still higher than in The Netherlands (125 (sd 43) g/d v. 100 (sd 68) g/d in The Netherlands). The fruit intake in Belgium was 85 (sd 69) g/d v. 98 (sd 109) g/d in The Netherlands. However, there is a noticeable difference in dairy consumption: the dairy consumption in Belgium (212 (sd 154) g/d) was more or less half of the dairy consumption in The Netherlands (391 (sd 297) g/d), but the cheese consumption was about the same (29 (sd 19) g/d v. 32 (sd 31) g/d for The Netherlands).
In France, a National Nutrition and Health Survey was implemented in 2006 among participants aged 18–74 years (n 3115)(29). Three randomly distributed 24 h recalls were used for dietary intake collection. According to the French recommendation for fruit and vegetable intake, at least 400 g should be consumed daily. Some 42·8 % of the French population complied with this recommendation. More women complied with this recommendation than men and, for both genders, the percentage of persons complying with this recommendation increased with age.
The consumption of vegetables, fruits, dairy products, soya products, fat and meat was compared among ten European countries participating in the EPIC study(Reference Agudo, Slimani and Ocke30–Reference Keinan-Boker, Peeters and Mulligan34). Subjects were 35–74 years old (n 35 955). Southern countries had the highest fruit and vegetable consumption (e.g. vegetables, Greece: 207 g/d for women and 270 g/d for men), while the lowest intake was seen in The Netherlands and Scandinavia (e.g. vegetables, Sweden: 131 g/d for women and 122 g/d for men)(Reference Agudo, Slimani and Ocke30). A high consumption of dairy products was reported in Spain, the UK (p.e. 366 g/d for women and 408 g/d for men), The Netherlands, Sweden and Denmark. A somewhat lower consumption was reported in Greece (187 g/d for both genders) and Italy(Reference Hjartaker, Lagiou and Slimani31).
Only a rough comparison can be made with results of other dietary surveys because differences in food intake can be the consequence of different factors: demographic characteristics of the study population and differences in item composition of the food groups.
Methodological aspects
Although the EFCOSUM methodology was followed for the present survey, there are some limitations. First, no information was gathered about the dietary intake of children (<15 years). A new survey is foreseen from 2009 onwards to assess food intake in children. In 2002/2003 the dietary intake of Flemish pre-school children was assessed using a 3 d estimated record (n 661). The main conclusions were similar to those of the present adult study: mean daily intakes of nearly all food groups were below minimum recommendations, except for potatoes, cheese and meat products(35).
Second, although great efforts were made to select a representative sample of the Belgian population, the participation rate was below 50 %. (Un)willingness to participate may result in a selection bias, but no additional information on the non-responders is available. Non-responders were replaced by a selected reserve person of the same gender, age and living in a household of the same size and in the same commune as the originally selected person.
Third, some authors argue that while the development of FBDG has contributed to the understanding of the role of specific foods in achieving optimal health, the impact of these guidelines on human health has been limited(Reference Smitasiri and Uauy36). Nevertheless, the BNFCS can be a practical tool for public health policy. In 2006, as a result of the first BNFCS, the Belgian government started a campaign to improve the dietary habits of the population: the Belgian plan for nutrition and health, consisting of several working groups, which offer concrete, visible and coordinated actions on a national level to improve the dietary habits and health status of the population.
To be able to further evaluate the dietary intake of the Belgian population, a (semi-) continuous monitoring system should be organised. Such a system is already in place in other European countries such as The Netherlands(Reference Ocke, Hulshof, Bakker, Stafleu and Streppel37). Regular monitoring will allow measurement of time trends and the fine-tuning of actions taken to improve health status on a national and regional level.
In conclusion, the present study showed that the food intake of the Belgian population deviates significantly from the FBDG and differs substantially between age and sex groups. Further efforts are necessary to improve the Belgian food pattern, in particular among the youngest age group, in order to better prevent diet-related diseases. In addition, continuous or regular monitoring is crucial to enable trend analyses and to plan effective education and intervention strategies.
Acknowledgements
The authors declare not having any conflicts of interest. The authors acknowledge the dietary support from Mia Bellemans, Mieke De Maeyer, Kadija El Moumni and Davy Van Steenkiste. Special thanks go to the respondents and dietitians during the field work. The survey was funded by the Federal Ministry of Health, Food Chain Safety and Environment.
S.V. drafted the manuscript and did some additional analyses relevant for the paper. S.D.V., I.H. and M.M. coordinated the field work of the survey and contributed to the data input and the data analyses of the survey. E.T. contributed to the data analyses of the survey. S.D.H., G.D.B., M.K. and A.L. participated in the design of the survey. H.V.O. contributed to the design of the survey and the data analyses and was the general coordinator of the survey. All authors made a substantial contribution in critically revising the manuscript. All authors read and approved the final manuscript.


