

The increase in obesity prevalence during recent decades has stimulated an abundance of research into the regulation of appetite and energy balance in humans. This research frequently includes the objective measurement of energy intake during ad libitum meals in response to nutritional( Reference Chowdhury, Richardson and Tsintzas 1 , Reference Sun, Li and Zhang 2 ), pharmaceutical( Reference Batterham, Cowley and Small 3 , Reference Lippl, Erdmann and Steiger 4 ) and exercise interventions( Reference Deighton and Stensel 5 , Reference Schubert, Desbrow and Sabapathy 6 ). Such monitoring of energy intakes under laboratory conditions is recommended because of the dubious accuracy of self-reported measures( Reference Blundell, de Graaf and Hulshof 7 , Reference Dhurandhar, Schoeller and Brown 8 ), and a range of ad libitum meals have demonstrated high levels of repeatability in quantifying energy intakes( Reference Arvaniti, Richard and Tremblay 9 – Reference Tucker, Heap and Ingram 13 ). However, despite the prevalent use of ad libitum feeding, there has been little investigation into the sensitivity of these meals to reflect changes in appetite, and only one study to date has compared the sensitivity of commonly used ad libitum meals. In this regard, Wiessing et al.( Reference Wiessing, Xin and McGill 14 ) recently demonstrated a similar energy compensation of approximately 28 % in response to a high-energy v. low-energy preload when assessing energy intake via an ad libitum buffet meal and single-course, pasta-based meal. However, both meals promoted overconsumption with mean intakes >4500 kJ at each meal after the low-energy preload.
Single-course meals are recommended for the assessment of ad libitum energy intake because of concerns that buffet meals delay satiation and promote overconsumption, thereby not reflecting the habitual intakes of participants( Reference Blundell, de Graaf and Hulshof 7 ). However, overconsumption during single-course, pasta-based meals is commonly reported in the literature, with mean intakes ranging from approximately 3200 to 6400 kJ in a range of participant populations( Reference Chowdhury, Richardson and Tsintzas 1 , Reference Wiessing, Xin and McGill 14 – Reference Chowdhury, Richardson and Tsintzas 20 ). Such large intakes are likely to be due to the high palatability of pasta-based ad libitum meals( Reference Wiessing, Xin and McGill 14 , Reference Roe, Kling and Rolls 21 ). It has previously been demonstrated that increasing the palatability of ad libitum meals can enhance appetite during feeding, induce overconsumption and reduce the sensitivity of the meal to detect previous changes in appetite( Reference Yeomans, Lee and Gray 22 ). Subsequently, it seems plausible that overconsumption during pasta-based meals may contribute to the dissociations observed between appetite ratings and food intake responses in previous studies( Reference Chowdhury, Richardson and Tsintzas 1 , Reference Gonzalez, Veasey and Rumbold 15 , Reference Deighton, Batterham and Stensel 18 ).
Recent studies by Corney et al.( Reference Corney, Sunderland and James 23 , Reference Corney, Horina and Sunderland 24 ) have used an ad libitum porridge meal to assess energy intake and have reported mean intakes of approximately 2500 kJ after an overnight fast in healthy, young men. These intakes are substantially lower than those reported from pasta meals within similar populations( Reference Gonzalez, Veasey and Rumbold 15 – Reference Deighton, Batterham and Stensel 18 ), are more representative of expected habitual intakes (increasing external validity) and may produce greater sensitivity to previous changes in appetite by reducing overconsumption (enhancing precision). However, because of large individual differences in energy intake during ad libitum feeding combined with the subjectivity of appetite perceptions, direct comparisons within subjects are essential for appropriate assessment of appetite and energy intake responses to an intervention( Reference Blundell, de Graaf and Hulshof 7 ).
Thus, the purpose of this study was to compare the sensitivity of a pasta-based v. a porridge-based ad libitum meal for the assessment of energy intake. This represents the first comparison of two commonly used single-course, ad libitum meals and provides guidance on the selection of ad libitum meals for future research studies. We hypothesised that ad libitum energy intake at the porridge-based meal would be more ecologically valid and more representative of preceding appetite ratings than energy intake at the pasta-based meal.
Methods
Study design
This investigation included two experiments, which were conducted according to the guidelines laid down in the Declaration of Helsinki. Both experiments involved a preload study design to investigate the influence of ad libitum meal composition on the compensatory energy intake response to different energy preloads. The experimental protocols were identical, except for the energy content of the preloads. Expt 1 was conducted at the University of Bath and it compared the effects of a 579 and 1776 kJ preload. Expt 2 was conducted at Leeds Beckett University and it compared the effects of an 828 and 4188 kJ preload. The use of different preloads in each experiment enabled comparisons to be made regarding the effects of moderate and large differences in preload energy content. Each experiment was approved by the Institutional Ethics Advisory Committee for the university at which the experimental testing was performed, and written informed consent was obtained from all participants.
Participants and standardisation
Study participants were non-smokers, not taking any medication, weight stable for at least 6 months before participation and were not dieting. Participants had no known history of CVD/metabolic disease, were classified as unrestrained eaters( Reference de Lauzon, Romon and Deschamps 25 ) and were recreationally active.
In both experiments, participants completed a food diary detailing all foods and drinks consumed in the 24 h before their first experimental trial and repeated this before each subsequent trial. Alcohol, caffeine and strenuous physical activity were not permitted during this period. All trials commenced between 08.00 and 09.00 hours after an overnight fast of at least 10 h, and participants exerted themselves minimally when travelling to the laboratory, using motorised transport when possible. Verbal confirmation of dietary and exercise standardisation was obtained at the beginning of each experimental trial.
Experimental protocol
For each experiment, ten healthy men participated in four experimental trials separated by a minimum of 72 h in a randomised, semi-double blind (blinded to the preload composition but not the test meal), cross-over design. The four trials constituted a low-energy (LE) or high-energy (HE) preload, followed by an ad libitum test meal that was either pasta based or porridge based. Anthropometric measurements, screening for eating behaviours( Reference de Lauzon, Romon and Deschamps 25 ), habitual physical activity levels and verbal confirmation of the acceptability of the foods to be provided during the study were obtained immediately before the first experimental trial. Habitual consumption of pasta-based and porridge-based meals was assessed using an eight-point scale ranging from ‘almost never’ to ‘>2 meals/d’.
Upon arrival to the laboratory for each experimental trial, participants completed a baseline appetite visual analogue scale before consuming a low- or high-energy preload beverage. Participants were instructed to consume the beverage within 5 min, and a 60-min intermeal interval commenced upon the first mouthful of the beverage in accordance with Almiron-Roig et al.( Reference Almiron-Roig, Palla and Guest 26 ). Participants rested within the laboratory (sitting, reading or listening to music) throughout the intermeal interval, and were provided with an ad libitum pasta-based or porridge-based meal at 60 min.
Preloads
The preload beverages were matched for macronutrient composition and were designed to closely align with the UK dietary guidelines for macronutrient proportions (58 % carbohydrate, 26 % fat, 16 % protein). The preloads consisted of water, single cream (Tesco), maltodextrin (MyProtein), whey protein isolate (MyProtein) and vanilla flavouring (MyProtein). These beverages were comparable with those used in previous studies( Reference Appleton, Martins and Morgan 19 ). The energy content of the preload beverages was 579 and 1776 kJ in Expt 1 and 828 and 4188 kJ in Expt 2. All preload beverages weighed 550 g and were distributed evenly between two 568-ml glasses in order to disguise any subtle differences in volume. All beverages were consumed by participants in isolation. The preloads were prepared by a third party external to the study, and both the researcher and participant were asked to identify which beverage they thought had been consumed at the end of each trial. All participants were fully unblinded upon completion of the experiment.
Appetite and palatability assessment
Appetite perceptions (hunger, satisfaction, fullness and prospective food consumption (PFC)) were assessed at baseline and every 15 min during both experiments using 100-mm visual analogue scales with descriptors anchored at each end describing the extremes (e.g. ‘I am not hungry at all’/‘I have never been more hungry’)( Reference Flint, Raben and Blundell 27 ). Participants rated their appetite perceptions by placing a mark across each line on paper, and participants were not able to refer to their previous ratings when completing the appetite scales. The scales were analysed by measuring the horizontal distance from the left-hand side of the continuum to the point on the line indicated by the participant. Each visual analogue scale was measured twice to ensure accuracy. A composite appetite score was calculated for each time point as the mean value of the four appetite perceptions after inverting the values for satisfaction and fullness( Reference Stubbs, Hughes and Johnstone 28 ). Palatability ratings (visual appeal, smell, taste, aftertaste and pleasantness) were obtained for the preloads and ad libitum meals immediately after consumption( Reference Flint, Raben and Blundell 27 ). A composite palatability score was calculated as the mean value of the palatability subscales.
Ad libitum meals
The ad libitum meals were matched for macronutrient content and were designed to closely align with the UK dietary guidelines for macronutrient proportions (52 % carbohydrate, 34 % fat and 14 % protein). The meals were also matched for energy density (8·45 kJ/g). The pasta-based meal consisted of penne pasta (Tesco), Cheddar cheese (Tesco), tomato sauce (Tesco) and olive oil (Tesco) in accordance with previous research( Reference Gonzalez, Veasey and Rumbold 15 , Reference Clayton, Stensel and Watson 16 ). Pasta was cooked for 15 min in unsalted water at 700 W before being mixed with the remaining ingredients and re-heated for 2 min at 700 W. The porridge-based meal consisted of rolled oats (Tesco), whole milk (Tesco), double cream (Tesco), maltodextrin (MyProtein) and whey protein isolate (MyProtein). The oats were cooked in the microwave with milk and double cream for 2 min at 700 W before being mixed with the remaining ingredients.
Participants consumed the ad libitum meals in isolation in order to prevent any social influence affecting food intake. Participants were provided with a bowl of the respective meal, and this was replaced by an investigator before the participant had emptied it and with minimal interaction. Each portion of the porridge-based meal weighed 300 g, and each portion of the pasta-based meal weighed 430 g before consumption; three bowls of the respective meal were prepared for each trial in accordance with previous research( Reference Gonzalez, Veasey and Rumbold 15 ), which met the requirements of all participants during the trials. No time limit was set for eating, and participants were instructed to eat until ‘comfortably full’. Subsequently, participants determined the point of meal termination and were asked to leave the feeding area and to inform the researcher once they felt ‘comfortably full’. Food intake was determined as the weighted difference in food before and after eating. Water was available ad libitum during the participants’ first trial and standardised for each subsequent trial. Energy compensation was calculated using the following equation:
 $$\eqalign{{\rm Energy}\,{\rm compensation}\,( {\rm \,\%\,} )\cr{\rm \,{\equals}} \,( {( {{\rm energy\,intake}_{{{\rm low}\,{\rm energy}\,{\rm preload}}} - \cr& {\rm energy\,intake}_{{{\rm high}\,{\rm energy}\,{\rm preload}}} } )} \cr& \quad{{\rm /energy}\,{\rm difference}\,{\rm between}\,{\rm preloads)}{\times}{\rm 100}} {\rm .}$$
Statistical analysis
Data for each experiment were analysed separately using IBM SPSS statistics version 19 for Windows. Total AUC values were calculated for appetite perceptions using the trapezoidal method. Repeated measures, two-way ANOVA (preload×meal) was used to assess differences in energy intake, composite palatability scores and AUC values for composite appetite scores between the trials. Pearson’s product-moment correlation coefficient was used to examine the relationship between energy intake and preceding appetite ratings. This included correlations between the change in appetite scores and the percentage energy compensation in response to the high-energy preload compared with the low-energy preload in order to determine the utility of the test meals to reflect changes in appetite. Wilcoxon’s signed-rank was used to assess differences between the habitual consumption of pasta-based and porridge-based meals. Statistical significance for this study was accepted at P≤0·05. Participant characteristics and data in the text are presented as mean values and standard deviations. All other results are presented as mean values and 95 % CI. A sample size of ten participants was determined to be sufficient to detect an energy compensation of 40 % in Expt 1 and 15 % in Expt 2, based on previous data from Corney et al.( Reference Corney, Sunderland and James 23 ). This calculation was performed using G* power with an α value of 5 % and a power of 80 %( Reference Faul, Erdfelder and Lang 29 ). Individual compensatory responses are plotted within the figures to allow further examination of the findings, and the results of each experiment are presented separately to ensure clarity.
Results
Expt 1
Participant characteristics
Participant characteristics were as follows: age 22 (sd 1) years, height 1·80 (sd 0·06) m, body mass 81·1 (sd 7·9) kg and BMI 24·8 (sd 1·6) kg/m2. There was no significant difference in the habitual consumption of pasta-based and porridge-based meals (P=0·917) with the same median intake of 1 meal/week. Habitual consumption of pasta-based meals ranged from ‘almost never consumed’ to ‘5–6 meals/week’, whereas habitual consumption of porridge-based meals ranged from ‘almost never consumed’ to ‘1 meal/d’.
Energy intake
Two-way ANOVA revealed higher ad libitum energy intake during the pasta meal compared with the porridge meal (P<0·0005) but no difference between the 579 and 1776 kJ preloads (P=0·561) (Fig. 1(a)). There was no significant difference in energy compensation between test meals (P=0·922) (Fig. 1(b)).
Energy intake (a) and energy compensation (b) for Expt 1. †Significantly different between test meals. Values are means (n 10) and 95 % CI.

Appetite and palatability ratings
Two-way ANOVA demonstrated similar results for each appetite perception with no significant differences between preloads and test meals for hunger (preload: P=0·694; meal: P=0·928), satisfaction (preload: P=0·420; meal: P=0·239), fullness (preload: P=0·338; meal: P=0·233) or PFC (preload: P=0·241; meal: P=0·862). Subsequently, composite appetite scores are presented for clarity.
Composite appetite scores did not differ between trials at baseline (P=0·421). Two-way ANOVA revealed no significant difference in composite appetite AUC between the 579 and the 1776 kJ preload trials (P=0·791). Similarly, there was no difference in appetite scores between the pasta and the porridge trials (P=0·523; LE porridge 70 (sd 10), LE pasta 64 (sd 9), HE porridge 65 (sd 14), HE pasta 68 (sd 14)) (Fig. 2).
Composite appetite scores (a) in the 579 kJ porridge (○), 579 kJ pasta (●), 1776 kJ porridge (□) and 1776 kJ pasta (■) trials for Expt 1. ![]() , The low-energy preload trials. Values are means (n 10) and 95 % CI. Linear correlation with 95 % CI between the change in composite appetite AUC after the 1776 v. 579 kJ preload and energy compensation for the pasta meal (b) and porridge meal (c).
, The low-energy preload trials. Values are means (n 10) and 95 % CI. Linear correlation with 95 % CI between the change in composite appetite AUC after the 1776 v. 579 kJ preload and energy compensation for the pasta meal (b) and porridge meal (c).

Two-way ANOVA demonstrated no significant differences in composite palatability scores for the high-energy preload compared with the low-energy preload (P=0·136). The palatability response to preloads was not different during the pasta and porridge trials (P=0·218). Composite palatability scores for the test meals were significantly higher for the pasta meal compared with the porridge meal (P=0·001). The palatability response to the test meals was not different during the high- and low-energy preload trials (P=0·431) (Fig. 3).
Composite palatability scores for the preloads (a) and test meals (b) for Expt 1. † Significantly different between test meals. Values are means (n 10) and 95 % CI represented by vertical bars.

The preload beverage was correctly identified by participants in twenty-one of the forty trials and by the researcher in five of the forty trials.
Correlations
Composite appetite AUC values were not significantly correlated with energy intake in any of the four trials (all r<0·438; P>0·205). Energy compensation at the ad libitum meals was not significantly correlated with the change in AUC or 60-min composite appetite scores between the 579 and the 1776 kJ preloads (pasta AUC: r 0·077, P=0·832; pasta 60 min: r −0·497, P=0·143; porridge AUC: r −0·452, P=0·190; porridge 60 min: r −0·385, P=0·272) (Fig. 2).
Expt 2
Participant characteristics
Participant characteristics were as follows: age 21 (sd 4) years, height 1·80 (sd 0·05) m, body mass 77·2 (sd 6·4) kg and BMI 24·2 (sd 2·3) kg/m2. Habitual consumption of pasta-based meals was significantly higher than porridge-based meals (P=0·014) with median intakes of ‘2–4 meals/week’ and ‘1 meal/week’, respectively. Habitual consumption of pasta-based meals ranged from ‘1 meal/week’ to ‘2–4 meals/week’, whereas habitual consumption of porridge-based meals ranged from ‘almost never consumed’ to ‘2–4 meals/week’.
Energy intake
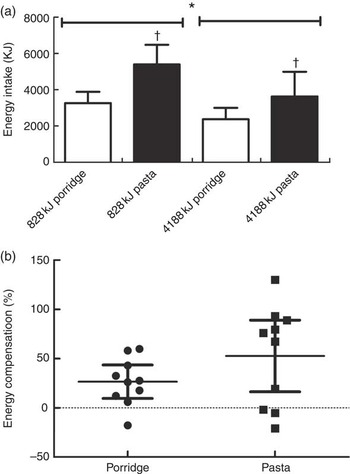
Two-way ANOVA demonstrated higher ad libitum energy intake after the 828 kJ preload compared with the 4188 kJ preload (P=0·002) and during the pasta meal compared with the porridge meal (P=0·001) (Fig. 4(a)). However, there was no significant difference in energy compensation between test meals (P=0·172) (Fig. 4(b)).
Energy intake (a) and energy compensation (b) for Expt 2. *Significantly different between preloads, † significantly different between test meals. Values are means (n 10) and 95 % CI.
Appetite and palatability ratings
Two-way ANOVA demonstrated similar results for each appetite perception with higher hunger (P=0·066), higher PFC (P=0·035), lower fullness (P=0·062) and lower satisfaction (P=0·077) after consumption of the 828 kJ preload compared with the 4188 kJ preload. There were no significant differences for any of the appetite perceptions between the pasta and the porridge trials (hunger: P=0·531; satisfaction: P=0·813; fullness: P=0·654; PFC: P=0·327). Subsequently, composite appetite scores are presented for clarity.
Composite appetite scores did not differ between trials at baseline (P=0·642). Two-way ANOVA revealed higher composite appetite AUC after consumption of the 828 kJ preload compared with the 4188 kJ preload (P=0·051). Appetite AUC responses to the preloads did not differ between pasta and porridge trials (P=0·642; LE porridge 69 (sd 9), LE pasta 66 (sd 13), HE porridge 57 (sd 18), HE pasta 58 (sd 20)) (Fig. 5).
Composite appetite scores (a) in the 828 kJ porridge (○), 828 kJ pasta (●), 4188 kJ porridge (□) and 4188 kJ pasta (■) trials for Expt 2. ![]() , The low energy preload trials. Values are means (n 10) and 95 % CI. Linear correlation with 95 % CI between the change in composite appetite AUC after the 4188 v. 828 kJ preload and energy compensation for the pasta meal (b) and porridge meal (c).
, The low energy preload trials. Values are means (n 10) and 95 % CI. Linear correlation with 95 % CI between the change in composite appetite AUC after the 4188 v. 828 kJ preload and energy compensation for the pasta meal (b) and porridge meal (c).

Two-factor ANOVA demonstrated higher composite palatability scores for the 4188 kJ preload compared with the 828 kJ preload (P=0·001). The palatability response to preloads was not different during the pasta and porridge trials (P=0·877). Composite palatability scores for the test meals were significantly higher for the pasta meal compared with the porridge meal (P=0·002). The palatability response to the test meals was not different during the low- and high-energy preload trials (P=0·888) (Fig. 6).
Composite palatability scores for the preloads (a) and test meals (b) for Expt 2. * Significantly different between preloads, † significantly different between test meals. Values are means (n 10) and 95 % CI represented by vertical bars.

The preload beverage was correctly identified by the participant in twenty-six of the forty trials and by the researcher in fifteen of the forty trials.
Correlations
Composite appetite AUC values were more strongly correlated with energy intake during the pasta trials than the porridge trials (LE porridge: r 0·165, P=0·649; LE pasta: r 0·567, P=0·087; HE porridge: r 0·565, P=0·089; HE pasta: r 0·909, P<0·0005). Energy compensation at the ad libitum meal was significantly correlated with the change in AUC and 60-min composite appetite scores between the 828 and the 4188 kJ preloads for the pasta meal (AUC: r −0·758, P=0·011; 60 min: r −0·673, P=0·033), demonstrating greater energy compensation in response to larger reductions in appetite. However, these correlations did not reach statistical significance for the porridge meal (AUC: r −0·498, P=0·143; 60 min: r −0·499; P=0·142) (Fig. 5).
Discussion
The use of ad libitum meals to quantify energy intake is a prominent methodology within appetite and energy balance research. This investigation represents the first comparison of the sensitivity of two commonly used single-course, ad libitum meals in response to appetite manipulation. These findings demonstrate that the provision of a moderately palatable porridge-based meal reduces overconsumption in comparison with a more highly palatable, pasta-based meal. However, energy compensation at the pasta meal was more strongly correlated with preceding appetite ratings, demonstrating greater sensitivity to appetite manipulation.
The incorporation of two experiments within this report enabled the sensitivity of the test meals to be investigated in response to a moderate and large manipulation of preload energy content. Surprisingly, the 1197 kJ difference in energy content between preloads in Expt 1 did not produce any discernible changes in appetite or energy intake. This finding contrasts with previous studies that have reported reductions in appetite and an energy intake compensation of 30–57 % in response to preload energy manipulations of approximately 1500 kJ( Reference Appleton, Martins and Morgan 19 , Reference Soenen and Westerterp-Plantenga 30 ). The participants recruited for the present experiment were all young, healthy, recreationally active men, and an intermeal interval of 60 min was used based on evidence that this population and experimental design will maximise the compensatory response to preload manipulation( Reference Appleton, Martins and Morgan 19 , Reference Almiron-Roig, Palla and Guest 26 , Reference Davy, Van Walleghen and Orr 31 , Reference Martins, Kulseng and Rehfeld 32 ). Subsequently, it is not clear why the preload manipulation failed to alter appetite responses, but this may be related to the composition of the preload beverages. In this regard, although similar preload beverages have been found to influence appetite and energy intake through the manipulation of maltodextrin content( Reference Appleton, Martins and Morgan 19 , Reference Long, Hart and Morgan 33 ), the increases in preload energy during the present study were primarily achieved via the addition of maltodextrin and single cream. Such sugar–fat combinations are frequently used in laboratory models to promote hyperphagia( Reference Avena, Rada and Hoebel 34 ), and any appetite-stimulating properties of the higher energy preload may have compensated for the appetite-suppressing effects of the moderately increased energy content. This finding supports long-standing concerns regarding the weak satiating effects of high sugar- and fat dairy-based beverages and their likely contribution to a positive energy balance( Reference de Graaf 35 ).
The increased manipulation of preload energy content in Expt 2 successfully generated divergent appetite and energy intake responses between the high- and low-energy preloads. Compensatory reductions in energy intake during both ad libitum meals after consumption of the high-energy preload in Expt 2 and the absence of change in energy intake during both meals in Expt 1 support the use of these meals to reflect preceding appetite ratings. However, the findings of the present study reveal important strengths and limitations for the use of these meals in future appetite studies.
In accordance with previous research, the pasta-based, ad libitum meal induced significant overconsumption in both experiments( Reference Chowdhury, Richardson and Tsintzas 1 , Reference Wiessing, Xin and McGill 14 – Reference Chowdhury, Richardson and Tsintzas 20 ), which conflicts with current recommendations for ad libitum meals to reflect habitual energy intakes( Reference Blundell, de Graaf and Hulshof 7 ). In this regard, energy intakes during the pasta meals were more than 50 % higher than the respective porridge meals and occurred despite the meals being matched for energy density. This difference appears to be due to the highly palatable nature of the pasta-based meal and is supported by previous studies demonstrating that highly palatable foods can stimulate appetite during ad libitum feeding, thereby overriding signals of satiation and increasing energy intakes( Reference Yeomans, Lee and Gray 22 , Reference Robinson, Gray and Yeomans 36 ). The moderately palatable porridge meal produced energy intakes that were more representative of expected habitual intakes, which demonstrated the importance of considering and reporting the palatability ratings of ad libitum meals within research studies. In addition, such large differences in intakes occurred despite participants having higher habitual intakes of pasta-based meals, which would be expected to improve the environmental contingencies associated with this food and reduce intakes to more ecological levels. This further emphasises the importance of palatability as a determinant of energy intake during ad libitum feeding.
Although large inter-individual variation in short-term energy compensation has been previously documented( Reference Appleton, Martins and Morgan 19 , Reference Soenen and Westerterp-Plantenga 30 , Reference Anderson, Catherine and Woodend 37 ), the findings of the present study suggest that this may be accentuated by the provision of a highly palatable ad libitum meal in response to appetite manipulation. In this regard, higher energy intakes during the pasta meal were associated with markedly greater heterogeneity in the compensatory response to preload manipulation in Expt 2. It seems likely that the higher energy intakes of the pasta meal provided opportunity for greater compensatory responses (i.e. larger changes in energy intake) to the observed decrease in appetite perceptions. Alternatively, the modest energy intakes observed during the porridge meal after consumption of the low-energy preload appear to have limited the potential range available for reductions in energy intake in response to the large manipulation of preload energy content in Expt 2 and produced a more homogenous response. In this regard, although participant blinding was unsuccessful, the participants were unaware of the energy content of the preloads, which maintained the impact of environmental contingencies on food intake and encouraged consumption during both meals( Reference Blundell and King 38 ). Such unsuccessful blinding is an expected consequence of the experimental manipulation as the preload beverages were designed to produce contrasting appetite responses. Although subtle differences in preload appearance may have contributed to the observed appetite responses( Reference Chambers, McCrickerd and Yeomans 39 ), the successful blinding of experimenters presenting the beverages suggests that post-ingestive consequences from preload consumption may have dominated.
Despite overconsumption and high levels of heterogeneity in compensatory energy intake responses, energy compensation during the pasta-based meal was strongly correlated with appetite changes in response to the high-energy v. low-energy preload (i.e. larger reductions in appetite were associated with greater energy compensation). Furthermore, this was superior to the correlations observed between changes in appetite and the more ecologically valid energy intakes achieved during the porridge meal. These findings suggest that the increased range available for compensatory feeding responses as a result of the overconsumption of a highly palatable meal may enhance the sensitivity to reflect preceding appetite ratings and improve alignment between these variables. Subsequently, despite current recommendations for ad libitum meals to reflect habitual energy intakes( Reference Blundell, de Graaf and Hulshof 7 ), the present study provides evidence that this may limit the sensitivity of the meal to reflect preceding changes in appetite. However, it must be acknowledged that mean energy compensation was not different between the test meals, which suggests that both meals are sufficiently sensitive to detect compensatory responses to appetite manipulation.
In conclusion, the experiments conducted within this investigation have demonstrated compensatory changes in energy intake in response to appetite manipulation when assessed using either a pasta-based or a porridge-based, ad libitum meal. The provision of a highly palatable, pasta-based meal induced significant overconsumption, but changes in energy intake were strongly correlated with preceding appetite ratings. Alternatively, the ecologically valid energy intakes achieved with the provision of a moderately palatable, porridge-based meal were less representative of changes in appetite perceptions. These findings support continuation in the use of a commonly used, pasta-based, ad libitum meal when the priority is to reflect preceding appetite ratings, and suggest that the large energy intakes observed during such feedings are unlikely to reduce the sensitivity of the measure to reflect preceding changes in appetite. Alternatively, it seems that meals producing moderate energy intakes during ad libitum feeding may limit the range of potential compensatory responses but could be suitable when energy intakes reflective of habitual diet are preferable. Subsequently, future ad libitum meal designs may require a compromise between sensitivity and ecological validity.
Acknowledgements
The authors thank all the volunteers for their participation in this study.
Data collection at Leeds Beckett University was supported internally by the Carnegie Research Fund. This research received no specific grant from any external funding agency or from commercial or not-for-profit sectors.
All authors contributed to the study design, data collection, data analysis and writing of the manuscript.
The authors declare that there are no conflicts of interest.


