Implications
Lesions caused by tail biting are a big welfare problem in pig production. Pigs reaching slaughter without tail lesions could be rewarded with premium payments, but this requires reliable lesion assessment in large numbers of pigs. We showed, that neural networks could help in automating this assessment.
Introduction
Tail biting is a widespread welfare problem in pig husbandry during which pigs manipulate the tails of their group mates with their mouth. This results in tail lesions of different degrees of severity, from superficial skin lesions over deep lesions to completely bitten-off tails (Taylor et al., Reference Taylor, Main, Mendl and Edwards2010). Tail biting is influenced by multiple risk factors which makes it difficult to prevent (European Food Safety Authority (EFSA), 2007). Cutting-off the tails shortly after birth (tail docking) greatly reduces the risk of tail biting occurring later in life (EFSA, 2007). In the EU, tail docking is only allowed in exceptional cases (Council Directive 2008/120/EC; Council of the European Union, 2008) but nevertheless frequently applied. This discrepancy has led to a formal complaint to the European Commission (Marzocchi, Reference Marzocchi2014), which in turn caused increased public awareness and political pressure. As a result, animal welfare labels started to include tail status as a criterion (‘Für mehr Tierschutz‘, Germany; ‘Beter leven', The Netherlands; ‘Bedre dyrevelfærd‘, Denmark) and programmes were launched which pay a premium for non-docked pigs (e.g. ‘Ringelschwanzprämie‘ by the German state Lower Saxony: 16.50 € per slaughter pig with not docked, not injured tail; Niedersachsen, Reference Niedersachsen2015).
The status of a pig tail is therefore now economically relevant. At the same time, large numbers of pig tails have to be evaluated. Thus, there is a need for fast, reliable, valid and cheap systems to assess tail status. Currently, tail status for the German ‘Ringelschwanzprämie‘, for example, is assessed by more or less trained observers who travel to farms and walk through pens where they score pig tails (oral information; S. Dippel). Assessing pigs on multiple farms in short periods of time requires considerable resources in terms of time and money for travelling and assessment, with added biosecurity risk through entering pens. Furthermore, tail lesion scoring by multiple observers has a strong subjective component (Mullan et al., Reference Mullan, Edwards, Butterworth, Whay and Main2011). Tails can also be scored with minimal logistical input at slaughterhouses, where pig carcasses are already inspected for signs of disease or severe injury. Studies have investigated possible integration of tail lesion scoring in this inspection but found significant influences of, for example, inspector work shift (Teixeira et al., Reference Teixeira, Harley, Hanlon, O’Connell, More, Manzanilla and Boyle2016).
Neural networks could be a low-cost, objective and indefatigable alternative to human observers. Their development distinctly improved automated object recognition in images (Russakovsky et al., Reference Russakovsky, Deng, Su, Krause, Satheesh, Ma, Huang, Karpathy, Khosla, Bernstein, Berg and Fei-Fei2015) and they have already been used for, for example, classification of hams (Muñoz et al., Reference Muñoz, Rubio-Celorio, Garcia-Gil, Guàrdia and Fulladosa2015). Some attempts have been made at developing automated assessment of lesions on slaughter carcasses using various forms of algorithms. To our knowledge, the only published systems are a system for assessing footpad dermatitis in broilers (Vanderhasselt et al., Reference Vanderhasselt, Sprenger, Duchateau and Tuyttens2013) and a system for recording presence or absence of tail and ear lesions in pigs (Blömke and Kemper, Reference Blömke and Kemper2017). However, many research and industry institutions are still struggling with the reliability of their systems, which are mostly based on linear algorithms. The aim of the present study was to test the reliability of neural networks for assessing tail lesions from pictures of pig carcasses.
Methods
Tail pictures
Tail pictures were taken of all pigs slaughtered on six days between March 27 and May 12, 2017 in one abattoir in North-Western Germany. Two synchronized RGB (red-green-blue) cameras automatically photographed tails from two dorsal angles after scalding and dehairing (cameras: UI-5480RE-C-HQ rev.2, lenses: IDS 25 HB Tamron Focal Length 12 mm, casing: Videotec Type NXM; all by IDS Imaging Development Systems, Obersulm, Germany). The two angles were stitched together in a single picture per pig. Lighting was provided by standard fluorescent lamps (tubes) with luminous colour 840 (cold white). Four double tubes were installed at the height of the carcase transport rails and provided light from above at distances of approximately 1 and 2 m from the carcase. One additional double tube was installed at the height of the back of the carcase with a distance of 2.8 m in order to reduce shadows from the top lights.
A total of 100 000 pictures were taken during the 6 days, out of which approximately 90% showed tails without lesions. As the aim was to determine agreement across all lesion severities, which may be influenced by unequal severity prevalences (Kottner et al., Reference Kottner, Audigé, Brorson, Donner, Gajewski, Hróbjartsson, Roberts, Shoukri and Streiner2011), we deleted a random sample of pictures without lesions in order to equalize the distribution of severity classes. For this, the most experienced observer screened pictures by recording hour (pictures from the same hour had been saved in one folder) in order to estimate the respective severity prevalences. She then first deleted all blurry pictures and then deleted every second picture without lesions until roughly similar proportions of pictures with different lesion severities were left in each folder. All pictures left were used for human observer training or training and testing the neural networks, respectively.
The first author made a software tool for picture scoring utilizing the OpenCV-library (OpenCV team, 2018) which allowed observers to look at an image and directly enter the scores. In addition, observers marked the position of the anal drill hole with a mouse click in both angles. Pictures were brightened using IrfanView© (version 4.44) and assessed on screens calibrated with dccw.exe (Windows®).
Human assessment of tail pictures
After training inter-human agreement, a total of 13 124 pictures scored by three human observers was used for training and testing the neural networks.
Scoring key
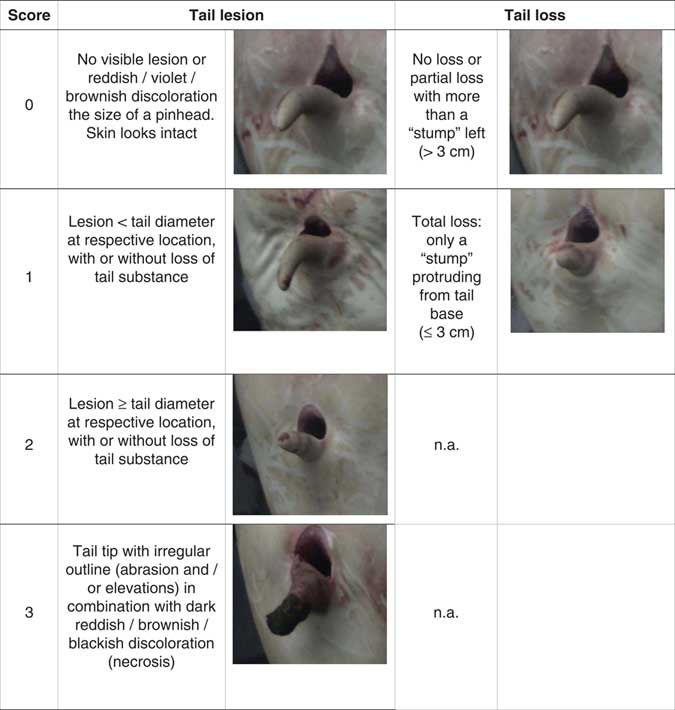
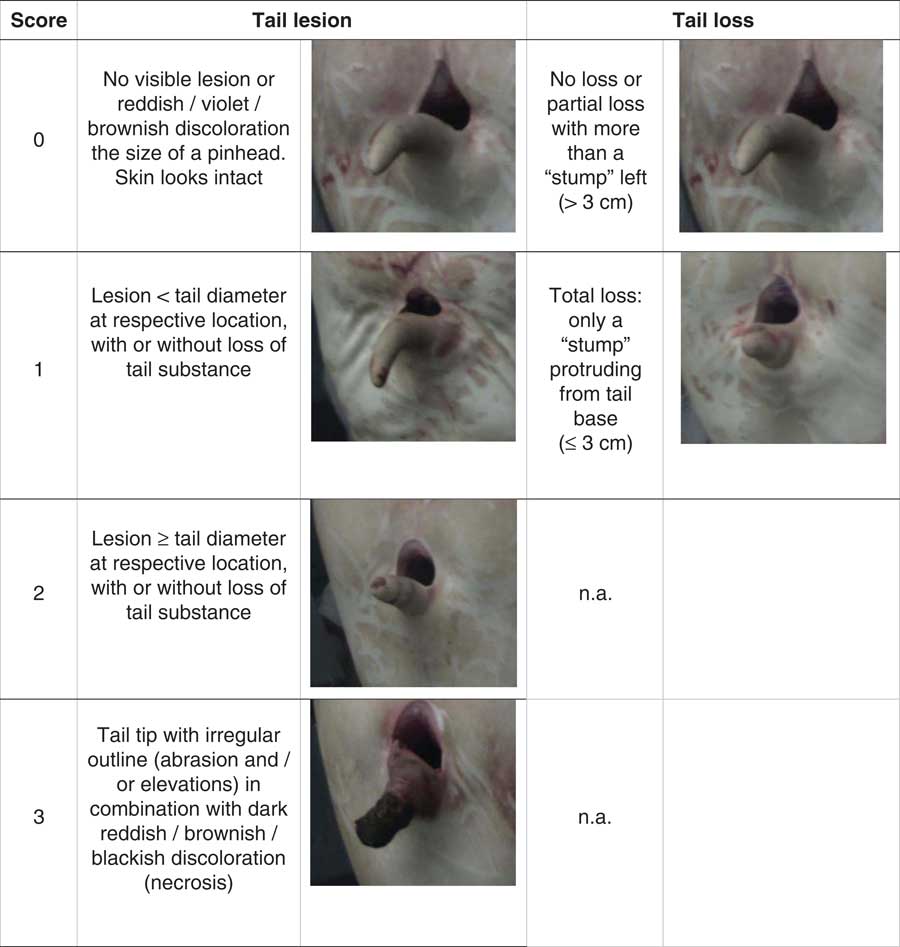
We scored tail lesions on a scale from 0 to 3 and tail losses as presence (1) or absence (0) of total tail loss (Figure 1). Discolouration at the tail base was not taken into account because in direct observations it seemed to be associated with brushing during scalding rather than with biting. Different degrees of partial tail loss could not be assessed because of tail docking.
Scoring key used for assessing tail lesions and total tail loss on pictures from pig carcasses. Tail lesions and losses were scored independently of each other. ‘Lesion‘ was defined as broken skin. The tail loss one picture shows the longest remaining ‘stump‘ which was still considered as tail loss (longer stumps would be classified as tail loss 0). Centimetres given are subjective estimates from a picture.
Observers and training
Pictures were scored by three observers in order to distribute the workload. Observers were chosen based on availability and previous experience with scoring tail lesions. One observer had experience in scoring tails on pictures from carcasses, one observer had experience in scoring tails on live pigs and one observer was naïve regarding scoring of pig tails. Observers trained by discussing and scoring tail pictures and tested their agreement at regular intervals using 80 unknown pictures for each test. The pictures were preselected by the last author (who led observer training and tests) to make sure, each test batch contained several pictures for each of the scores. We calculated agreement between observer pairs as exact agreement (%) and prevalence-adjusted bias-adjusted κ (PABAK=[(k×p)−1]/(k−1) where k=number of categories and p=proportion of matchings). Prevalence-adjusted bias-adjusted κ values >0.6 to 0.8 were regarded as satisfactory to good agreement and values >0.8 as very good agreement (Fleiss et al., Reference Fleiss, Levin and Paik2003). Before picture assessment started, five inter-observer tests were required until satisfactory agreement was achieved. Two inter-observer tests were performed during the assessment to monitor potential drifts.
Neural network assessment of tail pictures
There are different approaches regarding the respective proportions of training and validation pictures. Many image datasets supplied for developing visual recognition systems use 95% training and 5% validation pictures (Russakovsky et al., Reference Russakovsky, Deng, Su, Krause, Satheesh, Ma, Huang, Karpathy, Khosla, Bernstein, Berg and Fei-Fei2015). However, if the pictures (or mathematical outcome parameter) are highly variable such as the appearance of tail lesions in pictures, somewhat larger validation data sets in the range of 20% are recommended (Dohoo et al., Reference Dohoo, Martin and Stryhn2012) and used (e.g. image data sets CIFAR-10 and CIFAR-100 (https://www.cs.toronto.edu/~kriz/cifar.html) or MNIST (yann.lecun.com/exdb/mnist/)). This is why out of the 13 124 scored pictures we used 10 499 (80%) for training and 2625 (20%) for subsequent validation of the networks (Table 1).
Number of pig carcase pictures scored by human observers and used for training and validating neural networks

n.a=not applicable.
Numbers are given for each score assigned by human observers for tail lesion and tail loss, respectively (Figure 1). Tail loss was only scored as present or absent. Out of the 13 124 scored pictures, 80% were used for training and 20% for subsequent validation of the networks.
Localization of the tail region
In order to train a classification network properly, it is important to use only relevant picture sections as input. As the position of the tail varied from picture to picture, we first trained a part detection network to locate the relevant region in each picture before it was handed to the classification network. The part detection network (Figure 2) was based on the idea from Bulat and Tzimiropoulos (Reference Bulat and Tzimiropoulos2016) and realized using a fully convolutional residual layer (ResNet)-50 backbone (He et al., Reference He, Zhang, Ren and Sun2016). To preserve the local information of the input data, we extracted, scaled up and added the feature maps after the 7th (eight-fold downsampling), 13th (16-fold downsampling) and 16th (32-fold downsampling) building block of the ResNet before applying the pixelwise sigmoid-loss. We initialized the network with pretrained Imagenet weights (Russakovsky et al., Reference Russakovsky, Deng, Su, Krause, Satheesh, Ma, Huang, Karpathy, Khosla, Bernstein, Berg and Fei-Fei2015) and fine-tuned it for 30 epochs with the Adam-optimizer (Kingma and Ba, Reference Kingma and Ba2015) at a learning-rate set to 0.0001. In order to subjectively verify that the network used the tail-region to identify the injury patterns we used the Image-Specific Class Saliency Visualization from Simonyan et al. (Reference Simonyan, Vedaldi and Zisserman2014).
Architecture of a part detection network used for locating tails in pictures of pig carcases. The network learns to activate pixels in the specified areas which can then be used for positioning the region-of-interest windows for cutting out the relevant picture section (tail) for subsequent classification.

Classification of tail lesion and tail loss
The part detection network predicted the location of the anal drill hole, which was then used to position the region-of-interest window. The original pictures were scaled down, so that the selection window for each angle covered 320×256 px. The two windows for the two angles joined together resulted in the input of 320×512 px for the classifier network. For tail lesion classification, we used a modification of the standard Inception-ResNet-v2 classifier network by Szegedy et al. (Reference Szegedy, Ioffe, Vanhoucke and Alemi2017) for predicting the four tail lesion scores in our data set. To compensate for the large imbalance between scores, we used sub-/oversampling until 4000 training pictures were available for each score. This meant that pictures from lesion scores 2 and 3 were duplicated many times (Table 1). During training, the pictures were augmented online by rotating the two picture-halves randomly (±10°) before cutting the region of interest and by applying picture manipulations like adaptive noise, brightness-changes and blurring to the final input-pictures. Again, we initialized the network with pretrained Imagenet weights and fine-tuned it for 30 epochs with the Adam-optimizer (learning-rate set to 0.00001). We used a categorical-crossentropy loss on the final four-classes-softmax activation. Due to the pre-trained weights, the network started to overfit quickly so we applied early-stopping. The tail loss classification was done on the same pre-processed input pictures and the same classification network architecture, but with binary-crossentropy loss on a single sigmoid activated decision-neuron.
Results
Agreement between human observers
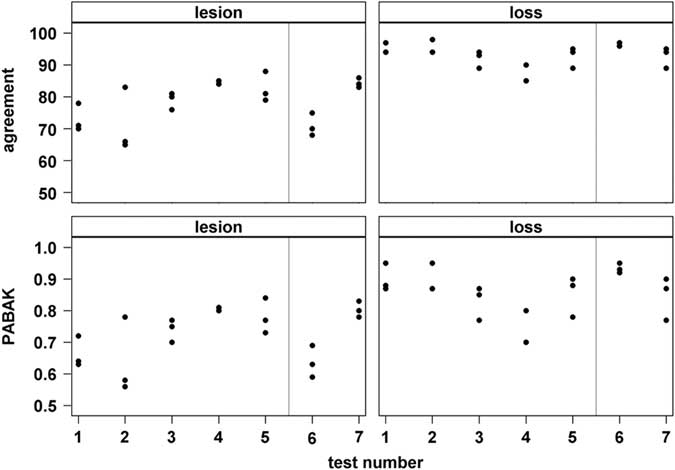
For lesions, exact agreement between observer pairs ranged from 65% to 88% with 50% of agreement values between 71% and 84% (1st (Q25) to 3rd (Q75) quartile; median=80%; Figure 3). Prevalence-adjusted bias-adjusted κ for lesions ranged from 0.56 to 0.84 with 50% of values between 0.64 and 0.80 (median=0.75). For tail loss, exact agreement ranged from 85% to 98% (Q25 to Q75: 90% to 95%, median=94%) and PABAK ranged from 0.70 to 0.95 (Q25 to Q75: 0.80 to 0.90, median=0.87).
Results of inter-observer agreement tests of three human observers scoring tail lesions or tail loss, respectively, from pig carcase pictures. Each dot represents the exact agreement (%) or prevalence-adjusted bias-adjusted κ (PABAK; range 0 to 1), respectively, for one observer-pair during one test (consecutive test number on x-axis; n=80 pictures per test). Grey vertical line=start of data collection.

Agreement between neural network and human assessment
The trained tail lesion classification network yielded an agreement of 74% with the human observer scores, while agreement for tail losses was 95%. For tail lesions, normalized values on the confusion matrix diagonal ranged from 0.59 to 0.85 with uncertainty occurring on both sides of the diagonal (Figure 4).
Normalized confusion matrix for the predictions of the tail lesion classification network based on 13 124 pig tail pictures annotated by human observers. True label=tail lesion severity score assigned by humans, Predicted label=score predicted by neural network. The colouring indicates the normalised distribution of numbers of pictures per cell.

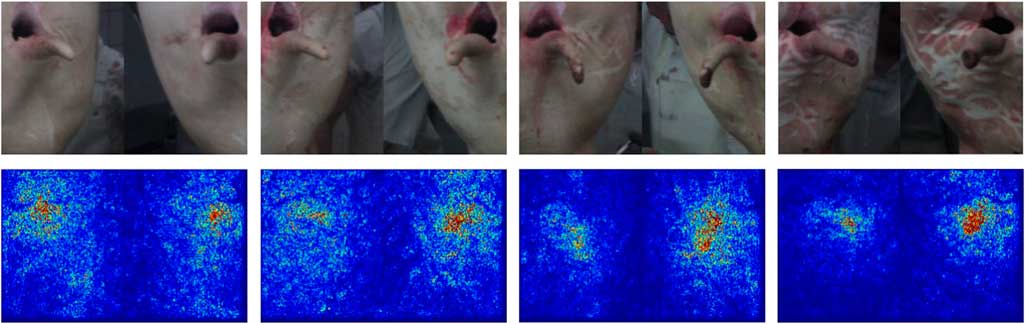
The classification network mostly used information from the correct region for classification (Image-Specific Class Saliency Visualization; Figure 5). In pictures with many optical structures in non-tail regions, especially reddish-coloured structures, the network used more non-relevant pixels for its decision. Misclassifications were often associated with shadows or overlapping structures (Figure 6).
Example pictures of slaughter pig tails from the verification of the tail lesion severity classification network (top row). From left to right, pictures represent tail lesion scores 0, 1, 2 and 3, respectively (Figure 1). The bottom row shows the respective gradient-map made by the network, in which warmer colours indicate a larger influence of the respective pixel on the final classification result.

Three examples for misclassification of pig tail lesion severity scores by the network. (a) and (b) were assigned lesion score 1 by a human and lesion score 0 by the network, (c) was assigned lesion score 3 by a human and score 2 by the network.

Discussion
In the present study, human observers evaluated pictures of pig carcasses regarding tail lesions and tail losses. The scored pictures were used to train and test neural networks. Agreement between network and observer scores were similar to agreement between human observers.
Agreement between human observers was acceptable in most tests for lesions and good in most tests for tail loss, but fluctuated over time for both parameters. This was mostly dependent on the prevalence of blurry pictures or lesions or losses on the border between two categories in the test pictures. Even though lighting had been optimised as much as possible, all pictures were more or less blurred due to high speed of the carcasses on the line. In addition, most carcasses had discolourations and marks from the scalding and dehairing process. The latter were also present on some tails and thus interfered with assessment of low severity lesions. Overall, the greatest difficulty was, where to distinguish between two lesion severity categories, that is, ‘is this still score 0 or already score 1‘. The issue remained despite training, due to the great variation regarding colour and size along continuous gradients. This problem of categorizing continuous characteristics has been described before. In a study where three observers scored 80 pictures and videos of sheep feet regarding lesions on a 5-point scale (Foddai et al., Reference Foddai, Green, Mason and Kaler2012), the width of the categories varied significantly between observers, and categories also overlapped within observers. Similar results were found for scoring lameness in sheep on an ordinal v. visual analogue (continuous) scale (Vieira et al., Reference Vieira, Oliveira, Nunes and Stilwell2015). Therefore, assessment of lesions on a continuous scale might be recommendable for reducing variation in training data by improving agreement between observers who annotate training pictures.
In tasks of supervised learning like the one presented here, neural networks can only be as good as the data they are trained with. This is why the disagreement between human observers in our study is reflected in the uncertainty in the confusion matrix of the tail lesion network. Using averaged annotations from several trained observers (Muñoz et al., Reference Muñoz, Rubio-Celorio, Garcia-Gil, Guàrdia and Fulladosa2015) could additionally improve training material quality. However, neural networks also require large datasets in order to be trained on complex parameters, such as tail lesions. Several observers re-scoring the same pictures considerably increases labour input. Therefore, calculations on trade-off between large numbers of training pictures annotated with greater variability by single observers v. fewer pictures with average annotations with less variability should be made. Nevertheless, improving human agreement is the necessary first step towards better network assessment results. Based on our study, high-quality pictures are a prerequisite for good agreement. In addition, using continuous scales rather than categorical scores might help to raise agreement for lesions above 90%.
Overall, the neural network assessment results in our study are very promising because the agreement between network and human observers was similar to the agreement between human observers. So far, only few studies investigated automatic computerised injury assessment on carcasses. Vanderhasselt et al. (Reference Vanderhasselt, Sprenger, Duchateau and Tuyttens2013) tested a system for assessing footpad dermatitis in broiler chickens. The maximum correlation between scores assigned by humans and the automated system was 0.77. However, even though there is less spatial variation regarding the position of broiler footpads compared to pig tails on a line, the system found the relevant areas only in 86 of 197 recorded chickens (44%). Blömke and Kemper (Reference Blömke and Kemper2017) achieved much better results with a system for automated assessment of presence or absence of ear and tail injuries in pigs. Their system found the relevant areas in an average of 95% of pictures. Sensitivity and specificity for detecting lesions were >70% and >94%, respectively, for tail as well as for ear lesions (2634 to 2684 pigs). Only presence or absence of lesions were assessed. Neither the threshold for lesion detection nor the algorithms for picture analysis were reported yet.
Conclusions
Neural networks can assess tail lesions in pictures from slaughter pigs with a reliability comparable to human observers. If supervised learning is used, high-quality training material (i.e. pictures) is necessary for achieving good network results. In order to be able to generalise such complex parameters like tail lesions, neural networks require large numbers of training pictures with equal representation of different severities. Using continuous lesion severity scales instead of predefined categorical scores might help to make the system more repeatable and versatile. In sum, neural network analysis of tail pictures poses a promising technique which might allow all pigs in a welfare label to be scored for tail lesions with little labour input.
Acknowledgements
The authors would like to thank Tönnies Lebensmittel GmbH & Co. KG for the possibility to record tail pictures at their abattoir, and Hans-Jörg Eynck and Thoralf Kobert for technical support at the abattoir. Stine Heindorff and Kathrin Körner are acknowledged for their support of picture assessment. Conceptual design of the work, acquisition of pictures: S.D. Supervision of and contribution to picture assessment by human observers: C.V. Development and training of neural networks and technical support for picture annotation: J.B., supervised by R.K. Data analysis and interpretation: J.B., S.D., C.V. Drafting the publication: C.V., J.B. Revision of publication: S.D., R.K. All authors have approved the final version.
Declaration of interest
This research did not receive any specific grant from funding agencies in the public, commercial or not-for-profit sectors. The authors have no competing interests to declare.
Ethics statement
Pig-related data in this study were collected without causing harm to the animals for the purpose of the study. All experimental work was conducted in accordance with relevant national legislation and approval by an ethics committee was not required.
Software and data repository resources
Data are available from the authors upon reasonable request.