


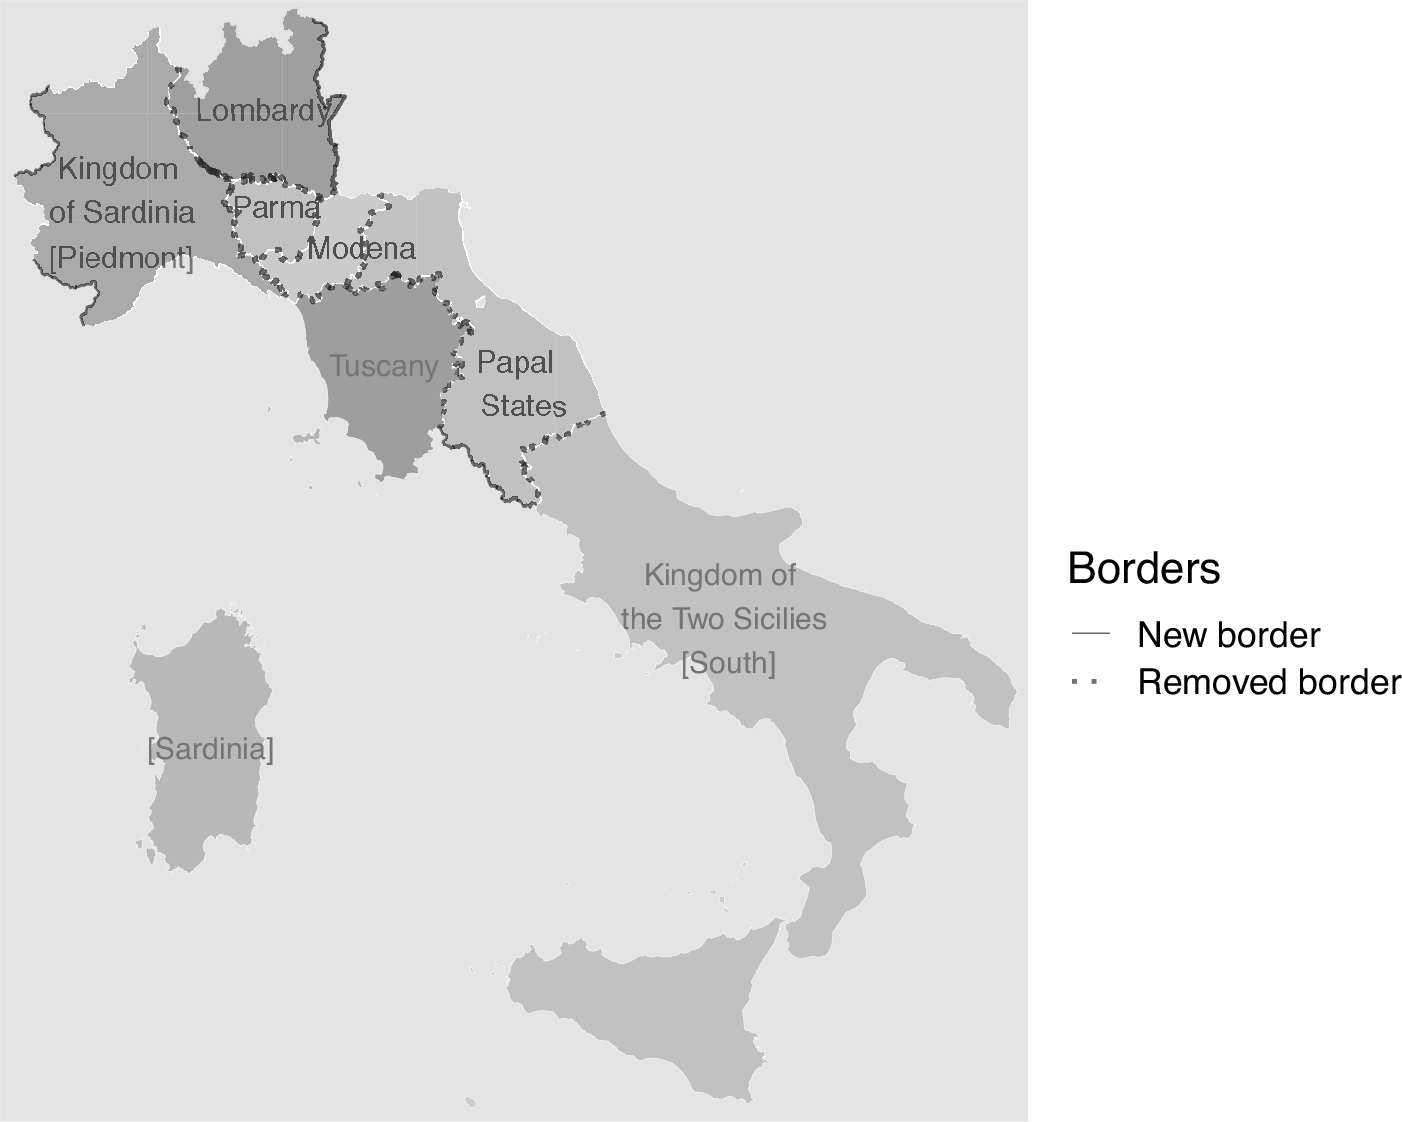
The Italian economy of the mid-nineteenth century was at a low point, a shadow of its former self as measured by real wages, heights, and GDP per capita (Malanima Reference Malanima2011; Allen Reference Allen2001; A’Hearn Reference A’Hearn2003). An important obstacle to economic progress was fragmentation. Italy’s inherently fractured physical geography was exacerbated by its political division into seven states separated by tariff barriers, a plethora of weights and measures, linguistic differences, diverse legal institutions, and multiple currencies.Footnote 1 The seven states united in 1861 are illustrated in Figure 1. While internal borders were dismantled, new external borders were erected in several locations: permanently in the North-West, where Nice and Savoy were ceded to France; temporarily in the North-East, where Lombardy and Veneto were separated until 1866; and in the Center, where a rump Papal State around Rome was carved out of its larger former territory until 1870.
ITALIAN STATES BEFORE UNIFICATION WITH REMOVED AND NEWLY IMPOSED BORDERS
Note: This map shows the states that were united in the Kingdom of Italy (at its 1861 borders).
Source: Authors’ illustration.
For the leaders of Italy’s Risorgimento, unification was a prerequisite not only for national political and cultural renewal, but also for an economic rebirth (see, e.g., Mazzini Reference Mazzini1921, vol. 69, pp. 62). It was an article of faith among public intellectuals and patriots that free trade in a unified national market would promote competition, regional specialization and trade, exploitation of economies of scale, and enhanced capital accumulation (Tremelloni Reference Tremelloni1947, vol. 1, pp. 151–63).
Disappointingly, unification failed to trigger an economic take-off. At less than half a percent per annum, growth was almost imperceptible in the 20 years to 1880. Moreover, the evidence does not suggest a post-unification boom in interregional trade. Coastal shipping grew no faster than international traffic in Italy’s ports.Footnote 2 As for the railways, Schram (Reference Schram1997, pp. 136–42) shows that up to 1884, the North’s rail traffic with the Center-South was dwarfed by freight shipments to and from its seaports and border stations, or by rail transport within the North. What traffic there was, consisted of similar bulky commodities and raw materials moving in both directions rather than manufactures or specialized agricultural products. Regional commodity price convergence stalled; in 1870, Italian wheat markets remained less well integrated than those of any other Western European economy (Federico Reference Federico2007, Reference Federico2011). As discussed in the second section, scholars remain divided on the reasons.
In this paper, we investigate whether internal borders hindered economic development in pre-unification Italy. We circumvent the problem of scarce trade data by looking for indirect evidence of the shadow cast by borders over local economic activity. We ask, more specifically, whether locations in the shadow of the former internal borders benefited disproportionately from their demolition. Places near the old borders were peripheral before 1861, far from the economic center of gravity of their regional state, facing higher transport costs to reach the distant customers in their domestic market and cut off from the nearby customers of a “foreign” market. With unification, such marginal places suddenly became more central relative to a larger regional market, hence more attractive as production sites. Using municipal (comune) population as a proxy for economic activity, we find that towns near the former borders experienced a significant acceleration in growth in the decade after 1861. Our interpretation is that pre-unification borders impeded short-distance, intraregional trade based on economies of scale; their removal triggered a spatial reallocation of production.
To carry out our analysis, we construct a municipal population database that is original in two respects. First, we standardize municipality definitions—which were in constant flux in these early years—based on their 1871 boundaries. Second, we collect pre-1861 population data for three pre-unification states: Piedmont, Tuscany, and the mainland communities of the Kingdom of Two Sicilies, which we refer to as “the South.” We then clean, standardize, and link these data with our 1861–71 figures.
We implement a difference-in-differences (DiD) strategy to identify the effect of eliminating borders on population growth. We observe that municipalities near removed borders experienced a growth acceleration compared to those farther away, suggesting a spatial relocation of population toward the former border in the aftermath of unification. We control for a number of potential confounding factors such as distance to a rail line, elevation, or (via fixed effects) regional differences in institutions or demographic behavior. Still, our estimates would be biased if pre-unification trends in population growth were correlated with distance from removed borders. A particular concern is reverse causation, the possibility that economies were integrating and activity moving toward border areas before 1861, leading to calls for the process to be completed through a political union. Several considerations offer reassurance on this point. First, for Piedmont we can directly verify the absence of such pre-trends. Second, for Tuscany and the South the one pre-unification observation on growth does not suggest any cross-border integration before 1861. If anything, places close to borders were growing more slowly than those farther away. This pattern is reversed only after unification.Third, the consensus among historians is that, far from being protagonists, merchants and industrialists were largely disengaged from the Risorgimento struggle (Davis Reference Davis2000, p. 235; Toniolo Reference Toniolo1998, p. 81; Riall Reference Riall2009, p. 108). Finally, our results emerge not only in the North, but just as strongly in the South, which played no role in the designs of the Piedmontese leaders and unexpectedly came to be part of the new kingdom through the autonomous exploits of Garibaldi.
Our findings indicate a meaningfully large acceleration in population growth in municipalities near the former borders relative to other sample municipalities. Our results indicate that being four hours (walking time) closer to a former border is associated with a post-1861 growth acceleration of approximately 0.08 percentage points, which can be compared to an average annual growth rate of 0.6 percent. This change could occur via either natural increase or migration. We find suggestive evidence for the second of these mechanisms: in municipalities near the former borders, an increase in the ratio of the population physically present to the population with legal residence is observed. This change in the number of recent arrivals, on the order of 1 percent over the 1861–71 decade, is large enough to be consistent with our estimated acceleration in population growth.
The remainder of the paper is organized as follows. In the second section, we present evidence on how fragmentation impeded trade in preunification Italy and review related literature on market access and borders. The third section describes the sources and construction of our population dataset and geographic controls, and presents a descriptive overview of the data. The fourth section presents our main results. The fifth section discusses channels and robustness checks, and in the sixth section, we offer some concluding thoughts.
BEFORE THE UNICATION—FRAGMENTATION, TRADE, AND RELATED LITERATURE
Out of the literature on the Italian economy in the long run have emerged numerous hypotheses about factors holding back development. Recent contributions, which typically adopt a regional perspective, have focused on human capital (Ciccarelli and Weisdorf Reference Ciccarelli and Weisdorf2019; Federico et al. Reference Federico, Nuvolari, Ridolfi and Vasta2021; Postigliola and Rota Reference Postigliola and Rota2021); social capital (Cappelli Reference Cappelli2017; Guiso, Sapienza, and Zingales Reference Guiso, Sapienza and Zingales2016; Mariella Reference Mariella2022); institutions (Federico and Dincecco Reference Federico, Dincecco and O’Brien2021; de Oliveira and Guerriero Reference Oliveira and Guerriero2018; Di Martino, Felice, and Vasta Reference Di Martino, Felice and Vasta2020); and natural resources and geography (Malanima 2016; Bardini Reference Bardini1997; A’Hearn and Venables Reference A’Hearn, Venables and Toniolo2013). Here our focus is on an older concern, one that loomed especially large in the minds of contemporaries: the problem of market fragmentation. In this section, we discuss the evidence on pre-unification barriers to intra-Italian trade and the literature on market access to which our paper also relates.
Market Fragmentation in Italy before Unification
The best estimates of pre-unification trade are those of Federico and Tena-Junguito (Reference Federico and Tena-Junguito2014) for the 1850s, which show that the Italian states traded much more with external partners than their immediate neighbors. Only in the small, landlocked Duchies of Modena and Parma did Italy’s share of trade exceed one-third; for Sicily, it was less than a tenth. The situation began to change after 1861, but long-distance interregional trade failed to take off in a dramatic way, and economic growth was anemic.
For Marxist historians, both trade and growth were held back by a stagnant, precapitalist agricultural sector, which kept even the unified national market small (Sereni Reference Sereni1966).Footnote 3 For Fenoaltea, high costs of transport were the binding constraint (2011, ch. 5). Others argued that even if de jure unification could be accomplished with a simple vote of Parliament, de facto unification of markets was an inevitably slow process (Bastasin and Toniolo Reference Bastasin and Toniolo2020, ch. 2). A more radical hypothesis is that the regional economies were too similar to benefit from specialization and exchange; all of them remained poor, agricultural, resource-scarce, and labor-abundant. At least in terms of broadening markets, unification’s impact was minimal (Zamagni Reference Zamagni1983; Cafagna Reference Cafagna1989, p. xxvii).
Before unification, an additional set of border-related costs hindered trade. Anderson and van Wincoop (Reference Anderson and van Wincoop2004) break such costs down into policy barriers (such as tariffs), language differences, currency differences, costs of acquiring information about markets and trading partners, and costs of contracting and enforcement across jurisdictional boundaries. Legal (Giorcelli and Moser Reference Giorcelli and Moser2020), cultural (Lecce, Ogliari, and Orlando Reference Lecce, Ogliari and Orlando2021), and linguistic (De Mauro Reference Mauro1963; Tamburelli Reference Tamburelli2014) differences all mattered in Italy, but it was currency differences and protectionist barriers that were most significant.Footnote 4
Six monetary systems operated in Italy on the eve of unification, some on a silver standard and others bimetallic, some decimalized and others adhering to older multiples of 12 or 20 (Conte, Toniolo, and Vecchi 2003; Chiaruttini Reference Chiaruttini2018; Sannucci Reference Sannucci, De Cecco and Giovannini1989). As many as 270 types of coins, extremely diverse in vintage and origin, circulated alongside the banknotes of nine issuing banks.Footnote 5 Cross-border transactions entail exchange rate risks. To illustrate this fact, we can look at bill of exchange prices, which reveal that intra-Italian exchange rates were just as volatile as those between Italian and foreign currencies (Online Appendix Table B1). Indeed, the most volatile exchange rates of all were intra-Italian: between the Neapolitan ducat and either the Austrian or the Piedmontese lira. Similarly, correlations were low for intra-Italian currency pairs (Online Appendix Table B2). On the Milan bourse, for example, the exchange rate for Turin is much better correlated with the rates for Paris, Amsterdam, or Augsburg than with the rates for Florence or Naples. Recent studies of the Latin Monetary Union of 1865 confirm that monetary fragmentation hindered trade (Timini Reference Timini2018; Vicquéry Reference Vicquéry2021).
A further limitation to market integration were the tariff barriers imposed by all Italian states. The best estimates of tariff protection are those of Tena-Junguito et al. (Reference Tena-Junguito, Lampe and Tamega Fernandes2012), for Piedmont, Lombardy, and the Papal State; despite substantial cuts after 1846, ad valorem tariffs on manufactured goods remained high on the eve of unification. In Online Appendix Table B3, we report two additional measures that can be calculated for all states: total customs revenue as a share of total imports, and an index of specific tariffs relative to Piedmont. Both confirm the picture of substantial protection in the late 1850s, especially in Lombardy, the Papal State, and the South. Importantly, other Italian states were not accorded favorable treatment; if anything, it was foreign states that benefited from special concessions. To these import taxes, we can add non-tariff barriers such as outright prohibitions, state monopolies, time-consuming customs formalities, and differential port charges favoring home-flagged ships.Footnote 6 It is no wonder that by the 1840s “(t)he mirage of an Italian Zollverein conquered everyone” (Tremelloni Reference Tremelloni1947, vol. 1, p. 161).
Related Literature: Market Integration and Growth in Economic History
Increased market access (or market potential; we will use the terms interchangeably) is the basis for our prediction of a reallocation of economic activity toward the former borders. The only study of market potential covering the pre-unification period is that of Bosker et al. (Reference Bosker, Steven Brakman, De Jong and Schramm2008), who studied Italian city populations over several centuries. The authors report mixed findings: although seaports and cities on navigable waterways grow faster, “a city’s relative position, measured by its urban potential, is not significant” (p. 124). Studies of the post-unification period are more abundant, but the results are again mixed. Missiaia (Reference Missiaia2016, Reference Missiaia2019a, 2019b) finds that the domestic component of market potential was an important determinant of per capita GDP in Italy’s 16 regions from 1871 to 1911, but not of the location of particular industries, for which regional factor endowments were more fundamental. Basile and Ciccarelli (Reference Basile and Ciccarelli2018) find instead that the distribution of manufacturing output across Italy’s 69 provinces was driven by domestic market potential, at least in capital-intensive sectors.Footnote 7 A’Hearn and Venables (Reference A’Hearn, Venables and Toniolo2013) have it both ways, arguing that industry was first attracted to endowments, later by domestic market access, and finally by foreign market access. Our contribution to this literature is a granular approach that allows us to be more spatially precise and capture patterns that may not be visible at higher levels of aggregation.
In developing this approach, we can draw on economic geography literature relating municipal population growth to border proximity in cases of both newly erected and recently dismantled borders. These studies include: Brakman et al. (Reference Brakman, Garretsen, van Marrewijk and Oumer2012) on EU member state integration; Brülhart, Carrere, and Trionfetti (Reference Brülhart, Carrere and Trionfetti2012) on eastern Austria after the fall of the iron curtain; Ploeckl (Reference Ploeckl2010) on Saxony and the Zollverein after 1834; and Nagy (Reference Nagy2015) and Kovács (Reference Kovács1989) on Hungary after the breakup of the Habsburg Empire. This work traces back to the influential study of German partition after WWII by Redding and Sturm (Reference Redding and Sturm2008), which documents a relative decline in cities located near the new border. The paper includes a useful discussion of market access in economic geography models.Footnote 8 Our work documents the importance of border changes even in a pre-industrial setting.
DATA
Post-Unification Population
Italy conducted censuses at decennial intervals starting in 1861, publishing on each occasion a volume with the population of every municipality in the country. Italy’s municipalities numbered 8,382 in 1871 and ranged in size from major urban centers like Naples (population 448,335) to rural territories with a population of less than a hundred. Two definitions of population are found in the Italian censuses: the population physically present on the day of the census (popolazione presente, “present population” henceforth), and the resident population. Our analysis is based on the “present” population. Two considerations motivate this choice. First present population was more accurately measured, especially in the short run. The definition of the present population was transparent, consistent across censuses, and required neither judgment calls nor calculations beyond adding up the number of individuals physically present in each household on the day of the census. It was also, until 1881, the legally relevant concept for defining municipality size, which had manifold implications for local government and fiscal matters; there was an incentive to get this number right.Footnote 9 Second, we reconstruct the population at historic 1871 municipal boundaries, and this can be done more accurately with the present population.
We downloaded data on the present population from the website of Istat, Italy’s National Statistical Institute; we call this the Sistat database.Footnote 10 Using data for 1861 and 1871, we construct a georeferenced database of municipality populations at constant 1871 municipal boundaries.
Geographical units are not constant across successive censuses, as municipalities gain and lose territory or disappear altogether in mergers with neighbors. Name changes and the redrawing of provincial boundaries further complicate matters. Our approach to dealing with these problems is illustrated in the following, comparatively straightforward case. The Lombard municipality of Farinate was annexed to its neighbor, Capralba, in 1868. In the Sistat database, Capralba had 589 inhabitants in 1861 and 1,083 in 1871. Farinate, meanwhile, is recorded with 381 inhabitants in 1861 and is missing in 1871. Capralba thus displays spuriously rapid population growth (+84 percent). To correct for such changes, we use the constant 1871 borders based on territorial variations flagged in the Sistat database and more fully documented in the 1960 statistical compilation Comuni e loro popolazione ai censimenti dal 1861 al 1951 (Italy. Istituto Centrale di Statistica 1960).Footnote 11 Our final database, therefore, has no entry for the suppressed municipality of Farinate and a record for Capralba with a population of 970 (381 + 589) in 1861 and 1,083 in 1871. Using the same sources and similar procedures, we corrected the 1861 population figures for municipalities that ceded or absorbed territory by 1871.Footnote 12
An alternative (and labor-saving) approach would have been to digitize a published Istat reconstruction of historical municipality populations at modern boundaries, for example, Istat (1985), which uses the municipal boundaries of 1981. Our database of municipalities at constant 1871 borders has two advantages. First, using historical municipalities facilitates merging with pre-unification sources considerably, since there are far fewer differences in names and administrative boundaries. Second, using ready-made sources for historical analysis can raise statistical concerns due to the modifiable areal unit problem (MAUP). MAUP refers to biases induced by the assembly of spatial subunits into larger aggregates of varying size and shape. There is no standard theory to guide the measurement of such distortions, but the empirical economic geography literature suggests that the problem is important and recommends (i) maintaining a consistent aggregation process and (ii) choosing units of aggregation that are relevant to the question asked (Reference Briant, Combes and LafourcadeBriant, Combes, and Lafourcade 2010). Using today’s administrative boundaries for a historical investigation such as ours would violate these rules.Footnote 13 Today’s metropolitan municipalities, aggregating individual communities that were both smaller and less well linked in the past, violate (ii). Similarly, a sample including such large—and historically artificial—aggregations alongside other municipalities with unchanged definitions would mean heterogeneous aggregation processes in the data, violating (i).
Our post-unification dataset comprises 7,317 municipalities within Italy’s borders as of 1861. (This total includes the islands of Sicily and Sardinia, which will not be in our estimating samples. The regions of Veneto and Lazio, annexed in 1866 and 1870, respectively, are excluded.) Of these, 1,357 experienced a name change; 24 were newly created after 1861; 8 lost territory after 1861 and were corrected to smaller, counterfactual boundaries; 85 lost territory in a way we could flag but not correct; 271 gained territory and were corrected to larger counterfactual boundaries (like Capralba); and 73 gained territory in a way that could be flagged but not corrected.
Pre-Unification Population
Finding and working with pre-unification data was challenging precisely because the country was not yet unified. There is no reliable compilation of pre- and post-unification municipal population data.Footnote 14 We have digitized pre-unification population figures for three states: Piedmont (1838 and 1848), Tuscany (1846), and the South (1828). The same issues that arise in harmonizing the censuses of 1861 and 1871 come up again in merging pre-unification data with our 1861–71 database. Our approach is to initially merge using province and municipality names, then investigate problem cases individually. We adjust pre-unification municipal populations to accord with 1871 definitions (e.g., Capralba would be merged with Farinate even before 1861 in our earlier example).Footnote 15 The resulting linked, geocoded database of pre- and post-unification municipal population figures is the first of its kind. It is based on the pre-unification sources for each state.
PIEDMONT
Pre-unification population data for Piedmont are from the 1848 census of the Kingdom of Sardinia published in 1852 (Informazioni statistiche raccolte dalla Regia commissione superiore : censimento della popolazione per l’anno 1848, 1852). The published census volumes also report municipality populations from the earlier census of 1838. We can thus compute preunification population growth rates for both 1838–1848 and 1848–1861. The merging procedure matches all 2,340 municipalities from 1871 to their 1848 counterpart.
TUSCANY
The pre-unification population data for Tuscany are from Introduzione al dizionario geografico fisico storico della Toscana (Repetti Reference Repetti1846) and refer to the year 1846. Repetti does not specify his sources, but they are likely to have been unpublished government data based on the official registration system, in which vital statistics (monthly) and population totals (annually) were reported by parish priests to local government and forwarded to the central administration in Florence.Footnote 16 The merging procedure matches all 283 municipalities of Tuscany in 1861 to an 1846 counterpart, the population of both being adjusted to constant 1871 boundaries.
SOUTH
The pre-unification population figures for the South were compiled from a transcription of the Atlante corografico storico e statistico del Regno delle Due Sicilie (Marzolla Reference Marzolla1832). The data are based on official sources and refer to the year 1828.Footnote 17 The merging procedure matches 1,833 of the 1,838 municipalities of 1861 to an 1828 counterpart, both being adjusted to constant 1871 boundaries.Footnote 18
POPULATION DEFINITION
Our pre-unification sources report something more like resident population than present population. This is explicit in the case of Piedmont, where the instructions for the 1848 census state that “travelers, vacationers, infants in the care of wetnurses, [and] day-laborers should not be registered as inhabitants of the municipality where they by chance find themselves, but [rather] in that in which they normally reside.” Serving soldiers, students, and institutionalized persons were to be treated the same way (Kingdom of Sardinia 1852, p. vi). It is implicit in the cases of Tuscany and the South. The Tuscan data are based on population counts carried out by parish priests each year in the period around Easter, when it was traditional to visit and bless homes in the parish (Bandettini Reference Bandettini1960, p. 61). This fact and the absence of any instructions regarding either a particular date or a defined set of individuals to be counted make it very unlikely that priests adopted a physically present definition of population.
The discrepancy between pre- and post-unification population definitions is problematic for our calculation of pre-1861 growth rates. The biggest concern is seasonal migration. The 1861 census was conducted on the 31st of December, a moment when mountain villages were depleted by emigration in search of work at lower altitudes. For such municipalities, linking pre-unification resident population to 1861 present population is likely to bias growth downward. We deal with this problem in several ways. First, we verify that resident population growth, though less accurate, has the same geographic pattern as present population growth in 1861–71, which means the change in definitions cannot be driving our results.Footnote 19 Second, across all our regressions, we show robustness to specifications where the outcome variable is winsorized at percentiles 1 and 99. This ensures that outliers, which municipalities with significant seasonal migration are likely to be, are not driving our results. Third, we pay careful attention to the cases of Piedmont and Tuscany, where seasonal outmigration was clustered in specific areas. This geographical clustering is a potential source of bias, as the error might correlate with our treatment of interest (distance to a removed border). The remainder of this section explains how we deal with these two cases.
In the case of Piedmont, our concern is about clustering of measurement error in the Alps, a region with deeply rooted customs of seasonal migration in response to the constraints of a severe climate (Viazzo Reference Viazzo1989; Quarantana Reference Quarantana2011). Figure A.2.a in the Online Appendix (accessible with the online supplementary materials to this paper), shows that outlier municipalities in Piedmont are indeed clustered at high elevations, many in the province of Turin. Furthermore, Online Appendix Figure A.3 shows the result of a regression of population growth on a high elevation dummy interacted with period dummies. Though high-elevation municipalities grew slower than average in all three periods, only in 1848–61 was the difference large and statistically significant for any definition of “high elevation,” which is consistent with our conjecture about the inconsistency of census population definitions. To deal with this issue, our preferred pre-unification growth period for Piedmont is 1838–48, which is not subject to changes in methods of population counts.
In the case of Tuscany, we lack pre-1846 municipal populations and so proceed differently. First, we identify the municipalities most at risk of experiencing seasonal outmigration. The province of Grosseto is of special interest because malaria rendered it almost uninhabitable in the summer, whereas its population swelled in the autumn and winter, when there was plenty of agricultural work. Figure A.2.b in the Online Appendix compares population growth in 1846–61 and 1861–71. The plot indicates that most outliers are from the province of Grosseto. Bandettini (Reference Bandettini1960, pp. 8–12) documents that Grosseto was Tuscany’s fastest-growing province before unification, even when population is measured on a consistent basis, but also speculates that the level of population was too low due to undercounting of seasonal migrants (popolazione avventizia, p. 26). We therefore include a binary indicator for Grosseto province in our regressions, and we also verify the robustness of our main results by excluding observations from this province.
Finally, in the case of the South, the discrepancy in population definitions does not appear to systematically concern a particular province (see Online Appendix Figure A.2.c). Therefore, for this case, we do not implement checks beyond winsorization of the outcome variable.
Geographic Data
To geocode the 1871 municipalities, we obtained locational data from a detailed file produced by Istat in 2001 giving the latitude, longitude, and elevation of population centers (località). The sub-municipality detail at the level of località allows us to match many 1871 municipalities that no longer existed in 2001. A majority of municipalities can be matched straightforwardly by name and region. The 580 now-defunct municipalities of 1871 were located one-by-one using Google Maps and additional information such as webpages on particular municipalities listing their administrative subdivisions (frazioni) or recounting their history in detail.
The locations of borders abolished in 1861 are of fundamental importance. Fortunately, the pre-unification state borders largely coincide with later province borders, which we obtain from Istat shapefiles for 1861 (see Figure 1). Based on historic maps, we hand-correct discrepancies such as Pavia province, today entirely in Lombardy but before 1861 split with Piedmont.
We georeference official railway maps from 1861 and 1871 (Ferrovie dello Stato 1911). We also georeference data on the location of the main commercial ports in the Kingdom of Italy. Port data come from published statistical records (Statistica del Regno d’Italia 1866).Footnote 20 Elevation rasters are produced by the International Centre for Tropical Agriculture (CIAT).
Measuring Distances
Our treatment variable is distance to a border, which we measure overland.Footnote 21 Given Italy’s complex geography and rough terrain, aerial distance can be a poor representation of the actual travel cost between two points, especially for transporting freight. A solution would be to estimate the freight transportation cost between each point, as done by Donaldson and Hornbeck (Reference Donaldson and Hornbeck2016), who use nineteenth-century transport cost estimates for the United States from Fogel (Reference Fogel1970). However, in the case of Italy, data limitations prevent us from using the same approach. There are very few sources describing accurately the transport network and transport costs in Italy at the time of unification (and even fewer before), and those extant do not cover the entire country or all modes of transport. Detailed maps published after our period have the problem that significant infrastructure improvements were completed following unification.
To approximate transport costs in the absence of direct evidence, we employ an alternative measure that accounts for rough terrain: walking time. To estimate walking time, we use Tobler’s hiking speed function, which specifies a relationship between terrain irregularity and walking speed. Hiking speed W varies relative to approximately 5 km/h on a flat surface, according to:
 $${\rm{W}} = 6{e^{ - 3.5\left| {{{dh} \over {dx}} + 0.05} \right|}}$$
The slope
 $${{dh} \over {dx}}$$
is the change in elevation over the aerial distance covered. The function is roughly symmetrical because going downhill is only advantageous when the slope is not too steep. For each cell, we estimate the travel time using the average of walking uphill and downhill through that cell. We then calculate the quickest path to a border and record the associated walking time as our measure of distance. Figure A.4 in the Online Appendix plots our estimated times against those found using Google Maps for a random sample of municipality pairs. It shows that, reassuringly, the points in the scatter plot stay very close to the 45-degree line. In the fifth section, we also show robustness to the use of aerial distance.
$${{dh} \over {dx}}$$
is the change in elevation over the aerial distance covered. The function is roughly symmetrical because going downhill is only advantageous when the slope is not too steep. For each cell, we estimate the travel time using the average of walking uphill and downhill through that cell. We then calculate the quickest path to a border and record the associated walking time as our measure of distance. Figure A.4 in the Online Appendix plots our estimated times against those found using Google Maps for a random sample of municipality pairs. It shows that, reassuringly, the points in the scatter plot stay very close to the 45-degree line. In the fifth section, we also show robustness to the use of aerial distance.
Descriptive Statistics and Data Visualization
Table 1 shows descriptive statistics of our controls and variables of interest for the full 1861–1871 data (Columns (1)–(4)) and the subsample for which we have been able to assemble pre-unification data (Columns (5)–(8)). Mean growth over the decade of 1861–1871 was 6.04 percent, which corresponds to a yearly growth of approximately 0.59 percent.
SUMMARY STATISTICS OF MUNICIPALITY CHARACTERISTICS AND SAMPLE INFORMATION
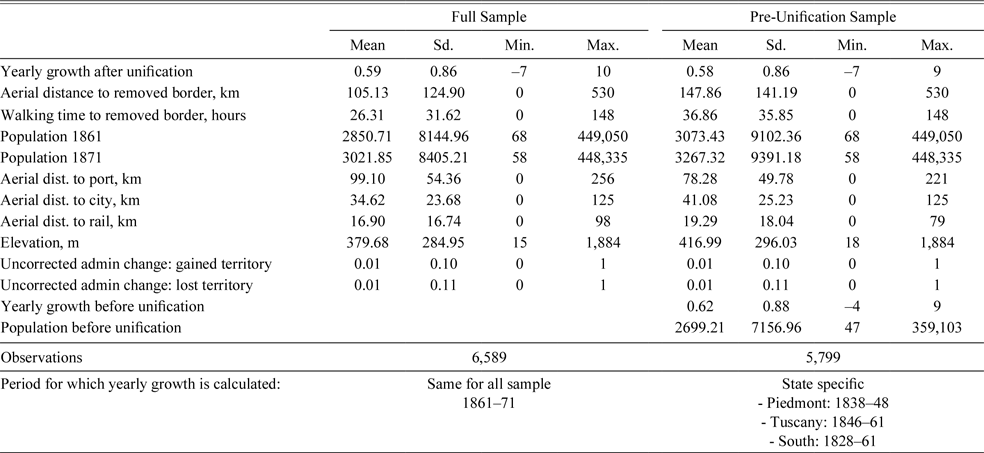
Notes: This table reports summary statistics (averages, standard deviations, minima, and maxima). The first four columns show figures for the entire sample used in our analysis (excluding Sicily and Sardinia). The last four columns show figures for only Piedmont, Tuscany, and the South, for which we have pre-unification data.
Source: Data sources and control variables are described in the main text.
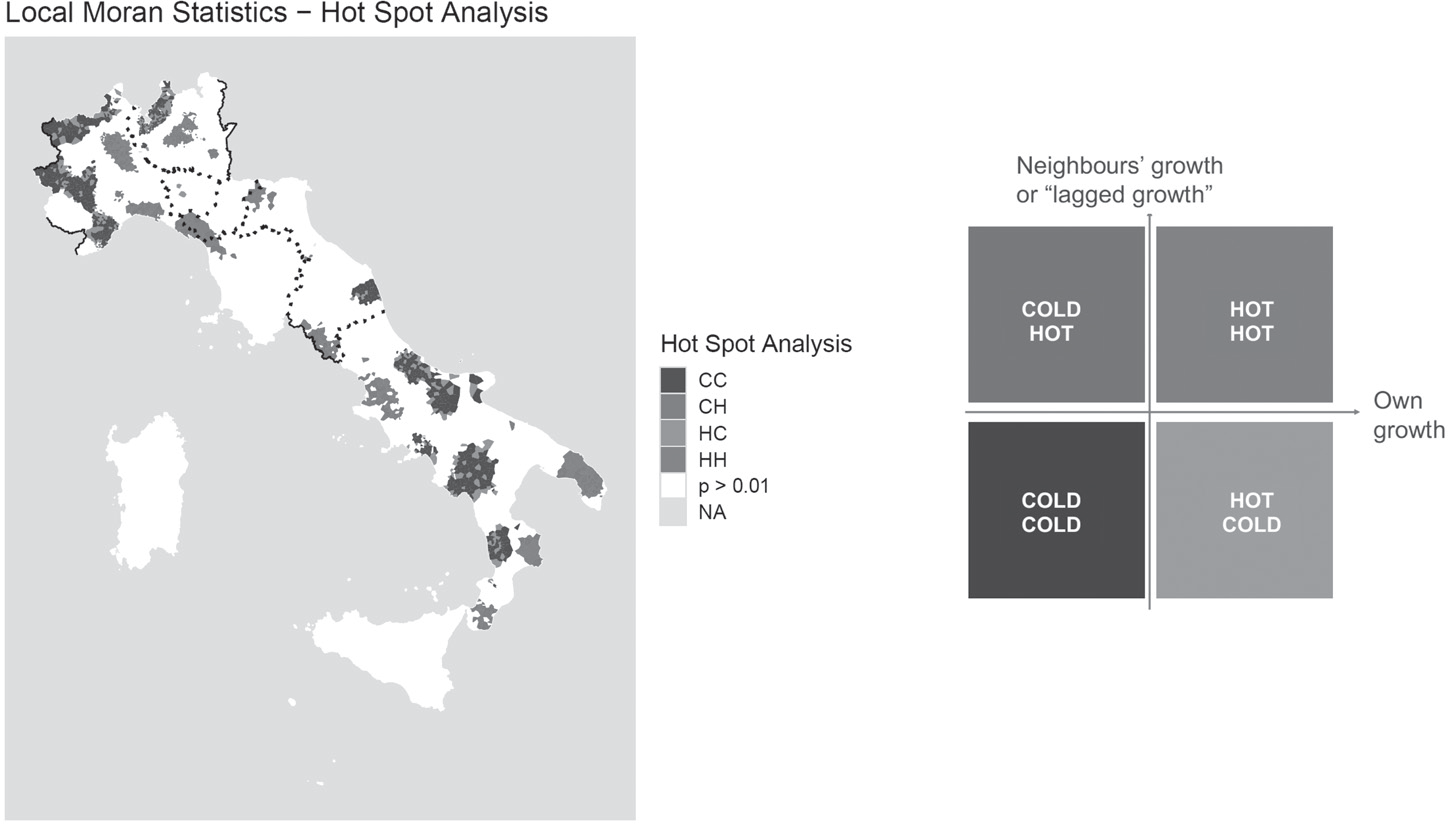
Furthermore, we explore spatial patterns in growth for the post-unification period using a local Moran statistic. It identifies municipalities that, in conjunction with their neighbors, exhibit unusual growth patterns. These can be categorized as “Hot-Hot” (“Cold-Cold”) clusters when both the municipality and its neighbors display above-average (below-average) growth, or as “Hot-Cold” local anomalies when an unusually fast-growing municipality is surrounded by slow growers (“Cold-Hot” for the mirror-image anomaly). Figure 2 maps municipalities with statistically significant local Moran values. The map reveals dark slow-growth clusters primarily in the Alpine and southern Apennine areas. Lighter fast-growth clusters are scattered throughout the peninsula. Some are near major centers of commercial activity (around Genoa), early industrialization (Bergamo, northeast of Milan), or market-oriented agriculture (Lecce, in the heel of the boot). If these examples are quickly explained, the logic of other “hotspots” is less immediately obvious. On the Piedmont side of the former border with Lombardy is a cluster that turns out to coincide with an irrigated rice-growing zone. Rice was a booming sector in the 1860s, with production and export both growing at more than 10 percent per year (Istat 2011, p. 626; Coclanis Reference Coclanis1993, p. 1076).Footnote 22 Another example spans the formerly fragmented stretch of coast between Liguria and Tuscany, which has the appearance of a diversified economy serving wider markets. The dynamic coastal towns of La Spezia (naval base), Viareggio (tourism), and Massa and Carrara (limestone and marble) may have been the driving force of this diversified economy, but growth spread well inland to encompass smaller municipalities in the foothills of the Apuan Alps. These and other spatial patterns evident in Figure 2 or uncovered in the empirical analysis of the fourth section are discernible only with spatially disaggregated data and are documented here for the first time.
HOT SPOT ANALYSIS—LOCAL MORAN STATISTIC OF 1861–71 POPULATION GROWTH
Notes: The left panel maps the statistically significant clusters found when computing the local indicator of spatial association (LISA) at the municipality level. The indicator used is the local Moran statistic. The weights are row-standardized and computed with proximity measure
 $${1 \over {\sqrt {{w_{ij}}} }}$$
, where w
ij is the walking time between municipality i and j. The right panel represents the types of spatial associations that can be found in a Moran scatter plot.
$${1 \over {\sqrt {{w_{ij}}} }}$$
, where w
ij is the walking time between municipality i and j. The right panel represents the types of spatial associations that can be found in a Moran scatter plot.
Source: Authors’ illustrations. Data sources are described in the main text.
EMPIRICAL ANALYSIS
Specification
We aim at assessing whether unification changed patterns of growth at the local level for municipalities close to a removed border, which are those that experienced the largest internal market access shock. We rely on two main methods to answer this question. First, a semi-parametric estimate of the effect of distance to the border on population growth before and after unification. This first approach allows us to visualize a flexible relationship between population growth and distance to a removed border at different points in time. Second, a DiD estimate of the difference in the effect of distance to the border on local population growth, before and after unification. This second approach permits estimation of the change in the effect of distance to a border after unification.
SEMI-PARAMETRIC ESTIMATES
We first estimate semi-parametrically Equation (1).
 $${\rm{growt}}{{\rm{h}}_i} = m({\rm{distanc}}{{\rm{e}}_i}) + \boldsymbol{{X_i}^\prime} \beta + {\lambda _r} + {\varepsilon _i}$$
The term growth i is the population growth of municipality i. The term distance i is the distance between municipality i and the closest removed or newly imposed border. Removing borders increases market access, so we expect that municipalities in the vicinity of one will experience higher growth. On the contrary, imposing a new border restricts market access, so we expect it to decrease the growth of municipalities nearby. The vector X i ′ contains a set of controls at the municipality level: initial population; elevation; a binary variable equal to one if the municipality experienced territorial gains in the period 1861–71 and the associated population growth could not be corrected when standardizing municipalities to 1871 boundariesFootnote 23; a counterpart variable flagging uncorrected losses; and distances to the nearest major port, large city, and railway line. Region fixed effects are included in the regression (λ r ).Footnote 24 To avoid comparing places that are too dissimilar and where very different determinants of agglomeration apply, all our estimates focus on municipalities that fall within a 25-hour walking time buffer to the nearest border (this restriction applies throughout the paper).Footnote 25
The function m(.) is estimated using Robinson’s double difference estimator. The semi-parametric approach allows for a flexible effect of distance to a border on growth (while control effects are linear), yielding a graphic visualization of the estimated effects. However, the double-difference estimator estimates one non-parametric relationship at a time, which means that we separately estimate border effects for periods before and after unification. In other words, although this specification has the advantages of flexibility and visualization, it does not permit estimation of time-varying border effects. Introducing more complex multivariate semiparametric specifications is beyond the scope of this paper. We thus estimate average time-specific border effects using OLS in a linear DiD specification.
DIFFERENCES-IN-DIFFERENCES
To measure whether, on average, unification changed the effect of distance to the border, we estimate a DiD using OLS. The regression is described in Equation (2).
 $$\rm{Growth}_{it} = {\mu _1}{\rm{di}}{{\rm{s}}_i} + {\mu _2}{\rm{pos}}{{\rm{t}}_t} \times {\rm{di}}{{\rm{s}}_i} + {\mu _2}{\rm{pos}}{{\rm{t}}_t} + \boldsymbol{{X_i}^\prime} \beta + {\lambda _r} + v{_{it}}$$
The outcome variable growth
it
is the average annual percentage population growth of municipality i in period t. For post-unification average annual population growth, the period is 1861–71. For pre-unification, the period varies depending on data availability for each state: for Piedmont, 1838–48; for Tuscany, 1846–61; and for the South, 1828–61. Post
t
is a binary variable equal to 1 if the observation dates from the post-unification period. The vector of time-invariant controls X
i
and fixed effects λ
r
are those described in the previous sub-section and summarized in Table 1. Our coefficient of interest is
 $${\hat \mu _2}$$
, which captures the estimated change in the effect of distance to a border before and after unification. An acceleration of growth close to a removed border after unification, compared to before, implies µ
2 < 0. Such an effect may be due to an acceleration of natural increase in municipalities close to a border or to a relocation of population from farther municipalities. In the fifth section, we show evidence of internal migration, highlighting the plausibility of a relocation effect.
$${\hat \mu _2}$$
, which captures the estimated change in the effect of distance to a border before and after unification. An acceleration of growth close to a removed border after unification, compared to before, implies µ
2 < 0. Such an effect may be due to an acceleration of natural increase in municipalities close to a border or to a relocation of population from farther municipalities. In the fifth section, we show evidence of internal migration, highlighting the plausibility of a relocation effect.
Bertrand, Duflo, and Mullainathan (Reference Bertrand, Duflo and Mullainathan2004) highlight the risk of underestimating standard errors in DiD specifications, given the possibility of serial correlation when treatments are defined for clusters of individuals (for instance, in an individual-level DiD with treatments defined at the administrative-unit level). One solution is to cluster standard errors at the treatment level. In our case, there are no individual observations aggregated into treatment clusters; both treatment intensity and observations vary at the municipality level. Municipality-level clustering would potentially underestimate standard errors if observations are spatially correlated (Kelly Reference Kelly2019). A more cautious approach is therefore to cluster standard errors at higher levels of aggregation. We thus cluster standard errors at the province level, which is the level of spatial aggregation above the municipality that is available in our data and therefore a natural unit to consider. One caveat is that there are few provinces in our sample (19 in total), which could introduce a small cluster number bias. Therefore, we also construct arbitrary geographic units, whereby municipalities falling in the same cell of a 15 km x 15 km grid are attributed to the same cluster.Footnote 26 Standard errors clustered at both levels are reported in all the baseline specifications. We further assess the issue of spatial correlation in the Robustness section. To assess the validity of our DiD estimation, we can test for pre-trends in the case of Piedmont, the only state for which we can compute population growth at two points in time before unification. This analysis, presented in detail in the results section, gives reassurance that any change in the effect of distance on the border is only significant after unification.
Results
SEMI-PARAMETRIC ESTIMATES
Did unification change the effect of distance to the border on population growth? Figure 3 (a) shows that, conditional on controls, population growth was higher farther from the border before unification and that this pattern is reversed after unification. Unification thus seems to have significantly accelerated population growth for municipalities close to a removed border.
SMOOTHED YEARLY GROWTH AND DISTANCE TO REMOVED BORDER, POOLED REGRESSION
Notes: These graphs illustrate the effect of distance to a removed border on yearly growth before and after unification. The average growth in the samples (pre- and post-unification) is indicated by the horizontal light-colored lines. The shaded areas represent 95 percent confidence intervals. The sample is restricted to municipalities within a 100 km buffer from the border.
Source: Data sources and control variables are described in the main text.
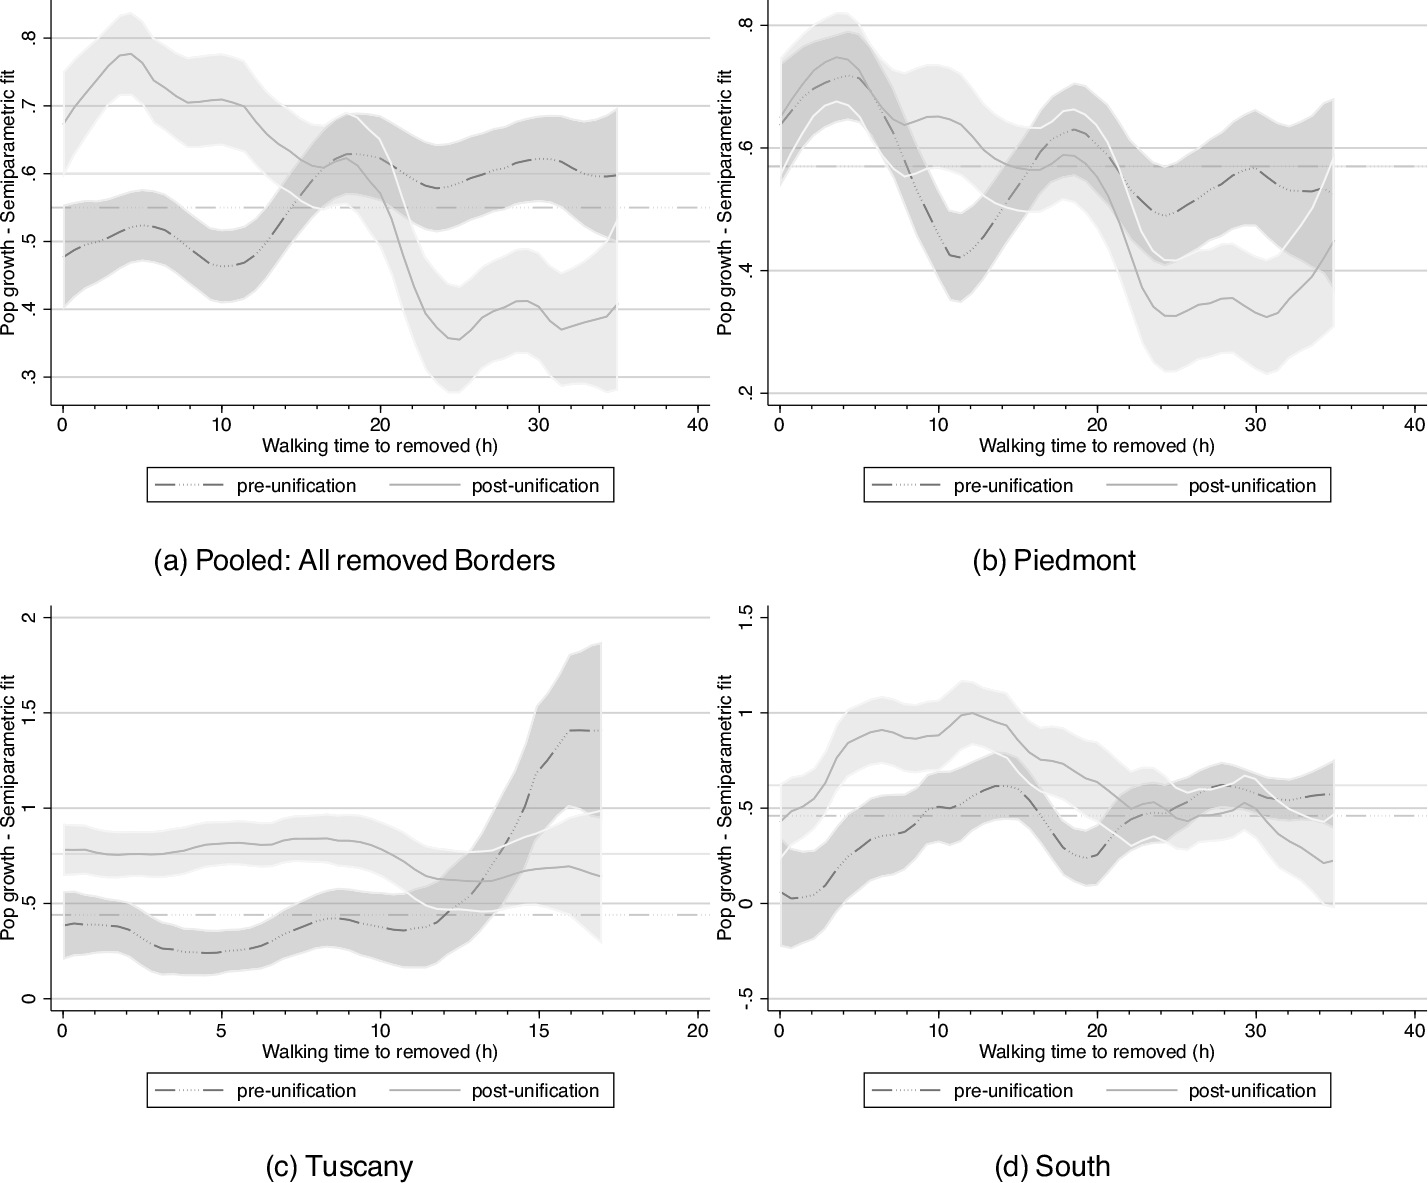
Figures 3(b) to 3(d) present the same analysis separately for Piedmont (b), Tuscany (c), and the South (d). The pooled result hides heterogeneity. In Tuscany, we see that the sharp pre-unification increase in growth far from the border completely vanishes.Footnote 27 Piedmont offers stronger evidence. It appears that, conditional on controls, unification significantly increases population growth for municipalities close to the border but not immediately adjacent to it; the change is greatest at approximately 10 hours of walking time. The southern case exhibits the most striking effect. Prior to 1861, municipalities near the country’s northern border grew substantially and statistically significantly slower than average. After unification, growth accelerates quite dramatically near the former border—by as much as 0.7 percentage points per annum within a two- to five-hour walk.
DIFFERENCES-IN-DIFFERENCES
Baseline Results
We now turn to estimating the average effect of removing internal borders on local population growth. We estimate Equation (2) using OLS. Table 2 reports the estimates of an OLS regression pooling Piedmont, Tuscany, and the South. The table shows that
$${\hat \mu _2}$$
is negative and statistically significant. The estimated effect is –0.023 (Columns (1) and (3)) and is significant with both grid-level and province-level clustering. This implies that a 4-hour decrease in walking time to a removed border is associated with 0.088 points faster growth after unification compared to before. This acceleration represents 14.5 percent of the sample’s average growth. Columns (2) and (4), which present estimates when growth rates are “winsorized,” show that these results are not driven by outliers.
DID, POOLED REGRESSION ACROSS ALL REMOVED BORDERS

Notes: * p<0.10, ** p<0.05, *** p<0.01. The table reports OLS estimates. The unit of observation is the municipality. The sample pools pre- and post-unification data for Piedmont, Tuscany, and the South. The dependent variable is yearly population growth in Columns (1) and (3) and censored yearly population growth (5 percent cutoff) in Columns (2) and (4). Standard errors are clustered at the 15 km × 15 km grid level (Columns (1) and (2)) or at the province level (Columns (3) and (4)). Post-unification population growth is computed for the period 1861–71. For yearly pre-unification growth levels the period of choice depends on data availability: Piedmont 1838–48, Tuscany 1846–61, and South 1828–61.
Source: Data sources and control variables are described in the main text.
While distance from the border had a statistically significant positive impact on growth before unification, the total post-unification effect,
 $${\hat \mu _1} + {\hat \mu _2}$$
, becomes negative and statistically significant across all specifications. In other words, proximity to a removed border is associated with a growth penalty before 1861 and a growth premium after unification. In terms of magnitude, the growth premium of a 4-hour decrease in travel time to a former border after unification is approximately 8.4 percent of the sample average growth.
$${\hat \mu _1} + {\hat \mu _2}$$
, becomes negative and statistically significant across all specifications. In other words, proximity to a removed border is associated with a growth penalty before 1861 and a growth premium after unification. In terms of magnitude, the growth premium of a 4-hour decrease in travel time to a former border after unification is approximately 8.4 percent of the sample average growth.
Table 3 shows the results when Equation (2) is estimated separately for Piedmont (Panel A), Tuscany (Panel B), and the South (Panel C). In every case, the estimate
 $${\hat \mu _2}$$
is negative and statistically significant, thus showing that our results are not only driven by one particular state. However, the magnitudes are much larger in Tuscany. This result is driven by the province of Grosseto, discussed in the second section. Table A.5 in the Online Appendix shows that when the province is excluded, the estimated effects are half the size, thus of a magnitude more comparable to the South and Piedmont.
$${\hat \mu _2}$$
is negative and statistically significant, thus showing that our results are not only driven by one particular state. However, the magnitudes are much larger in Tuscany. This result is driven by the province of Grosseto, discussed in the second section. Table A.5 in the Online Appendix shows that when the province is excluded, the estimated effects are half the size, thus of a magnitude more comparable to the South and Piedmont.
DID, ALL REMOVED BORDERS PER STATE

Notes: * p<0.10, ** p<0.05, *** p<0.01. The table reports OLS estimates. The unit of observation is the municipality. The dependent variable is yearly population growth in Columns (1) and (3) and censored yearly population growth (5 and 95 percent cutoff) in Columns (2) and (4). Standard errors are clustered at the 15 km × 15 km grid level (Columns (1) and (2)) or at the province level (Columns (3) and (4)). Post-unification population growth is computed for the period 1861–71. For pre-unification growth, the period of choice depends on data availability: Piedmont 1838–48 and 1848–1861, Tuscany 1846–61, and South 1828–61.
Source: Data sources and control variables are described in the main text.
Testing for Pre-Trends
Our identification assumption is that municipalities close to the border have the same pre-unification trends in population growth as those farther away. We can test for the existence of pre-trends in the case of Piedmont, the only state for which we can compute yearly growth rates at two points before unification (1838–48 and 1848–61). Panel A of Table 3 shows the results when estimating Equation (2) with all three periods (1838–48; 1848–61; and 1861–71) of Piedmontese data. The results show that the effect of distance interacted with the period binary variable is only sizable and statistically significant for the post-unification period.Footnote 28
As explained previously, enumeration procedures differ before and after unification in Piedmont, which potentially biases downward population growth rates for 1848–61, especially in Alpine regions. Online Appendix Table A.1 confirms the robustness of the results presented in Panel A of Table 3 to excluding high-elevation municipalities. Overall, these results provide reassurance regarding the validity of the pre-trends assumption for the DiD specifications.
ROBUSTNESS CHECKS AND DISCUSSION
Alternative Definitions of Border Distance
Table 4 reports OLS estimates of the DiD regression with alternative definitions of the variable of interest. In Columns (1)–(2), results using a binary variable for border proximity are reported. In other words, we now estimate:
 $${growth_{ct}} = {\theta _1}{({\rm{border}} < {\rm{D}})_c} + {\theta _2}{\rm{pos}}{{\rm{t}}_t} \times {({\rm{border}} < {\rm{D}})_c} + {\theta _3}{\rm{pos}}{{\rm{t}}_t} + \boldsymbol{{X_c}^\prime} \beta + {\lambda _r} + v{_{ct}}.$$
The variable (border<D)c equals 1 if municipality c is located within distance D of a removed border. We set D at 5 hours of walking time. The estimated effect
 $${\hat \theta _2}$$
indicates that municipalities in the vicinity of a removed border experienced an increase in growth of 0.20 (Column (1)) percentage points p.a., relative to municipalities farther away. This premium represents up to 30 percent of the sample mean. Figure A.7 in the Online Appendix shows that the results are robust to using other distance cut-offs for the buffers.
$${\hat \theta _2}$$
indicates that municipalities in the vicinity of a removed border experienced an increase in growth of 0.20 (Column (1)) percentage points p.a., relative to municipalities farther away. This premium represents up to 30 percent of the sample mean. Figure A.7 in the Online Appendix shows that the results are robust to using other distance cut-offs for the buffers.
DID, POOLED REGRESSION ACROSS ALL REMOVED BORDERS WITH BINARY TREATMENT

Notes: * p<0.10, ** p<0.05, *** p<0.01. The table reports OLS estimates. The unit of observation is the municipality. The sample pools pre- and post-unification data for Piedmont, Tuscany, and the South. The dependent variable is yearly population growth. Post-unification population growth is computed for the period 1861–71. For pre-unification growth, the period of choice depends on data availability: Piedmont 1838–48, Tuscany 1846–61, and South 1828–61. The treatment is a binary variable indicating that the comuni is located within 25 km (resp. 5 hour walk) to a removed border. Standard errors are clustered at the binary treatment × province level.
Source: Data sources and control variables are described in the main text.
In Columns (3)–(4), we return to a continuous treatment, now measuring border distance in kilometers as the crow flies. The results with aerial distance are consistent with those described in the fourth section. Moving 20 km closer to a former border is associated with an acceleration in growth of 0.10 after unification. Online Appendix Figure A.3 shows the semi-parametric fits of the relationship between aerial distance to a removed border and growth. The results are consistent with those presented in the section “Results.”
New Borders
Unification also meant redrawing some borders with neighboring countries. Of special interest is Piedmont, which, following the Treaty of Turin in March 1860, ceded the provinces of Nice and Savoy to France in exchange for its support in the war against Austria. If, as we claim, borders reduce market access and with it the attractiveness of production sites, we might expect to see a growth slowdown in the vicinity of newly imposed borders—the mirror image of the findings we have discussed so far. In the case of municipalities near Savoy, that is exactly what we find (
 $${\hat \mu _2} > 0$$
in Table 4, Columns (7) and (8)). The result for Nice is different. Like Savoy, the terrain was extremely rugged in the area near the new border. Unlike Savoy, coastal shipping was a viable (indeed, obviously superior) alternative to overland transport for most municipalities, making the new border less relevant for market access.Footnote 29 The semiparametric estimates are shown in the Online Appendix, Figures A.8 and A.9.
$${\hat \mu _2} > 0$$
in Table 4, Columns (7) and (8)). The result for Nice is different. Like Savoy, the terrain was extremely rugged in the area near the new border. Unlike Savoy, coastal shipping was a viable (indeed, obviously superior) alternative to overland transport for most municipalities, making the new border less relevant for market access.Footnote 29 The semiparametric estimates are shown in the Online Appendix, Figures A.8 and A.9.
Military Presence in Border Towns
The section “Data” explains possible measurement error in pre-unification growth rates arising from changes in the methods for counting population between pre- and post-unification censuses. A potential concern is the presence of military garrisons in border areas. They would have been counted in 1861 (as the census counted physically present individuals), but not before when censuses counted only legal residents. First, we note that this issue would lead us to over-estimate population growth close to border areas before unification and would therefore work against us by creating a spurious deceleration in population growth near the border, biasing our estimate of interest toward positive values. Second, we address this issue in Table A.3 of the Online Appendix, which shows the robustness of our results to excluding towns in the vicinity of the border.
Spatial Correlation
Our analysis focuses on the effects of distances, which are geographic variables. We thus must be mindful of the spatial structure of the data; ignoring this issue can result in a substantial upward bias in t-statistics. Figure A.12 in the Online Appendix shows evidence that post-unification population growth is spatially correlated. Compared to the simulated distributions of the global Moran and Geary statistics, the I and C statistics lie well outside the extreme tails of the estimated distributions, equivalent to a p-value close to zero.
Note first that our regressions focus on the change in growth patterns before and after unification. It is not obvious how such a change could be driven by spurious spatial correlation. Second, we implement three methods of adjusting standard errors to address issues of spatial correlation. First, throughout the paper, we cluster standard errors at the province level. This higher clustering level accounts for the fact that municipalities within the same administrative division can have correlated errors. Second, we estimate Conley standard errors in our main DiD regression (Equation (2)), using the code by Hsiang (Reference Hsiang2010). Figure A.10 in the Online Appendix plots the t-statistics found using different distance cutoffs (from 30 to 300 km). The resulting standard errors are larger in the vicinity of the 100 km threshold, but the p-values remain well below 0.01. Similarly, we also compute standard errors with arbitrary clustering using the approach described by Colella et al. (Reference Colella, Lalive, Orcan Sakalli and Thoenig2019), and the results remain robust across different distance cutoffs (see Figure A.11 in the Online Appendix).
Channels and Extensions
PORTS: ACCESS TO FOREIGN MARKETS
Our focus thus far has been on domestic markets. But unification entailed a shock to foreign market access too, as the liberal commercial policy of Piedmont was extended to the entire Kingdom, entailing dramatic tariff reductions in some states (as discussed in the second section). It is possible that in our period, foreign market access was more important than the research in later years has found (Basile and Ciccarelli Reference Basile and Ciccarelli2018; Daniele, Malanima, and Ostuni Reference Daniele, Malanima and Ostuni2018; Missiaia Reference Missiaia2016, Reference Missiaia2019a, 2019b). In the era before inexpensive ground transport, foreign market access was primarily through seaports (Fenoaltea Reference Fenoaltea2011, ch. 5).Footnote 30 Distant domestic destinations, too, might be reached most cheaply by coastal shipping. Proximity to a seaport is thus a potential confounding influence, as well as a municipal growth factor of substantive interest.
Distance to the nearest seaport has been a control variable in all regressions reported thus far. We now allow its effect to vary before and after unification. Table 5 reports OLS estimates of the DiD specification, adding distance to the nearest major port as an additional treatment of interest. The estimating sample includes municipalities within 25 walking hours of a removed border (the same sample as in Table 2, results reported in Columns (1) and (2)) and those within 25 walking hours of a port (reported in Columns (3) and (4)). The regressions allow for interaction effects with region and period dummies for both port and border distances.
DID, REMOVED BORDERS AND PORTS PER STATE

Notes: * p<0.10, ** p<0.05, *** p<0.01. The table reports OLS estimates. The unit of observation is the municipality. The dependent variable is yearly population growth in Columns (1) and (3) and censored yearly population growth (5 and 95 percent cutoff) in Columns (2) and (4). Standard errors are clustered at the 15 km × 15 km grid level. Post-unification population growth is computed for the period 1861–71. For pre-unification growth, the period of choice depends on data availability: Piedmont 1838–48 and 1848–1861, Tuscany 1846–61, and South 1828–61. The number of clusters, not stated to save space, exceeds 30 in all specifications and can be recovered from Rueda and A’Hearn (2022).
Source: Data sources and control variables are described in the main text.
Results confirm that distance to a removed border after unification remains negatively and significantly associated with growth, even with this more flexible treatment of port-distance as a control. Regarding port distance itself, the baseline effect is negative, suggesting the benefit of foreign market access exceeded the peril of exposure to foreign competition. But the post-unification treatment effect is small, inconsistently signed, and generally not statistically significant. It does not appear that foreign market access had a more powerful impact on the location of economic activity than domestic market access.
MIGRATION
Faster population growth in municipalities with improved market access could occur via natural increase or in-migration; both are plausible channels in our context. Birth and death rates were certainly sensitive to grain price shocks in nineteenth-century Italy (Reference Breschi, Derosas, Manfredini, Bengtsson, Campbell and LeeBreschi, Derosas, and Manfredini 2004; Bengtsson and Dribe Reference Bengtsson, Dribe, Tsuya, Feng, Alter and Lee2010; Breschi et al. Reference Breschi, Alessio Fornasin, Pozzi, Rettaroli and Scalone2014; Derosas et al. Reference Derosas, Marco Breschi, Manfredini, Munno, Lundh and Kurosu2014). Yet this evidence is of dubious relevance, for harvest fluctuations—narrow in time and broad in space—are very different from the changes induced by eliminating borders, which are broad in time (i.e., enduring) and narrow in space (local to border areas). For this reason, we focus instead on labor mobility.
There is a tendency to assume that in a somnolent, deeply traditional, agrarian context, migration must have been minimal. This view is misguided; right across western Europe, mobility was an integral part of pre-modern social life (Jackson and Moch 1989; Moch Reference Moch1992). In mid-nineteenth-century Italy, though long-distance, permanent migration was quite limited, two other types of internal mobility were important.Footnote 31 The first was medium-distance seasonal migration linked to the agricultural production cycle, typically connecting mountainous areas with lower-lying plains (Gallo Reference Gallo2012, chs. 1–2). The second was “circulatory migration” over short distances, with high rates of return migration, which often generated a legal transfer of residence preserved in official records. Just after unification, the village of Casalecchio di Reno, near Bologna, experienced annual gross flows of both in- and out-migration as high as 6.9 percent (Hogan and Kertzer Reference Hogan and Kertzer1985; Kertzer and Hogan Reference Kertzer and Hogan1985, Reference Kertzer and Hogan1990). Similar patterns of movement, responsive to economic conditions, have been documented for the pre-unification period in Casalguidi (near Pistoia in Tuscany) and in Ferrara province (Reference Breschi, Manfredini and FornasinBreschi, Manfredini, and Fornasin 2011, p. 500; Nani Reference Nani2012). The result was a well-developed “culture of mobility” in Italy: an animus migrandi, in the words of Gallo (Reference Gallo2012, p. 8). According to the census of 1861, 15 percent of the native population resided outside their birth municipality; in several regions of the North-Center, the share exceeded 20 percent.
The dual population concepts in the Italian census allow us to construct a proxy for recent migration. Migration altered the physically present population immediately, while affecting the less up-to-date resident population more slowly as legal residence was transferred or household heads changed their view of who was “temporarily absent” and who had left permanently. A municipality experiencing in-migration therefore saw a rise in the ratio of present to resident population (P/R), while one experiencing out-migration saw a fall. For most of our DiD sample, we can calculate P/R in 1861 and 1871 (see footnote 19). The wide range in P/R changes we observe over the decade, from –0.11 to +0.15 at the first and 99th percentiles, indicates considerable churn in local labor markets. We next estimate a version of Equation (2) with P/R as the dependent variable and a dummy for 1871 as the “post” variable. Table 6 presents the results. The negative, statistically significant interaction coefficient,
 $${\hat \mu _2}$$
, implies a larger P/R value in 1871 relative to 1861, the closer one moves to a former border. Closing the distance to the ex-border by 20 hours leads to a 0.01 increase in P/R, that is, 1 percent more population due to still-unregistered new arrivals. This strongly suggests labor mobility produced the population changes we document near the former borders, supporting a relocation effect of integration.
$${\hat \mu _2}$$
, implies a larger P/R value in 1871 relative to 1861, the closer one moves to a former border. Closing the distance to the ex-border by 20 hours leads to a 0.01 increase in P/R, that is, 1 percent more population due to still-unregistered new arrivals. This strongly suggests labor mobility produced the population changes we document near the former borders, supporting a relocation effect of integration.
DID, PRESENT/RESIDENT POPULATION 1861 VERSUS 1871
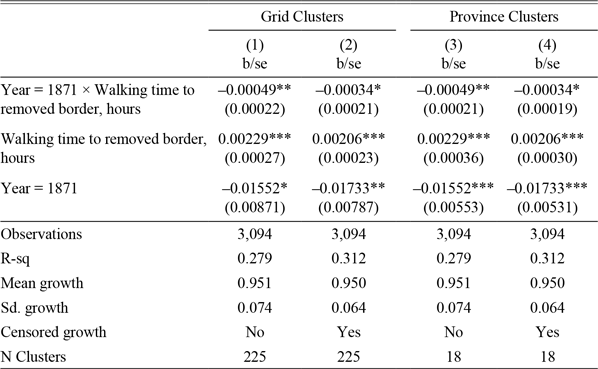
Notes: * p<0.10, ** p<0.05, *** p<0.01. The table reports OLS estimates. The unit of observation is the municipality. The dependent variable is the ratio of present over resident population (P/R) in the years 1861 or 1871. Standard errors are reported in brackets and clustered at the province level. The distance variables are interacted with a binary variable flagging year 1871.
Source: Data sources and control variables are described in the main text.
SIZE EFFECTS
As discussed in the second section, Italian municipalities varied widely in size, from less than 100 to more than 100,000 in 1861. Although we have included initial population as a control variable in our regressions, we have otherwise treated municipalities of all sizes alike, as equally affected by changes in market access. Theoretical considerations suggest this simplification may be problematic. First, as new economic geography models emphasize, a town’s own population provides much of its potential market, with the implication that large towns experience a smaller proportional change in market access when transport costs fall or borders come down. Second, monocentric models of an individual city and its hinterland typically have all manufacturing concentrated in the central city, while smaller communities in rural areas supply it with agricultural goods, which may be a better description of many Italian settlements in our period (Fujita, Krugman, and Venables Reference Fujita, Krugman and Venables1999, ch. 6). In Online Appendix Table A.6, we add to the basic DiD specification a binary variable and an interaction term flagging the smallest 10 percent of municipalities, those below the median, and the 10 percent largest. No robust pattern emerges from these triple interactions. While this exercise yields little in the way of new insights, the stability of our main effect estimates reassures us that pooling municipalities of all sizes is not distorting our results.
CONCLUSION
Political unification’s impact on economic integration in Italy has been difficult to document: no boom in interregional trade seems to have ensued, regional commodity prices varied widely, and growth proceeded at a crawl. Did the elimination of border-related impediments to internal trade not matter? The new evidence developed here shows that it did. The immediate rebound in economic activity near the former borders indirectly reveals the chilling local shadow they cast before unification.
The previously unremarked effects we find are meaningful: in-migration accelerated population growth by as much as one-third near the former borders. That said, our effects point toward a relocation effect of integration, not necessarily an effect on growth. And we are not talking about a radical reshaping of the Italian population or dramatic episodes like the siting of a new steel complex. The change we document was anonymous, microgeographic—molecular, one might say: the expansion of artisanal furniture production in a town, for example, or the construction of a new grain mill along a watercourse. The immediacy of the response, within a decade, suggests that those impediments to trade that changed immediately upon unification mattered: protective tariffs, multiple currencies, and the uncertainties of contracting with citizens of different states. For long-distance, interregional trade, these factors undoubtedly aggravated costs; for items that normally entered short- or medium-distance trade, they fragmented markets, blocked competition, and obstructed specialization and the exploitation of economies of scale. One immediate achievement of unification was, by integrating local markets, to unblock these mechanisms of economic development.


 Open access

