


INTRODUCTION
The Carmel coast of Israel is one of the main arteries that facilitated human movement from Africa to southwest Asia since the early Pleistocene (Olami and Ronen Reference Olami and Ronen1977; Zeder, Reference Zeder2008). Throughout prehistoric and historic periods, the importance of this corridor has been marked by some of the most famous Near Eastern sites (Rebollo et al., Reference Rebollo, Weiner, Brock, Meignen, Goldberg, Belfer-Cohen, Bar-Yosef and Boaretto2011; Meignen et al., Reference Meignen, Goldberg and Bar-Yosef2017) that contain evidence of sociocultural change. Previously investigated sites located in the Carmel coastal zone, coastal plain, and adjacent Carmel ridge (Fig. 1) have established a detailed understanding of sociocultural evolution by identifying transitions from hunting and gathering nomadic societies (Geometric–Kebaran; Bar-Yosef, Reference Bar-Yosef2002) to semi-sedentary cultures (Natufian; Bar-Yosef, Reference Bar-Yosef1998) to settled farming communities (Pre-Pottery Neolithic–Neolithic; Kuijt and Goring-Morris, Reference Kuijt and Goring-Morris2002; Goring-Morris and Belfer-Cohen, Reference Goring-Morris and Belfer-Cohen2011) to the transition to complex urban societies (Bronze and Iron ages; Milevski, Reference Milevski2013) and later classical and recent historical periods. This makes the area a nexus for understanding cultural developments in the eastern Mediterranean (Naveh and Carmel, Reference Naveh, Carmel and Wasser2004; Nitschke et al., Reference Nitschke, Martin and Shalev2011; Galili et al., Reference Galili, Benjamin, Eshed, Rosen, McCarthy and Horwitz2019).
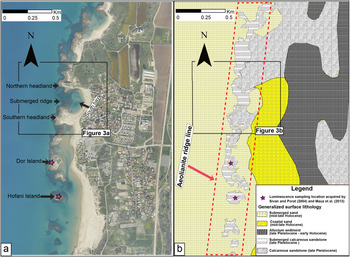
Locality maps. (a) Direction of longshore transport along the eastern Mediterranean shown by black arrows, and marine and terrestrial paleoclimate proxy locations are shown by red stars. Dashed blue line represents the Nile; dashed red lines represent approximate international borders. Outlined rectangle shows location of inset (b), which illustrates surface lithology of Israel's Carmel coastal plain, stream location, and shelf bathymetry. Red and green triangles indicate location of Neolithic habitations (Galili et al., Reference Galili, Rosen, Evron, Hershkovitz, Eshed, Kolska Horwitz, Bailey, Galanidou, Peeters, Jöns and Mennenga2020). Numbered purple circles represent previous stratigraphic studies: (1) Kadosh et al. (Reference Kadosh, Sivan, Kutiel and Weinstein-Evron2004); (2) Sivan et al. (Reference Sivan, Eliyahu and Raban2004a); (3) Cohen-Seffer et al. (Reference Cohen-Seffer, Greenbaum, Sivan, Jull, Barmeir, Croitoru and Inbar2005); (4) Sivan et al. (Reference Sivan, Greenbaum, Cohen-Seffer, Sisma-Ventura and Almogi-Labin2011); (5) Shtienberg et al. (Reference Shtienberg, Dix, Roskin, Waldmann, Bookman, Bialik, Porat, Taha and Sivan2017); (6) Goodman-Tchernov et al. (Reference Goodman-Tchernov, Dey, Reinhardt, McCoy and Mart2009); (7) Neev et al. (Reference Neev, Shachnai, Hall, Bakler and Ben-Avraham1978). Red dashed rectangle indicates locations of shallow marine geophysical surveys conducted by Shtienberg et al. (Reference Shtienberg, Dix, Waldmann, Makovsky, Golan and Sivan2016) and Goff et al. (Reference Goff, Austin and Goodman-Tchernov2018).
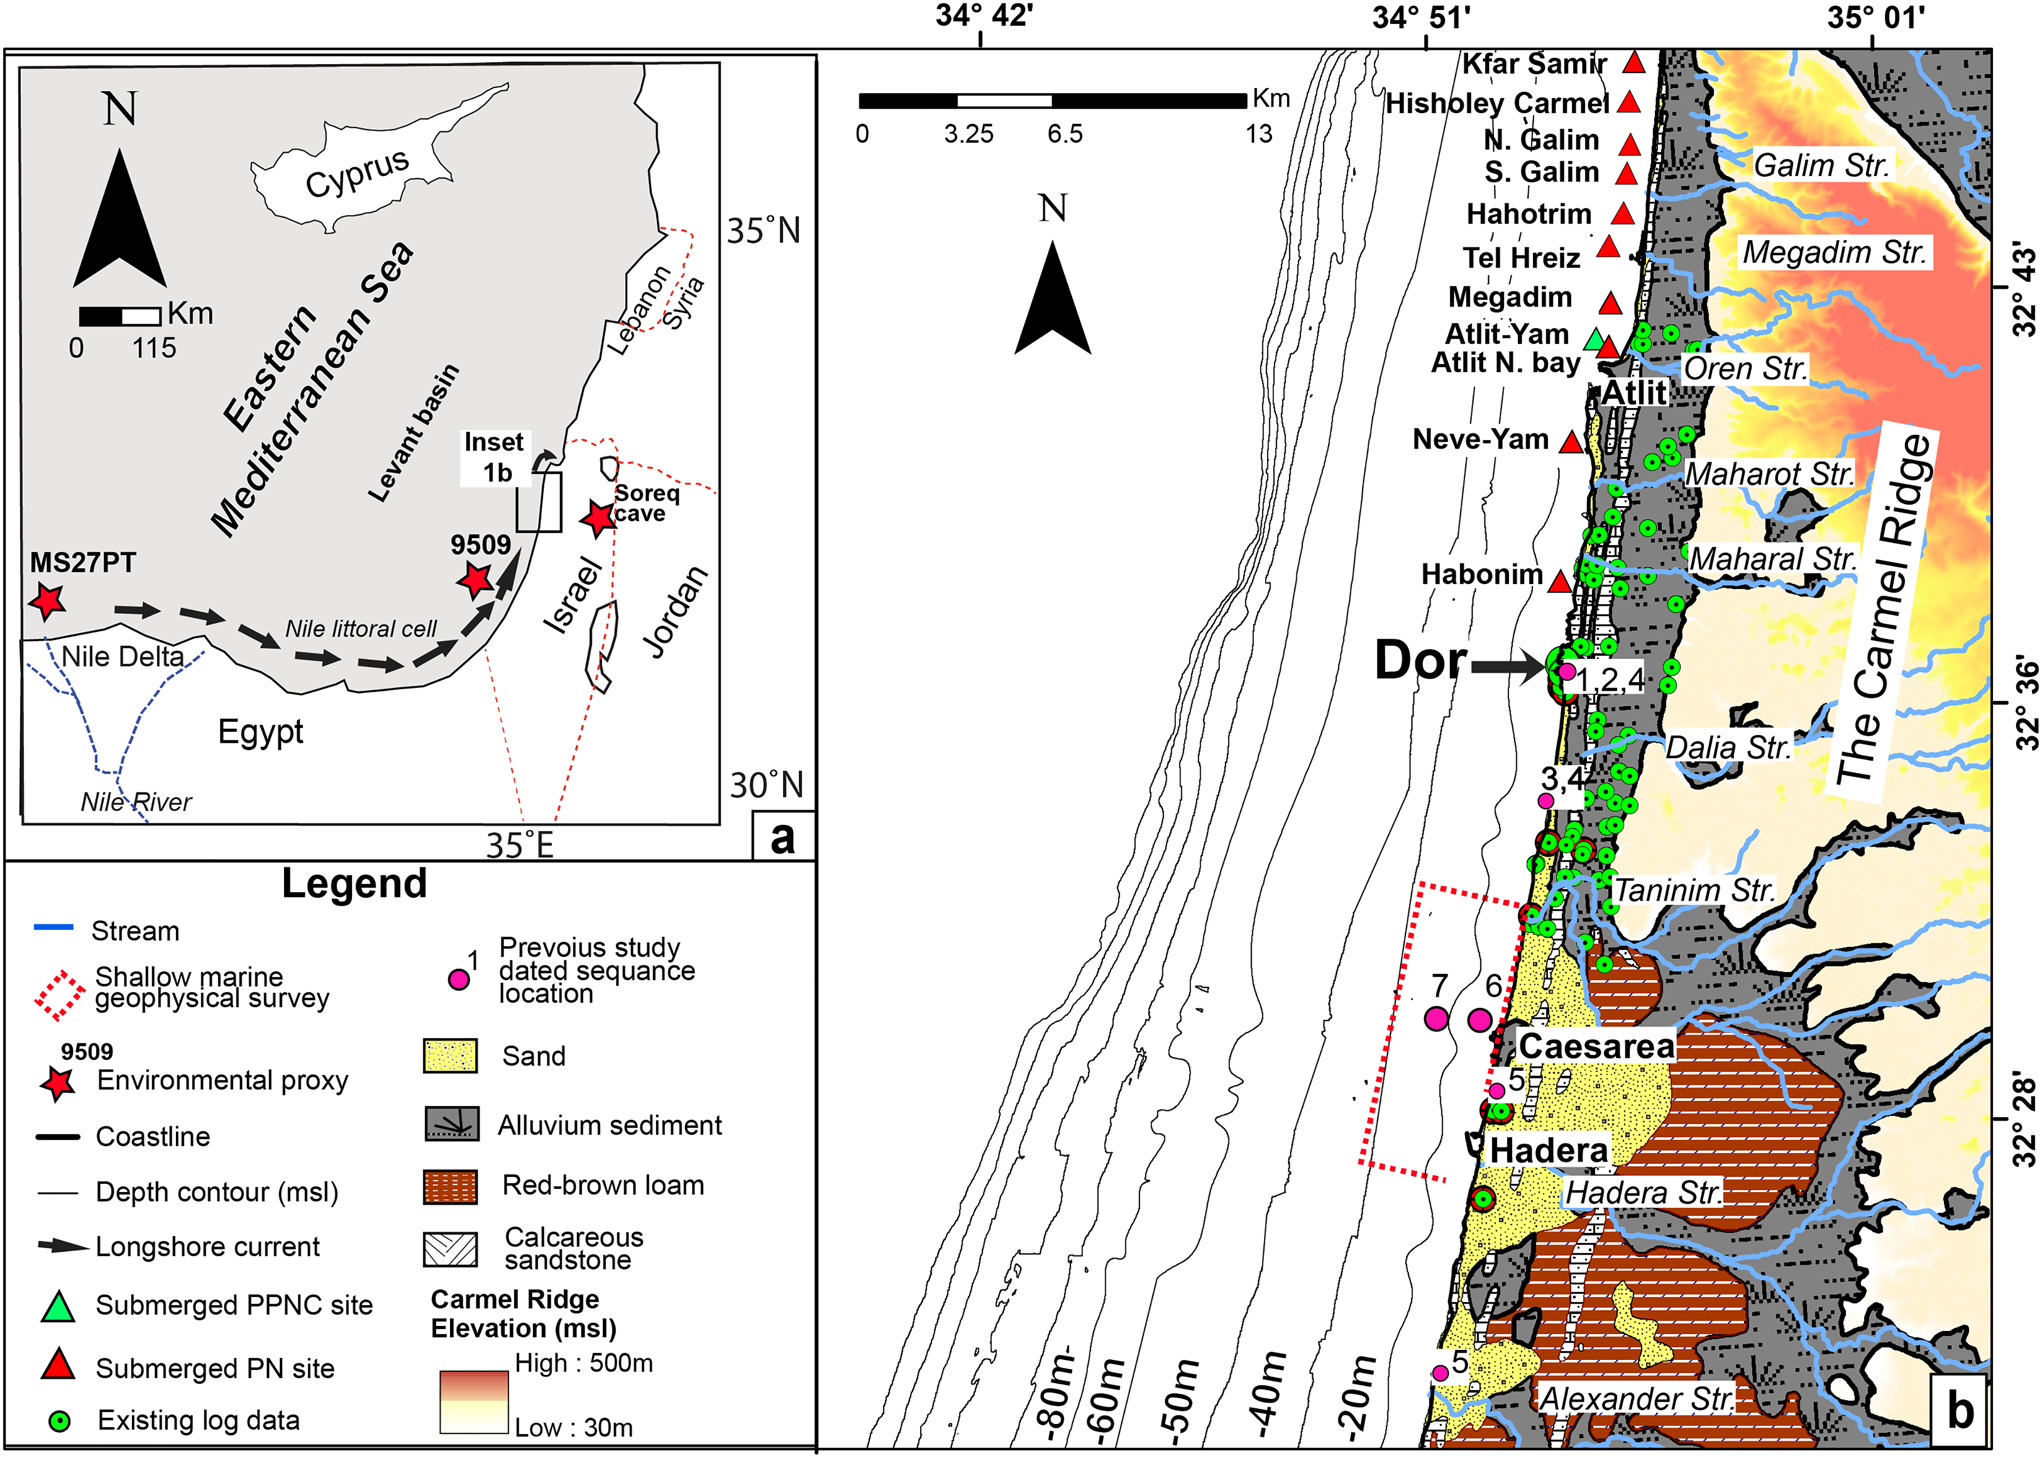
Coastal environments protected by rocky headlands, embayment and submerged ridges along the Carmel littoral zone preserve key paleoenvironmental archives of conditions associated with human settlement. The subdued marine flow energies and protection from aeolian processes in these settings efficiently trap sediments and their associated faunal, floral, and isotopic signatures of late Pleistocene and Holocene paleoenvironments (Sneh, Reference Sneh1981; Sneh and Klein, Reference Sneh and Klein1984; Schattner et al., Reference Schattner, Lazar, Tibor, Ben-Avraham and Makovsky2010; Shtienberg et al., Reference Shtienberg, Dix, Waldmann, Makovsky, Golan and Sivan2016). These sedimentary records include evidence for climate change (Kadosh et al., Reference Kadosh, Sivan, Kutiel and Weinstein-Evron2004), sediment accumulation rates (Sivan et al., Reference Sivan, Eliyahu and Raban2004a, Reference Sivan, Greenbaum, Cohen-Seffer, Sisma-Ventura and Almogi-Labin2011), hydrological events (Avnaim-Katav et al., Reference Avnaim-Katav, Almogi-Labin, Agnon, Porat and Sivan2017), and catastrophic tsunami events (Reinhardt et al., Reference Reinhardt and Raban1999, Reference Reinhardt, Goodman, Boyce, Lopez, van Hengstum, Rink, Mart and Raban2006; Tyuleneva et al., Reference Tyuleneva, Braun, Katz, Suchkov and Goodman-Tchernov2018; Shtienberg et al., Reference Shtienberg, Yasur-Landau, Norris, Lazar, Rittenour, Tamberino and Gadol2020). Underwater excavations along the Carmel coast have identified 19 in-situ Stone Age settlements ranging from the Pre-Pottery Neolithic C (9–8.4 ka) to Pottery Neolithic (7.7–6.8 ka) periods (Fig. 1b; Galili et al., Reference Galili, Rosen, Evron, Hershkovitz, Eshed, Kolska Horwitz, Bailey, Galanidou, Peeters, Jöns and Mennenga2020). Investigations of the ancient constructions and remains found in these preserved underwater sites have revealed some of the earliest evidence of water-well construction (Galili and Nir, Reference Galili and Nir1993), olive oil production (Galili and Sharvit, Reference Galili and Sharvit1994–1995; Galili et al., Reference Galili, Stanley, Sharvit and Weinstein-Evron1997; Reference Galili, Cvikel, Benjamin, Langgut, McCarthy, Cavanagh and Sapir2018), table olive preparation (Galili et al., Reference Galili, Langgut, Terral, Barazani, Dag, Kolska Horwitz and Ogloblin Ramirez2021), early fishing (Zohar et al., Reference Zohar, Dayan, Galili and Spanier2001), early developments in plant and animal domestication (Galili et al., Reference Galili, Rosen, Gopher and Kolska-Horwitz2002), as well as burial practices (Galili et al., Reference Galili, Eshed, Gopher and Hershkovitz2005). However, the precise timing of paleoenvironmental change over the Holocene is still missing.
Here, we investigate the stratigraphy adjacent to Tel-Dor (Fig. 1), a key ancient urban center on the Carmel coast where an embayment (Figs. 2, 3) has protected the stratigraphic record sufficiently to provide a high-quality, integrated paleoenvironmental and archaeological record of the coastal plain. Habitation at Tel-Dor mound site began in the Middle Bronze Age II (3.9–3.5 ka), and continued to grow and develop throughout the Roman Period (2–1.7 ka), Byzantine (1.7–1.4 ka), and Crusader (0.9–0.75 ka) periods (e.g., Stern, Reference Stern1994; Raban, Reference Raban, Stern, Berg, Gilboa, Guz-Zilberstein, Raban, Rosenthal-Heginbottom and Sharon1995; Gilboa and Sharon, Reference Gilboa and Sharon2008; Nitschke et al., Reference Nitschke, Martin and Shalev2011). Recent excavations conducted in the south bay adjacent to the Tel identified an Iron Age II harbor (Fig. 3b; Arkin Shalev et al., Reference Arkin Shalev, Gilboa and Yasur-Landau2019) and submerged Neolithic structures (Fig. 3b; Shtienberg et al., Reference Shtienberg, Yasur-Landau, Norris, Lazar, Rittenour, Tamberino and Gadol2020), pointing towards Dor's complex and long pattern of human habitation, which is a focal point for our investigation.
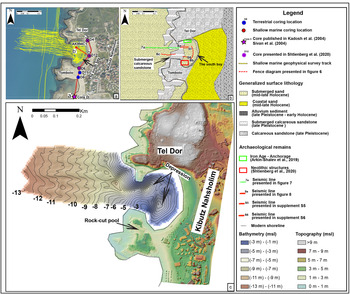
Aeolianite ridge geometry and surface lithology from the coastal zone of Dor: (a) aerial view; (b) surface lithology map. The dashed red rectangle representing the approximate aeolianite ridge extent in the area outlines headlands, islands, and a wave-cut platform that are found in close proximity to the current shoreline. Purple stars mark the location of luminescence ages from Sivan and Porat (Reference Sivan and Porat2004) and Mauz et al. (Reference Mauz, Hijma, Amorosi, Porat, Galili and Bloemendal2013). Open rectangles mark approximate boundaries for close-up maps found in Figure 3.

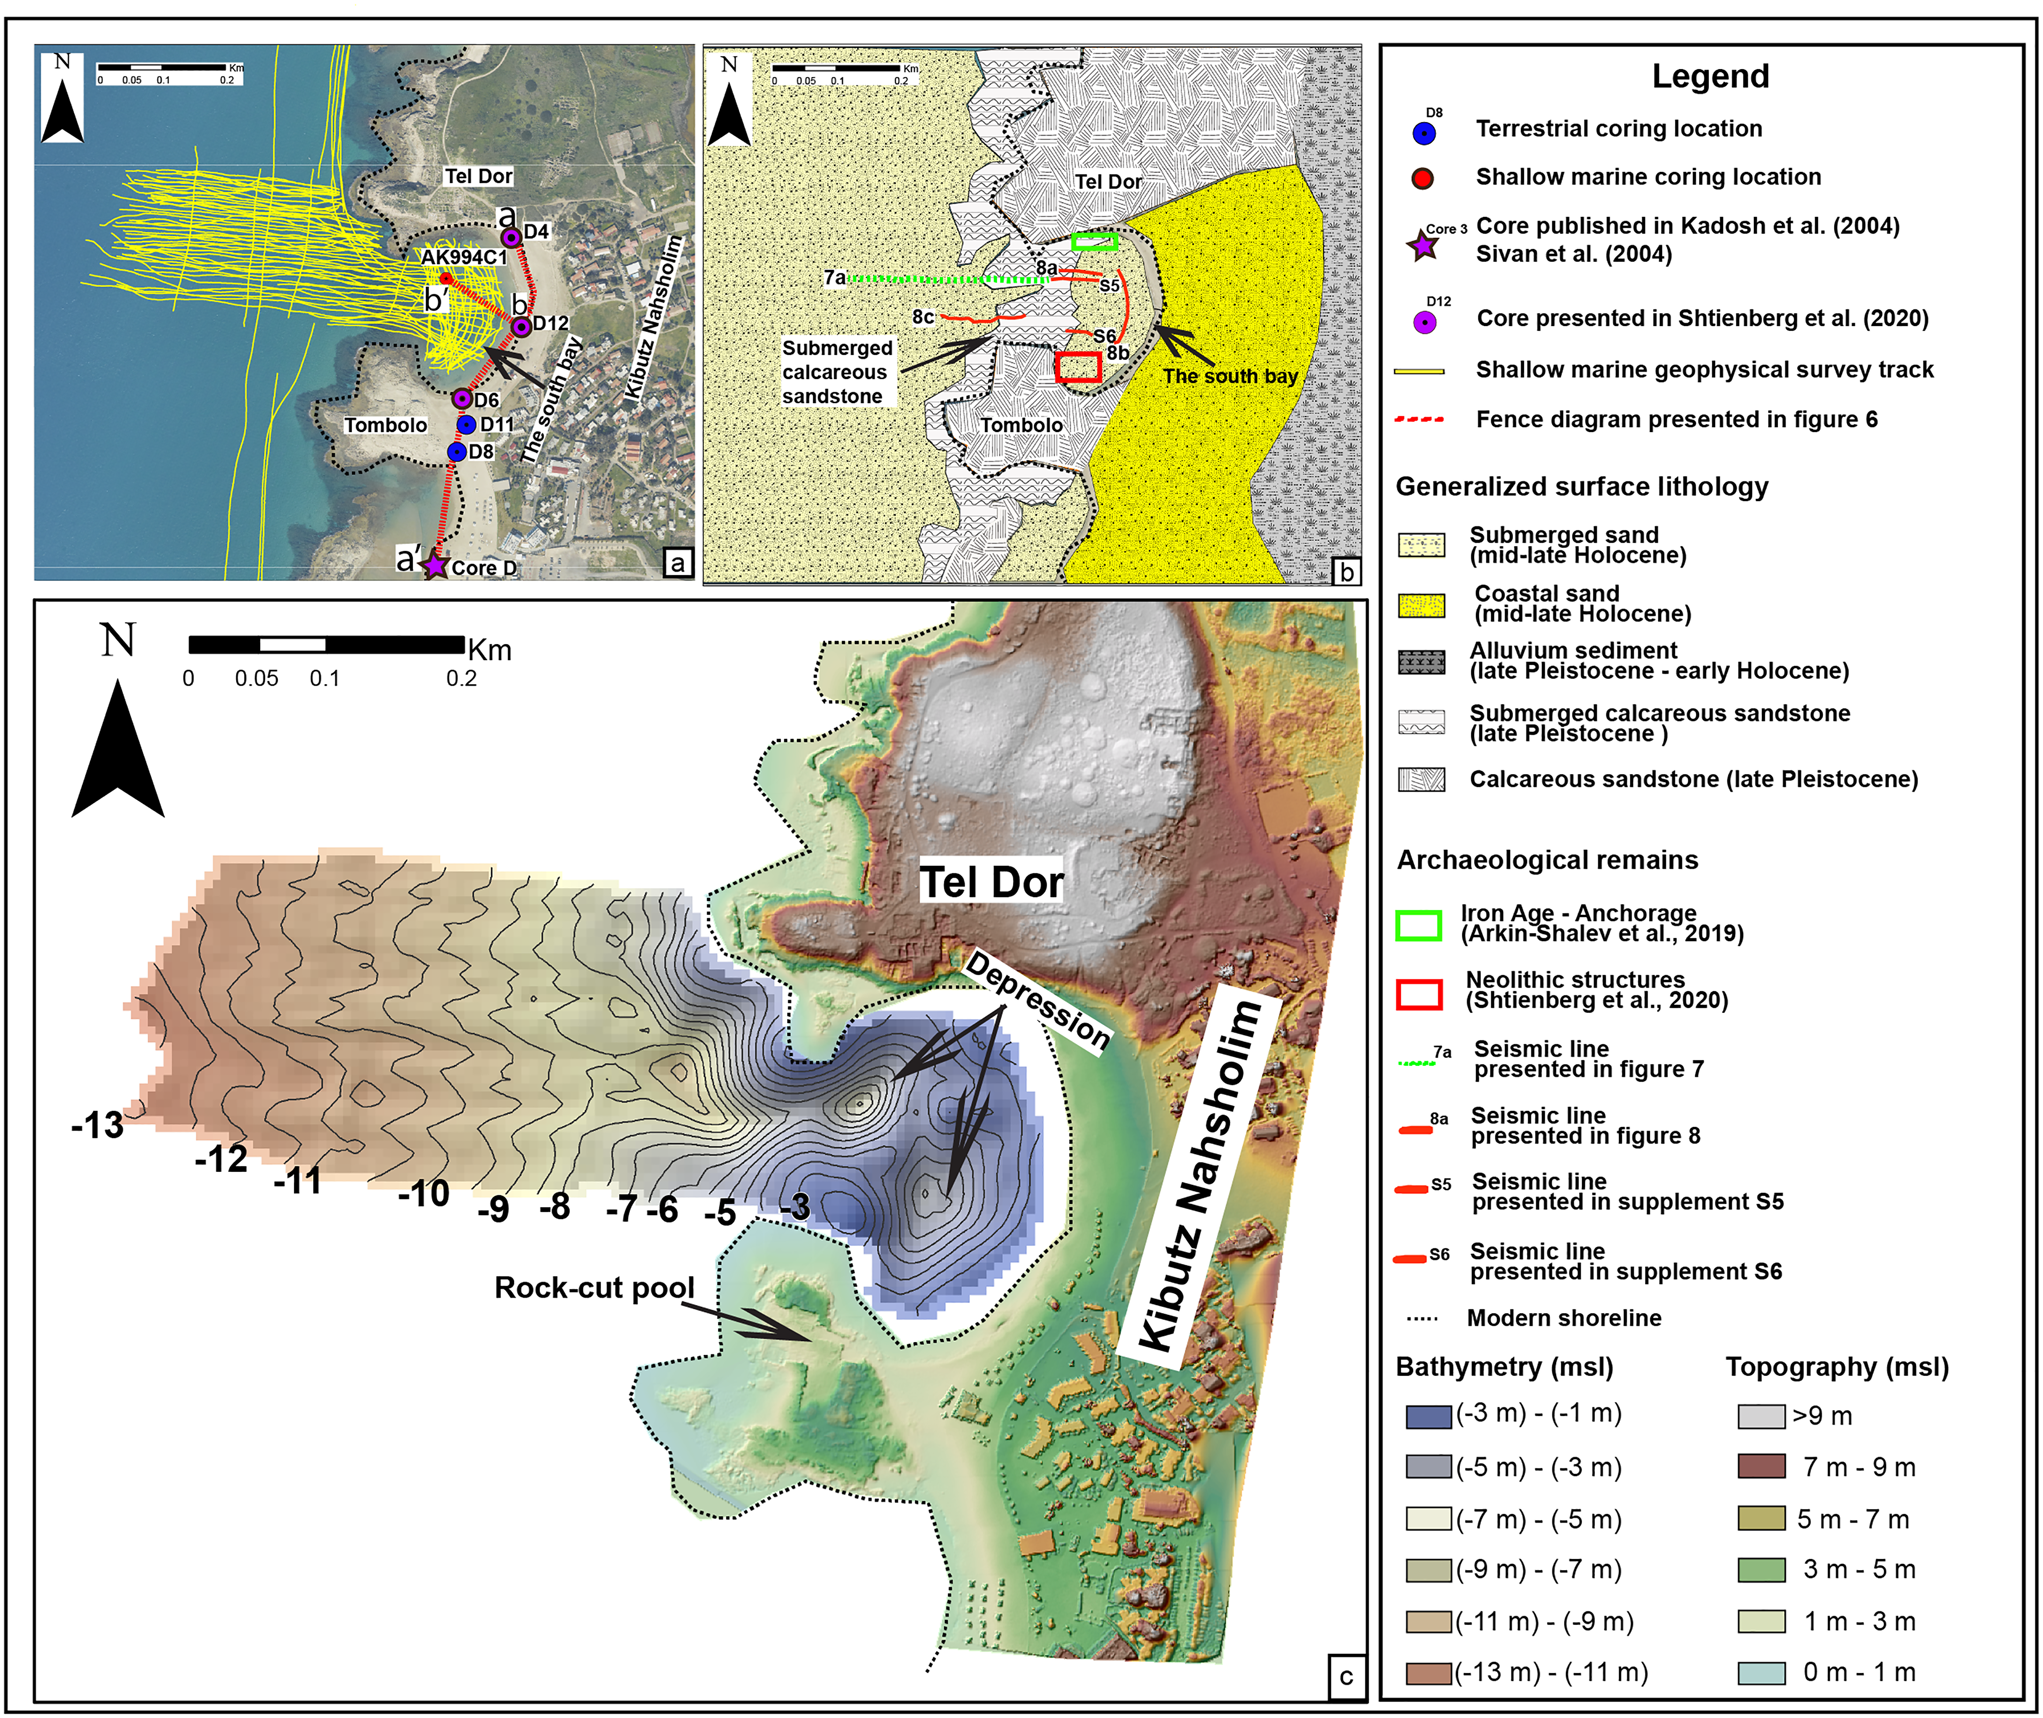
(a, b) Inset maps (see Figure 2 for inset locations) representing surveying and sampling locations as well as geomorphological characteristics of the south bay of Dor and its pocket beach. (a) Aerial photograph with existing and new drilling locations as well as geophysical survey lines collected in the current study indicated (for fence diagrams, see Figure 6). (b) surface lithologies, archeological remains, and seismic lines (see Figures 7, 8, Supplemental Figures S5 and S6). (c) Modern coastal and seabed elevation surfaces from DEM and bathymetric data.
Our current study combines shallow-marine, high-resolution seismic reflection data, sedimentological data from the coastal zone, OSL dating chronology, and reference to existing archaeological records. The integration of these datasets reveals how regional processes of sea-level fluctuations, climate, and aeolian processes shaped the coastal area through time, as well as allowing assessment of the effect of these factors on the recently discovered early Holocene prehistoric coastal community from the south bay of Tel-Dor in northern Israel (Figs. 1–3).
REGIONAL SETTING
The coast of Israel in general and the Carmel coast in particular are ideal locations for studying long-term dynamics occurring between natural processes affecting coastal development and changing patterns of human adaptation. This is due to the microtidal nature of the Israeli coast (± 0.40 m, Emery and Neev, Reference Emery and Neev1960; Davis and Hayes, Reference Davis and Hayes1984), its relatively tectonically stable character (e.g., Schattner et al., Reference Schattner, Lazar, Tibor, Ben-Avraham and Makovsky2010; Sivan et al., Reference Sivan, Schattner, Morhange and Boaretto2010; Reference Sivan, Sisma-Ventura, Greenbaum, Bialik, Williams, Tamisiea and Rohling2016) with negligible isostatic variation based on the GIA model in Sivan et al. (Reference Sivan, Sisma-Ventura, Greenbaum, Bialik, Williams, Tamisiea and Rohling2016) since the last interglacial (125 ka), and a constant, uniform supply of sediment from the Nile River since the Pliocene (Golik and Rosen, Reference Golik and Rosen1999), which eliminats the need to distinguish between sediment sources. Finally, humans have occupied the Carmel coastal plain and the (present-day) near-shore shelf since the late Pleistocene (Galili et al., Reference Galili, Weinstein-Evron, Hershkovitz, Gopher, Kislev, Lernau, Kolska-Horwitz and Lernau1993; Kuijt and Goring-Morris, Reference Kuijt and Goring-Morris2002).
The width of the Israeli coastal plain varies from 15 km in the south to 3.5 km along the Carmel coast (Fig. 1b; Almagor and Hall, Reference Almagor and Hall1984). Up to eighteen calcareous sandstone aeolianite ridges are present along the coastal plain and continental shelf. These features are semi-parallel to the coastline and were formed during the late Pleistocene when sea level was lower and the shelf was exposed. However, a clear correlation between sea-level phases and aeolianite formation has yet to be established (Mauz et al., Reference Mauz, Hijma, Amorosi, Porat, Galili and Bloemendal2013). The number and size of these ridges diminishes northward, with only two ridges on land and two on the shelf found in the north-central to northern parts of the coast (Yaalon, Reference Yaalon1967; Sivan et al., Reference Sivan, Gvirtzman and Sass1999). In these parts the shelf ridges are partly submerged and occasionally exposed in the form of small islands (Fig. 2). The troughs between the aeolianite ridges along the coast are filled with late Pleistocene–Holocene sequences up to 20 m thick. On land, these late Quaternary sediments are composed of several red-brown, sandy- to silty loam paleosol units that have been dated from ca. 60–12 ka. These paleosol units contain various subunits and hiatuses, which probably indicate long exposure to pedogenic processes, hence impeding a clear, lateral chronostratigraphical correlation to climate and sea-level variations (Sivan and Porat, Reference Sivan and Porat2004; Shtienberg et al., Reference Shtienberg, Dix, Roskin, Waldmann, Bookman, Bialik, Porat, Taha and Sivan2017).
Paludal/wetland deposits (constrained between ca. 21–9 ka; Kadosh et al., Reference Kadosh, Sivan, Kutiel and Weinstein-Evron2004; Sivan et al., Reference Sivan, Greenbaum, Cohen-Seffer, Sisma-Ventura and Almogi-Labin2011) and aeolian sand (< 6 ka; Cohen-Seffer et al., Reference Cohen-Seffer, Greenbaum, Sivan, Jull, Barmeir, Croitoru and Inbar2005; Roskin et al., Reference Roskin, Sivan, Shtienberg, Roskin, Porat and Bookman2015) rest on top of the late Pleistocene paleosol units. The Holocene wetland deposits consisting of organic-rich silty clay are found along the entire Israeli coast (Sivan et al., Reference Sivan, Eliyahu and Raban2004a; Elyashiv et al., Reference Elyashiv, Bookman, Zviely, Avnaim-Katav, Sandler and Sivan2016; Shtienberg et al., Reference Shtienberg, Dix, Roskin, Waldmann, Bookman, Bialik, Porat, Taha and Sivan2017) and continental shelf (Avnaim-Katav et al., Reference Avnaim-Katav, Almogi-Labin, Sandler, Sivan, Porat and Matmon2012; Shtienberg et al., Reference Shtienberg, Dix, Waldmann, Makovsky, Golan and Sivan2016). Sedimentological, palynological, and faunal analyses show that these silty clay units were deposited in fresh- to brackish-water marshes (Kadosh et al., Reference Kadosh, Sivan, Kutiel and Weinstein-Evron2004; Cohen-Seffer et al., Reference Cohen-Seffer, Greenbaum, Sivan, Jull, Barmeir, Croitoru and Inbar2005), and were partly deposited during the rapid Holocene sea-level transgressive phase as well as during multiple wetter regional climate episodes.
Relative sea level (RSL) has risen from a global lowstand of ~135 m below mean sea-level (msl) during the last glacial maximum (LGM; 25 ka) to ~60 m below msl during the start of the Holocene, which closely correlates with eustatic sea-level records (Rohling et al., Reference Rohling, Foster, Grant, Marino, Roberts, Tamisiea and Williams2014).
The nearest RSL curve to the Israeli coast was reconstructed in the western Mediterranean along the relatively stable southern coasts of France by Lambeck and Bard (Reference Lambeck and Bard2000) from ca. 30 ka to present. Their curve indicates that sea level rose dramatically from the LGM, reaching ~35 m below present msl by the beginning of the Holocene (ca. 10 ka). Archaeological observations from the coast of Israel, which are the only available local indicators for this period, indicate that sea level continued to rise, and between ca. 9 ka to 7 ka, it transgressed from ~16 m to ~8 m below msl (Sivan et al., Reference Sivan, Wdowinski, Lambeck, Galili and Raban2001; Reference Sivan, Lambeck, Toueg, Raban, Porath and Shirman2004b; Galili et al., Reference Galili, Benjamin, Eshed, Rosen, McCarthy and Horwitz2019). From ca. 7 to 4 ka, RSL rose an additional ~7 m, and at ca. 4 ka, RSL was close to its present level, based on sedimentological indicators (Porat et al., Reference Porat, Sivan and Zviely2008). From ca. 2 ka onwards, sea level was relatively stable, with sub-meter fluctuations (Dean et al., Reference Dean, Horton, Evelpidou, Cahill, Spada and Sivan2019).
Submerged Neolithic settlements inundated by post-glacial Holocene sea-level rise have been discovered along a 20 km stretch off the Carmel coast (Fig. 1b). The settlement patterns during this local transgressive phase and correlative landward shoreline migration suggest that sea-level rise resulted in the abandonment of coastal settlements, leading to their relocation landward (Fig. 1b; Galili et al., Reference Galili, Weinstein-Evron, Hershkovitz, Gopher, Kislev, Lernau, Kolska-Horwitz and Lernau1993, Reference Galili, Ronen, Mienis and Kolska Horwitz2017, Reference Galili, Benjamin, Eshed, Rosen, McCarthy and Horwitz2019). However, a detailed geochronological assessment that links sea-level transgression and the resulting environmental changes with cultural impact has yet to be conducted.
This paper provides a comprehensive overview and explanations of influences and processes operating at the land–sea interface following climate forcing and sea-level transgression while also considering how these changes influenced the distribution and timing of coastal settlements. The embayed setting of the coastal zone of Dor enables a detailed reconstruction of the geomorphic evolution history of the area through the last glacial–interglacial period, and allows us to assess natural influences on prehistoric coastal societies. We examine regional forcing factors (i.e., sea level, climate) that were active in the evolution of the coastal zone environment at Dor, the influence of these factors on the evolution of the study area leading to the formation of the coastal zone at Dor, and the effect of Holocene transgression on the prehistoric inhabitants at in the south bay of Dor.
METHODS
For this study, we combined surface mapping, detailed analyses of four new boreholes, OSL dating, and high-resolution, shallow-marine seismic reflection data with a large preexisting database of cores taken across the area for both academic and industrial purposes (See Fig. 1b for more detail). All elevations were referenced to local Israeli mean sea level to allow correlation across the datasets.
Geomorphological and topography mapping
The geomorphological characteristics and surface lithologies of the study area were mapped in detail through land and underwater surveys. A heavy-lift octocopter drone was used to collect photogrammetric data to create a digital surface model (DSM) of the terrestrial coast. Survey data were georeferenced using a South Galaxy G1 RTK-GPS with a vertical and horizontal error no greater than ± 7 cm, creating an orthorectified photomosaic.
New borehole drilling and laboratory analysis
New boreholes were cored during two expeditions (August 24, 2018; February 3, 2019) along the shoreline from the northern to southern end of the bay (Fig. 3a) using a Geo-probe 6620DT direct-push corer penetrating up to 8 m below the surface. Shallow marine drilling was conducted off an underwater platform at elevations of approximately −3 m relative to msl using a team of divers and a manually automated percussion system (Core AK994C1; Fig. 3a). Locations and surface elevations of the boreholes were measured using a Proflex 500 RTK-GPS with precision of ± 1 cm and ± 5 cm, respectively. The terrestrial and shallow marine cores were then split lengthwise for color analysis using a Munsell color chart, and lithological description.
Elemental variation along the cores was measured at 1 cm resolution with an Avaatech X-ray fluorescence (XRF) system, with an excitation voltage of 10 kV and 35 kV, and a 2-cm-diameter beam. Raw element values (photon counts) were then normalized to silica values, a dominant element in Israeli coastal sediments, to enable relative difference assessment for each facies/unit sample (Löwemark et al., Reference Löwemark, Chen, Yang, Kylander, Yu, Hsu, Lee, Song and Jarvis2011). Additionally, magnetic susceptibility values were measured by a Bartington MS3/MS2 meter and point sensor, compatible with small-diameter cores, at 1-cm resolution. Particle-size distribution measurements were conducted with a Malvern Instruments Mastersizer 2000 laser particle-size analyzer on 39 samples from core D4 (Fig. 3a) collected at 10–15 cm increments.
Age control was obtained using optically stimulated luminescence (OSL) dating of sediments collected from unopened cores in darkroom conditions. OSL dating followed the single-aliquot regenerative-dose (SAR) technique of Murray and Wintle (Reference Murray and Wintle2003) for single-grain and small-aliquot analysis of quartz sand. Optical measurements were performed on Risø TL/OSL Model DA-20 readers with blue–green light emitting diodes (LED) (470 nm, 36 mW/cm2) as the stimulation source for small-aliquot measurements and using a green laser (532 nm, 120 mW/cm2) for single-grain dating, both measured at 125°C through 7.5-mm UV filters (U-340). The signals were calculated by subtracting the average of the last 5 seconds (background signal) from the first 0.7s (4 channels) of the 40s signal decay curve for the small aliquot analyses and subtracting the average of the last 0.2s from the initial 0.05s of the 1s luminescence measurement for single grains. Dose response curves were fit within saturating exponential curves to calculate equivalent dose (DE) values (Table 1; Supplemental Figures 1, 2).
Optically stimulated luminescence (OSL) age information. OSL ages are presented as thousands of years (ka) before 2018. Age analysis using the single-aliquot regenerative-dose procedure of Murray and Wintle (Reference Murray and Wintle2003) on 1-mm small aliquots of quartz sand unless otherwise noted. Number of aliquots used in age calculation and number of aliquots analyzed in parentheses. Datum for ages is AD 2018. Equivalent dose (DE) calculated using the Central Age Model (CAM) unless otherwise noted.

* Age analysis using the single-aliquot regenerative-dose procedure of Murray and Wintle (Reference Murray and Wintle2003) on single grains of quartz sand (Guérin et al., Reference Guérin, Mercier and Adamiec2011). Number of grains used in age calculation and number of grains analyzed in parentheses. DE calculated using the Minimum Age Model (MAM) of Galbraith and Roberts (Reference Galbraith and Roberts2012).
** Ages presented in Shtienberg et al. (Reference Shtienberg, Yasur-Landau, Norris, Lazar, Rittenour, Tamberino and Gadol2020)
DE distributions from samples show largely symmetrical distributions with over-dispersion (OD, scatter) below the 20% cutoff for scatter beyond instrumental error in all but two samples (Supplemental Figures 3, 4). DE values were calculated using the central age model (CAM) for all samples except the uppermost sample (USU-2950), which has a positively skewed single-grain DE population with high overdispersion (82%, Supplemental Figure 3). This sample was calculated using the 3-parameter minimum-age model (MAM-3) of Galbraith and Roberts (Reference Galbraith and Roberts2012). Aliquots were rejected if they had evidence of feldspar contamination, recycling ratio <0.1 or >1.1, recuperation >10% of the natural signal, or natural DE greater than the highest regenerative dose given. Environmental dose rate (Table 2) was determined using radio-elemental conversion factors (Guérin et al., Reference Guérin, Mercier and Adamiec2011) and corrected for attenuation due to grain size (Brennan, Reference Brennan2003) and water attenuation (Aitken, Reference Aitken1998). Cosmic contribution to the dose rate was determined using sample depth, elevation, and longitude/latitude following Prescott and Hutton (Reference Prescott and Hutton1994). Errors on DE values are reported at 2-sigma standard error and age estimates are reported at 1-sigma standard error (Table 1). Uncertainties include errors related to instrument calibration and dose rate and equivalent dose calculations, and were calculated in quadrature using methods in Aitken and Alldred (Reference Aitken and Alldred1972).
Dose rate information for optically stimulated luminescence (OSL) samples selected from borehole D4, D6, and D11. Radioelemental concentrations (K, Rb, Th, U) determined using ICP-MS and ICP-AES techniques; dose rate is derived from concentrations by conversion factors from Guérin et al. (Reference Guérin, Mercier and Adamiec2011). Grain size for all samples is 125–212μm.

* Moisture content effect by drying of the core. 20% moisture content assumed over burial history and used in dose rate calculation.
** Beta DR uses 100% of chemistry from USU-2955a (flood layer), gamma DR uses 75% from USU-2955a and 25% from USU-2955b (underlying silt).
† Radioelemental concentrations for samples were averaged in dose rate calculation: above sample (upper values) and below sample (lower values).
‡ Ages presented in Shtienberg et al. (Reference Shtienberg, Yasur-Landau, Norris, Lazar, Rittenour, Tamberino and Gadol2020).
Geophysical survey
A shallow-marine geophysical survey was conducted to map bathymetry as well as sub-seafloor stratigraphy. The survey was conducted on board a catamaran with 0.5 m draft, equipped with an Innomar SES-2000 light plus Subbottom profiler operating in dual frequencies of 100 kHz and 12 kHz with a resolution of up to 5 cm. Location and navigation were established by two South Galaxy G1 RTK-GPS devices with a vertical and horizontal accuracy better than ± 7 cm. The measurements generated 35 km of seismic profiles extending from depths of −2 m to −13 m relative to msl, consisting of 45 shore perpendicular and 23 shore parallel lines spaced ~7 m apart (Fig. 3a).
The geophysical data set was uploaded to the Emerson/Paradigm software suite and all processing was performed in the ECHOS software. A vertical correction was applied to each trace based on RTK-GPS Z values in order to circumvent static vertical shifts created by swell and tide. Attenuation of short-path multiples (ghosts) and signal enhancement was performed with a minimum entropy deconvolution filter, and further signal enhancement was achieved with a lateral mixing filter. Interpretation-based amplitude scaling was used to enhance the appearance of the geological units.
RESULTS AND INTERPRETATION
Coastal-zone characteristics
The study area consists of a 280-m-long sandy pocket beach with a mean width of 230 m from the shoreline to the 4-m-high sand dune in the backshore. The pocket beach is bordered by an aeolianite headland to the north and an aeolianite-cored tombolo to the south, both of which project ~290 m seaward relative to the pocket-beach shoreline (Sneh, Reference Sneh1981; Sneh and Klein, Reference Sneh and Klein1984). On the northern headland, archeological constructions (wells, slipways) as well as the remains of an Iron Age and younger urban settlement are evident, while a rock-cut pool is apparent (Arkin Shalev et al., Reference Arkin Shalev, Gilboa and Yasur-Landau2019) on the rocky headland of the tombolo (Fig. 3c).
The bathymetry of the study area ranges from −13 m to −2 m relative to msl, and the general slope gradient is 1:50, extending 760 m west of the shoreline. The entrance to the south bay is semi-constrained by the two edges of the northern headland and tombolo that are 140 m apart. Between the northern headland and tombolo, at water depths of approximately −3 m relative to msl, there is a N–S trending, submerged, elongated, calcareous sandstone platform that connects the headlands (Fig. 3b). A westward-trending, curvilinear depression 40 m wide and ~2.5 m deep truncates this platform at elevations of −7 m to −4 m relative to msl (Fig. 3c). Other than the submerged calcareous sandstone platform, the seabed is mostly covered by sand.
Sedimentology of the south bay of Dor
The sedimentological sequence of the south bay of Dor (Figs. 1–3) consists of five lithological units (F1–F5) that unconformably overly the basal unit (BU) aeolianite. The lithological classification (Figs. 4, 5) of each unit and their spatial correlation (Fig. 6) is based on sedimentological characteristics, thickness, elevations, accompanying features, lithostratigraphical relations, and geochemical properties. Descriptions of the units from the oldest unit to the youngest modern unit is as follows:
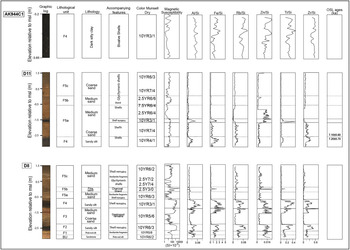
Boreholes D8, D11, and AK944C1 with graphic log, lithological unit (see text for detailed lithological unit descriptions), lithology description, accompanying features, distinguishing Munsell color (dry), magnetic susceptibility, relative elemental variations, and optically stimulated luminescence (OSL) ages. See Fig. 3a for locations.

Borehole D4 (see Fig. 3a for location) with graphic log, lithological unit (see text for detailed lithological unit descriptions), Munsell color description (dry), relative elemental concentration, grain texture (percent grain size), magnetic susceptibility, lithostratigraphical interpretation, accompanying features (stars indicate OSL sampling), and OSL age results from this study and Shtienberg et al. (Reference Shtienberg, Yasur-Landau, Norris, Lazar, Rittenour, Tamberino and Gadol2020). Dashed lines indicate approximate facies boundaries.

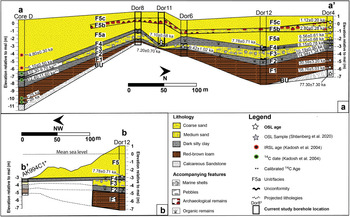
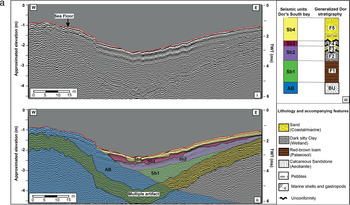
Chronostratigraphic cross-sections from the coastal area of Dor based on OSL ages (white stars = this study) and sedimentological data. 14C results from lithologic samples results (green circles) and radiometric ages (red circles) taken from Kadosh et al. (Reference Kadosh, Sivan, Kutiel and Weinstein-Evron2004). For map of profile locations and modern topography and bathymetry used in cross-sections, see Figure 3a, c. Because marine core AK994C1 did not extend deeper than −3.0 m msl, subsurface thickness and elevation is based on seismic profiles and seismic unit interpretation (see Supplemental Figure 5). BU = basal unit; F1, F2, F3, F4, F5a, F5b, F5c = lithologic facies; see text for full descriptions of unit/facies.

Basal Unit (BU): The upper ~0.5 m of the basal unit was reached in boreholes D8, D4, and D6 (Fig. 3, Supplemental Figure 3), and consists of yellowish white to pale gray (10YR6/2 to 2.5Y8/1), indurated to lightly cemented, calcareous-cemented to partly cemented sands. Ratios for Ti/Si, Zn/Si, Fe/Si, Rb/Si, and Al/Si are 0.15, 0.07–0.2, 0.15, 0.05, and 0.05, respectively, and magnetic susceptibility values ranged from 15–100 Si × 10−6 (Figs. 4, 5). This unit was dated in core D4 to 77.34 ± 7.34 ka (Table 1, Fig. 5), and resembles the sedimentology of headlands that border the south bay at Dor (Figs. 2, 3). It is interpreted as carbonate-cemented aeolian dune sands.
Unit F1: Unit F1 overlies the BU, and was identified in boreholes D8, D4, D12, and D6 (Figs. 3–5, Supplemental Figures 4, 5) at surface elevations ranging from −8.5 m to −3.6 m relative to msl, and is 0.5–3 m thick (Fig. 6). This unit consists of red to brown (10YR4/2 to 10YR5/8) silty loam with irregularly shaped, hard calcareous nodules and black manganese concretions, and lacks micro- and macrofaunal remains. The size and abundance of the nodules and concretions decreases upwards, and nodules are completely absent at the top of the unit. F1 has similar ratios for Ti/Si, Zn/Si, Fe/Si, Rb/Si when compared to BU, but has a strong signal for Al/Si. Magnetic susceptibility values for the unit vary from 100–300 Si×10−6 (Figs. 4, 5). Two OSL ages acquired from the bottom and middle parts of the unit date it to 59.76 ± 5.03 ka and 30.59 ± 3.20 ka respectively (Table 1, Figs. 5, 6; Supplemental Figures 4, 5). Based on these characteristics and lithostratigraphic correlation with previously collected cores (Fig. 6; Kadosh et al., Reference Kadosh, Sivan, Kutiel and Weinstein-Evron2004; Sivan et al., Reference Sivan, Eliyahu and Raban2004a; Shtienberg et al., Reference Shtienberg, Dix, Roskin, Waldmann, Bookman, Bialik, Porat, Taha and Sivan2017), F1 represents silty, well-oxidized aeolian sediments of the paleo-coastal plain, with a Bt horizon interpreted as a paleosol that locally is known as Hamra.
Unit F2: Unit F2 was found in boreholes D11, D8, D6, D12, and D4, with surface elevations ranging from −6.8 m to −2.6 m relative to msl, and is 0.5 m to 1.5 m thick (Figs. 4–6, Supplemental Figures 4, 5). The unit is dark gray to dark brown (10YR4/1 to 10YR6/3) with a silty loam texture. F2 also contains brackish-water microfaunal remains as well as fresh- to brackish-water plant remains, such as charophytes (Supplemental Data Set 1). Its elemental composition includes higher Ti/Si, Rb/Si, Fe/Si ratios compared to the underlying unit and higher MS values (Figs. 4, 5). Two OSL ages acquired from the middle and upper parts of this unit date F2 to 14.94 ± 1.34 ka and 9.42 ± 0.85 ka, respectively (Table 1, Figs. 5, 6). Unit F2 is interpreted as a fresh- to brackish-water wetland deposit.
Unit F3 unconformably overlies unit F2 and was identified in boreholes D11, D8, D4, D12, and D6 (Figs. 4–6, Supplemental Figures 4, 5), with surface elevations ranging from −3.3 to −1 m relative to msl, thicknesses of 0.12 m to 1 m (Fig. 6), and a yellow to light-yellow color (10YR6/3 to 10YR5/6). The unit consists of poorly sorted sand composed of quartz grains, Glycymeris and Tucetona shells, limestone pebbles, gastropod shells, calcareous sandstone fragments and dark, silty clay rip-up clasts. Major element ratios for Al/Si, Ti/Si, Fe/Si, Rb/Si and MS values are lower compared to the underlying unit (F2), and an OSL age dates the unit to 10.19 ± 0.90 ka (Table 1). Unit F3 is interpreted as a high-energy coastal/shallow-marine sand. Previous work has interpreted this unit as a tsunami deposit (Shtienberg et al., Reference Shtienberg, Yasur-Landau, Norris, Lazar, Rittenour, Tamberino and Gadol2020).
Unit F4: Unit F4 unconformably overlies unit F3 and was identified in boreholes D11, D8, D4, D6, D12, and AK994C1 (Figs. 4, 5, Supplemental Figures 4, 5), with surface elevation ranges of −6 to −0.5 m relative to msl and thicknesses of 0.4 m to 0.8 m (Fig. 6). This unit is dark gray to dark brown (10YR3/1) homogenous silty loam that contains brackish-water microfaunal remains, sea urchin spines, and gastropod shells in the upper 0.3 of the unit (Supplemental Data Set 1). Elemental ratios of Al/Si, Ti/Si, Zn/Si, Fe/Si, and Rb/Si, as well as MS values resemble those of F2 (Figs. 4, 5). Unit F4 was dated to 9.15 ± 0.78 ka by an age obtained from its base, and two ages of 7.78 ± 0.71 and 7.20 ± 0.70 from the upper part of this unit (Table 1, Figs. 4–6). F4 is interpreted as a dark, silty clay, fresh- to brackish-water wetland deposit similar to unit F2.
Unit F5: Unit F5 unconformably overlies unit F4, and generally has lower Al/Si, Ti/Si, Fe/Si, Rb/Si ratios (Figs. 4, 5) compared to the underlying unit. This unit has been broken down into three subfacies, described here from bottom to top:
1. Facies F5a was identified in boreholes D11, D8, D12, D6, and D4, with surface elevations from −3.5 to −0.5 m relative to msl, and thicknesses of 1 m to 2.5 m (Figs. 4, 5). The sediment consists of sub-rounded, medium-grained, light brown to yellow (2.5YR6/4 to 10YR6/3) sand. Glycymeris shells are evident throughout the facies with abundance and size increasing upward. An OSL age acquired from the base of this subunit dates F5a to 7.10 ± 0.68 ka (Table 1, Figs. 5, 6) We regard this subunit as a coastal sand similar to modern beach deposits.
2. Facies F5b occurs in boreholes D11, D8, D4, D6, and D12, with surface elevations of 0 to 0.3 m relative to msl, and a thickness of 0.4 m to 1 m (Figs. 4–6, Supplemental Figures 4, 5). The sediment is light gray to light yellow (2.5YR6/6 to 2.5YR3/0) coarse sand with abundant Glycymeris shells, aeolianite fragments, and chert and limestone pebbles. F5b also contains cultural material such as pottery sherds, pieces of iron, and charcoal fragments. (Figs. 4, 5). Trace-element ratios of Al/Si, Ti/Si, Fe/Si, Rb/Si as well as MS values are higher compared to the underlying facies (F5a), and OSL results from the base and upper portions of this facies produced ages of 2.80 ± 0.28 ka and 1.12 ± 0.20 ka, respectively (Table 1, Figs. 5, 6). Unit 5b is a coastal sand package associated with the Bronze Age–Crusader settlement at Tel-Dor.
3. Facies F5c is found in boreholes D11, D8, D4, D6, and D12, with surface elevations of 1 m to 1.5 m above msl and a thickness of 0.8 m to 1.25 m (Fig. 5). The unit is light gray to light brown (10YR7/4 to 10YR6/2) medium sand with Glycymeris shells and iron and glass fragments in the upper 0.3 m of the unit (Figs. 4, 5). Similar characteristics were also identified in the upper few centimeters of the shallow marine core AK9444C1 (Fig. 3). Based on these sedimentological properties and accompanying features, facies F5c is interpreted as a coastal sand facies that is contemporaneous with the historic setting of the Carmel coast (Fig. 1).
Seismic stratigraphy
Geophysical analysis revealed four seismic facies within the bay and two seismic facies outside the south bay of Dor (Figs. 3b, 7). The acoustic basement (AB) is characterized as a high-amplitude unit with chaotic and highly diffracted reflections, and with limited seismic penetration. The surface of the unit consists of an irregular, uneven set of reflections (Figs. 7, 8), which extend over the entire study area from elevations of −1 m to −13 m relative to msl (Fig. 9). A north–south striking, elongate structural high is recognized at the entrance of the bay at elevations of −1 m to −4 m relative to msl, and ~0.2 km offshore of the current coastline. This morphological feature has a maximum width of 100 m, with crests that are up to 4 m above the surrounding surface topography. The main axis of this structure is perpendicularly dissected by a ~3-m-deep trough at water depths of −6 m to −3 m relative to msl.
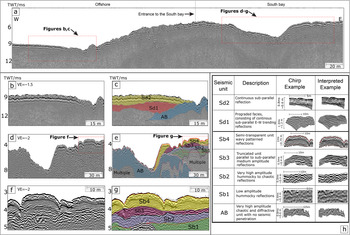
(a) An E–W trending seismic section from Dor (see Figure 3a for location). Dashed rectangles indicate area of the enlargements presented in (b), (d), and (f); corresponding interpretations of these sections are presented in (c), (e), and (g). (h) A general description of the seismic units as described in the text, and accompanying appearance in the seismic data. TWT = two-way travel time. VE = vertical exaggeration.

(i) A shore-perpendicular seismic section without interpretation, and (ii) the same seismic section with interpretation from seismic units to lithologies, which was achieved based on correlation to boreholes AK994C1, D4, D11, and D8, as well as surface lithologies. See Figure 3 for location of the seismic section and boreholes. Red line marks the seafloor. TWT = two-way travel time.

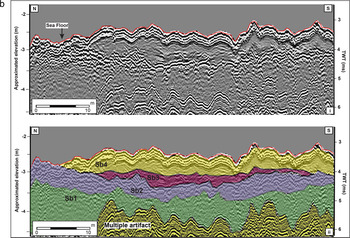
(i) A shore-normal seismic section without interpretation, and (ii) the same seismic section with interpretation from seismic units to lithologies, which was achieved based on correlation to boreholes AK994C1, D4, D11, D8 as well as surface lithologies. See Figure 3 for location of the seismic section and boreholes. Red line marks the seafloor. TWT = two-way travel time.

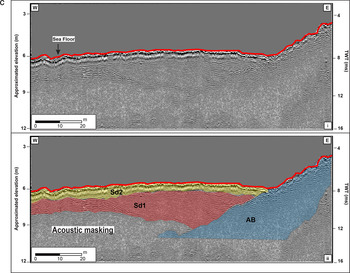
(i) A shore-perpendicular seismic section offshore from the south bay of Dor without interpretation, and (ii) with interpretation. See Figure 3 for location of the seismic section and boreholes. Red line marks the seafloor. TWT = two-way travel time.

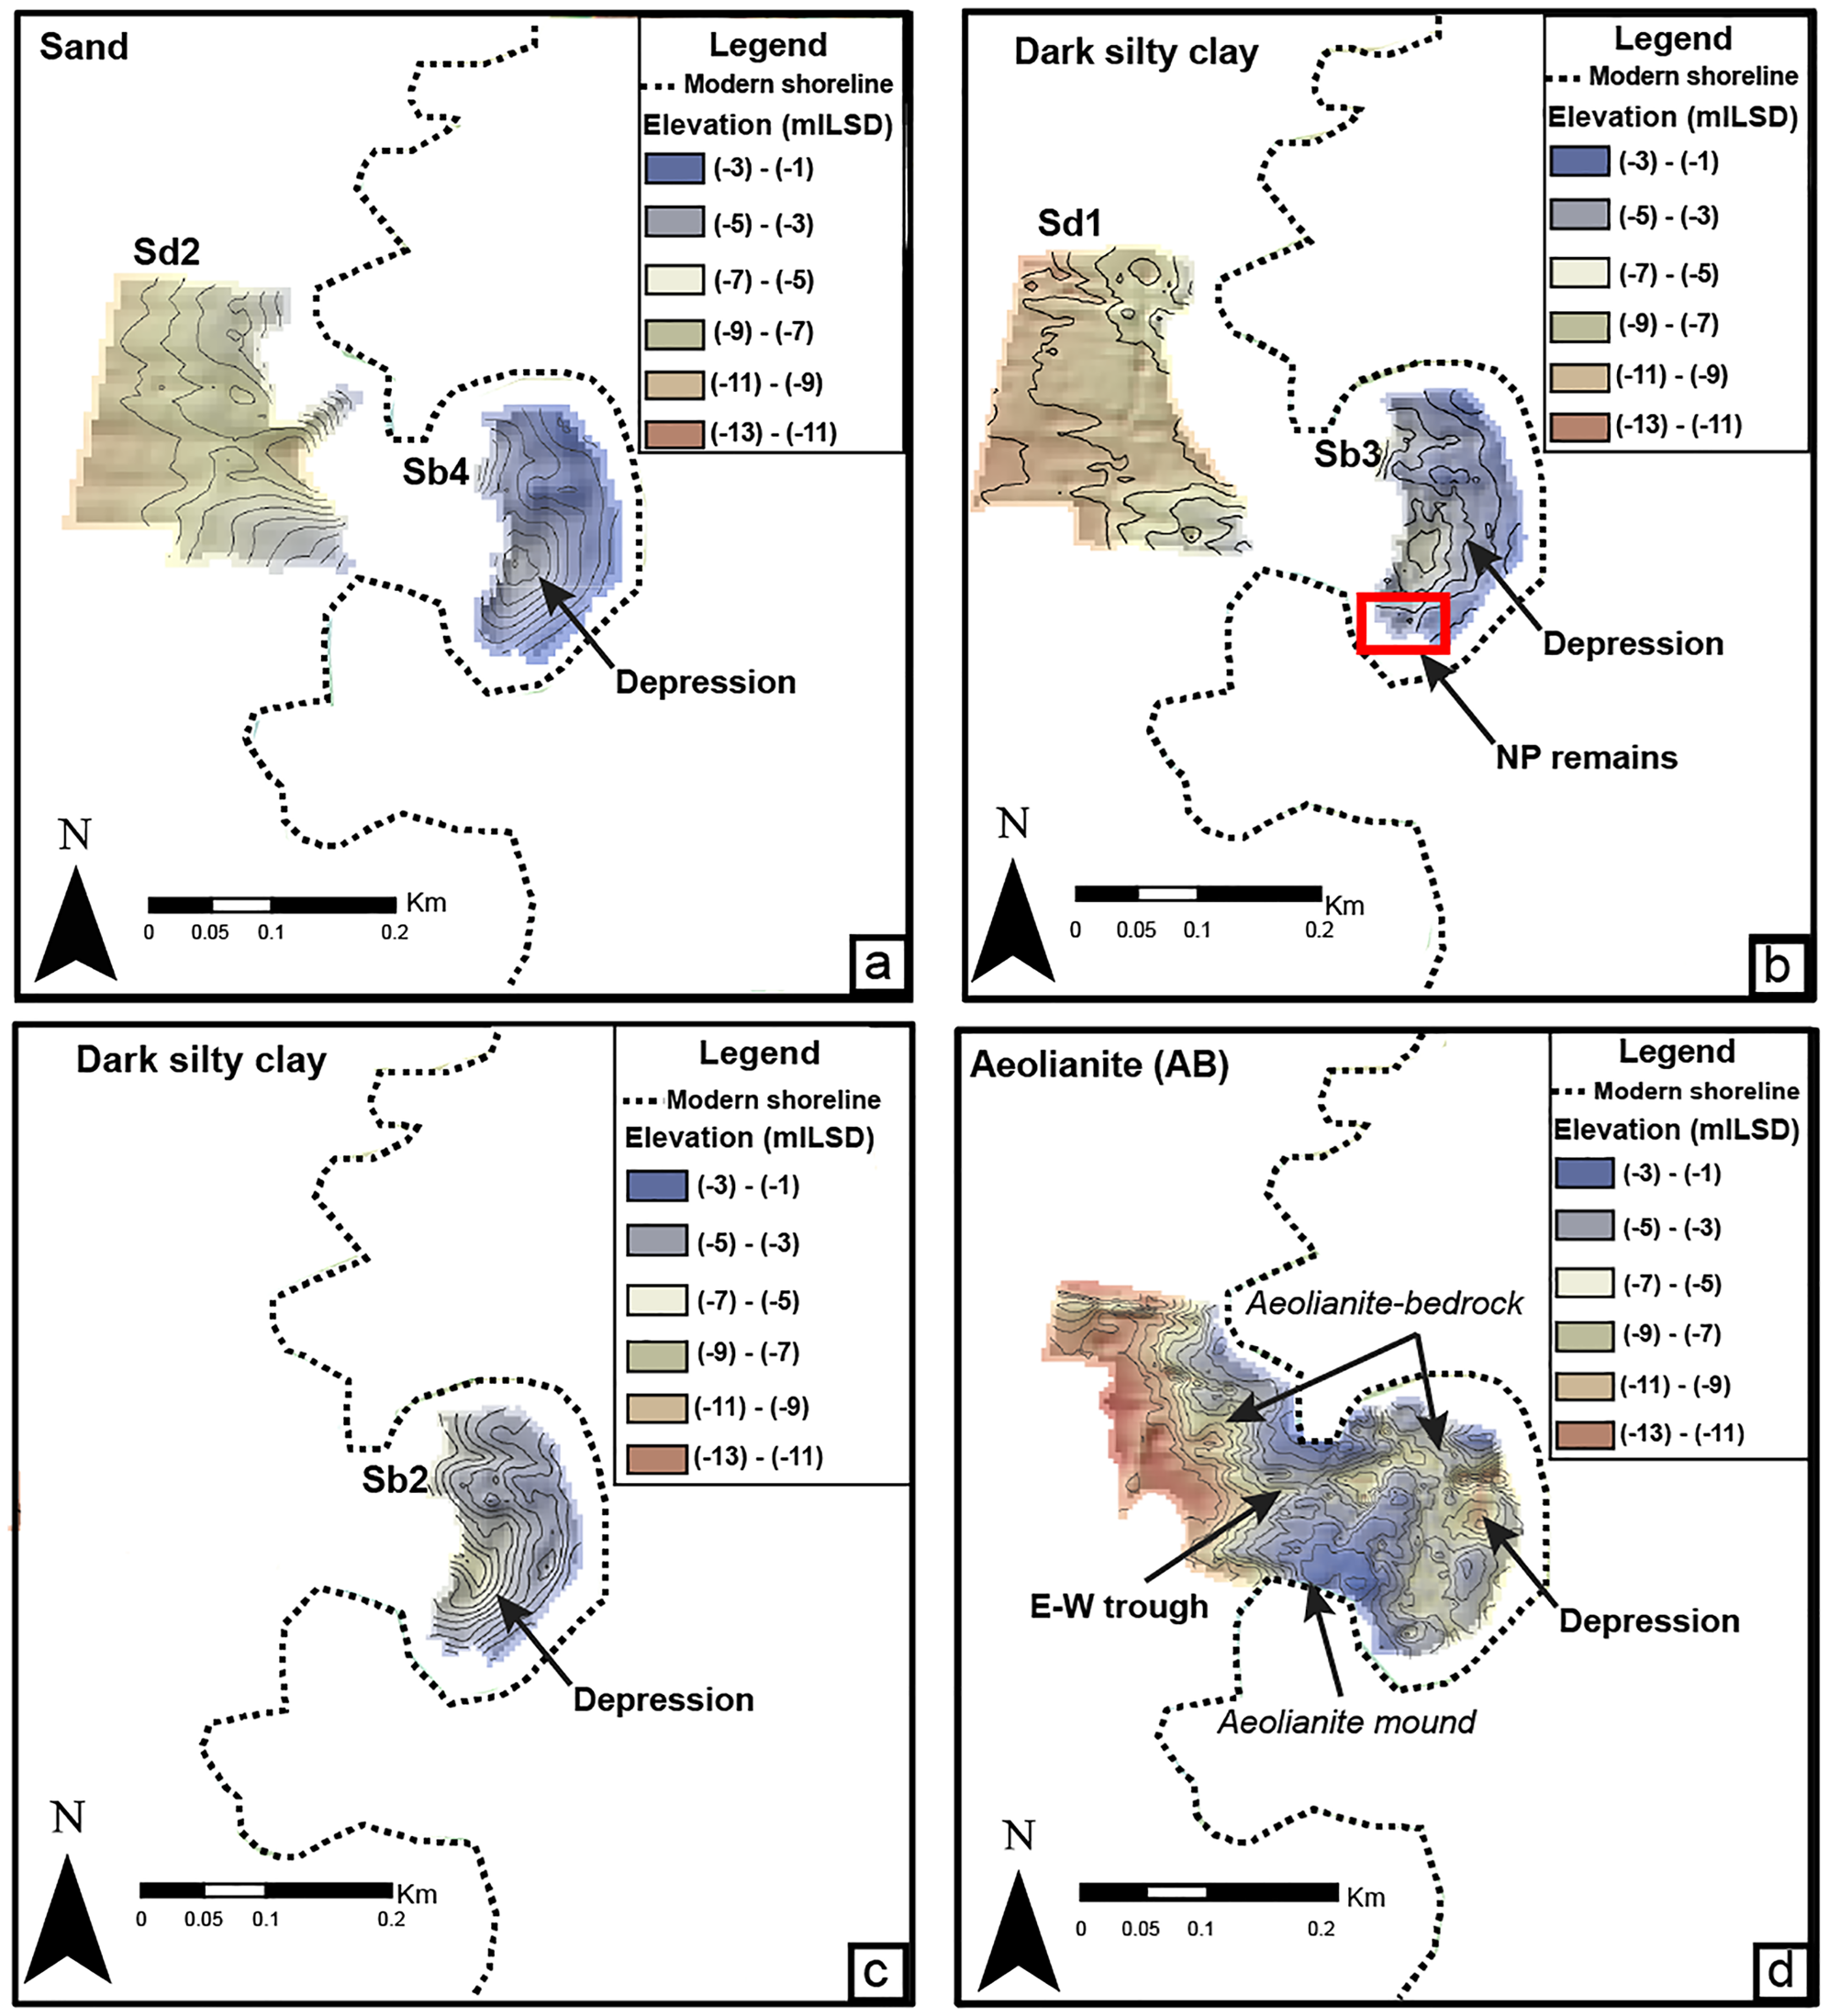
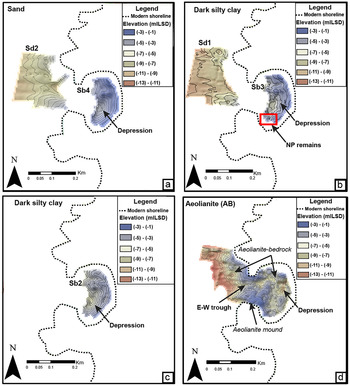
Elevation maps of lithological facies and correlated seismic unit surfaces inside and adjacent to the south bay of Dor. (a) Elevation map of the submerged surface of the late Holocene sand unit (= Sb4, Sd2); (b) Elevation map of the submerged Early Holocene wetland unit surface (= Sb3, Sd1); location of Neolithic Pottery remains marked by a red rectangle. (c) Elevation map of the submerged Late Pleistocene wetland unit surface (= Sb2). (e) Elevation map of the submerged Late Pleistocene aeolianite unit surface (= AB). See Figure 8 for definition of seismic units.
Seismic unit Sb1 overlies the acoustic basement and was identified inside the south bay. It is categorized by a semitransparent unit that occasionally displays low-amplitude and hummocky reflections onlapping the acoustic basement surface on its lower surface and is bounded by a high-amplitude reflector at the unit's top (Figs. 7, 8a).
Seismic unit Sb2, which partly covers unit Sb1, is categorized by high-amplitude, hummocky to chaotic reflections that onlap the acoustic basement, and it has a toplap relationship with unit Sb3 (Fig. 7). The upper surface of unit Sb2 ranges from −5 m to −3 m relative to msl and dips westwards at ~2° (Fig. 9c). A sink-like depression, ~3 m lower than its surroundings, is evident southeast of the bay's entrance.
Seismic unit Sb3 is composed of parallel to subparallel, mid- to low-amplitude reflections that, for the most part, onlap the surface of Sb2 and are truncated by Sb4. The unit is up to 2.5 m thick (Fig. 10b), and onlaps the morphological high defined by the acoustic basement. The surface morphology consists of a sloping depression at −6 m to −3 m relative to msl, dipping westwards at ~1° (Fig. 9b). A rounded depression is identified inside the bay in a location and extent that resembles the underlying depression of Sb2.
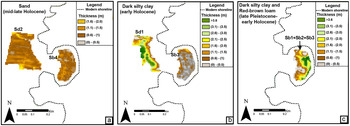
Isopach map of Dor's seismic litho-stratigraphy. These thickness maps were computed using the ArcGIS Minus Toolset that operated on the interpolated litho-surfaces that are presented in figure 9. The litho-facies are annotated from young (top left) to old (bottom right) (a) Thickness map of the middle to late Holocene sand unit (= Sd2, Sb4); (b) Thickness map of the early Holocene dark silty clay unit (Sd1, Sb3); (c) Accumulated thickness of the late Pleistocene–early Holocene dark silty clay unit and red-brown paleosol unit in the south bay of Dor (Sb1+Sb2+Sb3). See Figure 8 for definition of seismic units.

Seismic unit Sb4 displays semitransparent, wavy to subparallel mid- to high-amplitude west-dipping reflections (Fig. 7). This unit varies in thickness from 0.2 m to 2 m (Fig. 10a), and its surface is −3 m to −1 m relative to msl (Fig. 9a). Similar to underlying unit Sb3, a rounded depression was identified inside the bay ~2.5 m lower than its surroundings.
Seismic unit Sd1 is found west of the entrance to the south bay, and consists of high-amplitude, semicontinuous, sub-parallel west-trending reflections (Fig. 7). Unit Sd1 represents a prograded infill package that toplaps Sd2 and downlaps the surface of AB (Fig. 8c). The thickness of the unit varies from 1 m to 4 m. It is thicker in the southern parts of the unit, reaching elevations of −7 m relative to msl, 300 m from the present shoreline (Fig. 10b).
Seismic unit Sd2 was identified west of the entrance to the south bay and is characterized by continuous, medium-amplitude, medium-frequency, subhorizontal and subparallel reflectors onlapping the surface of AB (Fig. 8c). The unit was identified up to 250 meters from the entrance of the south bay at elevations of −5 m to −11 m relative to msl (Fig. 9a) and with thicknesses of 0.5–2 meters (Fig. 10a).
DISCUSSION
Stratigraphic architecture
The seismic units within the south bay boundaries (Sb1–Sb4) and west of its entrance (Sd1, Sd2) were correlated with the stratigraphic sequence of the Carmel coast based on geometric relations between the units, respective seismic facies, lithostratigraphical relations, and sedimentological correspondence with the on-land boreholes (Figs. 1b, 3, 5).
The morphology of the acoustic basement surface (AB) resembles the elevation differences, dipping angles, irregularity, and shore-parallel direction of the basal unit as observed on the adjacent coast (Figs. 3–6; Sneh, Reference Sneh1981; Sneh and Klein, Reference Sneh and Klein1984; Kadosh et al., Reference Kadosh, Sivan, Kutiel and Weinstein-Evron2004; Sivan et al., Reference Sivan, Eliyahu and Raban2004a). The surface morphology and topography of AB (Fig. 7) also match those of the submerged aeolianite surface as interpreted from chirp surveys conducted on the shallow shelf between Hadera and Caesarea (~8 km south of Dor; Fig. 1b) at elevations of −5 m to −45 m msl (Shtienberg et al., Reference Shtienberg, Dix, Waldmann, Makovsky, Golan and Sivan2016, Reference Shtienberg, Dix, Roskin, Waldmann, Bookman, Bialik, Porat, Taha and Sivan2017; Goff et al., Reference Goff, Austin and Goodman-Tchernov2018). Taken together, this leads to the identification of the acoustic basement as the top of the late Pleistocene calcareous sandstone surface that formed between 80–60 ka (Middle Paleolithic period).
The calcareous sandstone aeolianite surface is overlain by seismic unit Sb1 that was identified within the south bay. Boreholes drilled for this study (Fig. 6), as well as shallow seismic stratigraphy conducted ~8 km south of the study area (Fig. 1b), suggest that seismic unit Sb1is a late Pleistocene red-brown paleosol (Unit F1), which was deposited from ca. 60 ka to 15 ka (Upper Paleolithic to Natufian period).
The internal geometry and the strong bounding surface of seismic unit Sb2 that partly covers unit Sb1 suggest erosive contacts at the top and base of the seismic unit (Figs. 7, 8). Based on the coastal boreholes located a few tens of meters east of the seismic survey (Figs. 3a, 4, Supplemental Figure 5), as well as the erosive surface morphology (Fig. 5; Sneh, Reference Sneh1981; Kadosh et al., Reference Kadosh, Sivan, Kutiel and Weinstein-Evron2004), Sb2 is interpreted as a combination of a brackish wetland deposit (Unit F2) deposited between the late Pleistocene to early Holocene, and a coastal/marine sand (Unit F3) deposited between ca. 15 ka and 10 ka (Natufian to Pre-Pottery Neolithic B period; PPNB).
Seismic unit Sb3 overlaps unit Sb2 and consists of a strong bounding-surface reflector. Based on the lithology identified in core AK994C1 that penetrated this unit (Supplemental Figure 5), the core record of Dor (Figs. 3a, 6), and the unit's seismic geometry and erosional morphology, Sb3 is interpreted as the early Holocene brackish wetland unit (F4) that was deposited from ca. 9.15 ka to 7.20 ka (PPNB to end of the Pottery Neolithic period; PN).
Seismic unit Sb4 covers the coastal sequence in the south bay at Dor and is interpreted as the mid-Holocene coastal sand unit (correlative to F5 in the terrestrial borehole data) deposited between 7.1 ka–present (Chalcolithic–Modern). This interpretation is based on the pocket-beach core record (Figs. 3, 6, 8; Supplemental Figures 5, 6) as well as an underwater field survey conducted using a suction system that revealed the contact between the coastal sand and the underlying silty clay.
West of the bay, a prograded infill unit (Sd1; Figs. 7, 8) is identified above the submerged aeolianite (AB). Seismic unit Sd1 is interpreted as an early Holocene brackish wetland based on the similarities of this unit to three lens-shaped facies identified at similar depth beneath the seabed, with similar thicknesses (Shtienberg et al., Reference Shtienberg, Dix, Waldmann, Makovsky, Golan and Sivan2016), 8 km south of the study area (Fig. 1b).
Finally, the topmost unit (Sd2) is identified as a mid- to late Holocene sand unit, based on an underwater survey conducted in the area (Figs. 1, 7–10) as well as similarities to the interpretation of Shtienberg et al. (Reference Shtienberg, Dix, Waldmann, Makovsky, Golan and Sivan2016).
Coastal paleoenvironmental reconstruction: a regional perspective
The combination of seismic stratigraphy, coastal coring, and dating reveals the Pleistocene–Holocene paleoenvironmental history of the Carmel coast. Between 77–8 ka, sea level was tens to several of meters lower than present (the last glacial maximum sea-level lowstand was 135 m below present msl) (Figs. 1b, 11m; Lambeck and Bard, Reference Lambeck and Bard2000; Rohling et al., Reference Rohling, Foster, Grant, Marino, Roberts, Tamisiea and Williams2014). During maximum lowstand, the shoreline was ~13 km west of its current location; subsequent sea-level rise moved the shoreline to ~0.5 km west of present by ca. 8 ka, and it reached its current position ca. 4 ka (Sivan et al., Reference Sivan, Lambeck, Toueg, Raban, Porath and Shirman2004b; Galili et al., Reference Galili, Benjamin, Eshed, Rosen, McCarthy and Horwitz2019). Hence, most of the stratigraphic sequence at Dor, other than the mid- to late Holocene sand unit (F5), was deposited in a terrestrial environment.
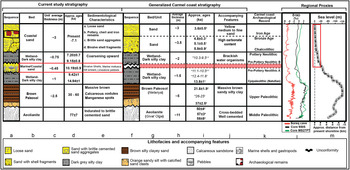
Comparison between a composite of sequences from the south bay of Dor (this study), general Carmel coast stratigraphy, and regional proxies. Columns (a–e) represent the following stratigraphic and age results: (a) generalized lithofacies of the south bay sequence; (b) sediment bed; (c) average thickness; (d) unit age range (from this study; Shtienberg et al., Reference Shtienberg, Yasur-Landau, Norris, Lazar, Rittenour, Tamberino and Gadol2020); (e) sedimentological characteristics. Generalized Carmel coast sequence that includes: (f) generalized lithofacies of the Carmel coast; (g) bed/unit; (h) average thickness; (i) unit age range; (j) accompanying features. This compilation was computed through the integration of the thickness and ages: (1) Kadosh et al. (Reference Kadosh, Sivan, Kutiel and Weinstein-Evron2004), (2) Sivan and Porat (Reference Sivan and Porat2004), (3) Sivan et al. (Reference Sivan, Eliyahu and Raban2004a), (4) Cohen-Seffer et al. (Reference Cohen-Seffer, Greenbaum, Sivan, Jull, Barmeir, Croitoru and Inbar2005), (5) Sivan et al. (Reference Sivan, Greenbaum, Cohen-Seffer, Sisma-Ventura and Almogi-Labin2011), (6) Mauz et al. (Reference Mauz, Hijma, Amorosi, Porat, Galili and Bloemendal2013), (7) Shtienberg et al. (Reference Shtienberg, Dix, Roskin, Waldmann, Bookman, Bialik, Porat, Taha and Sivan2017) (see Figure 1 for locations of these studies); (k) correlative archaeological periods based on Galili et al. (Reference Galili, Rosen, Evron, Hershkovitz, Eshed, Kolska Horwitz, Bailey, Galanidou, Peeters, Jöns and Mennenga2020) and Kuijt and Goring-Morris (Reference Kuijt and Goring-Morris2002); (l) paleoclimate reconstruction based on Core 9505 (Langgut et al., Reference Langgut, Almogi-Labin, Bar-Matthews and Weinstein-Evron2011), Soreq cave speleothem record as a proxy for precipitation and runoff (Bar-Matthews et al., Reference Bar-Matthews, Ayalon, Gilmour, Matthews and Hawkesworth2003), and deep-sea record as a proxy for Levantine sea response to global ice accumulation (Almogi-Labin et al., Reference Almogi-Labin, Bar-Matthews, Shriki, Kolosovsky, Paterne, Schilman, Ayalon, Aizenshtat and Matthews2009; Revel et al., Reference Revel, Ducassou, Grousset, Bernasconi, Migeon, Révillon, Mascle, Murat, Zaragosi and Bosch2010); (m) Global sea level stack (Spratt and Lisiecki, Reference Spratt and Lisiecki2016) and relative sea-level curve (red polygon; Dean et al. Reference Dean, Horton, Evelpidou, Cahill, Spada and Sivan2019; Galili et al., Reference Galili, Benjamin, Eshed, Rosen, McCarthy and Horwitz2019; Sivan et al., Reference Sivan, Wdowinski, Lambeck, Galili and Raban2001) against approximated distance from present shoreline.

The south bay of Dor is protected by north–south trending islands, wave cut platforms, and headlands comprised of calcareous sandstone (Sneh, Reference Sneh1981; Sneh and Klein, Reference Sneh and Klein1984; Kadosh et al., Reference Kadosh, Sivan, Kutiel and Weinstein-Evron2004; Sivan et al., Reference Sivan, Eliyahu and Raban2004a), and these sandstones are found above and below msl (Figs. 2, 3b, 9d). Based on luminescence age dates from the island headlands, 0.5 km south of the study area (Fig. 2; Sivan and Porat, Reference Sivan and Porat2004; Mauz et al., Reference Mauz, Hijma, Amorosi, Porat, Galili and Bloemendal2013), these sandstones represent aeolianites, and were initially deposited ca. 60–35 ka as parabolic sand dunes (Roskin et al., Reference Roskin, Sivan, Shtienberg, Roskin, Porat and Bookman2015, Shtienberg et al., Reference Shtienberg, Dix, Roskin, Waldmann, Bookman, Bialik, Porat, Taha and Sivan2017) on a ca. 77 ka aeolianite bedrock surface (Table 1, Figs. 5, 6, 9d). The dunes were then lithified, forming aeolianite mounds that were eroded over time into their current form. During the mid-Holocene, ca. 4 ka, when sea level rose to its current elevation (Dean et al., Reference Dean, Horton, Evelpidou, Cahill, Spada and Sivan2019), the lithified aeolianite headlands were further battered by wave energy (Fig. 2c), and were later mined for building stone (Figs. 2, 3c). As a result of these depositional and erosional processes, the aeolianite mounds consist of a rigid surface that is characterized by ridges, depressions, and E–W cutting troughs (Figs. 2, 3, 9d). The topography on top of the aeolianite ridges had a major impact on subsequent sedimentation (Fig. 9d) as well as the present coastal morphology of the area (Fig. 2).
From ca. 60–20 ka (Upper Paleolithic to Natufian period; Figs. 2, 11), the parent material of the paleosol unit (F1/Sb1) covered the aeolianite surface, with initial deposition occurring in topographic lows of 1–4 m relative to present msl (Figs. 6, 11). This relationship is in agreement with the findings of Sivan and Porat (Reference Sivan and Porat2004), indicating that local settings (i.e., topography, hydrological conditions) influence differential processes of pedogenesis/lithogenesis (Shtienberg et al., Reference Shtienberg, Dix, Roskin, Waldmann, Bookman, Bialik, Porat, Taha and Sivan2017). Based on the chronology of this unit, it seems that F1/Sb1 mostly correlates to Israel's coastal plain Netanya paleosol (40–20 ka; Fig. 11) (Tsatskin et al., Reference Tsatskin, Gendler, Heller and Ronen2008), and represents extensive soil formation during the last glacial period along the coast of Israel (Fig. 11; Mauz et al., Reference Mauz, Hijma, Amorosi, Porat, Galili and Bloemendal2013; Shtienberg et al., Reference Shtienberg, Dix, Roskin, Waldmann, Bookman, Bialik, Porat, Taha and Sivan2017) as well as at other locations in the Mediterranean Basin (Muhs et al., Reference Muhs, Budahn, Avila, Skipp, Freeman and Patterson2010) and elsewhere (e.g., Canary Islands; von Suchodoletz et al., Reference von Suchodoletz, Oberhänsli, Hambach, Zöller, Fuchs and Faust2010). During this episode, climatic conditions were relatively stable (Almogi-Labin et al., Reference Almogi-Labin, Bar-Matthews, Shriki, Kolosovsky, Paterne, Schilman, Ayalon, Aizenshtat and Matthews2009; Langgut et al., Reference Langgut, Almogi-Labin, Bar-Matthews and Weinstein-Evron2011) and global msl fluctuated between −40 to −135 m relative to present msl. The paleosol formation is associated with Heinrich stadials 6–5, which have been identified globally as periods of increased Saharan dust input (Mahowald et al., Reference Mahowald, Muhs, Levis, Rasch, Yoshioka, Zender and Luo2006; Torfstein et al., Reference Torfstein, Goldstein and Stein2018) that affected the Mediterranean Basin and adjacent terrestrial areas. Wind-blown dust contributed ferromagnetic minerals to the porous parent material of the soil profile. These aeolian additions, along with contributions from weathering and leaching within the soil profile, account for the silt-clay lithology and elevated Al/Si, Fe/Si, and Ti/Si ratios and MS values (~200 Si × 10-6) of unit F1 (Tsatskin et al., Reference Tsatskin, Sandler and Avnaim-Katav2015; Shtienberg et al., Reference Shtienberg, Dix, Roskin, Waldmann, Bookman, Bialik, Porat, Taha and Sivan2017).
The upper parts of the red-brown paleosol within unit F1 gradually change into a ~1 m-thick, dark-gray loamy unit (F2/Sb2) that was deposited between ca. 15 ka and 9.9 ka (Natufian to PPNB; Figs. 6, 11). Elevated MS values (250–900 Si × 10−6) and high ratios of Fe/Si, Ti/Si, and Zr/Si, along with the faunal and floral remains, suggest that Unit F2/Sb2 is composed of brackish wetland sediment (Sivan et al., Reference Sivan, Eliyahu and Raban2004a; Cohen-Seffer et al., Reference Cohen-Seffer, Greenbaum, Sivan, Jull, Barmeir, Croitoru and Inbar2005). The wetland may reflect climate conditions of the African Humid Period (ca. 15–7 ka), postulated to be the outcome of extreme insolation values at 65°N (Imbrie et al., Reference Imbrie, Hays, Martinson, McIntyre, Mix, Morley, Pisias, Prell, Shackleton and Berger1984), and evident in a variety of local and regional proxies such as the Soreq cave speleothems, and southeastern Mediterranean deep-sea core record (Figs. 1a, 11l; Bar-Matthews et al., Reference Bar-Matthews, Ayalon, Gilmour, Matthews and Hawkesworth2003; Almogi-Labin et al., Reference Almogi-Labin, Bar-Matthews, Shriki, Kolosovsky, Paterne, Schilman, Ayalon, Aizenshtat and Matthews2009; Revel et al., Reference Revel, Ducassou, Grousset, Bernasconi, Migeon, Révillon, Mascle, Murat, Zaragosi and Bosch2010). Based on the global combined sea-level stack (Spratt and Lisiecki, Reference Spratt and Lisiecki2016) and relative sea level of the Mediterranean (Fig. 11m; Rohling et al., Reference Rohling, Foster, Grant, Marino, Roberts, Tamisiea and Williams2014) at the time of deposition of Unit F2, the coastal wetland found along the northern Israeli coast would have been located several kilometers to the east of the paleo-coastline (Fig. 9).
Wetland deposition was interrupted by a coastal/marine sand deposit (Unit F3) that is bounded by the upper and lower wetland units (Units F2, F4). The sedimentological change of the wetland unit to marine/coastal sand is distinct, and is identified across the terrestrial and shallow marine parts of the bay. Unit F3 consists of poorly sorted sand containing clay clasts, marine gastropod and bivalve Glycymeris shells as well as limestone and calcareous sandstone pebbles (Figs. 4–6). Erosional features of the bounding reflector of Sb2 and evidence of an erosion surface at the base of Unit F3 in the core data indicate that this coastal/marine sand was deposited unconformably in the lower wetland deposit (Unit F2). The age of coastal/marine sand (F3) including its uncertainties (10.19 ± 0.90 ka), and ages from the underlying wetland surface from F2 (9.42 ± 0.85 ka) as well as the base of the overlying wetland unit F4 (9.15 ± 0.78 ka) brackets deposition to between 9.91 ka to 9.29 ka (Table 1). Relying on this age constraint (9.9–9.3 ka), sea level and projected paleoshoreline during the deposition of F3, as well as the marine faunal remains embedded in this unit, suggest that Unit F3 was deposited at a landscape elevation above the early Holocene sea level at the time. We suggest that this coastal sediment represents a tsunami deposit as discussed in Shtienberg et al. (Reference Shtienberg, Yasur-Landau, Norris, Lazar, Rittenour, Tamberino and Gadol2020). Similar deposits with similar ages have yet to be identified along the coast of Israel or in other coastal sites around the Levant basin.
A second wetland unit (F4), resembling unit F2 in sedimentological characteristics, caps unit F3, and based on its chronology, it was deposited from ca. 9.3–7 ka (Pre-Pottery Neolithic B to Pottery Neolithic period; Fig. 5). Faunal and floral remains identified in the unit as well as the chronostratigraphic correlation to previous studies from the Carmel coast (10.3–9 ka; Fig. 11) indicate that this wetland unit was deposited in a brackish-water environment (Sivan et al., Reference Sivan, Eliyahu and Raban2004a; Cohen-Seffer et al., Reference Cohen-Seffer, Greenbaum, Sivan, Jull, Barmeir, Croitoru and Inbar2005). Relative (Rohling et al., Reference Rohling, Foster, Grant, Marino, Roberts, Tamisiea and Williams2014) and local (Sivan et al., Reference Sivan, Wdowinski, Lambeck, Galili and Raban2001; Galili et al., Reference Galili, Benjamin, Eshed, Rosen, McCarthy and Horwitz2019) sea-level curves suggest an abrupt sea level rise during the early Holocene, transgressing from 40 m to 16 m below present msl. As sea level rose, the shoreline migrated eastward from 4 km to 1.5 km west of Dor, elevating coastal aquifer levels that contributed water to the coastal wetland systems (Fig. 9; Sivan et al., Reference Sivan, Greenbaum, Cohen-Seffer, Sisma-Ventura and Almogi-Labin2011; Shtienberg et al., Reference Shtienberg, Dix, Waldmann, Makovsky, Golan and Sivan2016). The flooding of the shelf, as well as prevailing wetter conditions during this part of the African Humid Period (Bar-Matthews et al., Reference Bar-Matthews, Ayalon, Gilmour, Matthews and Hawkesworth2003, Kadosh et al., Reference Kadosh, Sivan, Kutiel and Weinstein-Evron2004; Grant et al., Reference Grant, Grimm, Mikolajewicz, Marino, Ziegler and Rohling2016), reduced coastal stream gradients and would have inundated topographic lows. OSL ages place deposition of the upper wetland deposit in core D11 at 7.2 ± 0.70 ka, and initial deposition of the overlying coastal sand at 7.10 ± 0.68 ka (Table 1, Fig. 6). These ages and their reported uncertainties constrain the termination of wetland deposition to sometime around 7.2 ka (Supplemental Figure 7). This age constraint suggests that this environmental transition from a wetland to a coastal site could be partly linked to the end of the African Humid Period (i.e., ca. 7 ka; Fig. 11l) (Bar-Matthews et al., Reference Bar-Matthews, Ayalon, Gilmour, Matthews and Hawkesworth2003; Almogi-Labin et al., Reference Almogi-Labin, Bar-Matthews, Shriki, Kolosovsky, Paterne, Schilman, Ayalon, Aizenshtat and Matthews2009; Revel et al., Reference Revel, Ducassou, Grousset, Bernasconi, Migeon, Révillon, Mascle, Murat, Zaragosi and Bosch2010; Langgut et al., Reference Langgut, Almogi-Labin, Bar-Matthews and Weinstein-Evron2011; Ehrmann et al., Reference Ehrmann, Schmiedl, Beuscher and Kruger2017).
The lowermost facies of the upper sand unit (F5a) consists of a 1–3 m-thick, medium-grained sand unit with subrounded grains (Figs. 4, 5) and abundant Glycymeris shells. The base of this unit was dated to 7.10 ± 0.68 ka in core D11 (Pottery Neolithic–Chalcolithic Period; Fig. 6) within the uncertainty bounds of the underlying wetland deposit (7.20 ± 0.70 ka), and is consistent with a similar age of 6.95 ± 0.68 ka acquired from the bottom of F5a in core D4 (Fig. 6). This overlap (Supplemental Figure 7) suggests that initial coastal sand deposition in unit F5a began sometime ca. 7.1 ka. During deposition of this facies, sea level was ~7–4 m lower than present, while the shoreline was located a few hundred meters westward of its current location (Fig. 11). Hence, at least initially, the coastal sand unit was probably deposited by storm wash-over and strong winds that moved sand into the adjacent wetland surface from the paleocoastline.
Overlying the coastal sand facies (F5a), facies 5b consists of poorly sorted, coarse sand and gravel, and Glycymeris shells. These sedimentological characteristics, two late Holocene ages (2.80 ± 0.28 and 1.14 ± 0.20 ka), and correlation with the relative sea-level curve of the Israeli coast, indicate that Unit F5a was deposited in a coastal environment when sea level was similar to present (Dean et al., Reference Dean, Horton, Evelpidou, Cahill, Spada and Sivan2019). Archeological remains (sherds, iron fragments), and high MS values as well as elemental ratios for Fe/Si, Zn/Si, (Figs. 4, 5) are the result of extensive human habitation from at least since Middle Bronze Age II and into the Roman period (Stern, Reference Stern1994; Raban, Reference Raban, Stern, Berg, Gilboa, Guz-Zilberstein, Raban, Rosenthal-Heginbottom and Sharon1995; Shahack-Gross et al., Reference Shahack-Gross, Albert, Gilboa, Nagar-Hilman, Sharon and Weiner2005; Sharon et al., Reference Sharon, Gilboa, Boaretto, Jull, Levy and Higham2005; Gilboa and Sharon, Reference Gilboa and Sharon2008).
The sand sequence is topped by ~1.5 m of facies F5c, which consists of medium- to coarse-grained sand distributed with shell material, and the facies also has low MS values. Given that the seasonal beach profile changes of the Carmel coast can fluctuate between 1–1.5 m (Shtienberg et al., Reference Shtienberg, Zviely, Sivan and Lazar2014) and the presence of glass and other recent artifacts, this facies is interpreted as modern pocket-beach sands.
Pottery Neolithic settlement of the Carmel coast and environmental change
Underwater excavations have discovered a cluster of ten submerged Pottery Neolithic (PN) sites (8.25–7.8 ka; Galili et al., Reference Galili, Rosen, Evron, Hershkovitz, Eshed, Kolska Horwitz, Bailey, Galanidou, Peeters, Jöns and Mennenga2020) from Kfar Samir in the north to Habonim in the south (Fig. 1b). These sites were all found a few meters to a few hundred meters west of the present shoreline, in water depths ranging from 0 to 5 m below msl (Galili et al., Reference Galili, Ronen, Mienis and Kolska Horwitz2017, Reference Galili, Rosen, Evron, Hershkovitz, Eshed, Kolska Horwitz, Bailey, Galanidou, Peeters, Jöns and Mennenga2020), and situated on top of the early Holocene wetland facies unit F4 (Fig. 11). Recent underwater excavations show that submerged settlements are also present 12 km south of Atlit, in the south bay of Dor (Fig. 3c). Excavations conducted in 2019 by the University of Haifa and University of California San-Diego uncovered PN sherds, a submerged rectangular building, and a circular feature 1.5 m below msl (Shtienberg et al., Reference Shtienberg, Yasur-Landau, Norris, Lazar, Rittenour, Tamberino and Gadol2020) on the surface of the organic-rich, silty clay unit (F4/Sb3) that represents the top of the wetland facies. Relying on the youngest age constraint of the F4 surface dated to 7.20 ± 0.70 ka, we propose that the submerged rectangular building is associated with PN settlement.
A correlation between the PN period to the chronostratigraphy of the Carmel coast (Fig. 11) and Levantine climate patterns implies that the settlements of the Carmel coast were located on a dried wetland surface (Sivan et al., Reference Sivan, Eliyahu and Raban2004a, Reference Sivan, Greenbaum, Cohen-Seffer, Sisma-Ventura and Almogi-Labin2011; Cohen-Seffer et al., Reference Cohen-Seffer, Greenbaum, Sivan, Jull, Barmeir, Croitoru and Inbar2005) close to the end of the African Humid Period (Bar-Matthews et al., Reference Bar-Matthews, Ayalon, Kaufman and Wasserburg1999, Reference Bar-Matthews, Ayalon, Gilmour, Matthews and Hawkesworth2003). Sea level rose rapidly during the PN period, transgressing from ~10 m to 5 m below present msl, at a mean annual rate of ~13–15mm/year (Stanford et al., Reference Stanford, Hemingway, Rohling, Challenor, Medina-Elizalde and Lester2011). During this period, the fast-transgressing shoreline would have been coupled with spring tides and extreme winter storms, resulting in wash-throughs that reached the entrance of the south bay of Dor. The time of abandonment of the coastal PN settlement is not known, but could be constrained based on the relationship of the relative sea-level change and corresponding PN site elevation. Taking these data into account, it is likely that the sea flooded the site and the south bay of Dor ca. 7.6–6.4 ka.
SUMMARY AND CONCLUSIONS
The present-day coastal landscape of Dor is the result of differential erosion of the north–south trending aeolianite ridge, which was deposited and lithified in two phases between 77–50 ka. The aeolianite bedrock is overlain by a terrestrial silty unit containing red-brown paleosols. Wetlands developed over the paleosols and lithified dunes during the African Humid Period. A high energy deposit, likely the product of a tsunami, interrupted wetland deposition. The upper surface of the wetland is associated with PN archaeological material, suggesting that coastal peoples settled on the surface of the dry marsh. These coastal communities were displaced by sea-level rise, which has contributed to the deposition of the upper coastal sand since ca. 7.1 ka. The preservation of late Pleistocene to Holocene sedimentary deposits and the associated archaeological record identified in our study was enabled due to the protective characteristics of the south bay of Dor and its coastal embayment created by the shore-perpendicular ridge.
The sedimentological and archaeological evidence identified in the stratigraphic record of the sheltered south bay of Dor demonstrate the importance of research-area selection. The morphological characteristics of the south bay of Dor has led to more complete preservation of the stratigraphical record, which helps to fill geochronological gaps in the evolution of the paleo-coastal plain over a glacial–interglacial period to the formation of the current coastline. This combined geological and archeological approach can help clarify the close relations between naturally changing environments and human settlement behavior in other coastal areas that exhibit a long historical settlement record and protective geomorphological conditions.
Supplementary Material
The supplementary material for this article can be found at https://doi.org/10.1017/qua.2021.30
Acknowledgments
The authors would like to thank Katrina Cantu of Scripps Center for Marine Archaeology, Scripps Institution of Oceanography, UC San Diego, as well as Amir Yurman and Moshe Bachar of the University of Haifa RIMS marine workshop, and Rami Tsadok and Dr. Uri Basson for their help in the field. The authors would also like to thank Emerson/Paradigm, Dr. Yizhaq Makovsky, and the AMEL lab of the University of Haifa for software use. Improvements of earlier versions of the manuscript by reviewers Prof. Alexander R. Simms, Prof. Colin V. Murray-Wallace, an anonymous reviewer, and by the editors (Prof. Derek Booth and Prof. Tyler Faith) are truly appreciated.
Financial Support
The authors gratefully acknowledge the generous support provided by Scripps Center for Marine Archaeology, Scripps Institution of Oceanography, UC San Diego; The Koret Foundation (Grant ID 19-0295); Murray Galinson San Diego – Israel Initiative; the Israel Institute (Washington, D.C.); Marian Scheuer-Sofaer and Abraham Sofaer Foundation; Norma and Reuben Kershaw Family Foundation; Ellen Lehman and Charles Kennel–Alan G Lehman and Jane A Lehman Foundation; Paul and Margaret Meyer, and the Israel Science Foundation (Grant ID 495/18).


 Open access