


A trend is a trend is a trend
But the question is, will it bend?
Will it alter its course
Through some unforeseen force
And come to a premature end?—Stein Age Forecaster (quoted in Alec Cairncross, “Economic Forecasting,” Economic Journal 79[316]:797, 1969)
North American archaeology has gone through various well-known periods of wavering between concern with either documenting specific times, places, and peoples, or explaining general, large-scale patterns of human behavior (O’Brien et al. Reference O’Brien, Lyman and Schiffer2005; Trigger Reference Trigger2006). For much of the later twentieth century, the idea of simply documenting regional culture history was seen as secondary—or even unnecessary—compared to understanding the broad sweep of human history. The idea that Native Americans even had a history was at times denied or downplayed in favor of either understanding allegedly disappearing cultures or searching for universal evolutionary patterns (McGuire Reference McGuire1992). This tension between illuminating the unique, special, or regional at the expense of the shared, general, or universal has manifested in studies of technological change as different levels of concern about style versus function, or creative agency within versus diffusion of ideas from without, or idealist versus materialist conceptions of what causes culture change (Dunnell Reference Dunnell1978; Fiedel Reference Fiedel and Fiedel1992; Hodder Reference Hodder and Hodder2012; Watson Reference Watson, Alexander Bentley, Maschner and Chippindale2008; Webster Reference Webster, Alexander Bentley, Maschner and Chippindale2008).
The process of a new technology taking hold in a region can therefore be seen as either a simplistic, large-scale, wave-like replacement or a complex interdigitation of economic and social processes taking place at many scales. The adoption of the bow and arrow throughout North America exemplifies this because it shows, on one hand, how a singular technology spread through diverse cultures, but on the other hand, how the change was neither instantaneous nor monolithic—the first arrow points showed up at different times, and with different morphologies, in different places. Tracing the spread of a technology like the bow and arrow is rooted in culture history, but at the same time, it has implications for processual archaeological understandings of culture change and adaptation.
A key aspect of how we perceive and understand the spread of the bow in North America relates to how it fits into established culture-historical categories. Archaeologists have underscored the importance of this Late Holocene technological transition in that many culture-historical periods in North America are divided into “pre-” and “post-” bow-and-arrow categories. In California, the traditional date for the introduction of the bow and arrow is about 1450 cal BP (Moratto Reference Moratto1984), although it is now clear that this date cannot be applied equally to all parts of the state (Kennett et al. Reference Kennett, Lambert, Johnson and Culleton2013). The appearance of arrow points often marks the change to the “Late Prehistoric” period or horizon, which itself is temporally variable by region and by researcher, and it goes by a variety of names—some of which denote straightforward temporal divisions, whereas others refer to distinct assemblages, cultural entities, or adaptations (Bennyhoff and Fredrickson Reference Bennyhoff, Fredrickson and Richard1994; Bettinger and Taylor Reference Bettinger, Taylor, Elston and Sabini1974; Rosenthal Reference Rosenthal2011, Reference Rosenthal2021).
Archaeologists have always struggled with how to balance the reality of continuous time with the utility of time periodization. Even though we know intellectually that a span of one year—or even several decades—is continuous and ultimately no different from any other interval, when this transition spans one of our temporal period boundaries (e.g., “Archaic” to “Woodland”), it is treated differently. We are primed to look for other concurrent changes in the archaeological record and satisfied when we find them. Exactly how arrow points fit in with these schemes is often difficult to understand. Does the appearance of the arrow points, among other artifact types, mark the beginning of the period? Or does the period boundary mark an important cultural or adaptational inflection point, of which the arrow points may play a minor role or may pre- or postdate it? Knowing when the bow and arrow entered various regions of California, irrespective of culture-historical periods or projectile point typologies could help answer some of these important questions.
Many researchers have considered the broad outlines of the history of the bow and arrow and the implications for culture change related to its efficiency as a weapon (Bettinger and Eerkens Reference Bettinger and Eerkens1999; articles in Bingham et al. Reference Bingham, Souza and Blitz2013; Blitz Reference Blitz1988; Hughes Reference Hughes1998; Shea and Sisk Reference Shea and Sisk2010). The bow and arrow is thought to have been in use at least as early as 45 kya in Africa, Europe, and Asia and may be associated with the spread of Homo sapiens out of Africa (Knecht Reference Knecht1997; Shea Reference Shea2006). Surprisingly, the bow probably did not arrive in North America with the first human populations at the Pleistocene-Holocene transition; instead, it spread later from Northeast Asia via the Arctic after about 5000 cal BP, although some see evidence for earlier bow use (Blitz Reference Blitz1988; Maschner and Mason Reference Maschner and Mason2013). From there, it moved south, arriving in the Southwest and Southeast by about 1500 cal BP (Blitz Reference Blitz1988; Nassaney and Pyle Reference Nassaney and Pyle1999; VanPool and O’Brien Reference VanPool and O’Brien2013). The bow probably entered Mesoamerica around the same time, but concurrent use of the atlatl—especially in warfare—has also been documented (VanPool Reference VanPool2006). In South America, firmly dated use of the bow and arrow seems to be confined to the post–1350 cal BP interval, although much earlier dates have also been suggested (Flores-Blanco et al. Reference Flores-Blanco, Cuellar, Aldenderfer, Stanish and Haas2024; Marsh, Llano, et al. Reference Marsh, Llano, Cortegoso, Castro and Yebra2023).
In western North America, the bow is present in Alaska from 4500 to 3600 cal BP, but then is inexplicably absent until 2400 cal BP (Maschner and Mason Reference Maschner and Mason2013). The bow arrived in northwest Washington by 3500 cal BP (Rorabaugh and Fulkerson Reference Rorabaugh and Fulkerson2015); on the Columbia Plateau and Eastern Oregon prior to 2000 cal BP (Aikens Reference Aikens1993; Ames et al. Reference Ames, Dumond, Galm, Minor and Deward1998; Chatters et al. Reference Chatters, Campbell, Smith, Phillip and Minthorn1995); in northeastern California as early as 1900 cal BP (Basgall and Hildebrandt Reference Basgall and Hildebrandt1989; Hildebrandt and King Reference Hildebrandt, King and Kelly2002; Hughes Reference Hughes1986); in the Western Great Basin by about 1400 cal BP (Bettinger and Taylor Reference Bettinger, Taylor, Elston and Sabini1974; Yohe Reference Yohe1998); and likely later in the Sierra Nevada, in the Sacramento–San Joaquin Delta, and on the California coast (Groza et al. Reference Groza, Rosenthal, Southon and Milliken2011; Jones et al. Reference Jones, Stevens, Jones, Fitzgerald, Hylkema, Terry and Kathryn2007; Kennett et al. Reference Kennett, Lambert, Johnson and Culleton2013; Rosenthal Reference Rosenthal2011; Stevens and Codding Reference Stevens and Codding2009; Stevens et al. Reference Stevens, Whitaker and Rosenthal2019). Even though the broad outlines of the spread of the bow are known, when it arrived in specific areas is a subject of some conjecture. Unfortunately, when the question is considered at all, it is often either in reference to one or more time-sensitive projectile point types that are understood to be the “first” arrow points in the region in question, or as an important transition that happened within a particular time period.
The problem with this approach is that the origins of the point types and time-period divisions making up each local culture-historical scheme are not always clear. Twentieth-century archaeologists used stratigraphic relationships, seriation of various artifact types, or feature associations to construct broad temporal divisions, including which projectile points went with which time period. These periods were later refined after the advent of radiocarbon dating, but the tendency of archaeologists to keep all of our classificatory piles neat and tidy rather than breaking apart hard-won schemes has made it more difficult to chart the history of the bow and arrow, especially if it happens to cross-cut one of our periods (Schroedl Reference Schroedl2025). This study presents a new and widely applicable method to track the introduction of the bow and arrow by looking for “changepoints” in time-series data that mark significant size reductions in projectiles. Importantly, this general method can be used with any relevant metric or statistic that tracks projectile size, and with a variety of dating methods.
Arrow Points by Many Other Names
The first arrow points vary by geographic region, and the large number of regional point types makes it difficult to point to exactly when the bow entered a region. In eastern California and the Sierra Nevada, the putative first arrow points belong to the Eastgate and Rose Spring types (Heizer and Hester Reference Heizer and Hester1978; Thomas Reference Thomas1981). In northeastern California, these same forms are present, but the Tuluwat (née “Gunther”) barbed or other small stemmed varieties are also present (Hildebrandt and King Reference Hildebrandt, King and Kelly2002; Jaffke Reference Jaffke1997; Treganza Reference Treganza1959). In the northern Sacramento Valley region, the Tuluwat barbed point is also thought to be the first arrow point (Bennyhoff Reference Bennyhoff and Richard1994; Rosenthal Reference Rosenthal2021; Sundahl Reference Sundahl1992), but some Clikapudi series forms may also be early arrow points based on their small size (Basgall and Hildebrandt Reference Basgall and Hildebrandt1989). In the North Coast ranges, the Tuluwat barbed form is also a likely first arrow, but Rattlesnake notched points and other small serrated forms co-occur in many areas (Basgall Reference Basgall, Greg White, Hildebrandt and Basgall1993; Hildebrandt et al. Reference Hildebrandt, Baker, Maniery, Heffner and King2018). In the Sacramento–San Joaquin Delta area, the unique Stockton serrated form is likely the first arrow point, but occasionally small forms from adjacent regions are present as well (Byrd et al. Reference Byrd, Whitaker, Mikkelsen and Rosenthal2017; Rosenthal et al. Reference Rosenthal, White, Sutton, Terry and Kathryn2007).
So, even in this relatively small geographic area encompassing northern and central California, there is a bewildering diversity of possible first arrow types as well as hybrid types, such as “Rosegate” (Rose Spring/Eastgate types) and even “Gunthersnake” (Gunther/Rattlesnake types), that complicate matters even further (Jaffke Reference Jaffke1997; Thomas Reference Thomas1981). The diversity of these early arrow forms is interesting in itself, and several researchers have explored it (Bettinger and Eerkens Reference Bettinger and Eerkens1999; Byrd et al. Reference Byrd, Whitaker, Mikkelsen and Rosenthal2017; Kennett et al. Reference Kennett, Lambert, Johnson and Culleton2013; Mikkelsen et al. Reference Mikkelsen, Meyer, Whitaker, Levulett, Wohlgemuth and Stevens2014; Rosenthal Reference Rosenthal2021), but the potential for typological confusion coupled with culture-historical entrenchment can obscure the overall pattern of technological adoption in each region. This is understandable as time-sensitive projectile points such as those discussed above have chiefly been valued by archaeologists as coarse-grained markers of culture-historical periods rather than independent data themselves.
Overall, relying on point typology to track the spread of the bow and arrow leads to many additional questions that are difficult to answer. Does the point in question represent the first arrow point in the area, or is another type more likely? Are the dates ascribed to the point type locally derived or did they “piggyback” from an adjacent region along with the culture-historical divisions (Rosenthal Reference Rosenthal2002, Reference Rosenthal2011)? Is the style of point under consideration the same as another but under another name?
Considering these potential problems with using the previously established regional point types, the study described here endeavored to track the adoption of the bow and arrow over a large geographic area, irrespective of point typologies and culture-historical schemes. The expectations were that the bow and arrow would not be adopted simultaneously over such a large culturally and geographically diverse region, and that if a temporal/geographical trend were present, it would suggest the technology diffused from north to south.
Arrow Point Morphology in Space and Time
The basic problem addressed by this study has three familiar archaeological dimensions: morphology, space, and time. Space is fairly straightforward. I split the northern part of the state into several regions that accord with known geographic/archaeological divisions (Figure 1). From north to south, these regions include northeastern California, the northern Sacramento Valley, the North Coast Ranges, the Sacramento–San Joaquin Delta, the Sierra Nevada, and finally, the Mono and the Inyo county areas east of the Sierra. These regions align somewhat with ethnographic/linguistic divisions but more so with archaeological localities featuring similar human ecological adaptations, such as Great Basin/high-desert regions east of the Sierra Nevada, productive foothill regions of the western slope of the Sierra Nevada, northeastern volcanic-dominated landscapes, and the comparatively well-watered Sacramento–San Joaquin Delta.
Map showing point sample, regions, obsidian sources, and point sample locations. Obsidian source abbreviations: MLH = Medicine Lake Highlands, SW/BS = South Warners/Bordwell Spring, TUS = Tuscan, BL = Borax Lake, MK = Mount Konocti, ANA = Annadel, NAPA = Napa Valley, MH = Mount Hicks, BH = Bodie Hills, TQ = Truman-Queen, CD = Casa Diablo, MGM = Mono Glass Mountain, FS = Fish Springs, SR = Saline Range, CS = Coso Volcanic Field. (Color online).

For morphology, what is needed is essentially a measure of size, given that everywhere the bow is adopted, there is a significant drop in the size of points (Baker and Kidder Reference Baker and Kidder1937; Fenenga Reference Fenenga1953; Hildebrandt and King Reference Hildebrandt and King2012; Schroedl Reference Schroedl2024; Shott Reference Shott1997; Stevens and Codding Reference Stevens and Codding2009; Thomas Reference Thomas1978). Weight (in grams) was used for this because weights are widely reported, even when other point attributes are not, and it constitutes a convenient single-number descriptor of size. Other methods of arrow discrimination—including tip cross-sectional area (TCSA), thickness, neck width, and combinations of these measures—have also been shown to be useful (Corliss Reference Corliss1972; Erlandson et al. Reference Erlandson, Watts and Jew2014; Hildebrandt and King Reference Hildebrandt and King2012; Hughes Reference Hughes1998; Shea Reference Shea2006; Thomas Reference Thomas1978) but were not used here because of the additional attributes needed for each point, which would have significantly reduced the sample size available. I used all points available, whole or fragmentary, so the assumption was made that larger objects break into larger pieces, although this is only true in aggregate, not necessarily for any particular case. In fact, the large numbers of fragmentary points included in the database likely contribute to the “noisiness” of the dataset—meaning that many small and light forms that appear to be arrow points may actually be fragments of larger dart points. It is important to point out, however, that any noise introduced to the dataset by the inclusion of fragmentary points would be random unless a pattern of differential fragmentation of dart points during different time periods could be identified. In any case, greater numbers of arrow points (which start out in the <3 g range and only get smaller with fragmentation) used later in time should tend to overwhelm large point datasets made up of mixtures of dart and arrow point fragments.
For the dimension of time, there are some regional examples of radiocarbon-dated early arrow points (see Table 1) that are from secure stratigraphic contexts or burials, or that are still attached to wooden foreshafts (see also Barnes Reference Barnes2000; Hildebrandt and King Reference Hildebrandt, King and Kelly2002; McGuire Reference McGuire1997; Rosenthal Reference Rosenthal2021; Shott Reference Shott1997; Smith et al. Reference Smith, Barker, Hattori, Raymond and Goebel2013), but these are “surprisingly rare” (Kennett et al. Reference Kennett, Lambert, Johnson and Culleton2013), and the small sample size makes it unlikely that the earliest use of the bow is represented. Given the fact that more than 50 years of archaeological research in the region has only yielded a handful of radiocarbon associations related to the advent of the bow and arrow, I elected to use obsidian hydration dating instead because, despite its reduced precision in comparison to radiocarbon dating (Rogers Reference Rogers2010), it does have two significant advantages: (1) hydration dates on points in California number in the thousands, meaning that the error associated with each data point and the effects of outliers is lessened; and (2) hydration dates are direct dates on the artifacts themselves, so although chronological precision is lacking for individual dated artifacts, the archaeological association is strong, and pooling the errors of hundreds of dates through regression analysis—as is done here—increases the precision of the relevant estimated age (i.e., the inferred date for the introduction of the bow and arrow).
Regional Radiocarbon Dates Associated with Early Bow and Arrow Use.

a Component/aggregate association.
b Feature or burial association.
Methods
The data for this study was collected from previously published studies (see Supplementary Materials 1 and 2). The total sample included 3,114 projectile points with both source-specific hydration readings and known weights (Table 2). Given the geographical diversity of the point sample, obsidian from 14 distinct source areas was present (Figure 1), meaning that multiple hydration rates were needed to convert raw hydration readings into calibrated years BP equivalents. To keep the calculated ages of projectile points independent of point typologies or culture-historical periods, obsidian hydration rates based on “known” projectile point ages were not used (e.g., Bettinger Reference Bettinger and Richard1989; Hall and Jackson Reference Hall, Jackson and Richard1989; Stevens Reference Stevens2005). Instead, dates were only calculated using hydration rates based on radiocarbon/hydration pairings—contexts where radiocarbon dates and hydration readings are closely associated. Where possible, existing hydration rates were used, but new rates were also constructed for some sources using the methods outlined by Hull (Reference Hull2001) and Rogers and Stevenson (Reference Rogers and Stevenson2023). Specifics of rates used for this research and newly constructed rates are provided in Supplementary Material 1.
Regional Projectile Point Sample.

Another complicating factor related to the wide geographic dispersion of the point samples are the well-known effects of temperature on hydration rate: colder temperatures slow down rates, and warmer temperatures speed them up. To account for this effect and put everything on the same time scale, regional temperature corrections were made according to the methods described by Rogers (Reference Rogers2007, Reference Rogers2008) and Stevens (Reference Stevens2005). Data from 46 climate stations encompassing the geographic area of the study (Figure 2) were obtained from the Western Regional Climate Center website (Western Regional Climate Center 2022), and effective hydration temperature (EHT) was calculated for each location according to Rogers (Reference Rogers2007). Adjustments to EHT for burial depth were also made according to methods in Rogers (Reference Rogers2007).
Map showing effective hydration temperature (EHT) at regional climate data stations. (Color online).

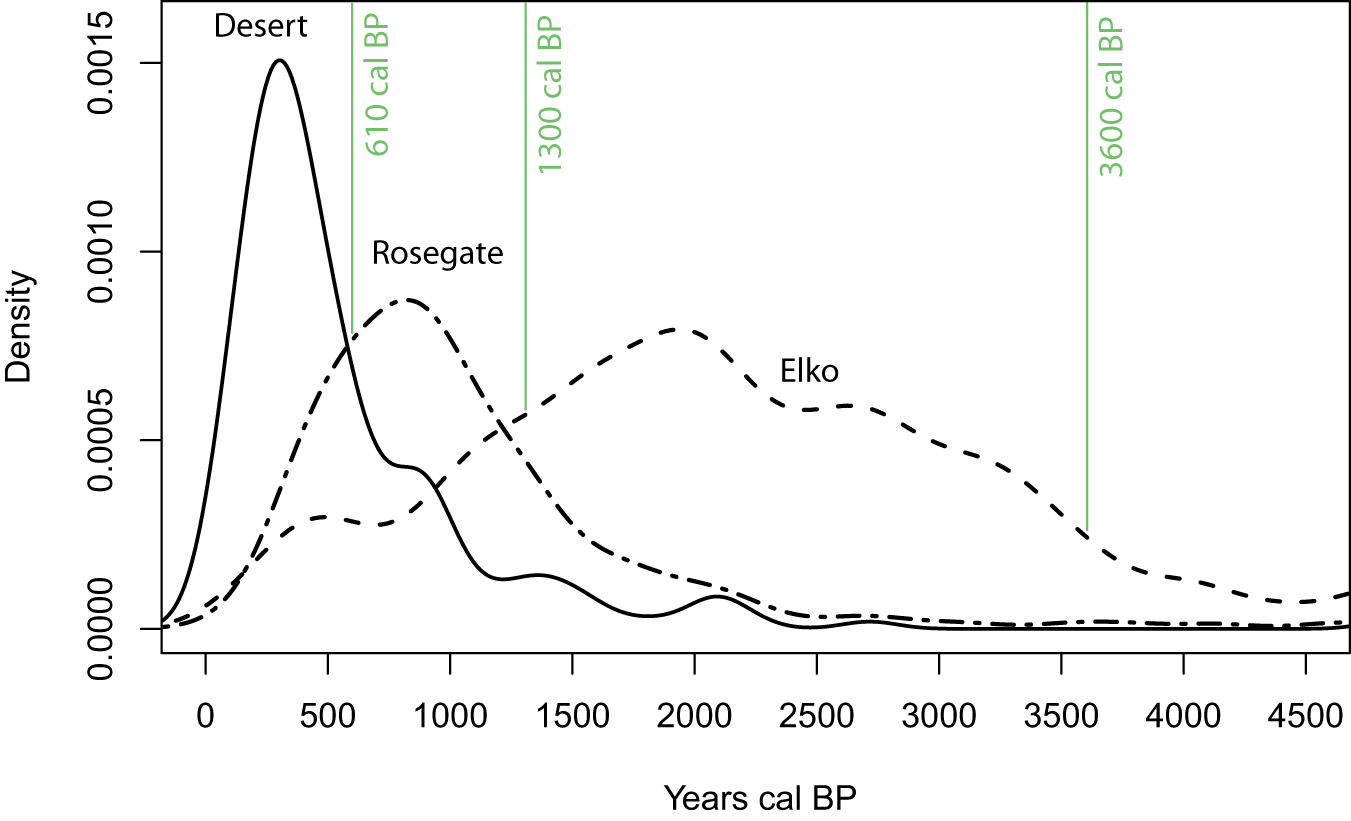
A preliminary test showing the efficacy of hydration dating methods used for this study is presented in Figure 3, which shows the combined dates of 570 projectile points from east of the Sierra Nevada, grouped by projectile point type. Like the larger sample of projectile point dates used for this study, the hydration-derived date for each projectile point was calculated using the appropriate source-specific rate, the raw hydration reading in microns, and the EHT for its specific context. In this region, three well-defined projectile point styles are known from the Late Holocene: Elko series points represent the last dart style, and Rosegate and Desert series points represent later arrow styles. For this figure, the traditional typological assignments of the projectile points are used, and the resulting density plots are compared to the regionally agreed-upon age ranges of each type based on radiocarbon evidence. The temporal patterning of each point type shows that dates based on obsidian hydration correspond closely with independently derived temporal-period boundaries and are suitable for modeling large-scale technological changes such as the adoption of the bow and arrow.
Kernal density plots of three projectile point types from east of the Sierra Nevada. Vertical lines denote culture-historical-period boundaries that define the age ranges of the three point types. Elko series points, Newberry period, 3600–1300 cal BP; Rosegate series points, Haiwee period, 1300–610 cal BP; Desert series points, Marana period, 610 cal BP–historic period (Bettinger and Taylor Reference Bettinger, Taylor, Elston and Sabini1974).

Given that a key aim of this study was to eschew such culture-historical categories in favor of continuous time, methods for pinpointing the arrival of the bow did not rely on point typology whatsoever. Instead, the weight (in grams) of each projectile point was plotted against time. Based on previous studies showing a diminution in projectile point size when the bow and arrow starts being used (Baker and Kidder Reference Baker and Kidder1937; Fenenga Reference Fenenga1953; Hildebrandt and King Reference Hildebrandt and King2012; Shott Reference Shott1997; Stevens and Codding Reference Stevens and Codding2009; Thomas Reference Thomas1978), the assumption was made that a sharp drop in point weight (on the y-axis) could be correlated with the attendant date (on the x-axis). The question is, how sharp or sudden a drop in weight is significant to assume the bow and arrow was in use?
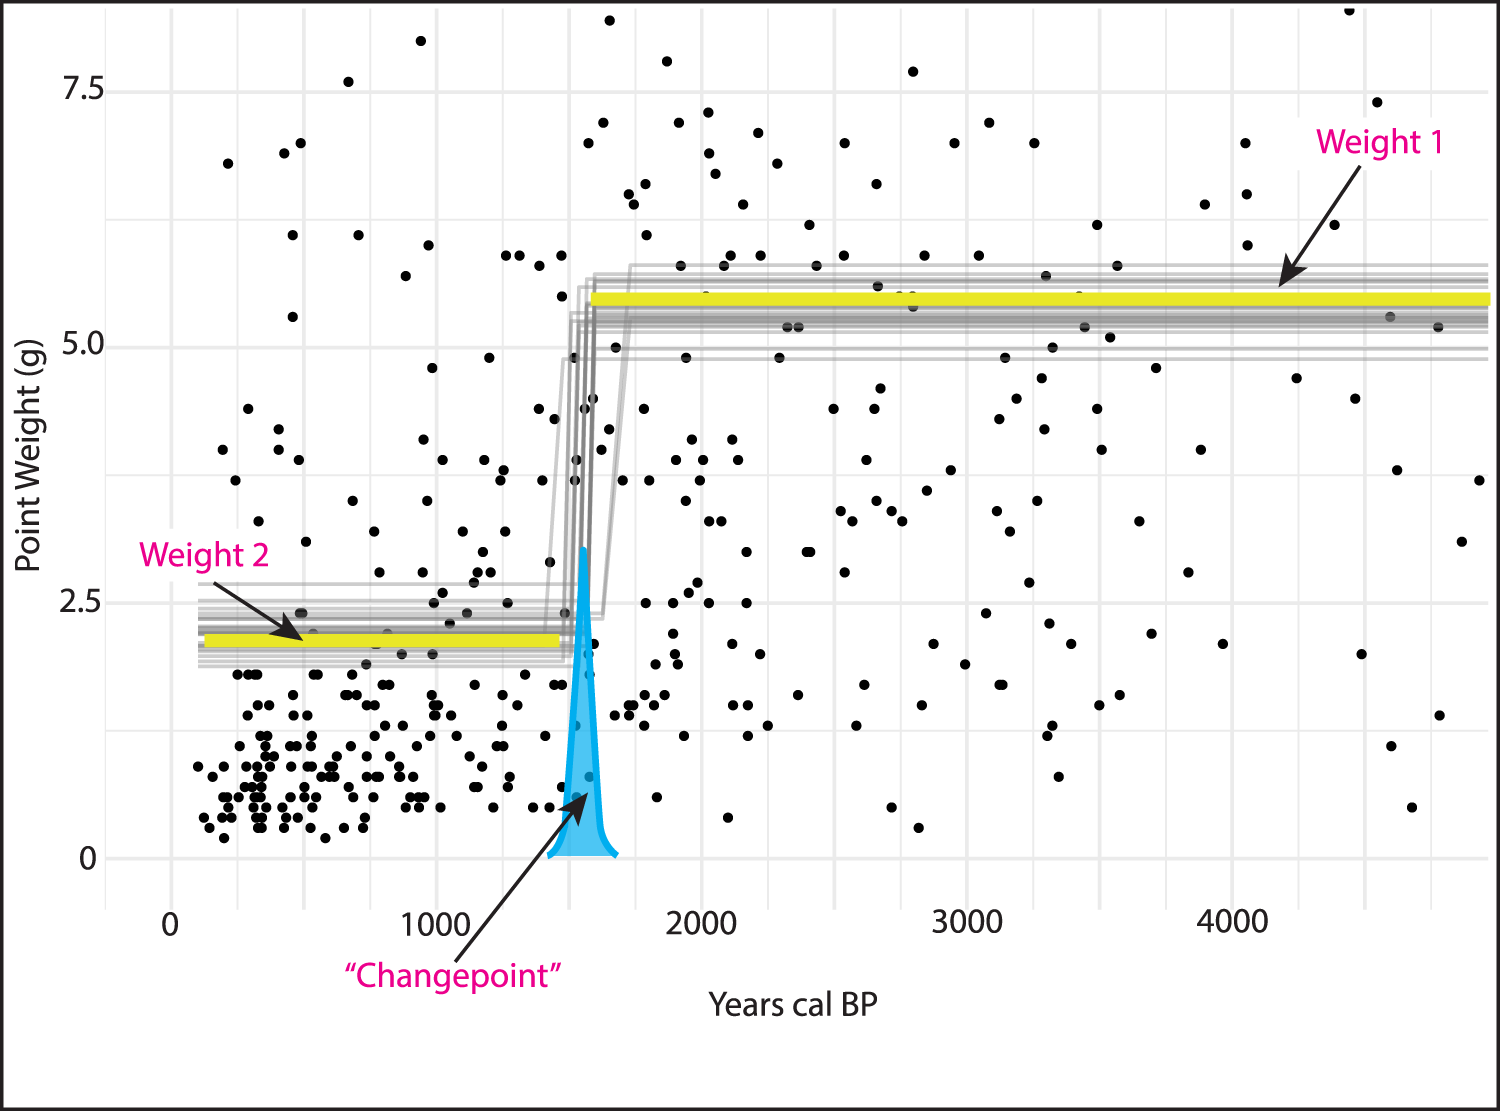
To help answer this, I turned to quantitative “changepoint” detection methods, which are designed to find where abrupt changes are apparent in time-series data (Aminikhanghahi and Cook Reference Aminikhanghahi and Cook2017). The detection of changepoints is useful for the interpretation of various kinds of time-series data, such as those documenting climate change (e.g., when temperatures rise or fall significantly). For this analysis, I used the mcp package for R, which uses Bayesian inference to model trends in the data and likely changepoints—in this case, points where the y-intercept (weight in grams) changes significantly relative to time (Lindeløv Reference Lindeløv2020). In other words, when one weight “plateau” changes to a second, lighter (and later) weight plateau, it is interpreted as a significant technological change (Figure 4). A subset of dates and weights for each geographic region was run through the changepoint algorithm. The mcp package provides a mean changepoint value—in this case, in years cal BP—and also a probability distribution of the changepoint. The changepoint for each region (i.e., the date when a significant size reduction of points was detected) was interpreted as the most likely date of introduction of the bow and arrow. All analyses were run in the R Environment for Statistical Computing using R Studio (R Core Team 2022; RStudio Team 2022).
Changepoint graph example depicting data from the Mono county region. Note the concentration of points in the lower-left quadrant weighing <3 g after the changepoint. (Color online).

Results
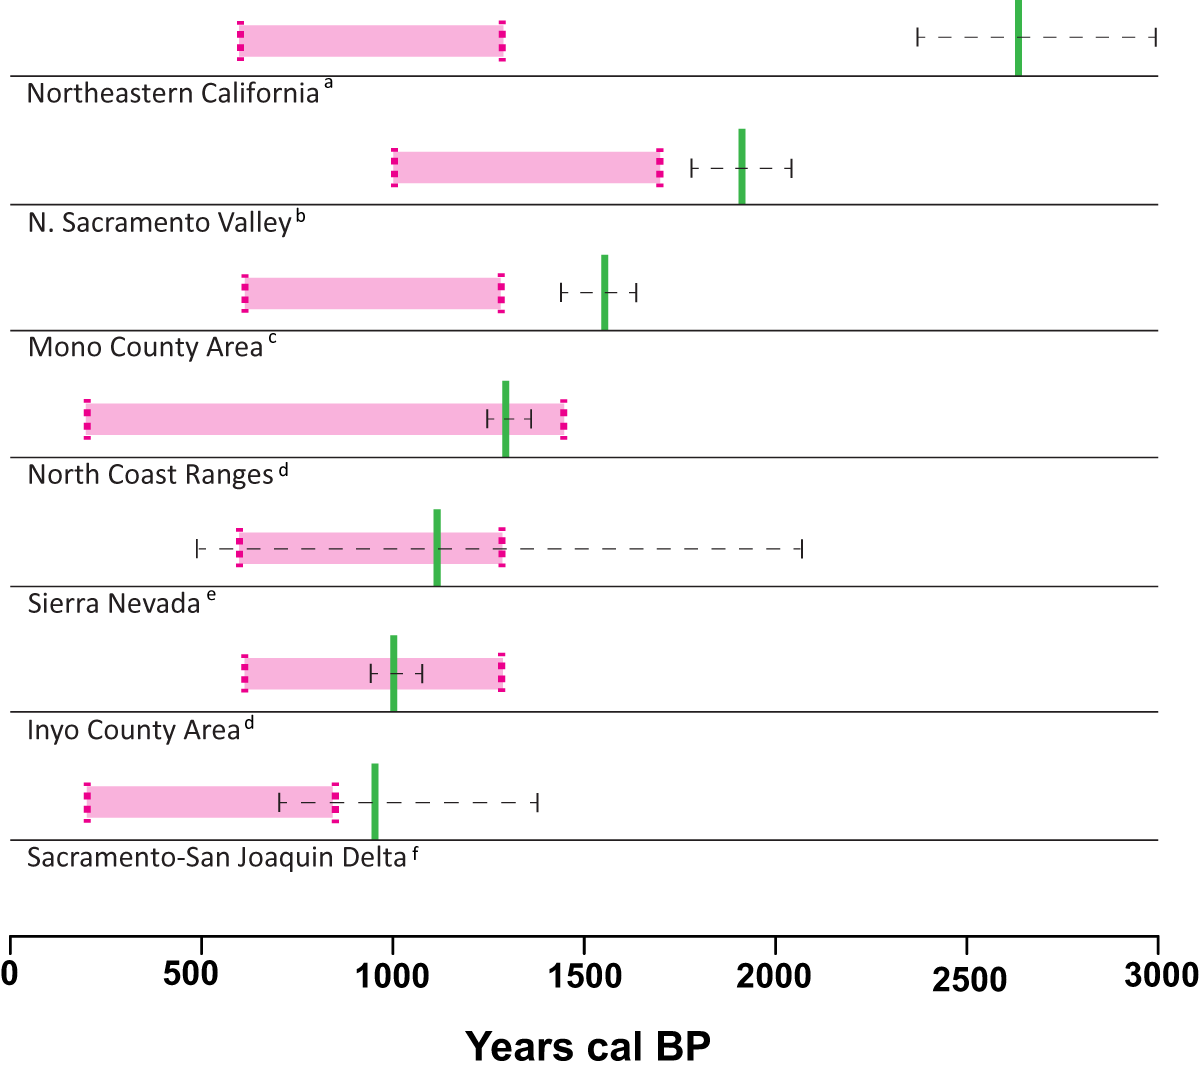
The results of the changepoint analyses suggest that the bow and arrow spread through California in a wave-like fashion from the north to the south, and possibly from coastal and peripheral areas to the interior (Figures 5 and 6; Table 3). In some cases, the changepoint dates differ significantly from existing culture-historical periods long thought to mark the appearance of the bow (Figure 5). As has been previously suggested based on hydration and limited radiocarbon evidence (Hildebrandt and King Reference Hildebrandt, King and Kelly2002; Smith et al. Reference Smith, Barker, Hattori, Raymond and Goebel2013), the first arrow points in northeastern California appear to have arrived several centuries before they did in other parts of the state (2710 cal BP). This is earlier than expected but is generally consistent with evidence of the bow and arrow from 2000–3500 cal BP farther north in Oregon and Washington (Ames et al. Reference Ames, Dumond, Galm, Minor and Deward1998, Reference Ames, Fuld and Davis2010; Rorabaugh and Fulkerson Reference Rorabaugh and Fulkerson2015). Likewise, the closest adjacent area to the south (northern Sacramento Valley) also seems to have had relatively early adoption of the bow (1930 cal BP). Farther south along the North Coast Ranges, a later date of 1300 cal BP was obtained. On the east side of the Sierra Nevada Mountains in the Mono county region, the bow was apparently adopted by 1550 cal BP, and then on the western slope of the Sierra at 1130 cal BP. The last regions to adopt the bow and arrow according to this analysis were the Inyo county region (1000 cal BP), followed by the Sacramento-San Joaquin Delta (970 cal BP).
Comparison of obsidian hydration–derived dates for first arrow points (solid vertical bars) to culture-historical periods associated with first arrow points (horizontal boxes). References: (a) Late Archaic period (Delacorte Reference Delacorte1997), (b) Tehama Pattern (Sundahl Reference Sundahl1992), (c) Haiwee period (Bettinger and Taylor Reference Bettinger, Taylor, Elston and Sabini1974), (d) Gunther Pattern (Hildebrandt Reference Hildebrandt, Terry and Kathryn2007), (e) Late Prehistoric 2 period (Hull and Moratto Reference Hull and Moratto1999), (f) Late period I (Bennyhoff and Fredrickson Reference Bennyhoff, Fredrickson and Richard1994).

Map showing calculated years cal BP values and hypothesized spread of the bow and arrow through California.

Results of Changepoint Analyses by Region.

Note: “Lower” and “Upper” are 95% probability quantile values of the posterior distribution as derived by mcp R package.
Discussion and Conclusions
The traditional view among California archaeologists was that the bow was adopted fairly rapidly about 1,500 years ago throughout the state (Elsasser Reference Elsasser and Heizer1978; Moratto Reference Moratto1984). However, archaeological attention paid to projectile points was largely concerned with their value as time-sensitive artifacts, and in that role, they were largely overshadowed by other artifacts, such as shell beads (Bennyhoff and Hughes Reference Bennyhoff and Hughes1987). Even after the 1970s, when more ecological and technological interpretations of the California record were being pursued, the arrival of the bow and arrow was still largely framed in terms of culture-historical periods borrowed from previous decades, often obscuring more subtle geographical patterns.
More recently, studies have attempted to synthesize available information on the arrival of the bow through artifact cross dating, obsidian hydration, and relevant radiocarbon dates, suggesting that the adoption was not simultaneous across all regions (Groza et al. Reference Groza, Rosenthal, Southon and Milliken2011; Kennett et al. Reference Kennett, Lambert, Johnson and Culleton2013; Rosenthal Reference Rosenthal2021). The earliest arrow points are documented in northeastern California between 1900 and 1300 cal BP (Delacorte Reference Delacorte1997; Hildebrandt and King Reference Hildebrandt, King and Kelly2002; Hughes Reference Hughes1986; McGuire Reference McGuire, Terry and Kathryn2007), with the adjacent northern Sacramento Valley area similarly showing relatively early arrows at 1900 cal BP but possibly as late as 1350 cal BP (Basgall and Hildebrandt Reference Basgall and Hildebrandt1989; Delacorte and Basgall Reference Delacorte and Basgall2006; Sundahl Reference Sundahl1992). The eastern Sierra shows evidence of the bow’s arrival between 1500 and 1300 cal BP (Basgall and Delacorte Reference Basgall and Delacorte2012; Bettinger and Taylor Reference Bettinger, Taylor, Elston and Sabini1974; Yohe Reference Yohe1998). The bow was thought to have appeared in the western Sierra Nevada around the same time (Bennyhoff Reference Bennyhoff1956; Hull and Moratto Reference Hull and Moratto1999; Moratto et al. Reference Moratto, Tordoff and Shoup1988), but more recent evidence suggests it was several hundred years later (ca. 1100 cal BP; Rosenthal Reference Rosenthal2011). Along the North Coast Ranges, the bow is thought to have arrived around 1450 cal BP (Hildebrandt Reference Hildebrandt, Terry and Kathryn2007), or perhaps closer to 1000 cal BP (Hildebrandt et al. Reference Hildebrandt, Baker, Maniery, Heffner and King2018). Finally, in the Sacramento Delta and San Francisco Bay area, many studies suggest a later arrival (between 975 and 650 cal BP) for the bow (Byrd et al. Reference Byrd, Whitaker, Mikkelsen and Rosenthal2017; Groza et al. Reference Groza, Rosenthal, Southon and Milliken2011; Kennett et al. Reference Kennett, Lambert, Johnson and Culleton2013; Milliken et al. Reference Milliken, Fitzgerald, Hylkema, Groza, Origer, Bieling, Leventhal, Terry and Kathryn2007).
Considering the diversity of data sources, the crudeness of weight as a discriminator of arrow points, and the vagaries of obsidian hydration dating on such a large scale, the first arrow dates obtained by this study generally agree with the above interpretations—although the changepoint dates should be considered estimates based on the assumptions of this study and should take into account the accompanying error ranges. The most significant sources of error likely include EHT calculation, obsidian-hydration rate derivation (Rogers Reference Rogers2010), and the effects of fragmentation on weight estimation (Bettinger and Eerkens Reference Bettinger and Eerkens1999; Hildebrandt and King Reference Hildebrandt and King2012; Thomas Reference Thomas1981). Of the dates obtained for this study, the two most significant anomalies are the earlier-than-expected circa 2700 cal BP date for northeastern California and the later-than- expected circa 1000 cal BP date for the Inyo county region. Other than these possible discrepancies, the dating and the likely sequence of adoption suggested from previous research compare favorably to those obtained by the present study (Figure 5; Table 1). The general trend for the adoption of the bow suggested by this study shows the technology first appearing in northeastern California, traveling from there to the northern Sacramento Valley and western Great Basin, then moving in two fronts—one coastal and the other interior—before finally showing up in the California Delta. These results support previous interpretations that are based on other sources of data and that use other methods of identifying arrow points, and they provide a larger regional view of this important technological transition independent of typology and culture-historical periods.
Importantly, these results suggest that the bow and arrow was not adopted simultaneously throughout California. Considering the geographic and cultural diversity characterizing the state, this is not surprising, given that diverse populations with distinct adaptations would likely have differing incentives related to when and how to adopt this complex technology (Bettinger Reference Bettinger2013, Reference Bettinger2015; Hale Reference Hale2010; Kennett et al. Reference Kennett, Lambert, Johnson and Culleton2013). Although the questions of when the bow was adopted in various parts of the world and its possible effects have been explored by many researchers, it is less clear why certain populations would delay its adoption. Bettinger (Reference Bettinger2013) details the many ways that the bow and arrow is a superior weapon to the atlatl and dart, including greater accuracy, faster rate of fire, and greater stealth. When groups adopted the bow, these advantages may have translated into greater hunting success and changes in social organization (Bettinger Reference Bettinger2013; Bingham et al. Reference Bingham, Souza and Blitz2013), or alternatively, into social complexity and increases in violent conflict (Bingham et al. Reference Bingham, Souza and Blitz2013; Blitz Reference Blitz1988; Kennett et al. Reference Kennett, Lambert, Johnson and Culleton2013), or some combination of these effects. It has been suggested that certain regions of California, such as the Delta, did not initially adopt the bow because of either organizational or environmental incompatibility. If most hunting occurred in group settings such as surround hunts or drive fences, then there would be little opportunity for individual hunters to see an advantage of using the bow. Also, the humid and marshy Delta environment may have made it more difficult to maintain delicate sinew bow components and might not have conferred as much an advantage for waterfowl hunting (Bettinger Reference Bettinger2015; Byrd et al. Reference Byrd, Whitaker, Mikkelsen and Rosenthal2017).
Alternatively, the time at which various groups adopted the bow could also be related to how the bow was used by adjacent groups who had already adopted it. If neighboring populations were largely exploring the subsistence advantages of the new weapon system, then the incentives to switching may not have been as obvious to other groups. The costly process of learning how to manufacture the bow or obtaining bows in trade may have discouraged adoption. If, on the other hand, neighboring groups began actively using the bow as a weapon of war or conquest, the cost-benefit equation would change quickly. If this is true, then early adopters in many regions may have used the bow primarily for hunting first and only later employed it for human conflict, perhaps related to population increases or other drivers of social complexity and violence. Relevant in this regard are the numbers of violent deaths recorded in the Sacramento Valley associated with arrow points dating after circa 1300 cal BP, which were possibly related to a southward expansion of Wintun peoples (Bennyhoff Reference Bennyhoff and Richard1994; Golla Reference Golla, Terry and Klar2007; Moratto Reference Moratto1984:214; Schwitalla et al. Reference Schwitalla, Jones, Pilloud, Codding and Wiberg2014; Sundahl Reference Sundahl1992).
In addition to the timing of the adoption of the bow, the specific shape of each changepoint distribution differs for each region, as do the absolute weights of the points and therefore the magnitude of change between older dart points and younger arrow points (Figure 7). In particular, the Sacramento–San Joaquin Delta region shows the most extreme difference between the weights of pre- and post-arrow points (from >10 g to <5 g). This could be due to the fact that more of the Delta area samples come from burial contexts where projectile points are often larger, carefully made versions for ceremonial reasons or are weapons of war (Beardsley Reference Beardsley1948; Dougherty Reference Dougherty1990; Schenck and Dawson Reference Schenck and Dawson1929). Each region displays a general trend of decreasing point size through time, with steeper decreases around the time when the changepoints were identified, and in all cases, a concentration of lighter points in the lower left quadrant. Figure 7 also clearly shows that large numbers of points are lighter than expected (i.e., <3 g) prior to the advent of the bow and arrow, and that many are heavier than expected after the bow and arrow appears. The “early lightweights” likely reflect point fragments rather than whole points, whereas the “late heavyweights” may include larger forms such as hafted knives or thrusting spears that were retained as part of the hunting tool kit after the bow and arrow was in use. Although earlier dart points may have been large enough to perform several functions (e.g., projectile and knife), later smaller arrow forms may have been specialized projectiles—meaning additional tool types were needed to perform functions previously possible with only dart points. This sort of “bifurcation” of technologies may be a recurring feature accompanying transitions from multifunctional tools to specialized tools over the course of the Holocene (Stevens Reference Stevens, Goodale and Andrefsky2015; Stevens and Codding Reference Stevens and Codding2009; Stevens and McElreath Reference Stevens and McElreath2015). The slight differences in dart versus arrow weights for each region also underscores the point that there is probably no single, universally applicable metric threshold for discriminating darts from arrows. This is because each region of the world had different cultural traditions, had different available materials, and was under different selective pressures (Hughes Reference Hughes1998; Marsh, Yebra, et al. Reference Marsh, Llano, Cortegoso, Castro and Yebra2023).
Changepoint graphs for three regions, north to south: northeastern California, Shasta/Upper Sacramento Valley area, and the Sacramento–San Joaquin Delta area. Note: Solid trendlines are for illustrative purposes only and were not used in changepoint calculations. (Color online).

This study has deliberately concentrated on the historical facts of the bow entering California and only speculated about other important questions about why and how it was adopted. Good arguments have been made by others for both the “bright side” (increased hunting efficiency, larger populations, novel social strategies) and the “dark side” (increased territoriality, interpersonal violence, and warfare) of this powerful tool (Andrushko et al. Reference Andrushko, Schwitalla and Walker2010; Bettinger Reference Bettinger2013, Reference Bettinger2015; Chartkoff and Chartkoff Reference Chartkoff and Chartkoff1984:221; Kennett et al. Reference Kennett, Lambert, Johnson and Culleton2013; Lambert Reference Lambert1993; Schwitalla et al. Reference Schwitalla, Jones, Pilloud, Codding and Wiberg2014). If the temporal and geographical trends shown here are further supported by subsequent work, the task then becomes to identify (1) contexts and behaviors associated with adoption of the bow at different times and different places and (2) the effects of the bow on the populations that adopted it. The fact that this research used a single, simple artifact attribute (weight) and a lower-precision dating method (obsidian hydration) yet still managed to mirror previous findings while at the same time suggesting revisions to the sequence shows (1) the promise of using large regional archaeological datasets in new ways, (2) the viability of obsidian hydration as an absolute dating method, and (3) the general applicability of changepoint analyses to investigate archaeological patterns that may cross-cut culture-historical periods.
Acknowledgments
This article was improved by discussions, data sharing, and suggestions made by Jeanne Binning, Brian Codding, Mike Darcangelo, Jeff Rosenthal, Al Schwitalla, and Adie Whitaker. It was also greatly improved through the suggestions of three anonymous reviewers. The original inspiration for the method came from Rosenthal (Reference Rosenthal2011:Figure 15). Although the various authors, technicians, tribal representatives, and other personnel involved in the many CRM studies scoured for data cannot be individually acknowledged, their work is greatly appreciated. Rachel Davies helped by finding and entering a significant portion of the projectile point data. I would also like to acknowledge Mark Basgall for encouraging my fascination with projectile points specifically and with data generally. No permits were required to complete this analysis, which was based on previously published data. No artificial intelligence (AI) tools were used in the data analysis, production, or writing of this article.
Funding Statement
This research received no specific grant funding from any funding agency or from commercial or not-for-profit sectors.
Data Availability Statement
All data for reproducing this analysis are available in Supplementary Material 2.
Competing Interests
The author declares none.
Supplementary Material
The supplementary material for this article can be found at https://doi.org/10.1017/aaq.2025.10118.
Supplementary Material 1. Details related to point sample, obsidian hydration dating, and R code (text).
Supplementary Material 2. Calculated dates and weights of sampled projectile points (dataset); https://doi.org/10.5281/zenodo.15758322.


 Open access