



Introduction
Parasites thrive to the expense of other organisms and are usually part of intricate ecological webs. The presence of high parasite diversity is considered a reliable indicator of good environmental quality because of the ecological equilibrium presumed for host–parasite relationships (Marcogliese, Reference Marcogliese2005). Consequently, understanding the dynamics of host–parasite interactions has been a major aim in evolutionary ecology, and studies at the community scale are needed if we want to understand the influence that hosts and parasites diversity have on each other (Vázquez et al., Reference Vázquez, Poulin, Krasnov and Shenbrot2005, Reference Vázquez, Melián, Williams, Blüthgen, Krasnov and Poulin2007).
The Western Mediterranean is a biodiversity hot spot of both hosts and parasites, and reptiles constitute a good model of the complexity involved in such interactions (Molina-Venegas et al., Reference Molina-Venegas, Aparicio, Lavergne and Arroyo2015; Megía-Palma et al., Reference Megía-Palma, Martínez, Cuervo, Belliure, Jiménez-Robles, Gomes, Cabido, Pausas, Fitze, Martín and Merino2018a). Multiple factors influence the outcome of the interaction, one is stress, and sources of stress for hosts can be either environmental or intrinsic. For example, individuals subjected to stressful environments can reallocate energy to body functions other than immune defence to cope with stress (Adamo et al., Reference Adamo, Easy, Kovalko, MacDonald, McKeen, Swanburg, Turnbull and Reeve2017). This may increase their susceptibility to parasitic infections (Oppliger et al., Reference Oppliger, Clobert, Lecomte, Lorenzon, Boudjemadi and John-Alder1998). Thus, variation in parasite abundance in correlation with environmental gradients of stress can be interpreted as biomarkers of environmental costs on the hosts’ immune defences (Megía-Palma et al., Reference Megía-Palma, Arregui, Pozo, Žagar, Serén, Carretero and Merino2020a). Besides spatial covariation with environmental stress, the abundance of parasites may vary locally with phenology (e.g. McDevitt-Galles et al., Reference McDevitt-Galles, Moss, Calhoun and Johnson2020). However, temporal dynamics of parasite abundance have scarcely been studied in particular hosts such as reptiles (Schall and Marghoob, Reference Schall and Marghoob1995).
In the last two decades, parasitologists have been unveiling the diversity of parasites infecting Mediterranean lizards (Galdón et al., Reference Galdón, Roca, Barbosa and Carretero2006; Maia et al., Reference Maia, Harris and Perera2011, Reference Maia, Perera and Harris2012; Megía-Palma et al., Reference Megía-Palma, Martínez and Merino2014, Reference Megía-Palma, Martínez, Cuervo, Belliure, Jiménez-Robles, Gomes, Cabido, Pausas, Fitze, Martín and Merino2018a). Blood parasites that infect lizards of this region cluster in two distinct phylogenetic groups. The most common are haemogregarines (Roca and Galdón, Reference Roca and Galdón2010; Maia et al., Reference Maia, Harris, Carranza and Gómez-Díaz2014; Álvarez-Ruiz et al., Reference Álvarez-Ruiz, Megía-Palma, Reguera, Ruiz, Zamora-Camacho, Figuerola and Moreno-Rueda2018; Megía-Palma et al., Reference Megía-Palma, Jiménez-Robles, Hernández-Agüero and De la Riva2020b). They are transmitted by haematophagous mites of the genus Ophionyssus (Reichenow, Reference Reichenow1919; Svahn, Reference Svahn1975; Haklová-Kočíková et al., Reference Haklová-Kočíková, Hižňanová, Majláth, Račka, Harris, Földvári, Tryjanowski, Kokošová, Malčeková and Majláthová2014), and the potential drivers governing their prevalence and intensity are only starting to be understood (Álvarez-Ruiz et al., Reference Álvarez-Ruiz, Megía-Palma, Reguera, Ruiz, Zamora-Camacho, Figuerola and Moreno-Rueda2018; Megía-Palma et al., Reference Megía-Palma, Arregui, Pozo, Žagar, Serén, Carretero and Merino2020a).
A second and less common group of blood parasites of lizards in the Mediterranean region are haemococcidians, which are highly host-specific (Megía-Palma et al., Reference Megía-Palma, Martínez, Cuervo, Belliure, Jiménez-Robles, Gomes, Cabido, Pausas, Fitze, Martín and Merino2018a). However, the factors governing their prevalence and distribution are even less understood compared to haemogregarines. The haemococcidian genera Schellackia spp. and Lankesterella spp. (order Eimeriida) infect Iberian lizards (Maia et al., Reference Maia, Harris, Carranza and Gómez-Díaz2014; Megía-Palma et al., Reference Megía-Palma, Martínez and Merino2014, Reference Megía-Palma, Martínez, Cuervo, Belliure, Jiménez-Robles, Gomes, Cabido, Pausas, Fitze, Martín and Merino2018a). Parasites of the former genus undergo several replication cycles of sexual and asexual reproduction in lizard hosts, whereas in the gut of haematophagous mites the parasite only becomes dormant (Telford, Reference Telford2009). The cycle of Lankesterella spp. in the Mediterranean is unknown, but dipteran and acarine arthropods are competent vectors of American lankesterellids (Megía-Palma et al., Reference Megía-Palma, Martínez, Paranjpe, D'Amico, Aguilar, Palacios, Cooper, Ferri-Yáñez, Sinervo and Merino2017). Hematic stages (i.e. sporozoites) of Schellackia spp. and Lankesterella spp. in Iberian lizards are morphologically distinguished by the differential number of refractile structures in the cytoplasm; Schellackia spp. shows one refractile body, while sporozoites of Lankesterella spp. show two (Megía-Palma et al., Reference Megía-Palma, Martínez and Merino2014, Reference Megía-Palma, Martínez, Cuervo, Belliure, Jiménez-Robles, Gomes, Cabido, Pausas, Fitze, Martín and Merino2018a).
Factors explaining parasite abundances are multiple, and intrinsic and extrinsic predictors, as well as particularities in the life history traits of both hosts and parasites, may interact to shape host–parasite dynamics (Klukowski, Reference Klukowski2004; Illera et al., Reference Illera, López, García-Padilla and Moreno2017; Padilla et al., Reference Padilla, Illera, Gonzalez-Quevedo, Villalba and Richardson2017). For example, previous studies found positive relationships between body size and the abundance of haemogregarine infection in small to medium-sized lizards (Amo et al., Reference Amo, López and Martín2005; Molnár et al., Reference Molnár, Bajer, Mészáros, Török and Herczeg2013; Maia et al., Reference Maia, Harris, Carranza and Gómez-Díaz2014). Those studies used body size as a proxy for age because lizards have indeterminate growth and infection likelihood might increase with age, as older individuals accumulate exposure to parasites over time (e.g. Schall and Marghoob, Reference Schall and Marghoob1995). Sex is usually an important intrinsic factor associated with increased susceptibility to infections (Folstad and Karter, Reference Folstad and Karter1992; Saino et al., Reference Saino, Møller and Bolzerna1995; Alonso-Alvarez et al., Reference Alonso-Alvarez, Bertrand, Faivre, Chastel and Sorci2007). In lizards, although the specific effect of sex on blood parasites remains unclear, there is consensus that sexual hormones increase the susceptibility to ectoparasites (reviewed in Roberts et al., Reference Roberts, Buchanan and Evans2004 but also see Veiga et al., Reference Veiga, Salvador, Merino and Puerta1998). Furthermore, host–parasite dynamics may vary along the lizards’ period of activity, as both environmental abundance of parasites and hosts’ susceptibility to infections may show phenological variation (Klukowski, Reference Klukowski2004; Huyghe et al., Reference Huyghe, Van Oystaeyen, Pasmans, Tadić, Vanhooydonck and Van Damme2010; Megía-Palma et al., Reference Megía-Palma, Paranjpe, Blaimont, Cooper and Sinervo2020c).
As commented, sources of stress are positively associated with haemogregarine abundances in lizards (Oppliger et al., Reference Oppliger, Celerier and Clobert1996, Reference Oppliger, Clobert, Lecomte, Lorenzon, Boudjemadi and John-Alder1998; Megía-Palma et al., Reference Megía-Palma, Arregui, Pozo, Žagar, Serén, Carretero and Merino2020a). One important source of environmental stress in Mediterranean habitats may be an increasing constriction in the availability of favourable thermal microhabitats for lizards due to raising temperatures towards summer (Díaz et al., Reference Díaz, Iraeta and Monasterio2006; Vickers et al., Reference Vickers, Manicom and Schwarzkopf2011). Although lizards in Mediterranean environments may acclimate to increasing temperatures by accommodation of their thermal preferences (Díaz et al., Reference Díaz, Iraeta and Monasterio2006; Megía-Palma et al., Reference Megía-Palma, Paranjpe, Blaimont, Cooper and Sinervo2020c), this thermo-physiological shift might have costs on lizards (Vickers et al., Reference Vickers, Manicom and Schwarzkopf2011). Thermal restrictions have immunosuppressant effects on lizards (Han et al., Reference Han, Hao, Wang, Wang, Teng, Liu, Zhang and Zhang2020), with gravid females demonstrating higher thermal sensitivity influenced by an additive effect of dehydration (Dupoué et al., Reference Dupoué, Blaimont, Rozen-Rechels, Richard, Meylan, Clobert, Miles, Martin, Decencière, Agostini and Le Galliard2020; Megía-Palma et al., Reference Megía-Palma, Arregui, Pozo, Žagar, Serén, Carretero and Merino2020a). Stressed lizards, by this or other reasons, exhibit a lower ability to heal cutaneous wounds or a reduced immune response (Lucas and French, Reference Lucas and French2012; Sprayberry et al., Reference Sprayberry, Tylan, Owen, Macleod, Sheriff and Langkilde2019; Han et al., Reference Han, Hao, Wang, Wang, Teng, Liu, Zhang and Zhang2020). Thus, parasitic transmission and/or replication of some parasites may be facilitated in immunosuppressed lizards (e.g. Salvador et al., Reference Belliure, Carrascal and Diaz1996; Megía-Palma et al., Reference Megía-Palma, Arregui, Pozo, Žagar, Serén, Carretero and Merino2020a). Intra or interspecific (social) interactions may also be an important source of environmental stress, with potential influence on lizards’ susceptibility to infections (Mugabo et al., Reference Mugabo, Perret, Decencière, Meylan and Le Galliard2015). Indeed, Oppliger et al. (Reference Oppliger, Clobert, Lecomte, Lorenzon, Boudjemadi and John-Alder1998) experimentally demonstrated that the increase in the intensities of haematic parasites in Zootoca (=Lacerta) vivipara (Lichtenstein, 1823) reflected stress, being higher in environments with higher predation pressure and intraspecific competition associated with increased release of glucocorticoids. Similarly, Carbayo et al. (Reference Carbayo, Martín and Civantos2019) found that the Algerian sand racer, Psammodromus algirus, has more blood parasites in poor quality habitats where lizards also had worse body condition.
The aim of this study was to investigate the phenological host–parasite dynamics in a community of Mediterranean lizards during a one-year period of lizard activity (May–October; the rest of the year they hibernate and remain inactive in burrows). The selected hosts were three co-habiting lizard species that provide a range of sizes, ecological requirements and life history traits: Acanthodactylus erythrurus (Schinz, 1834), P. algirus (Linnaeus, 1758) and Psammodromus edwardsianus (P. hispanicus) (Dugès, 1829). The three species differ in their habitat preference, with A. erythrurus preferring more open habitats with sandy substrate, while both Psammodromus species prefer higher vegetation cover provided by forests with dense undergrowths and leaf litter (Escarré and Vericad, Reference Escarré and Vericad1981; Arnold, Reference Arnold1987; Díaz and Carrascal, Reference Díaz and Carrascal1991). Despite all three lizard species being insectivorous, they also present certain dietary differences: A. erythrurus is known to show a marked preference for ants (Pollo and Pérez-Mellado, Reference Pollo and Pérez-Mellado1991), P. algirus shows the greater variety of insects in the diet (Salvador, Reference Salvador, Salvador and Marco2015), and P. edwardsianus consumes mainly small and hard prey like Coleoptera or Hemiptera (Fitze, Reference Fitze, Salvador and Marco2012). Acanthodactylus erythrurus is the biggest [up to 8 cm snout-vent length (SVL)] and most thermophilic species of the three (Belliure et al., Reference Belliure, Carrascal and Diaz1996; Verwaijen and Van Damme, Reference Verwaijen and Van Damme2007). Although little is known about the exact life span of the species in the wild, the results of several studies allow to order the species from shorter to longer expected life span (Carretero and Llórente, Reference Carretero and Llórente1991; Drechsler and Monrós, Reference Drechsler and Monrós2019; Comas et al., Reference Comas, Reguera, Zamora-Camacho and Moreno-Rueda2020). Following this statement, A. erythurus has an intermediate life span, which is not known in detail, but the results in Drechsler and Monrós (Reference Drechsler and Monrós2019), with 80% yearly renewal indicate that it seems to be around two years for most individuals in this population. For P. algirus, some studies describe interannual survival rates of 25% for juveniles and 35% for adults (Salvador, Reference Salvador, Salvador and Marco2015), indicating that the species has the longest life span, as an important part of individuals survive more than 2 years. Finally, P. edwardsianus is the smallest (maximum SVL of 5–6 cm) and has the shortest life span (with a near 100% renewal of the population every year; Fitze, Reference Fitze, Salvador and Marco2012).
Significant predictors of the prevalence and abundances of haematophagous mites and blood parasites were analysed in the three lizard species at two contrasting habitats where they coexist. Based on differences in their life history strategies, we predict that environmental variables will affect differently host–parasite dynamics in the three lizard species. We also predict that females of the less thermophilic species, P. edwarsianus and P. algirus, will have a higher parasite load during the warmer period, which coincides with the critical period of clutch development (Carretero, Reference Carretero, Corti, Lo Cascio and Biaggini2006; Dupoué et al., Reference Dupoué, Blaimont, Rozen-Rechels, Richard, Meylan, Clobert, Miles, Martin, Decencière, Agostini and Le Galliard2020). Furthermore, we will also test whether lizard species of intermediate longevity will have intermediate abundances of infection. The latter hypothesis will be supported if the abundance of parasites in P. edwardsianus < A. erythrurus < P. algirus, according to differences in their life span expectancy.
Material and methods
Study area
The study area is situated in East Spain, about 10 km South from Valencia City and is part of the Albufera de Valencia Natural Park (39°20′20″N 0°18′43″W). It is a coastal line of sandy substrate about 10 km long (N-S) and 1 km wide (E-W) in the Western coast of the Mediterranean Sea, with a gradient of vegetation cover increasing from the coastal sand dune area to the inland pine forest (Ibor and Matarredona, Reference Ibor and Matarredona2016).
Lizards were captured in both dune and forest habitats. The ‘dunes’ are characterized by bare sand sparsely covered by herbaceous and bush species of plants, providing low heterogeneity of thermal microhabitats. The preponderant height of plants in this habitat is less than 1 m (Ammophila arenaria, Helichrysum stoechas, Euphorbia paralias, Medicago marina and Rhamnus alaternus, among others). The ‘forest’ substrates are fixed sand dunes dominated by Aleppo pines (Pinus halepensis) and a dense undergrowth vegetation (Smilax aspera, Asparagus officinalis, Chamaerops humilis and Pistacia lentiscus, among others) that provide more heterogeneity of thermal microhabitats.
Fieldwork
Field sampling was carried out in 2017 between May and October, to cover a one-year period of activity of the three species of lizards at the area. Lizard counting and capturing was performed by one researcher (RD) twice per week in each habitat type (alternating sampling areas), by randomly walking the area for two hours beginning about three hours after sunrise. Random walks were used instead of fixed transects because (i) this allowed to avoid the repeated handling effect and double counting, changing the trajectory each day; and (ii) it was more suitable, especially in the forest habitat, given the dense undergrowth vegetation which often blocked the way. Days with suboptimal meteorological conditions for lizard activity (rain, strong wind, important cloud coverage, etc.) were not sampled. Lizards were captured by hand or noosing (e.g. Guillén-Salazar et al., Reference Guillén-Salazar, Font and Desfilis2007), and put in individual cloth bags until processing. All individuals were measured (SVL) using a ruler, to the nearest 1 mm, and weighed using a digital scale, with a precision of 0.01 g, and species and sex were identified. In the case of females, the gravidity status was assessed by palpation. Finally, the number of visible ectoparasites on each individual was counted, blood samples were obtained from toe-clipping and smeared on a microscope slide. Resampling the lizards was avoided by assigning them a unique code by toe-clipping (Bellairs and Bryant, Reference Bellairs and Bryant1968; Perry et al., Reference Perry, Wallace, Perry, Curzer and Muhlberger2011; Barrientos and Megía-Palma, Reference Barrientos and Megía-Palma2021). The lizards were released near the corresponding capture point.
Blood sample processing
Blood smears were fixed with 100% methanol and stained them with 1:10 solution of Giemsa for 40 min. The blood smears were screened at ×1000 magnification in a light microscope (CX41, Olympus, Tokyo, Japan). Blood parasites were counted in 5000 blood cells (Megía-Palma et al., Reference Megía-Palma, Martínez and Merino2016). The genera of parasites found were identified by morphological characters (Megía-Palma et al., Reference Megía-Palma, Martínez and Merino2014, Reference Megía-Palma, Martínez, Cuervo, Belliure, Jiménez-Robles, Gomes, Cabido, Pausas, Fitze, Martín and Merino2018a; Álvarez-Ruiz et al., Reference Álvarez-Ruiz, Megía-Palma, Reguera, Ruiz, Zamora-Camacho, Figuerola and Moreno-Rueda2018). Particularly, the presence and the number of refractile bodies were key diagnostic characteristics (i.e. Megía-Palma et al., Reference Megía-Palma, Martínez and Merino2014) (Fig. S1).
Data analysis
The daily abundance of lizards was standardized dividing the number of observed lizards of each species per day by the duration of the census (obtaining values in individuals/hour). For the statistical analysis, recaptures and individuals with incomplete datasets were not included. The differences in lizard abundance were analysed fitting a Generalized Linear Model (GLM) with γ error distribution with a log linking function, considering species, habitat, month and the triple interaction species × habitat × month as predictor variables, computing the results by a type II ANOVA.
Given the sexually asynchronous cycles in fat body development in Mediterranean lizards (Carretero, Reference Carretero, Corti, Lo Cascio and Biaggini2006), a body condition index (i.e. BCI) was calculated as the residuals of the relation between both log10-transformed SVL and body mass (e.g. Drechsler et al., Reference Drechsler, Vera, Martínez and Monros2020). This was done separately for each sex and species to remove confounding effects (Álvarez-Ruiz et al., Reference Álvarez-Ruiz, Megía-Palma, Reguera, Ruiz, Zamora-Camacho, Figuerola and Moreno-Rueda2018; Megía-Palma et al., Reference Megía-Palma, Arregui, Pozo, Žagar, Serén, Carretero and Merino2020a). The differences in body condition between habitat types were analysed performing an ANOVA for each species separately, considering the interaction with sex. In the case of A. erythrurus, the age of each individual was also estimated, following Drechsler and Monrós (Reference Drechsler and Monrós2019). In brief, the regression formula of the growth curve was applied for each sex and a delay in growth due to hibernation was considered, when necessary.
Abundance of each parasite species was analysed considering the number of parasites per host (Rózsa et al., Reference Rózsa, Reiczigel and Majoros2000). Given the high proportion of uninfected lizards in the sample, fitting a model to the data that fulfilled the parametric assumptions of residual normality and homoscedasticity was not possible. Nor negative binomial, zero-inflated models or log10-transformation of the data improved the residual distribution of the model. Thus, a robust estimate GLM (GLM-rob) (Cantoni and Ronchetti, Reference Cantoni and Ronchetti2001) with Poisson error distribution linked to a log linking function was implemented, through the ‘glmrob’ function of the ‘robustbase’ package. The prevalence of each parasite species was analysed by fitting the percentage of infested individuals to a GLM with binomial error distribution and logit link function, the results were computed by a type II ANOVA.
The following predictors for parasite abundance and prevalence were considered: host species, habitat type, climate, month, sex, SVL, body condition and interactions of species with habitat, SVL, sex, month and month with sex. Mite abundance was considered in the case of blood parasites, and gravidity was tested in the case of females. Finally, a Spearman correlation test was carried out to test if the infection parameters (prevalence, mean and median intensity) were correlated to climatic variables (monthly mean temperature, mean maximum and minimum temperatures, and accumulated precipitation), which were obtained from a meteorological station situated less than 10 km from the study area (Racó de l'Olla; https://www.avamet.org/mx-mes.php?id=c15m250e27). In this analysis, intensity (considering only infected lizards) was used instead of abundance (i.e. infected and uninfected lizards considered) (sensu Rózsa et al., Reference Rózsa, Reiczigel and Majoros2000) for three reasons: (i) this allowed us to analyse the effect of climatic fluctuations strictly on the host–parasite relationship, as uninfected lizards lack parasites; (ii) the high proportion of uninfected lizards would bias the results; and (iii) this analysis is unifactorial, allowing to use a smaller sample size than the multifactorial approach of previous analyses. Psammodromus edwardsianus was excluded in all analysis of blood parasites, as only one lizard was infected. All the statistical analyses were ran using the statistics software R v4.0.3 (R Core Team, 2020).
Results
The dataset included 256 individuals (157 A. erythrurus, 51 P. algirus and 48 P. edwardsianus). The abundances of all lizard species were significantly higher in the forest (Table S1); a constant effect observed across the activity period (Fig. S2). Body condition did not differ between habitats for the three species (F 12,104 = 1.058, P = 0.340; Table 1).
Mean ± s.e. of lizard body condition (×100) of each species in both considered habitat types, with the corresponding sample size (n, in lizards) and the results of the statistical analysis in each case

Parasite prevalence
Mites were more prevalent than blood parasites in the three host species (Table 2). Month and sex significantly explained the prevalence of mites (Table 3), while month differently affected the host species (Fig. 1), the effect of sex was consistently higher in males (59.9%) than females (52.5%) through all host species. The relationship between the prevalence of mites and the SVL of the lizards was significantly different among host species (Table 3), being mites present in smaller body sizes in P. edwardsianus than in the other two species (Fig. 2).
Representation of the seasonal variation of infection parameters of each parasite (A: mites, B: Lankesterella spp. and C: Schellackia spp.) and each host species: A. erythrurus (solid line), P. algirus (dotted line) and P. edwardsianus (dashed line). From left to right: the prevalence, expressed as a percentage of infected individuals; the comparison between species of mean ± s.e. of infection abundance and the comparison between males (black) and females (gray) of mean ± s.e. infection abundance.

Distribution of infected individuals among the snout-vent length (SVL) range of each host species: mites (A), Lankesterella spp. (B), and Schellackia spp. (C).

Mean ± s.e. infection abundance of each parasite and prevalence (in brackets) for each host species

Results of the general linear models for the parasite prevalence of the different parasites: residual deviance (Dev), residual degrees of freedom (d.f.) and F and P statistics

Significant results (P < 0.05) are shown in bold.
None haemogregarine blood parasites were found in the study, but two genera of haemococcidians: Lankesterella spp. and Schellackia spp. (Fig. S1). Blood parasites of the genus Lankesterella spp. were found almost exclusively infecting A. erythrurus (35 out of the 37 lizards infected; Table 2). Significant effects were detected of species and SVL (the correlation was positive and consistent through species) on the prevalence of Lankesterella spp. (Table 3, Fig. 2). The interactions of species with habitat type and species with month were also significant (Table 3). The prevalence of Lankesterella spp. in A. erythrurus was higher in the forest (29.4%) than in the dunes (16.9%). None P. algirus was infected by Lankesterella spp. in the forest and the prevalence in the dunes was 6.9%. The maximum prevalence of Lankesterella spp. in A. erythrurus was in August. However, no P. algirus was found infected in this month (Fig. 1).
Mean ± SE of the abundance of mites (A), Lankesterella spp. (B) and Schellackia spp. (C) in both habitats for each host species: A. erythrurus (black), P. algirus (dark grey) and P. edwardsianus (light grey). Significant differences between habitats are indicated by asteriscs.

Schellackia spp. was the main blood parasite found in P. algirus (12 out of the 20 lizards infected), but it also infected the other two lizard species (7 out of 20 A. erythrurus; 1 out of 20 P. edwardsianus; Table 2). The interaction between species and habitat significantly explained prevalence (Table 3). The same pattern as in the case of Lankesterella spp. could be observed; the prevalence of Schellackia spp. in A. erythrurus was higher in the forest habitat (8.8%) than in the dunes (1.1%), while in P. algirus, the prevalence of this parasite was higher in the dunes (27.6%) than in the forest (18.2%).
Mites infested all ranges of body sizes of the three lizard species. Blood parasites were only found in individuals older than ~300 days in the case of A. erythrurus (Table S2), while they did infect a very small (i.e. young, SVL = 39 mm) individual of P. algirus. In the case of P. edwardsianus, only one individual was infected by blood parasites.
Parasite abundance
Nearly all predictors significantly explained mite abundance (Table 4). In A. erythrurus, mites were more abundant in the forest than in the dunes; in P. algirus, it was the opposite; and in P. edwardsinaus, the mite abundances were similar between habitats (Fig. 4). Males of A. erythrurus had higher infestation rates by mites [4.9 ± 0.71 (s.e.)] than females [2.94 ± 0.97], but females were more intensely infested in both species of the genus Psammodromus: males 1.30 ± 0.46 (in P. algirus) and 2.39 ± 0.53 (in P. edwardsianus) and females 1.57 ± 0.47 (in P. algirus) and 5.40 ± 2.13 (in P. edwardsianus). In all host species, mites were more abundant in spring and early summer, with a higher peak in P. edwardsianus (Table 4, Fig. 1). The SVL showed a positive correlation with mite infestation in all species, especially in P. edwardsianus (Fig. 4). However, it was only significant for A. erythrurus (Spearman correlation test, rho = 0.368, P < 0.001 for A. erythrurus; rho = 0.011, P = 0.938 for P. algirus; and rho = 0.252, P = 0.085 for P. edwardsianus). The phenology of mite infestation did not differ significantly between sexes, males presenting slightly higher mite abundances in June (Table 4, Fig. 1). All the interactions of the predictors with species significantly explained mite abundance (Table 4).
Robust estimates of parasite abundance for the different parasites: estimate (E st), standard error (s.e.) and z and P statistics

Significant results (P < 0.05) are shown in bold.
Habitat type, sex, body condition, mite abundance and the interaction of species with SVL significantly explained the abundance of Lankesterella spp. (Table 4). Lankesterella spp. was more abundant in the forest than in the dunes (Fig. 3). The abundance of Lankesterella spp. showed a negative relationship with body condition (Table 4). Similarly, there was a negative relationship between the abundances of mites and Lankesterella spp. (Table 4). Furthermore, the correlation with SVL was positive in both host species, but this was stronger in A. erythrurus (Fig. 4). Both sexes of the two host species presented an abundance peak of Lankesterella spp. in August, which was higher in females. Females presented higher abundances of Lankesterella spp. overall (Fig. 1).
Correlation of parasite abundance (A: mites, B: Lankesterella spp. and C: Schellackia spp.) with snout-vent length (SVL) for each host species: A. erythrurus (black), P. algirus (dark grey) and P. edwardsianus (light grey). Line of best fit included to show relationship.

The interaction between habitat type and species significantly explained the abundance of Schellackia spp. (Table 4). The infection abundance of Schellackia spp. in A. erythrurus was low in both habitats (Fig. 3). In P. algirus, the abundance of Schellackia spp. in the forest was considerably higher than that of A. erythrurus in the same habitat, and also significantly higher than for P. algirus in the dunes (Fig. 3, Table 2).
Gravidity of females and parasites
Gravidity of females did not have a significant effect on the prevalence of mites and blood parasites of any of the three studied species (Table 5). Abundance of mites and blood parasites was not affected by gravidity in the case of A. erythrurus, while gravid females of P. algirus and P. edwardsianus showed higher abundances of mites than non-gravid females of the same species (Table 5).
Robust estimates and general linear models showing the effect of host gravidity status on parasite abundance and prevalence: estimate (E st), standard error (s.e.), residual deviance (Dev), residual degrees of freedom (d.f.) and z, F and P statistics

Significant results (P > 0.05) are highlighted in bold.
Climatic variables and parasites
Environmental temperature, but not precipitation, positively correlated with the infection parameters analysed (Tables S3 and S4). This relationship was generally stronger in females than in males (Tables S3 and S4). In the males of the three host lizards, the mean and median infection intensity of Schellackia spp. (i.e. considering only infected individuals sensu Rózsa et al., Reference Rózsa, Reiczigel and Majoros2000) were positively correlated with all the temperature parameters calculated. In females of A. erythrurus and P. algirus, the mean environmental temperature was positively correlated with the prevalence and the mean intensities of Lankesterella spp. and Schellackia spp., respectively. In females of P. algirus, the mean maximum temperature was positively correlated with the prevalence and intensity of Schellackia spp. (Table S4). In addition, the mean minimum temperature was positively correlated with the prevalence of Schellackia spp. in P. algirus.
Discussion
The results show that coexisting lizard species neither share the same parasites nor a common host–parasite dynamics pattern. In the case of blood parasites, the species P. edwardsianus showed a nearly null affection. The genus Lankesterella spp. infected almost exclusively A. erythrurus, while the genus Schellackia spp. infected the three lizard species studied. Lankesterella spp. was previously reported infecting A. erythrurus (Megía-Palma et al., Reference Megía-Palma, Martínez and Merino2014), and consistently with our results, it rarely infects other lizards in the Iberian Peninsula (Maia et al., Reference Maia, Harris, Carranza and Gómez-Díaz2014).
The almost null prevalence of blood parasites found in P. edwardsianus provided only partial support for the hypothesis that connects age with time of exposure to infection (Maia et al., Reference Maia, Harris, Carranza and Gómez-Díaz2014). Nonetheless, the presence of Schellackia spp. in P. edwardsianus represents the first infection record for lizards of this species. The more frequent infection of A. erythrurus, which has an intermediate life span as compared to the two species of Psammodromus, supports host–parasite compatibility as the stronger explanation (or partial explanation) for infection patterns in this lizard community (e.g. Megía-Palma et al., Reference Megía-Palma, Martínez, Cuervo, Belliure, Jiménez-Robles, Gomes, Cabido, Pausas, Fitze, Martín and Merino2018a).
Body size and age are closely related traits in lizards (e.g. Olsson and Shine, Reference Olsson and Shine1996). However, Watkins and Blouin-Demers (Reference Watkins and Blouin-Demers2019) found that body size, but not age indirectly estimated by skeletochronology, predicted mite load in Sceloporus clarkii. In our study, A. erythrurus was infected by blood parasites only in individuals with an estimated age older than 300 days. Interestingly, 300 days is the age when the lizards reach sexual maturity (Drechsler and Monrós, Reference Drechsler and Monrós2019). This suggests that the likelihood of acquiring this infection increases at maturation. A potential explanation is that, at maturity, the energy budget initially allocated to immunity is reallocated to reproduction (e.g. French et al., Reference French, DeNardo and Moore2007; Huyghe et al., Reference Huyghe, Van Oystaeyen, Pasmans, Tadić, Vanhooydonck and Van Damme2010). However, hormonal levels alone, also associated with sexual maturity, may not be determinant of blood parasite infection because sex, and gravidity status, had no significant effects on the prevalence or the abundance of this parasite. This result contrasts with New World Lankesterella occidentalis, which was almost exclusively infecting males of Sceloporus occidentalis (Megía-Palma et al., Reference Megía-Palma, Paranjpe, Reguera, Martínez, Cooper, Blaimont, Merino and Sinervo2018b). Body length was a significant predictor of mites and Lankesterella spp., while body condition was negatively correlated with the abundance of Lankesterella spp., indicating that longer but thinner lizards are often infected by this parasite. However, without an experimental approach, we cannot distinguish between potential negative effects of Lankesterella spp. on the body condition of A. erythrurus, or that weaker lizards were more susceptible to the infection.
Mites are the potential transmitters of Lankesterella spp. (e.g. Lainson, Reference Lainson1960), but the fact that mites were found infesting lizards at younger states of the host (the age of youngest infested lizard was estimated in 22 days) than blood parasites, suggests that vectors other than mites might transmit Lankesterella spp. to lizards in the studied area. Supporting this hypothesis, lizards captured in the forest held mites and Lankesterella spp. opposing abundances in the case of P. algirus, although the abundances of mites and Lankesterella spp. were both higher in this habitat for A. erythrurus. Thus, potential vectors of Lankesterella spp., such as sand flies (Diptera: Psychodidae; Telford, Reference Telford2009), could find more heterogeneity of available microhabitats to thrive in the forest (Neal et al., Reference Neal, Ross, Schall and Vardo-Zalik2016; Megía-Palma et al., Reference Megía-Palma, Martínez, Paranjpe, D'Amico, Aguilar, Palacios, Cooper, Ferri-Yáñez, Sinervo and Merino2017). Beside sand flies, other haematophagous dipterans feeding on lizards exist in the Mediterranean region, and thus, are potential vectors of haemococcidians. A previous meta-barcoding analysed the presence of reptile DNA in blood meals of mosquitoes and found Culex hortensis and Culex pipiens (Diptera: Culicidae) feeding on the lizards Podarcis muralis and Lacerta sp. (Martínez-de la Puente et al., Reference Martínez-De la Puente, Muñoz, Capelli, Montarsi, Soriguer, Arnoldi, Rizzoli and Figuerola2015). Culex pipiens more commonly feeds on humans and other mammals, and is widely present in the Albufera de Valencia; C. hortensis is more specialized in reptiles (Martínez-de la Puente et al., Reference Martínez-De la Puente, Muñoz, Capelli, Montarsi, Soriguer, Arnoldi, Rizzoli and Figuerola2015). An analysis of their vectorial competence to transmit blood parasites to lizards would be illuminating.
The absence of haemogregarines (e.g. genera Hepatozoon or Karyolysus) in the studied area despite these being common parasites of lizards (Haklová-Kočíková et al., Reference Haklová-Kočíková, Hižňanová, Majláth, Račka, Harris, Földvári, Tryjanowski, Kokošová, Malčeková and Majláthová2014; Megía-Palma et al., Reference Megía-Palma, Arregui, Pozo, Žagar, Serén, Carretero and Merino2020a, Reference Megía-Palma, Jiménez-Robles, Hernández-Agüero and De la Riva2020b), including P. algirus (Álvarez-Ruiz et al., Reference Álvarez-Ruiz, Megía-Palma, Reguera, Ruiz, Zamora-Camacho, Figuerola and Moreno-Rueda2018) suggests that environmental conditions in the Albufera de Valencia favour the transmission of haemococcidians, but, for some reason, not other common parasites of lizards. This highlights questions on vectorial competence as well as vector diversity (O'Donoghue, Reference O'Donoghue2017). For example, the significant difference in seasonal variation in mite abundance across lizard species suggested that the susceptibility to the infestation by mites is host-specific. In this sense, the spatial segregation of the three lizard species in this ecosystem might influence their susceptibility to the acquisition of questing mites (e.g. Toyama et al., Reference Toyama, Florián, Ruiz, Gonzáles and Gianoli2019). Our results are consistent with previous studies in bird communities, where difference in life history traits of hosts rather than nest composition (i.e. environment) was proposed as an explanation to the observed differences in the abundance of haematophagous mites between host species (Moreno et al., Reference Moreno, Merino, Lobato, Ruiz-De-Castañeda, Martínez-De La Puente, Del Cerro and Rivero-De Aguilar2009; Cantarero et al., Reference Cantarero, López-Arrabé, Rodríguez-García, González-Braojos, Redondo and Moreno2013; Arce et al., Reference Arce, Manzoli, Saravia-Pietropaolo, Quiroga, Antoniazzi, Lareschi and Beldomenico2018). However, at this stage, we cannot rule out that the observed significant difference in mite phenology on the different hosts investigated could also reflect that different species of mites infest different host species in this lizard community. We recommend future research in the Albufera de Valencia directed to identify the haematophagous mites on the lizards and, eventually, the description of likely new mite taxa that increased the biodiversity value of this singular ecosystem.
The forest habitat, where Lankesterella spp. was more abundant, presented higher abundances of lizards as well, especially P. algirus. This might be explained by an increased transmission favoured by host density (e.g. Lloyd-Smith et al., Reference Lloyd-Smith, Cross, Briggs, Daugherty, Getz, Latto, Sanchez, Smith and Swei2005) and/or a higher degree of intra- and interspecific social interactions increasing stress levels in lizards, which might negatively affect their anti-parasitic defences (May and Anderson, Reference May and Anderson1979; Oppliger et al., Reference Oppliger, Clobert, Lecomte, Lorenzon, Boudjemadi and John-Alder1998; Downes and Bauwens, Reference Downes and Bauwens2002). The negative effects of crowded populations on lizards can be contingent on the habitat quality and resource availability (Oppliger et al., Reference Oppliger, Clobert, Lecomte, Lorenzon, Boudjemadi and John-Alder1998). In this sense, the higher proportion of individuals with broken or regenerated tails (Table S4) suggested a higher competition in the forest, where lizards were more abundant (Itescu et al., Reference Itescu, Schwarz, Meiri and Pafilis2017). Our data suggest that haemococcidians, similarly to haemogregarines, can be also biomarkers of competitive stress in lizards because Schellackia spp. was more abundant in P. algirus captured in the habitat with the higher abundance of lizards and these had a higher proportion of broken tails (Table S4) (Oppliger et al., Reference Oppliger, Clobert, Lecomte, Lorenzon, Boudjemadi and John-Alder1998; Lazić et al., Reference Lazić, Carretero, Živković and Crnobrnja-Isailović2017; Megía-Palma et al., Reference Megía-Palma, Arregui, Pozo, Žagar, Serén, Carretero and Merino2020a). However, this result needs to be taken cautiously, as an increased proportion of broken tails could also mirror a higher predator abundance, which is another source of stress. Further research to clarify this point is needed.
Previous studies reported higher abundances of mites in male P. algirus consistently along an environmental gradient (Álvarez-Ruiz et al., Reference Álvarez-Ruiz, Megía-Palma, Reguera, Ruiz, Zamora-Camacho, Figuerola and Moreno-Rueda2018). Higher levels of steroids in males may provoke immunosuppression and increased susceptibility to parasites (Folstad and Karter, Reference Folstad and Karter1992; Belliure et al., Reference Belliure, Smith and Sorci2004). However, this expectation does not conform to our results because females in the two species of the genus Psammodromus had more mites during the summer, and this effect was stronger in gravid females. Sex-reverse patterns of parasite infection in lizards have been associated before with stressful environments (Megía-Palma et al., Reference Megía-Palma, Arregui, Pozo, Žagar, Serén, Carretero and Merino2020a). Energy allocated to anti-parasitic defences can be reallocated to egg production in gravid females, suggesting that higher mite abundances in females during the summer might reflect this trade-off. This effect was less evident in A. erythrurus, a species achieving field body temperatures of 38.8°C (Belliure, Reference Belliure, Salvador and Marco2015), compared to the lower 31.4°C of Psammodromus spp. (Carretero and Llorente, Reference Carretero and Llorente1995) and, hence, conforming to the higher thermal tolerance expected for the former species. Despite the remarkable differences in thermal tolerance of both genera of lizards, the abundances of the three species, particularly during the warmest months, were similar. This suggested that none of the three lizard species ceased their activity during the most adverse season (summer) despite the costs imposed by a thermally restrictive environment due to high temperatures.
In support of the thermal sensitivity hypothesis, P. algirus also had stronger infestation by mites in the dunes. This habitat, with low vegetation cover and high abundance of mites, likely represents a habitat of poorer thermal quality for P. algirus, a species that demonstrates preferences for habitats with more thermal heterogeneity (Carrascal et al., Reference Carrascal, Diaz and Cano1989). Furthermore, the results show also sexual differences in the relationship between temperature and Schellackia spp. abundance and prevalence. In line with the thermal sensitivity hypothesis, the positive relationship between haemococcidian infection and temperature scores supports the idea that the intensity of infection by Schellackia spp. can reflect the higher sensitivity of the females of Psammodromus to environmental stress associated with the hot temperatures during the summer.
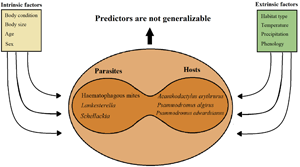
In conclusion, a combination of intrinsic (species, sex, body size) and extrinsic (season, habitat, temperature) factors were important predictors of parasite abundance, intensity and prevalence. Significant predictors were mostly not generalizable. Nonetheless, although with opposing trends in some species, environmental effects of habitat and temperature supported mites and haemococcidians as biomarkers of environmental quality. Remarkably, the lack of haemogregarines in the lizard community of the Albufera de Valencia suggests that ecological particularities of this place may favour the presence of haemococcidians over other blood parasites. Future studies should investigate the diversity of vectors and their competence to transmit haemococcidians for an integral understanding of the host–parasite webs of this ecosystem. A growing body of evidence supports the potential use of parasites of lizards as biomarkers of environmental perturbation.
Supplementary material
The supplementary material for this article can be found at https://doi.org/10.1017/S0031182021000858
Acknowledgements
We would like to thank everyone who assisted during fieldwork and the Regional Government of Valencia and the Albufera de Valencia Natural Park management team for the permission to carry out this work.
Author contributions
R.M.D. was involved in fieldwork, data analysis and writing; J.B. was involved in material, fieldwork and writing; R.M.P. was involved in sample analyses, conception, material and writing.
Financial support
R.M.D. was supported by a Val I + D predoctoral grant (ACIF/2016/331) of the Ministry of Education, Investigation, Culture and Sport of the Regional Government of Valencia and the European Social Fund. R.M.P. participates in the project PGC2018-097426-B-C21, MCIU/AEI/FEDER, UE and enjoys a postdoctoral contract (CEECIND/04084/2017) by ICETA – Instituto de Ciências, Tecnologias e Agroambiente da Universidade do Porto and Fundação da Ciência e Tecnologia.
Conflict of interest
None.
Ethical standards
This study has been conducted according to the ethical standards for studies involving vertebrates.


 Open access

