

Legislative gender quotas are among the most common types of electoral reform instituted in recent decades. Since the late 1980s, over seventy countries have adopted laws requiring that women make up a certain percentage of electoral candidates or seats in the national legislature. Scholars generally agree that these policies have contributed to an increase in women’s legislative presence worldwide.Footnote 1 A growing body of literature also points to more qualitative outcomes. This research suggests that women elected through quota provisions are not merely tokens; they make a meaningful impact on legislative debate, policy outcomes, and public perceptions.Footnote 2 Yet few studies address the potential long-term effects of these policies. By mandating a minimum standard for women’s political representation, do gender quotas level the playing field? Or, to the contrary, do they formalize a glass ceiling? In other words, are the effects of gender quotas sustainable?
This study explores the impact of gender quotas on sustainable representation in Africa. Sustainable representation is broadly defined as viable and substantial political representation secured for the long run (Darhour & Dahlrup Reference Darhour and Dahlerup2013). To have a measurable impact, gender quotas not only need to fast-track women’s representation, but must also generate lasting positive effects on political equality. A recent body of literature addresses this, using case studies and large-N research.Footnote 3 These studies analyze the effects of gender quotas over time, paying specific attention to whether rates of women’s representation fall above or below the quota threshold. If more women are able to participate beyond the quota requirements, this may indicate that the policy promotes sustainable representation. Thus far, a diverse set of cases suggests mixed results.
Building on this literature, this study combines cross-national descriptive analysis with two case studies, Uganda and Kenya. Using election data from across Africa, it compares numbers of elected women to quota thresholds. The results suggest that the percentage of women rarely exceeds the quota requirement. In some cases, however, women are able to crack the quota ceiling. Why? One possible conclusion is that differences in how quota policies are designed have important implications for their long-term impact. Using Uganda and Kenya as case studies, this article explores when and where women are able to compete for non-quota positions. Both countries have successfully implemented special seats for women in the national legislature; however, the number of women holding open (non-quota) seats remains low. The research draws upon election data and in-depth interviews with members of parliament, public administrators, and civil society organizers conducted from January to August of 2016. The results suggest that to effectively promote sustainable representation, countries must balance the elected legitimacy of reserved seats against factors that encourage women to seek open (non-quota) seats. Otherwise, the thresholds set by the reserved seats will create a ceiling for women’s representation.
Fast-Tracking Women’s Representation
In recent decades, the global discourse surrounding women’s equality has shifted from an incremental to a fast-track model. Drawing on earlier experiences in Scandinavia, the incremental-track model suggests that as women begin to acquire the same resources as men, public life will gradually become more gender-balanced. Rejecting this model as unique to a few special cases, proponents of the fast-track model argue that “gender balance will not come about ‘by itself’” (Dahlerup Reference Dahlerup and Dahlerup2006:8). They maintain that, in the short term, specific electoral provisions are necessary to ensure that women not only receive equality of opportunity but also see equality of result (Dahlerup Reference Dahlerup2007). Gender quotas do this by requiring that women make up a certain percentage of candidates or elected legislators.
Gender quotas can be classified based on their mandates or on their procedures for implementation (Dahlerup Reference Dahlerup and Dahlerup2006; International IDEA 2013). Mandate distinguishes between legal and voluntary party quotas. Legal quotas are prescribed by the state through electoral laws and/or constitutional provisions. They apply to all political actors in legislative contests. By contrast, voluntary party quotas are set by political parties as internal benchmarks and are not subject to enforcement by the state. The implementation of gender quotas varies depending on which stage of the electoral process is targeted. Some quotas require that women make up a certain percentage of candidates. These candidate quotas affect the nomination stage—determining who becomes a candidate and how candidates are arranged on party lists. Other quotas require that women hold a certain number (or percentage) of seats in the legislature. These reserved-seat quotas affect officeholder selection by creating special seats for women filled through direct election or indirect selection procedures. While candidate quotas are the most common type of legislative gender quota worldwide, reserved seats are more common in Africa. As a result, while this paper addresses broad trends, it focuses particularly on the effects of reserved-seat quotas.
Today, legislatures in seventy-seven countries have a legal gender quota. Political parties in sixty-one countries have adopted voluntary party quotas. However, three decades ago these policies were quite rare. According to Norris and Dahlerup (Reference Norris and Dahlerup2015), we can trace the global spread of gender quotas through three waves of adoption. During the first wave, communist regimes in the Soviet bloc set thresholds for female representation starting as early as the 1950s (Rueschemeyer Reference Rueschemeyer1998). Left-leaning parties in Scandinavia also began adopting voluntary party quotas during the 1970s (Caul Reference Caul2001). Several other countries, including Pakistan in 1956, Bangladesh in 1972, and Egypt in 1979, adopted reserved seats during this period (Krook Reference Krook2006; IPU 2017). The second wave of quota adoption began at the end of the Cold War. Prioritizing a minimum of 30 percent representation for women, Argentina encouraged several other Latin American countries to embrace candidate quotas (Jones Reference Jones2009). This approach spread globally throughout the 1990s and 2000s, bolstered by the UN Fourth World Conference on Women in Beijing in 1995. Finally, the current (third) wave of quota adoption includes reforms to existing quota provisions in several countries and the continued spread of gender quotas globally, particularly in post-Arab Spring countries (Paxton & Hughes Reference Paxton and Hughes2017).
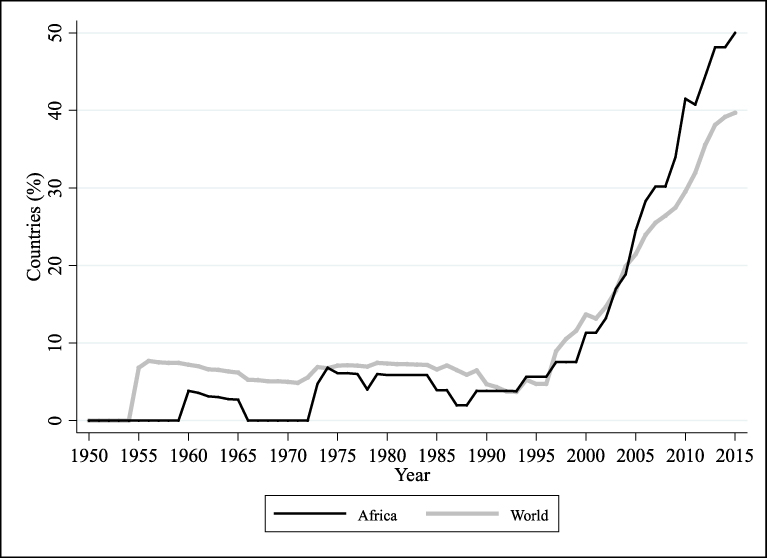
As Figure 1 demonstrates, “African cases seem to conform closely to international trends described by Norris and Dahlerup” (Bauer Reference Bauer2016:197). Several left-leaning, single-party regimes in Africa adopted reserved seats during the first wave of quotas, including Ghana, Tanzania, Guinea, Sao Tome and Principe, and Sudan.Footnote 4 Egypt also had thirty reserved seats for women in multiparty elections from 1979 to 1987 (IPU 2017). Most gender quotas in Africa, however, were implemented during the second or third wave of quota adoption. Between 1990 and 2015, the number of African countries imposing gender quotas rose from three to thirty-seven. This time period coincides with the end of several major conflicts, increasing pressures for liberalizing reforms, and conditional aid policies from many Western donors, all of which may have encouraged the spread of gender quotas in the region (Bush Reference Bush2011; Edgell Reference Edgell2017). Today, half of the countries on the continent have a legal gender quota policy.
Percent of countries with legal gender quotas, 1950–2015
Note: Values based on legally binding gender quotas. Voluntary party quotas are excluded. Data come from Krook (2006), Norris and Dahlerup (2015), and Quota Project (2017).
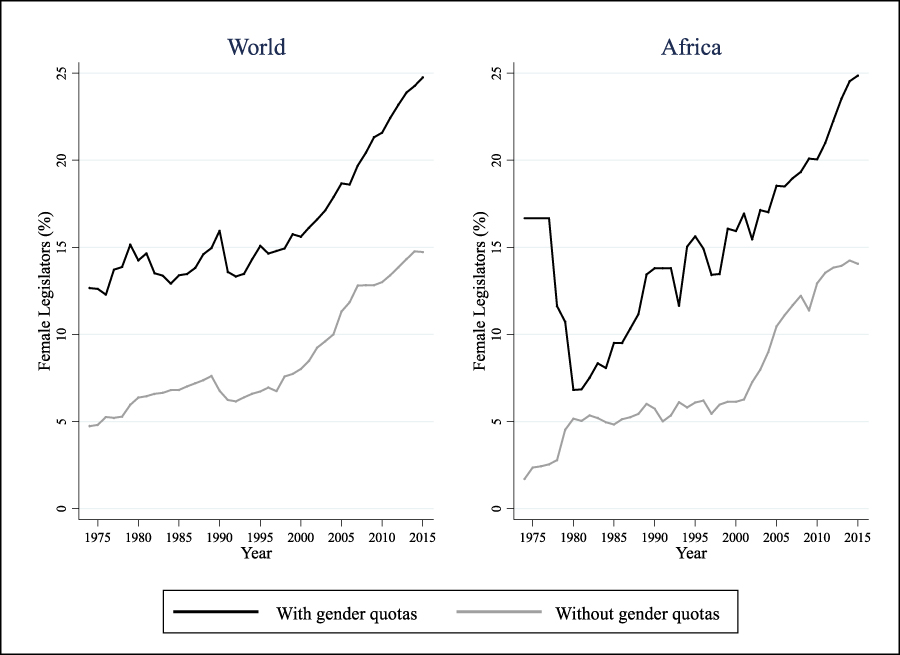
A growing body of literature explores the various outcomes of gender quota policies.Footnote 5 These studies often highlight the effects of these policies on descriptive representation. Descriptive representation emphasizes the physical characteristics of a legislator, i.e. “what he is or is like” (Pitkin Reference Pitkin1967:61), rather than the legislator’s behaviors or actions. This reflects “the view that a representative body is distinguished by an accurate correspondence or resemblance to what it represents” (Pitkin Reference Pitkin1967:60). This is typically measured as the number or percentage of legislators. Cross-national studies almost uniformly find a strong positive correlation between gender quotas and descriptive representation.Footnote 6 Figure 2 demonstrates these findings graphically, showing trends worldwide in women’s representation with and without quotas since the mid-1970s. In the aggregate, the effects of gender quotas in Africa are quite similar to the effects seen in the rest of the world. Studies focusing on this region have also found a positive correlation between quotas and women’s descriptive representation (Lindberg Reference Lindberg2004; Yoon Reference Yoon2004).
Gender quotas and descriptive representation of women, 1975–2015
Note: Based on the percentage of women in the national legislature. Values plotted for lower chamber if unicameral. Includes all cases with gender quotas, legal or voluntary. Data from IPU (2017); Krook (2006); Norris and Dahlerup (2015); Paxton, Green, and Hughes (2008); and Quota Project (2017).
Several studies also address the effects of gender quotas on symbolic and substantive representation. Symbolic representation is based on affect; citizens must feel or believe that they are being represented. Pitkin (Reference Pitkin1967) describes this as similar to a flag or emblem. As Barnes and Burchard (2012:770) argue, “descriptive representation actuates symbolic representation by sending a signal to the so-called ‘described’ that the political arena represents them and is receptive to their part.” However, scholarship in this area suggests that the effects of gender quotas on symbolic representation are modest or could even be negative.Footnote 7 On the other hand, substantive representation emphasizes “the nature of the activity itself, what goes on during representing, the substance or content of acting for others” (Pitkin Reference Pitkin1967:114). Studies in this area suggest that by increasing the descriptive representation of women, gender quotas provide for “increased attention to ‘women’s issues’ such as education, health care, and social welfare” (Barnes & Burchard Reference Barnes and Burchard2012:770).Footnote 8
Sustainable Representation and Gender Quotas
Because quotas are designed to fast-track descriptive representation, they are often labeled as “temporary special measures” (UN 1979). Policymakers expect that one day these provisions will become obsolete (Htun 2014; Krook Reference Krook2015). Little, however, is known about whether the gender balance gained from adopting quotas will continue in the long run. Recognizing this, a recent literature has begun to address the concept of sustainable representation. Darhour and Dahlerup (Reference Darhour and Dahlerup2013:133) coined the term, defining it as “a durable, substantial numerical political representation of women, freed of the risk of immediate major backlash.” Thus, sustainable representation guarantees that, once achieved, a gender-balanced legislature is likely to persist.
Ideally, one would test for the effects of gender quotas on sustainable representation by observing what happens while the policy is in place and then again after it has been removed. In a few cases, scholars have been able to employ this quasi-experimental design. Drawing on evidence from the random assignment of reserved seats at the local level in India, Bhavnani (Reference Bhavnani2009) has found that gender quotas provide exposure to female leaders and increase positive perceptions of female candidates. This increases the chances that women will be elected without reserved seats. De Paola, Scoppa, and Lombardo (2010) draw similar conclusions in Italy, where a quota adopted in 1993 was not implemented in all municipalities before being repealed in 1995. They show that after the policy was withdrawn, women’s representation remained higher in municipalities where the quota had been implemented. Conversely, Clayton (2014) finds that the introduction of quotas at the local level in Lesotho generated negative reactions, which contributed to decreased political participation of women.
In the absence of a “natural experiment,” scholars creatively use observational data from situations where gender quotas are still in place. These studies compare the minimum thresholds set by quota policies to election results over time. For example, Yoon (Reference Yoon2008) finds that Tanzanian women build experience in reserved seats before competing for regular constituencies. A follow-up study, however, argues that over time only a few Tanzanian women have been able to successfully switch between quota and non-quota seats (Yoon Reference Yoon2016). In a similar analysis, Darhour and Dahlerup (Reference Darhour and Dahlerup2013) find that after three elections, reserved seats in Morocco have not contributed to an increase in women running for regular district-level seats. This leads Lloren (2014:530) to conclude that Morocco’s reserved seats “have led to the introduction of a new glass ceiling” because they “have prevented women MPs from building a local constituency” (Lloren Reference Lloren2014:530). In South Korea, party lists strictly adhere to a 50 percent candidate quota for seats elected as a nation-wide multimember constituency, but routinely ignore a 30 percent candidate quota for district-level single-member seats. Shin (Reference Shin2014) finds that a norm of no-reelection for the multimember seats generates a spill-over effect, over time increasing the number of women who run for the district-level seats.
Finally, Paxton and Hughes (Reference Paxton and Hughes2015) demonstrate how sustainable representation might be measured using cross-national data. They argue “that countries exhibit trajectories of growth in women’s representation over time and that quotas should push countries off their existing trajectory” (Paxton & Hughes Reference Paxton and Hughes2015:333).Footnote 9 Using global data from 1990 to 2010, their results show an increasing effectiveness of gender quotas over time, which cannot be attributed solely to reforms to improve the quota policy.
Methodology
As the literature demonstrates, it is possible to assess sustainable representation based on whether women exceed the quota requirements (Darhour & Dahlerup Reference Darhour and Dahlerup2013; Lloren Reference Lloren2014; Yoon Reference Yoon2008, Reference Yoon2016; Shin Reference Shin2014). This allows us to answer two questions: Are gender quotas treated as a ceiling or a floor (Matland Reference Matland and Dahlerup2006)? Why are some women able to compete beyond the quota mandate? This article contributes to the existing literature by exploring these two questions in detail. It departs from previous observational studies by combining a description of cross-national trends with two case studies. The descriptive analysis allows us to understand the variation in sustainable representation across cases, while the case studies themselves provide insights into how the procedures for implementing a gender quota can influence its effectiveness.
For the cross-national analysis, data was collected on the gender of candidates and the percentage of legislative seats held by women in 205 countries between 1974 and 2015.Footnote 10 These data are compared to the thresholds set by gender-quota laws. Figures regarding the percentage of female legislators were available for 1,720 legislative elections, 83 of which included a reserved-seat quota.Footnote 11 Cross-national data on the gender of candidates is sparse, but it was available for 596 elections, 53 of which included a candidate quota. Countries are included only if they have both adopted and implemented a legally binding quota policy (Quota Project 2017). The focus of this study is on legally binding gender quotas because they are formalized and apply to all political parties participating in the election. The results for African cases are then compared to quota policies in the rest of the world.
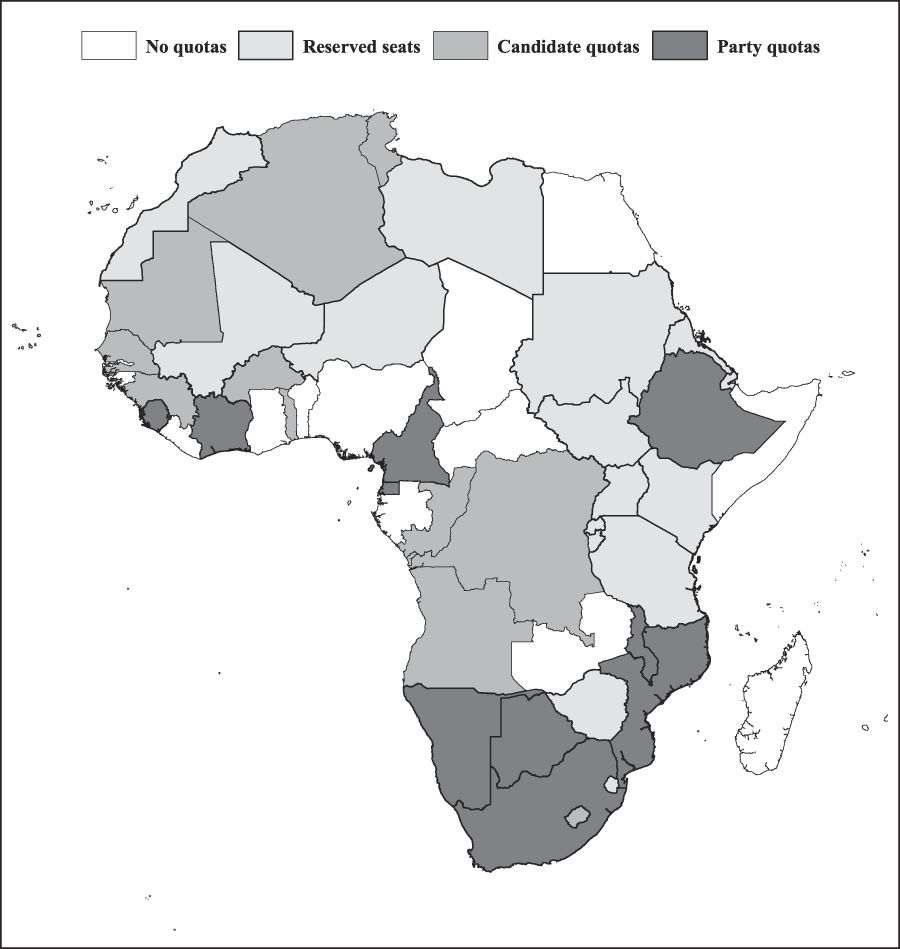
Building on previous studies, this article also analyzes the effects of reserved seats in two African cases. As Darhour and Dahlerup (Reference Darhour and Dahlerup2013:135) note, “Too little attention has been paid to how different types of reserved seat systems can have different effects for elected women’s room to maneuver in political life.” Yet, reserved seats are the most common type of gender quota in Africa (Figure 3). As of 2017, reserved seats account for 15 out of 32 gender quotas on the continent. Only ten countries outside of Africa use this type of quota. Thus, while they are not a uniquely African phenomenon, reserved seats are uniquely common in the region.
Gender quotas in Africa
Note: Countries with reserved seats include (15): Burundi, Djibouti, Eritrea, Kenya, Libya, Mali, Morocco, Niger, Rwanda, South Sudan, Sudan, Swaziland, Tanzania, Uganda, and Zimbabwe. Countries with candidate quotas include (12): Algeria, Angola, Burkina Faso, Cape Verde, Democratic Republic of Congo, Guinea, Lesotho, Mauritania, Republic of Congo, Senegal, Togo, and Tunisia. Countries with voluntary party quotas include (10): Botswana, Cameroon, Equatorial Guinea, Ethiopia, Ivory Coast, Malawi, Mozambique, Namibia, Sierra Leone, and South Africa. Data from Quota Project (2017), as of December 2016.
Uganda and Kenya are especially well-suited for a study of the effects of reserved seats on sustainable representation. The literature suggests that reserved seats are successful if they are subject to competitive election and if they represent a well-specified constituency (International IDEA 2013). Uganda and Kenya meet both of these criteria.Footnote 12 Therefore, we might consider them most-likely cases for observing sustainable representation under gender quotas (Eckstein Reference Eckstein, Greenstein and Polsby1975). Similarities between the cases also allow us to draw conclusions by pooling their election data. This increases the amount of information we have on outcomes of the reserved-seat policy, while holding other factors related to the gender quota, electoral system, and legislature (fairly) constant. They use the exact same reserved-seat policy, and are, in fact, the only two countries in the world to implement reserved seats in this way. Both countries elect their members of parliament using a winner-take-all formula in single-member constituencies. The parliamentary procedures roughly follow Westminster rules, an artifact of British colonization, despite both countries having presidential systems. While the Parliament of Uganda is unicameral, under the 2013 constitution, the Parliament of Kenya contains two houses. Similar to the United States, the lower chamber, the National Assembly of Kenya, is elected to represent the people, and the upper chamber, the Senate, represents the country’s 47 counties. For comparability between the two cases, this study focuses on the National Assembly in Kenya, excluding the Senate from this analysis.Footnote 13
To assess the electoral procedures and outcomes of reserved seats in the two example cases, this research focuses on the specifics of each country’s constitution, interviews with key informants, and data from three elections in Uganda (2006, 2011, and 2016) and two elections in Kenya (2013 and 2017). This includes all direct elections for reserved seats in the two countries. First, this study describes the procedures through which reserved seats are implemented and the ways in which they have translated into women’s representation in each legislature. More women running for open seats over time would suggest that the reserved seats in Uganda and Kenya promote sustainable representation. However, a flat trajectory for women in open seats would suggest that these quotas have “become a ceiling rather than a floor for further growth of women’s political power” (Matland Reference Matland and Dahlerup2006:278). Afterward, data on female candidature is analyzed to explain what motivates women to run for non-quota seats. Several political/structural and social factors are important in this regard.
Assessing Sustainable Representation Cross-Nationally
Figure 4 plots available data on quota mandates and election outcomes for Africa and the rest of the world from 1974 to 2015. Because different types of quotas target different stages of the electoral process, the results for candidate quotas and reserved seats are analyzed separately. For candidate quotas, the percentage of candidates required is compared to rates of female candidature in the election. For reserved-seat quotas, the percentage of seats reserved is compared to the percentage of seats held by women. Values on the x-axis indicate the size of the quota and values on the y-axis indicate the actual percentage of female candidates or female legislators. The 45-degree reference line allows us to analyze the effectiveness of gender quotas. On-the-line cases meet but do not exceed the gender quota. As such, these cases may indicate a ceiling effect. Cases exceeding the quota mandate fall above this line, suggesting that the policy may contribute to sustainable representation because women are able to compete beyond what the quota requires. Cases failing to meet the mandate fall below the line, suggesting that the quota may be ineffective.
Comparison of gender quota mandate and outcomes for female politicians
Note: This graph compares the size of the gender quota to actual outcomes for women in legislatures. For candidate quotas, (left) the minimum female percentage candidates is compared to the actual percentage of female candidates on the ballot. For reserved seat quotas (right), the percentage of seats reserved for women in the legislature is compared to the actual number of legislative seats held by women. Data are included only if the country had adopted and implemented a gender quota during the time in which the legislature was elected (directly or indirectly) or appointed. For candidate quotas, this includes 53 legislatures. For reserved seats, this includes 83 legislatures. Sources of data included IPU (2016); Nohlen (2005a, 2005b); Nohlen, Grotz, and Hartmann (2001a, 2001b); Nohlen, Krennerich, and Thibaut (1999); Nohlen and Stöver (2010); and the Quota Project (2016).
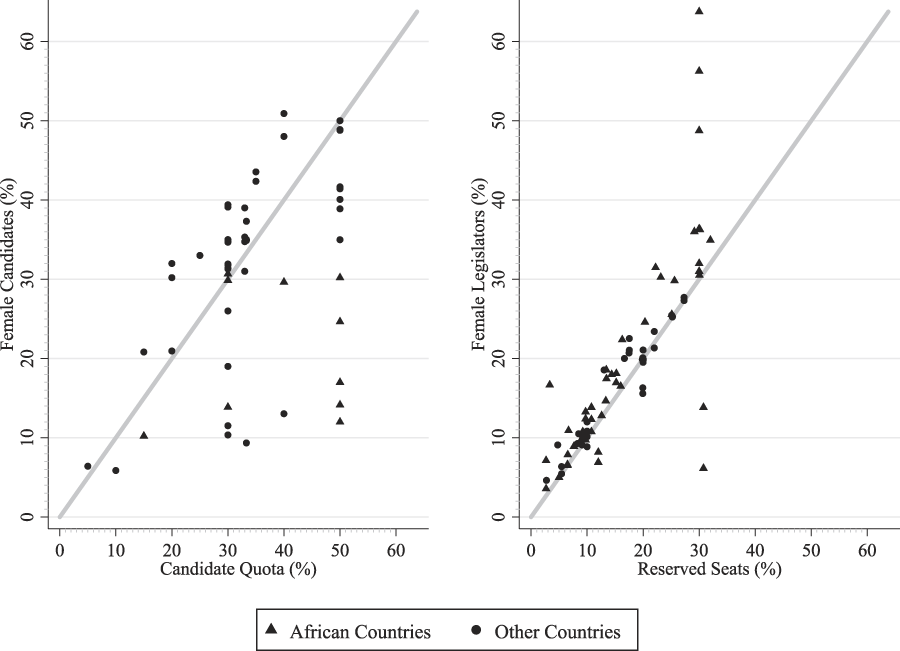
The results suggest that candidate quotas are less effective than reserved seats. In 48 percent of observed elections, the percentage of female candidates fell below what the candidate quota required. While the average candidate quota stated that women should constitute one-third of legislative candidates, the actual percentage of female candidates averaged about 30.19 percent. Among African countries, the failure to meet candidate quota mandates is particularly pronounced. Data were available for eleven African elections with candidate quotas.Footnote 14 Only two—Angola in 2012 and Burkina Faso in 2015—achieved the quota threshold. By contrast, reserved seats tend to produce slightly more female legislators than the quota requires. About 75 percent of observed elections resulted in more female legislators than the reserved seats required. Between 1974 and 2015, countries with reserved seat quotas set aside an average of 16.60 percent of the lower/ unicameral chamber, and women in these countries held an average of 17.92 percent of the seats. Among forty-nine African elections with reserved seats, only four—two in Somalia and two in Swaziland—failed to meet the quota mandate.Footnote 15
Why do candidate quotas appear to be less effective when compared to reserved seats? By creating new positions for women, reserved seats do not threaten to displace male politicians. Rather, political parties may actually benefit from these provisions, acquiring more seats through women-only lists (Paxton & Hughes Reference Paxton and Hughes2015). On the other hand, candidate quotas require that political parties supplant male candidates with women. As a result, they “often face uphill battles during implementation, and some parties actively seek to undermine quotas” (Paxton & Hughes Reference Paxton and Hughes2015:335). To be effective, these provisions must include enforcement mechanisms. A survey of quotas in 2014, however, found that a little over half (57 percent) of all countries with candidate quotas “stipulate sanctions for non-compliance in the form of rejecting the entire list or refusing to register the section/ candidates on the list that conflict with the provisions of the law” (International IDEA 2013:24). Such strong sanctions are applied to about 38 percent of candidate quotas in Africa (Hughes et al. Reference Hughes, Paxton, Clayton and Zetterberg2017).Footnote 16
Thresholds set by reserved seats may be easier to achieve, but this does not necessarily mean that these policies are better at promoting sustainable representation in the long run. The numbers suggest that women are still somewhat confined to a “separate enclosure” (Chowdhury Reference Chowdhury2002). In cases where the mandate is exceeded, only a few women are able to compete successfully for non-quota seats. Between 1974 and 2015, on average women exceeded thresholds set by reserved seats by just 1.3 percentage points.
Figure 4 also suggests that effects of gender quotas are highly variable, even where the countries use the same type of quota policy. The plotted points for both candidate quotas and reserved seats exhibit a high degree of dispersion or spread, indicating that between cases we see considerable differences in how quotas work.Footnote 17 As Darhour and Dahlerup (Reference Darhour and Dahlerup2013:135) argue, “The devil is in the details when it comes to gender quotas and electoral systems.” The mechanisms for implementing a quota vary cross-nationally because these policies interact with other electoral rules, which in turn affect their success (International IDEA 2013). Therefore, in the following sections, this study takes a closer look at the way in which electoral procedures affect the outcomes of reserved seats in two African cases.
Reserved Seats in Uganda and Kenya
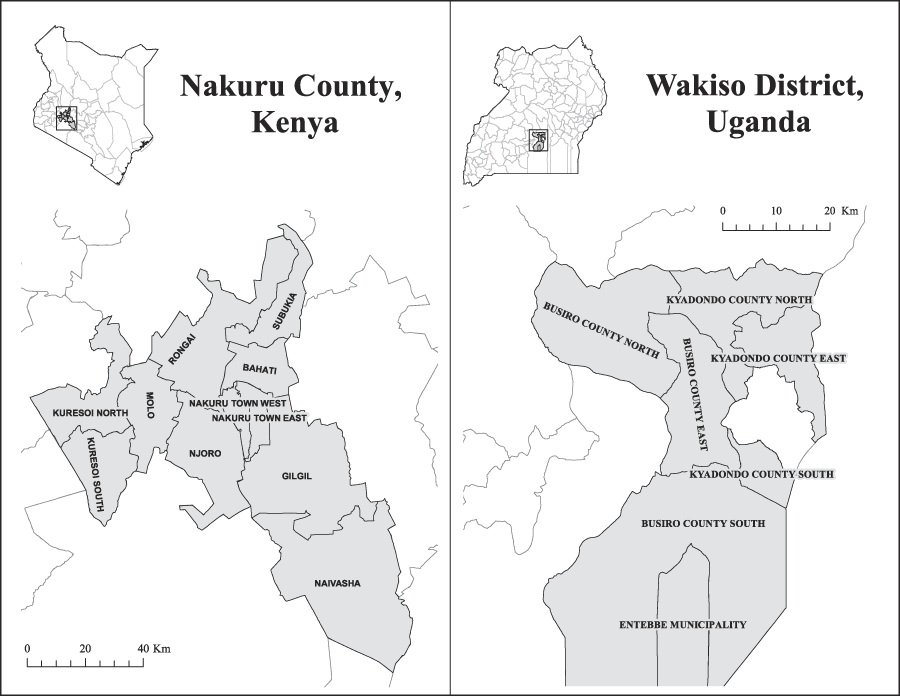
Uganda and Kenya both have constitutionally-mandated gender quotas at the national level with nearly identical procedures for implementation. Both the Parliament of Uganda and the National Assembly of Kenya allocate reserved seats using a special tier reserved for female candidates only (International IDEA 2013). These seats represent a sub-national administrative unit that coincides with the highest level of local government. Commonly referred to as districts in Uganda and counties in Kenya, this territory includes one or more regular constituencies for the legislature, as illustrated in Figure 5. Uganda’s constitution does not stipulate the exact number of reserved seats, only that the legislature include one woman representative for each of the country’s districts. Because Uganda has undergone redistricting, the number of reserved seats has increased from 34 in 1989 to 112 in 2016. By contrast, the Kenyan constitution specifies that the National Assembly include 290 members elected at the constituency level and 47 woman MPs elected to represent each of the country’s counties. This system of implementation makes it more difficult to alter the number of constituencies or counties. For clarity, the electoral areas represented by reserved seats are referred to as districts and the non-quota seats as either open seats or constituency seats.
Example of a County in Kenya and District in Uganda, with constituency boundaries labeled
Note: Reserved seats in both countries would represent this level of government, while regular open seat MPs represent one of the constituencies drawn within the district or county borders. Data from Independent Electoral and Boundaries Commission of Kenya 2013; Uganda Bureau of Statistics 2014.
Uganda pioneered this type of reserved-seat policy. It was first implemented in 1989, shortly after the ruling National Resistance Movement (NRM) took power, and was later codified in the 1995 constitution. Initially, however, local councils (mostly male) decided who would fill these seats. Starting with the 2006 elections, Ugandan voters have directly elected their district woman MPs through the same electoral rules as apply to their constituency MPs. Drawing on its neighbor’s experiences, Kenya established a similar reserved-seat system for the National Assembly in its 2010 constitution. These seats have undergone two rounds of elections.
In theory, qualified women in both Uganda and Kenya have a constitutional right to compete for any elected office. Female aspirants for the legislature may choose to run for either a reserved seat or an open seat, but not both at the same time. On election day, citizens in both countries vote for one member of parliament (MP) to represent their constituency and one woman MP to represent their district or county. All MPs are elected using single-member, winner-take-all rules. Citizens are allowed to vote for only one candidate in each position, and the candidate attaining the highest number of votes is declared the winner.
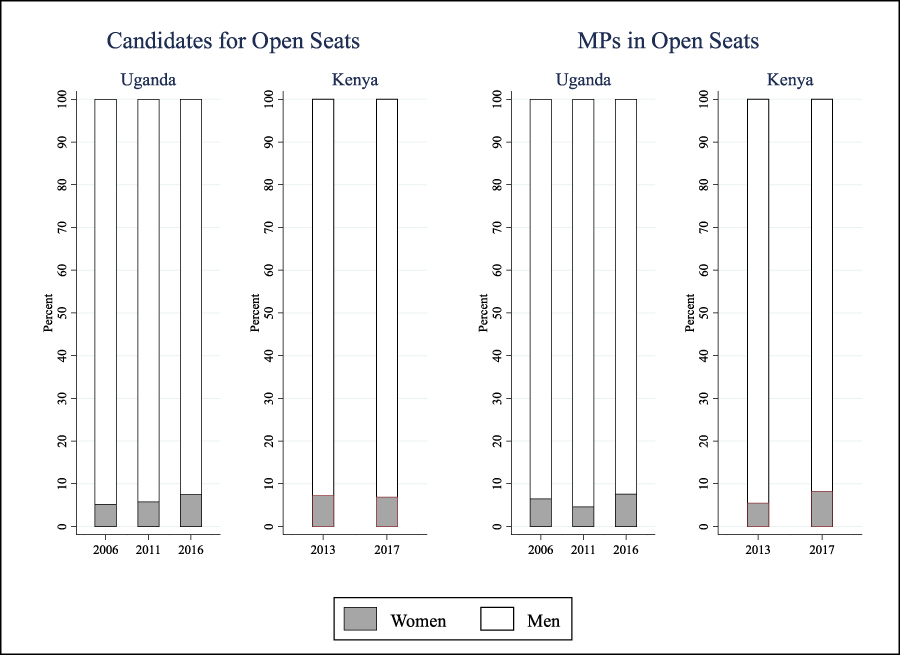
In practice, women tend to vie for the reserved seats. From 1989 to 2016, women’s representation increased from nearly zero to 34 percent in Uganda. Kenya has seen similar gains, with representation increasing from 9 percent to 22 percent under the reserved-seat system. Despite these gains, women’s representation in open seats remains modest (Figure 6). Based on available data from Uganda, the female percentage of open-seat candidates has increased slightly with each election, from 5.2 percent in 2006 to 7.5 percent in 2016. Meanwhile, the share of open seats held by women decreased from 6.5 percent in 2006 to 4.6 percent in 2011, before rebounding to 7.6 percent in 2016. In Kenya, the number of women running for open seats declined between 2013 and 2017, but women were able to increase their share of open seats from 5.5 percent to 8.3 percent. Today, women hold a greater share of open seats in the Kenyan National Assembly than they did in the parliament prior to the introduction of quotas. This suggests that reserved seats have had some positive impact on sustainable representation. In the future, we may see greater improvements of female representation in open seats.
Women and open seats in Uganda and Kenya
Note: Based on official election data. Kenya Elections Database 2015; Parliament of Uganda 2016; Uganda Electoral Commission 2006; 2011.
For the time being, low rates of female candidature and representation suggest that open seats remain largely a male domain. As one civil society organizer in Uganda explains, “Because of affirmative action, in reality, the direct seats have become men’s seats. This has cocooned women into a small space, curtailing their ability to compete in constituency seats. It creates a culture whereby women are expected to go where they have been put.”Footnote 18 Yet some women are able to compete for open seats. Why? In the next two sections, this study explores some possible explanations.
Stepping Stones or separate enclosures?
In both Uganda and Kenya, there is a general expectation that women will use reserved seats as a stepping stone, transitioning to open seats after one or two terms. The literature also suggests that women who hold reserved seats should develop an incumbency advantage that would encourage them to pursue open seats (Bjarnegård & Zetterberg Reference Bjarnegård and Zetterberg2011; Shin Reference Shin2014; Yoon Reference Yoon2008). However, because reserved seats provide women with a special pathway for entry, they “must be designed to give women ‘elected legitimacy’—i.e., reserved seats should be subject to competitive election among several female candidates, where the elected women have their own power base/ constituency” (International IDEA 2013:26). According to these criteria, reserved seats in Uganda and Kenya rate high on elected legitimacy. They are filled through direct elections following the same voting criteria as open seats, typically with multiple candidates,Footnote 19 and they have a clearly defined geographic constituency—the district in Uganda and the county in Kenya. Therefore, we would expect that women in Uganda and Kenya frequently draw upon incumbency advantages to switch from reserved to open seats.
The empirical evidence, however, shows that few women vie for open constituencies after having held reserved seats. From 2006 to 2016, only eighteen candidates for open seats in Uganda had previously held a reserved seat. Likewise, in the 2017 Kenyan elections, only three county woman MPs competed for open seats in the National Assembly. Evidence from Uganda also suggests that women holding reserved seats for multiple terms are less likely to vie for open constituencies. Between 2006 and 2016, half of women seeking to switch from reserved to open seats had only served a single term, and none had served more than three terms. Meanwhile, prominent Ugandan leaders such as the current speaker Rebecca Kadaga and government chief whip Ruth Nankabirwa have held the same reserved seats for five terms. Policymakers and citizens in Uganda and Kenya are keenly aware of the issue.Footnote 20 As one informant put it,
We said we wanted to create more space for women to take up leadership. Now I am a member of parliament, on affirmative action, and I’ve spent there five, six terms. I don’t want to leave that space for a fellow woman. What does that mean? Am I empowering other women? Or am I just being selfish?Footnote 21
Despite meeting the procedural requirements, the perceived electoral legitimacy of reserved-seat MPs remains low in both countries. This could explain why so few women attempt to switch seats. First, voters and even policymakers often forget or fail to recognize that reserved seats for the Uganda Parliament and National Assembly of Kenya are filled through competitive elections.Footnote 22 A history of filling quotas through indirect elections may fuel this misperception. In Uganda, women’s seats for the Parliament were indirectly elected from 1989 to 2001. In Kenya, reserved seats for the county assemblies and the Senate are currently allocated using indirect electoral rules; and a policy from 1997 to 2007 required that six of twelve presidential appointments be reserved for women.
In both cases, patriarchic attitudes also play a role. An organizer in Kenya explains, “Women versus women is not viewed as competition. Because it’s like that’s their seat, let them fight it out over there. So, nobody actually looks at it like you have gone through a nomination, a campaign, and an election.”Footnote 23 This promotes hostile rhetoric toward the quota policy. Reserved-seat MPs are often referred to as “flower girls” or mistresses, implying that they are merely tokens or sexual commodities. As a male MP in Kenya laments, “The voter looks more at them as dressing well, being flower girls and hanging around politicians or keeping the men company, which is not true—because some of them have worked on very interesting legislation that is progressive for our country.”Footnote 24 The media perpetuate these views. For example, in May 2011, the government-owned newspaper in Uganda surveyed sixty male MPs to find the most beautiful female MP. The publication reported that men disqualified women based on their “old age,” “bad legs,” “poor quality hair,” and “being too loud” (Namazzi, Agiro, & Mulondo Reference Namazzi, Angiro and Mulondo2011).
Second, while women elected to reserved seats have a specific electoral area, this overlaps with one or several open-seat constituencies. As a result, they often compete with the jurisdiction of open-seat MPs. For example, a reserved-seat MP from Uganda recalls,
This one time I went to one of the constituencies to talk about wealth creation. I called both men and women there. But the male MP for the area found out I was coming, and he sent his own people to the place where I had intended to meet. So, when I arrived a representative told me that the place was still being used by the MP for the area. I said, ‘I thought I was also representing this area.’ So, I fought with him.Footnote 25
Reserved-seat MPs also cover a larger territory and represent more voters. In both countries, the geographic area represented by an average reserved-seat MP is thirteen times larger than the area represented by the average open-seat MP. Reserved-seat legislators represent four times more voters in Uganda and eight times more voters in Kenya than their open-seat colleagues.Footnote 26 This undermines reserved-seat MPs’ ability to engage in “home style politics” (Fenno Reference Fenno1978). They are expected to represent the entire district, but are paid the same as open-seat MPs and are often allocated fewer funds for constituency service.Footnote 27 As one Kenyan MP reports, “I know a number of members of parliament who were elected on the forty-seven seats who really do not want to run on it again. It’s expensive. It’s tedious.”Footnote 28
Because voters expect MPs to provide service delivery in their constituencies, this undermines the legitimacy of reserved-seat MPs and reinforces a “stereotype that women cannot deliver.”Footnote 29 This may have spill-over effects for symbolic representation, thwarting reserved-seat incumbents and newcomers from running in open-seat contests. While reserved seats come with severe challenges in terms of representation and constituency development, female aspirants may find that these are the only seats open to them and/or that the challenges are worth the potential benefits of attaining office through a women-only electoral environment. Reserved seats have in many cases become a separate enclosure for female MPs, rather than a stepping stone to open seats.
Vying for a Man Seat
If seat switching is uncommon, then what other factors might explain female candidature for open seats? As political actors, female aspirants for legislative office are likely to engage in a rational decision-making process when deciding which seat to pursue. In Uganda and Kenya, once a female aspirant has decided to run for the parliament or National Assembly, she will likely weigh the benefits of running for a reserved seat versus an open seat. The literature would suggest that women are more likely to pursue open seats “when they face favorable political and structural circumstances” (Fox & Lawless Reference Fox and Lawless2004:267).
Modeling these circumstances may help us better understand how reserved seats affect sustainable representation. Using election data from both countries, the open-seat constituencies were coded using a binary variable as one (1) where there were one or more female candidates and zero (0) where only male candidates competed.Footnote 30 Because it might be expected that the mechanisms explaining female candidacy are different for incumbents, female candidates running for re-election in open seats are not counted. Table 1 includes descriptive information on constituencies, districts, and female open-seat candidates for each election included in this analysis.
Districts, Constituencies, and Female Candidates in Uganda and Kenya
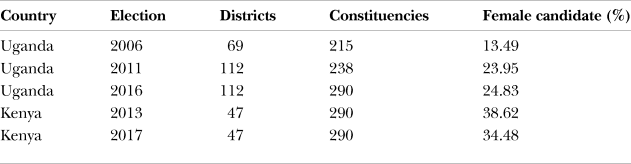
Note: Number of districts, number of constituencies, and the percentage of constituencies with at least one female candidate for Uganda (2006–2016) and Kenya (2014–2017). Based on official election data. Kenya Elections Database 2015; Parliament of Uganda 2016; Uganda Electoral Commission 2006; 2011.
Certain political or structural attributes of a constituency are likely to make running for elective office more attractive to female aspirants. Using constituency-level data from both countries, this study examines the effects of three of these attributes:
District magnitude
The main benefit of running for a reserved seat is that only women can participate. By design, women are expected to compete for these seats, unlike open seats which are traditionally a male domain. However, reserved seats often represent multiple open-seat constituencies. Thus, open-seat campaigns encompass a smaller territory and require that candidates capture fewer votes. Once elected, it easier for open-seat MPs to engage in service delivery, which is often used to evaluate performance at the polls. Therefore, it is possible that female aspirants consider district magnitude, or the number of constituencies within the district, when deciding where to run. If the district only includes a single constituency, we would expect that the relative benefits of running for an open seat reduce significantly. Service delivery becomes equivalent for the reserved seat and the open seat, but the benefits of running in a women-only contest remain. Because the reserved seat and the open seat represent the same set of voters, the public may perceive the latter as de facto reserved for men. As one Ugandan female candidate explains, “I personally thought of standing for the constituency seat—back then and even now, I don’t think it would be difficult to dislodge the incumbent—but the tag, that this is a man’s seat, is there in the minds of the people.”Footnote 31 As the number of constituencies increases, however, public sentiment toward female candidates for open seats is likely to improve. Women will take into account the increasing benefits of a smaller constituency when deciding where to run. To test for this, this study measures the total number of open-seat constituencies within the district. For the sample of elections included, this variable ranges from 1 to 9 in Uganda (mean = 3.42) and 2 to 17 in Kenya (mean =7.44).Footnote 32
Incumbents
Candidates face higher costs when the incumbent is seeking re-election. Because most open seats are held by men, we would expect that women face an “incumbency disadvantage” (Schwindt-Bayer Reference Schwindt-Bayer2005). As Welch and Studlar (1996:871) write, “incumbency in a single-member district electoral system… remains the most formidable barrier for women to overcome in gaining equal access.” For this reason, female candidates prefer to participate in elections where the incumbent is not running (e.g. Palmer & Simon Reference Palmer and Simon2001). This has two implications. First, we would expect that an open-seat constituency is less likely to have a female candidate if the incumbent is seeking re-election. To test for this, constituencies are coded as one (1) if the incumbent ran for re-election and zero (0) otherwise.Footnote 33 Second, female aspirants may be encouraged to seek an open seat if the reserved-seat MP is seeking re-election. To test for this, the variable is coded as one (1) if the reserved-seat MP for the district ran for re-election and zero (0) otherwise.Footnote 34 For the elections included in this study, incumbent MPs participated in 75 percent of open-seat and 67 percent of reserved-seat elections.
New constituencies
Elections for new constituencies are often less predictable, which may provide unique opportunity structures for female candidates. Research suggests that fewer incumbents compete for new constituencies, and when they do, they are often more vulnerable to challengers (Sanbonmatsu 2014). Thus, new constituencies may exhibit a distinct effect on female candidature. To capture this, a variable for new constituencies was coded as one (1), while those constituencies that previously had one or more elections were coded as zero (0). The analysis includes a total of 155 new open seats, 76 formed between 2006 and 2016 in Uganda and 79 formed between 2007 and 2013 in Kenya. About 58 percent of these had an incumbent candidate during the first election, suggesting that incumbency and new constituencies are not systematically correlated.
These models also contain controls for three other characteristics which may affect views toward women in public office and the supply of women who are eligible for legislative office.
Previous female MP
If the constituency previously had a female MP, it might be expected that another woman would contest for this seat in the future. Prior experiences with a female MP may influence public perceptions, making female candidates more acceptable. The experience may also produce symbolic representation effects, encouraging other women to pursue the office. Using election data, constituencies that previously had a woman MP are coded as one (1) and those where only male MPs have served are coded as zero (0).Footnote 35 A female MP had previously served in about 11.5 percent of the open seats for which elections are observed.
Minimum Education
Uganda and Kenya have educational requirements for legislative office. In Uganda, MPs must hold an advanced-level secondary school degree (Constitution of Uganda 1995).Footnote 36 In Kenya, membership in the National Assembly is limited to those who hold a certificate or degree requiring at least 3 months of higher education (Elections Act of Kenya 2012). Therefore, access to education may affect the supply of women eligible for legislative office. To control for this, census data is used to estimate the percentage of women within the constituency who meet the minimum education requirement.Footnote 37 On average, about 4.6 percent of women met this requirement during the observed elections in Uganda and Kenya.
Total Fertility Rate
Qualified women may remain outside of politics due to household responsibilities such as childrearing (Fox, Lawless, & Freeley Reference Fox, Lawless and Freeley2001). Childbearing practices are also an indicator of traditional beliefs and women’s empowerment (Inglehart & Baker Reference Inglehart and Baker2000; Inglehart & Norris Reference Inglehart and Norris2003; Upadhyay et al. Reference Upadhyay, Gipson, Withers, Lewis, Ciaraldi, Fraser, Huchko and Prata2014). Therefore, census data is used to control for the total fertility rate based on the average number of children born to women ages 40–49 within the constituency.Footnote 38 The total fertility rate ranges from 3 to 8, with an average of 6.4 children per woman.
Empirical Design and Results
The aforementioned variables are used to model female candidature at the constituency level.Footnote 39 Because the outcome variable is measured dichotomously and data from the two countries are pooled, a logistic regression model is estimated with election-fixed effects and robust standard errors clustered by constituency. Presented in Table 2, the first model includes the political/structural variables, while the second model adds controls for other characteristics. The decision to estimate two separate models is driven by a moderate-to-high correlation between the control variables and political/structural factors.Footnote 40
Modeling female candidature for open seats
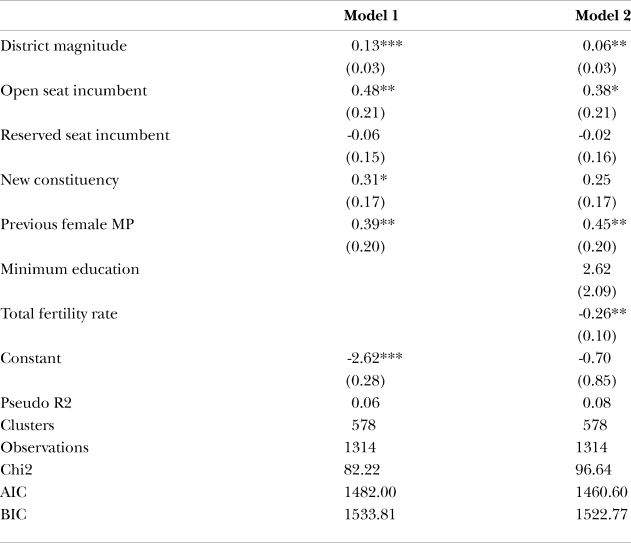
Note: Estimated coefficients and robust standard errors (clustered by constituency) from pooled logistic regression. Models also control for election fixed-effects. * p<0.10, ** p<0.05, *** p<0.01.
As anticipated, women are more likely to run for an open seat if the seat is located in a district with multiple constituencies. All else being equal, an additional constituency in the district increases the probability of a female open seat candidate by about 6.2 percent. This finding suggests that effective reserved seats operate according to a goldilocks principle. The size of the electoral area for the reserved seat relative to the size of regular constituencies can neither be too small or too large. In districts with few or only one constituency, women will find it difficult to justify running for an open seat given the risks of the “man seat” tag, the perceived benefits of female-only competition, and the relatively similar constituent obligations. Districts with many constituencies may encourage women to run for open seats for the very same reasons that they may also undermine the legitimacy of reserved seats: they require reserved-seat women to represent and provide constituency service to a large population of voters spread over a large geographic territory. This scenario could also prevent women elected to reserved seats from attaining incumbency benefits that might allow them to switch to open seats in the future. Thus, reserved districts should be large enough to encourage women to run for open seats, but small enough that they do not undermine the legitimacy of women holding reserved seats.
The models show mixed results for the incumbency disadvantage. Elections for new constituencies are about 56 percent more likely to have a female candidate, suggesting that women try to take advantage of increased electoral uncertainty. However, contrary to expectation, women do not necessarily avoid challenging open-seat incumbents. Constituencies with incumbent candidates are not significantly less likely to have female candidates. One likely explanation is that there are two (or more) types of female aspirants. Some women may be encouraged to challenge incumbents they view as unfit. Others may see this as too costly and decide to run for the reserved seat (or not run at all). As a result, we see no effect of open-seat incumbents. Conversely, there is some evidence that if the reserved-seat incumbent is running, female aspirants are more likely to consider competing for an open seat. All else being equal, the odds of a woman running for an open seat increase by about 36 percent if the reserved-seat MP for the district is seeking re-election. It could be that successful reserved-seat MPs have symbolic representation effects, encouraging other women in the district to pursue office through open seats. Likewise, women may view challenges to sitting reserved-seat MPs as more costly or risky when compared to open-seat challenges. Regardless, once we control for other attributes of the constituency in Model 2, the effect of reserved-seat incumbents disappears.
Among the control variables in Model 2, having more children has a significant negative effect on female open-seat candidature. In constituencies where women average three children, the probability of a female open-seat candidate is about 46.5 percent. This declines to 20 percent in constituencies where women average eight children. Unexpectedly, minimum education does not significantly correlate with female candidature. The models also suggest that female open-seat MPs encourage other women to run for the seat. Constituencies that have previously elected a female MP are 46 percent more likely to have a female candidate when compared to constituencies that have never had a female MP.
Conclusion
An extant literature demonstrates the positive effects of gender quotas on women’s descriptive representation. Scholars also note the benefits of these policies for symbolic and substantive representation. However, very little is known about the long-term effects of gender quotas. As part of a fledgling literature seeking to remedy this knowledge gap, this study explores the effects of gender quotas on sustainable representation using cross-national data and two case studies.
Cross-national trends suggest that elections with candidate quotas often fail to meet their mandates. This is particularly true among the African cases included in this analysis. Perhaps this occurs because parties are reluctant to displace male politicians. Yet, as previous research indicates, too few candidate quotas include enforcement mechanisms to incentivize adherence. Despite regularly meeting their mandates, reserved seats also face an uphill battle. Aggregate data and an analysis of reserved seats in Uganda and Kenya show that these policies secure space for women in the legislature but may also limit the ability of women to compete for elected positions outside of that separate designation.
Uganda and Kenya represent mixed results for gender quotas. No doubt, reserved seats have contributed to increased women’s representation in both countries. These policies perform well at doing exactly what they are designed to do—attaining a minimum number of women in the legislature. Yet women in Uganda and Kenya rarely compete for or win in regular constituencies. This suggests that in the long run, the policy may not be effective at promoting sustainable representation for women. In essence, these quotas bring more women into office without threatening male dominance of the political space.
Why, then, are some women able to vie for and successfully secure open seats? First, the literature suggests that women will use reserved seats as stepping stones to later pursue regular constituencies. In both Uganda and Kenya, this is the general expectation among citizens and policymakers. The empirical evidence suggests that, to the contrary, women holding reserved seats rarely attempt to shift to open seats. Why? The public tends to view reserved seats as less legitimate. As a result, few women in reserved seats are able to accumulate incumbency advantages that will help them pursue open seats. When they do, they are more likely to remain in the same reserved seat for decades rather than risk shifting to open constituencies. Second, constituency-level data from both countries highlights several political/ structural and social factors that may contribute to female candidacy in open seats. These include the number of regular constituencies represented by the reserved seat, incumbency effects, previous experiences with female MPs, and fertility rates. In sum, the findings suggest that to promote sustainable representation, countries must balance implementation procedures that promote the elected legitimacy of reserved seats against those that encourage women to seek open (non-quota) seats. Without this balance, reserved seats are likely to establish a ceiling for women’s representation.
The findings of this paper have implications for both policymakers and academics. As previous research demonstrates, most gender quotas are designed for equality of opportunity (Dahlerup Reference Dahlerup2007). Yet sustainable representation emphasizes equality of result. Therefore, careful consideration of implementation procedures may benefit women’s representation in the long run. For academics, this paper illuminates relatively unexplored terrain—how the mechanics of gender quotas influence their effectiveness. This suggests a new research agenda that moves beyond descriptive representation and begins thinking about sustainable outcomes. There is need for more detailed study about how gender quota provisions fit with existing electoral structures, and whether if, over time, they are able to reshape these structures to allow for greater inclusion of women. Future research in this regard could expand the universe of cases to consider the effectiveness of candidate quotas—which presently make up the majority of legal quotas—or even voluntary provisions. It is hoped that the research presented here will inspire others to pursue similar endeavors, whether at the small- or large-N level.
Funding Sources
Financial support for this research was provided by the O. Ruth McQuown Scholarship (AY 2015–2016), the University of Florida College of Liberal Arts & Sciences Dissertation Fellowship (Summer 2016), and the University of Florida Department of Political Science Summer Research Funding (Summer 2016).
Acknowledgments
The author wishes to thank Michael Bernhard, Jennifer Boylan, Benjamin Smith, and Paige L. Schneider, who provided helpful comments on early drafts of this paper. I am indebted to the participants of the African Women in Power Workshop at the University of California-Berkeley, September 3–4, 2017, who provided careful feedback during the final stages of writing. This includes Leonardo R. Arriola, Gretchen Bauer, Amanda Clayton, Matthew Gichohi, Martha C. Johnson, Alice Kang, Chiedo Nwankwor, Melanie Thompson, and Aili Mari Tripp. Eric J. Lake provided comments and intellectual support throughout the entire process, without which this paper would likely remain lost among fieldwork notes. Finally, I wish to thank the members of the African Studies Association 2017 graduate student paper prize committee—Emily Osborn, Benjamin N. Lawrance, and Gretchen Bauer—and four anonymous reviewers at African Studies Review for seeing potential in the paper and helping to shape it into its present form. Any remaining errors and omissions remain solely the author’s responsibility.



