


1. Introduction
Globally, glacier retreat has reached historically unprecedented rates (e.g., Zemp and others, Reference Zemp2015) in response to anthropogenic greenhouse gas emissions (Roe and others, Reference Roe, Christian and Marzeion2021) that are predominantly from the combustion of fossil fuels (Wolf and others, Reference Wolf2025). In western Canada and the United States, glaciers lost ∼23% of their mass between 2000 and 2023 (The GlaMBIE Team, 2025). Such mass loss is resulting in glacier disappearance in the United States’ Pacific Northwest, including the state of Oregon (Fig. 1a) (e.g., Pelto, Reference Pelto2010; Fountain and others, Reference Fountain, Glenn and Mcneil2023; Bakken-French and others, Reference Bakken-French, Boyer, Southworth, Thayne, Rood and Carlson2024; Pelto and Pelto, Reference Pelto and Pelto2025).
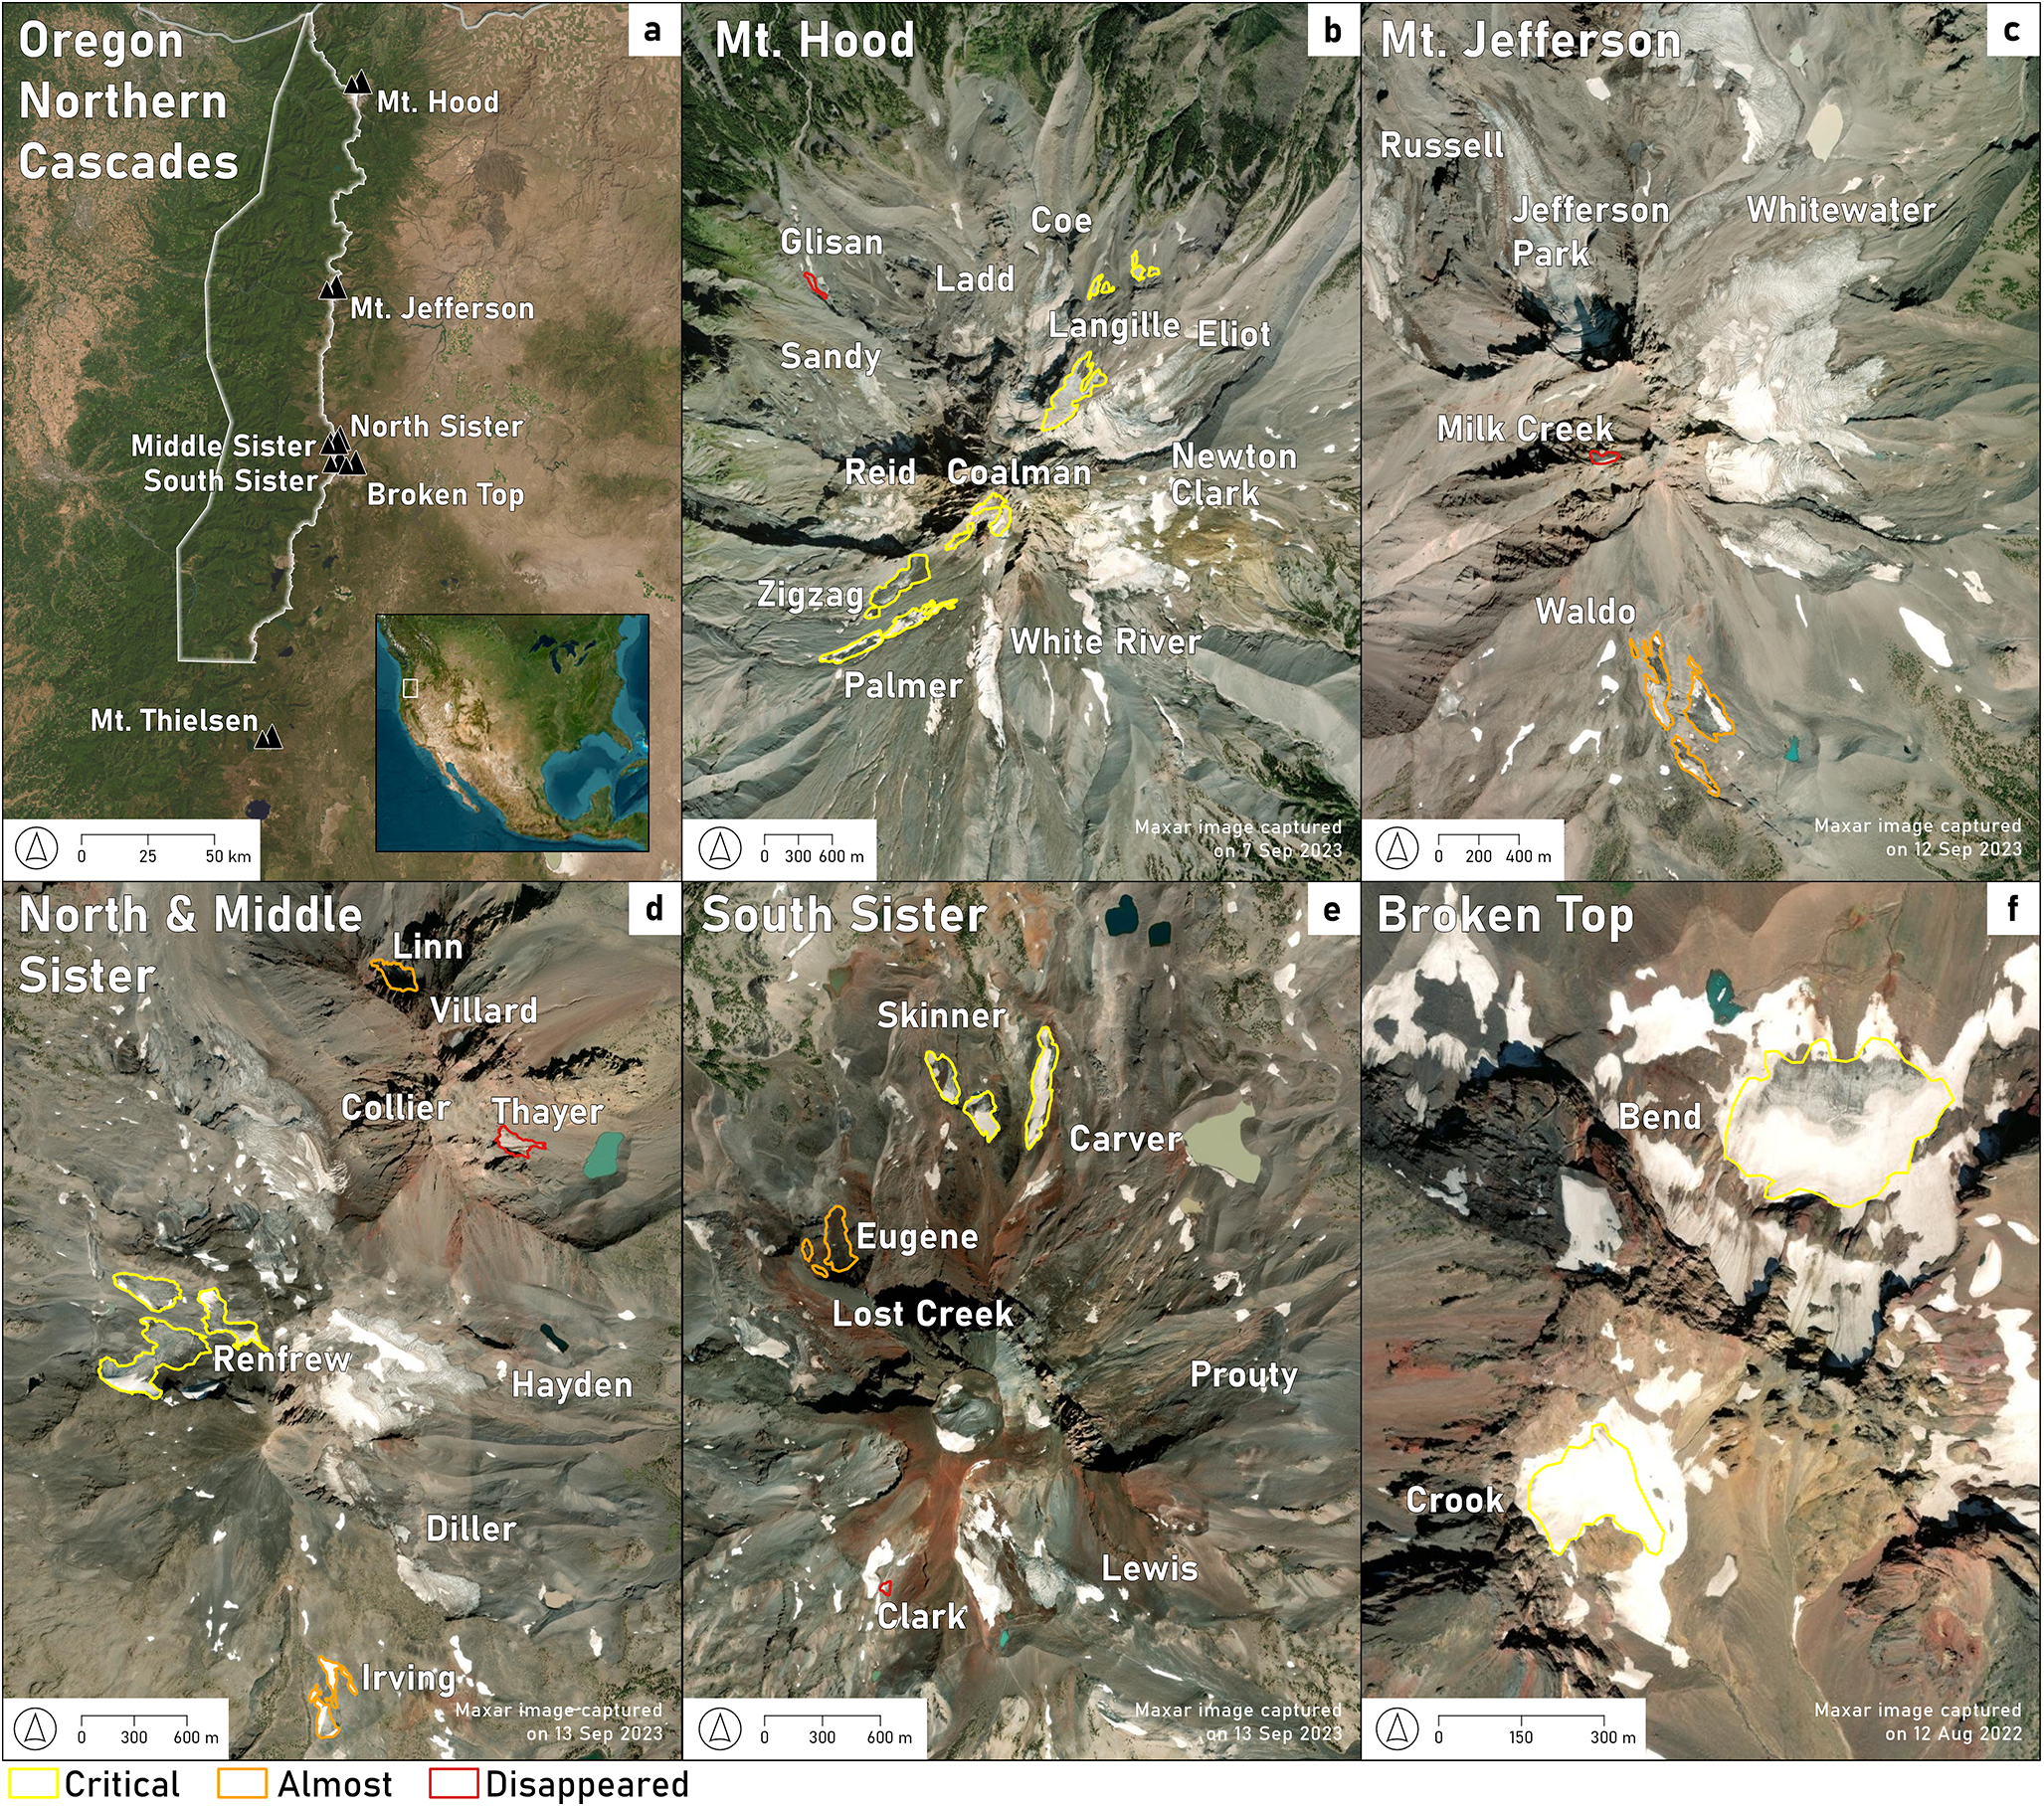
Location of Oregon glacierized volcanoes (a) with inset showing location. The Oregon North Cascade climate division is outlined. Glaciers discussed in text for Mt. Hood (b), Mt. Jefferson (c), North and Middle Sisters (d), South Sister (e) and Broken Top (f). Glacier outlines were manually digitized from the imagery shown here, field mapping and supplemental Sentinel-2 imagery. In the case of (f), the imagery shown is from 12 August 2022, but the Broken Top glacier outlines were finalized using 19 September 2023 Sentinel-2 imagery due to the lack of 2023 Maxar imagery for this volcano. Yellow outline critically endangered; orange outline almost disappeared; red outline disappeared. Imagery from ESRI (2024).

The Cascade volcanic range of the Pacific Northwest consists of 14 glacierized volcanoes from northern California to Oregon, and then Washington. Based on the extinct glacier database of the Global Land Ice Measurements from Space (GLIMS) of the U.S. National Snow and Ice Data Center, there are no reported extinct glaciers on Mt. Shasta in California as of 2025 (NSIDC, 2025; Raup and others, Reference Raup, Andreassen, Boyer, Howe, Pelto and Rabatel2025). In Washington (excluding Mt. St. Helens due to its geologically recent eruption that impacted its glaciers), no glaciers are noted as extinct on Mt. Adams, while two glaciers are gone in the Goat Rocks (a series of volcanic vents) and one glacier has disappeared on Mt. Rainier (NSIDC, 2025; Raup and others, Reference Raup, Andreassen, Boyer, Howe, Pelto and Rabatel2025). Although no glaciers are listed as extinct on Glacier Peak and Mt. Baker farther north in Washington, both have extinct glaciers that used to flow on ridges extending from the volcanoes’ flanks (one and three extinct glaciers, respectively) (NSIDC, 2025; Raup and others, Reference Raup, Andreassen, Boyer, Howe, Pelto and Rabatel2025).
In the early 1980s, the Oregon Cascades had 35 named glaciers distributed across seven volcanoes (Fig. 1a), with one glacier (Palmer Glacier; Fig. 1b) ceasing to flow on Mt. Hood by the 1990s (Fountain and others, Reference Fountain, Glenn and Mcneil2023; Bakken-French and others, Reference Bakken-French, Boyer, Southworth, Thayne, Rood and Carlson2024). Fountain and others (Reference Fountain, Glenn and Mcneil2023) provided an updated inventory for the other 34 glaciers using remote sensing imagery from 2015, 2016, 2018, or 2020, but with no field observations to check imagery interpretation. As of 2015–20, six of the 34 glaciers that existed in 2000 were listed as no longer being glaciers (Fountain and others, Reference Fountain, Glenn and Mcneil2023).
With 2020 as the most recent observation, which is for only one of the seven volcanoes, the Fountain and others (Reference Fountain, Glenn and Mcneil2023) inventory missed the effects of post-2020 warmth (Bakken-French and others, Reference Bakken-French, Boyer, Southworth, Thayne, Rood and Carlson2024). This period includes one of the most extreme heatwaves ever recorded on Earth in late June 2021 (Thompson and others, 2022) that impacted glaciers in the Pacific Northwest (Pelto and others, Reference Pelto, Dryak, Pelto, Matthews and Perry2022). In Oregon, glaciers are also experiencing increased rockfall and debris cover, necessitating field observations to accurately map glacier extent and confirm glacier flow (Bakken-French and others, Reference Bakken-French, Boyer, Southworth, Thayne, Rood and Carlson2024). Furthermore, remote-sensing-alone investigations that use snow/ice area to delineate between flowing glaciers and a perennial snowfield can mischaracterize features, whereas field verification can directly determine such characterizations (Pelto and Pelto, Reference Pelto and Pelto2025). Here, using field observations, we document vanishing glaciers in the Oregon Cascades and categorize them according to our interpretation of the three glacier categories of the Global Glacier Casualty List (GGCL; Boyer and Howe, Reference Boyer and Howe2024; Howe and Boyer, Reference Howe and Boyer2025).
2. Methods
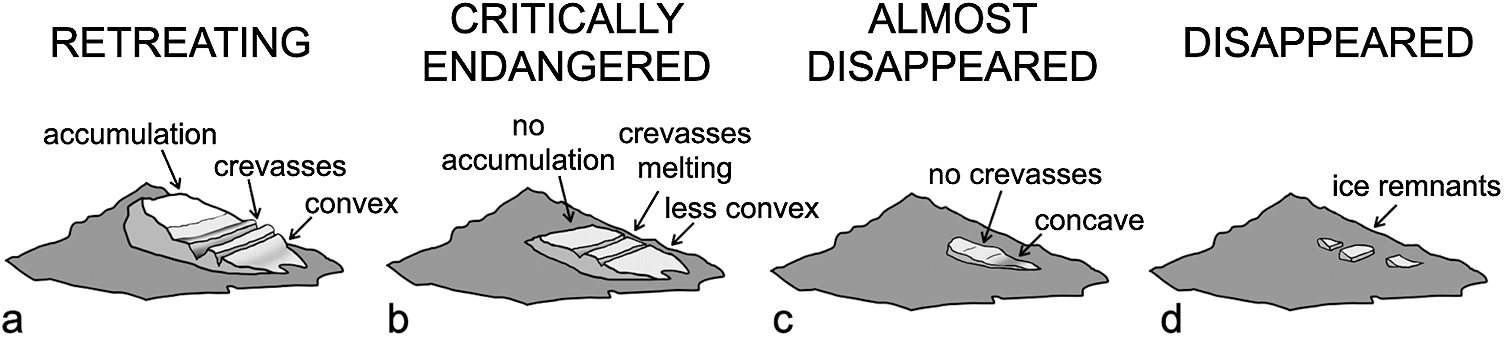
We used field observations from August to October from 2020 to 2024 for the 34 glaciers on the seven glacierized volcanoes in the Oregon Cascades (Fig. 1) to place them in the three classifications used by the GGCL: ‘critically endangered’, ‘almost disappeared’ and ‘disappeared’ (Fig. 2) (Boyer and Howe, Reference Boyer and Howe2024). The categories are not precisely defined by the GGCL (Boyer and Howe, Reference Boyer and Howe2024), but Howe and Boyer (Reference Howe and Boyer2025) define a glacier to be critically endangered if it is predicted to expire by 2050. Here we use these three GGCL categories and define a ‘disappeared’ glacier to be between a stagnant ice mass and complete absence. An ‘almost disappeared’ glacier is expected to reach disappeared status any year now. A ‘critically endangered’ glacier is expected to reach disappeared status by 2050. We note that our study is not a full glacier inventory for these volcanoes, nor do these classifications correspond with the methodology for glacier inventories (Müller and others, Reference Müller, Caflisch and Müller1977). Rather, we classify Oregon Cascades glaciers within these GGCL categories based on our interpretation of these categories.
Graphic depicting glacier transition from a retreating (a) to critically endangered (b) to almost disappeared (c) to disappeared (d). Field-based characteristics noted.

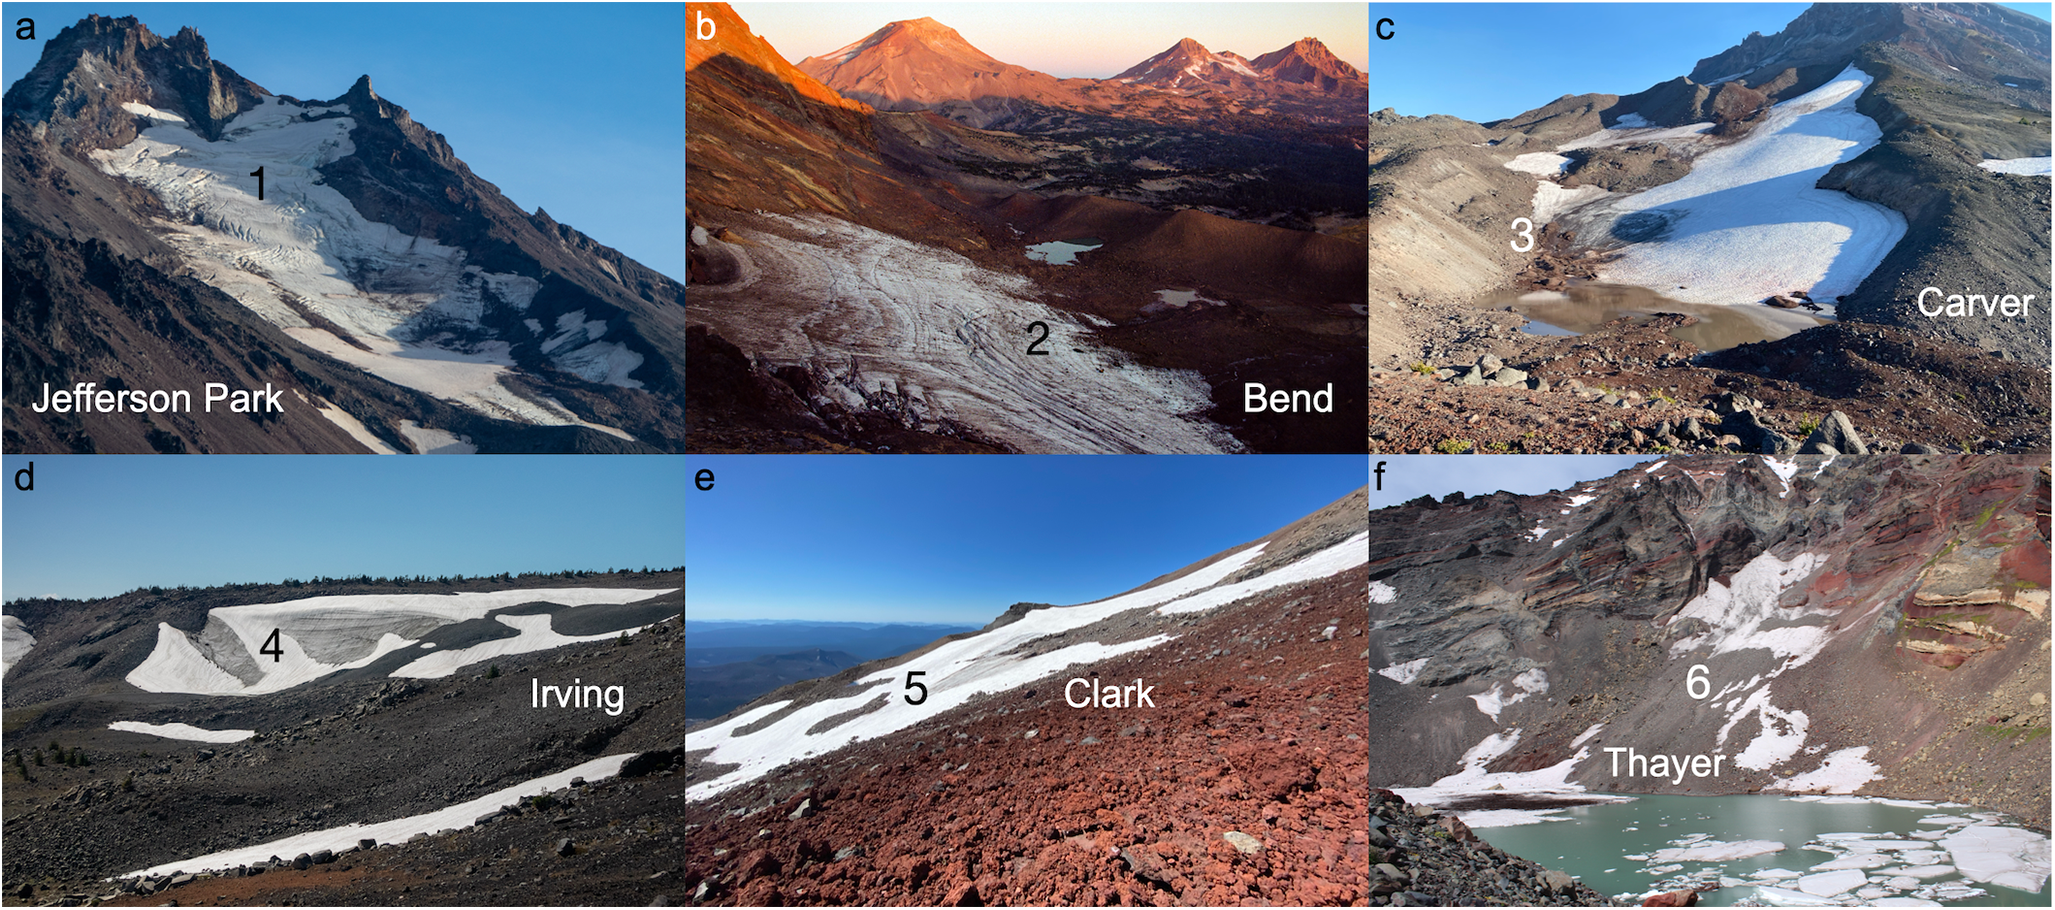
Our criteria thus focused on determining if a glacier was still actively deforming and flowing under its own weight or had stagnated (Fig. 2). Evidence of flow was the presence of crevasses where we noted if the crevasses were being actively maintained open by flow (Figs. 2a, 3a) or were melting in on themselves, implying waning ice flow (Figs. 2b, 3b) (Leigh and others, Reference Leigh, Stokes, Carr, Evans, Andreassen and Evans2019; Bakken-French and others, Reference Bakken-French, Boyer, Southworth, Thayne, Rood and Carlson2024; Pelto and Pelto, Reference Pelto and Pelto2025). Termini were examined in the field. Termini were classified as either having a convex or concave topographic profile, where the profile is defined as the cross-sectional view of elevation along the glacier flow line. A convex terminus was taken as indicating ice flow (Figs. 2a, 2b, 3a, 3c) while a concave terminus was used as evidence for the lack of ice flow (Figs. 2c, 3d) (Meier and Post, Reference Meier and Post1962; Leonard and Fountain, Reference Leonard and Fountain2003; Lillquist and Walker, Reference Lillquist and Walker2006; Leigh and others, Reference Leigh, Stokes, Carr, Evans, Andreassen and Evans2019; Bakken-French and others, Reference Bakken-French, Boyer, Southworth, Thayne, Rood and Carlson2024). Each of these criteria was checked with high-resolution (0.3 m) Maxar (Vivid) imagery captured on 8 and 13 September 2023 for all of the volcanoes except Broken Top where a 12 August 2022 image was used (ESRI, 2024) (Fig. 1). Lastly, accumulation area ratios consistently smaller than 0.3 are indicative of glaciers that are no longer viable in the current climate (Figs. 2b, 3b) (Pelto, Reference Pelto2010). We thus mapped the area of any remaining prior-winter snow at the end of summer using Sentinel-2 satellite imagery provided in the application CalTopo (www.caltopo.com) and then calculated the accumulation area ratio by dividing by the area of the glacier.
Example field observations used to place glaciers in GGCL categories. (a) Jefferson Park Glacier on Mt. Jefferson is an actively flowing glacier (1) that is retreating but not considered critically endangered. (b) Bend Glacier is critically endangered with crevasses melting in on themselves (2) and lacks an accumulation zone. (c) Carver Glacier is critically endangered with a convex terminus (3). (d) Irving Glacier has almost disappeared with a concave terminus and no crevasses (4). (e) Clark Glacier has disappeared and consists only of remnant patches of ice (5). (f) The basin that used to hold Thayer Glacier, which now has debris covering stagnant ice (6).

We placed a glacier in the disappeared status if its ice was completely gone or if it lacked evidence of flow (no crevasses and concave terminus), lacked an accumulation zone and the remaining ice was small, disconnected remnants to buried stagnant ice (Figs. 2d, 3e, 3f). An almost disappeared glacier lacked evidence of flow (no crevasses, concave terminus) and lacked an accumulation zone, but the remaining ice covered an area that still resembled its former flowing glacier area (Figs. 2c, 3d). A critically endangered glacier showed some evidence of flow with a convex terminus (Fig. 3c) or had crevasses, but the crevasses were remnants melting in on themselves (Figs. 2b, 3b), and the glacier lacked an accumulation area (Fig. 2b), or the accumulation area ratio was consistently below 0.3.
There is thus a clear demarcation between a critically endangered glacier that still flows (Fig. 2b) and an almost disappeared glacier that does not flow (Fig. 2c). We placed a glacier in the disappeared category if its ice was completely gone or if the remaining ice was small, disconnected remnants to just buried stagnant ice.
The 2023 extents of these glaciers (Fig. 1) were mapped over the course of five years following the methodology described in Bakken-French and others (Reference Bakken-French, Boyer, Southworth, Thayne, Rood and Carlson2024). Specifically, we used late-summer Sentinel-2 satellite imagery from 2020, 2021, 2022 and 2023 to manually develop initial glacier outlines. We used manual digitization because of the debris cover on many of these glaciers (Paul and others, Reference Paul2013). These outlines were subsequently revised iteratively by field mapping of termini during the late summers of 2020–23 when glacier termini were physically walked shortly after the Sentinel-2 satellite imagery was available. These Sentinel-2/field-based extents were finalized by manual digitization of 8 and 13 September 2023 Maxar imagery. The one exception is Broken Top (Fig. 1f), which lacked September 2023 Maxar imagery. We thus used 12 August 2022 Maxar imagery and then 19 September 2023 Sentinel-2 imagery to finalize the 2023 extents of Bend and Carver glaciers on Broken Top. In late summer 2024, field verification of the final 2023 outlines was conducted. Bakken-French and others (Reference Bakken-French, Boyer, Southworth, Thayne, Rood and Carlson2024) estimated a conservative final area uncertainty for this iterative methodology of ±7% which we adopt here.
3. Climate data
We assessed the changing regional climate using May–October average temperature and November–April cumulative precipitation for the Oregon Northern Cascades climate division of the U.S. National Oceanic and Atmospheric Administration (NOAA, 2025) (Fig. 1a). The Oregon Northern Cascades climate division is the climatic region encompassing the glacierized Oregon Cascades volcanoes with the exception of Mt. Thielsen, which is only ∼40 km south of the climate division. May–October is the maximum length of the melt season, while November–April is the maximum length of the accumulation season in the Oregon Cascades (Bakken-French and others, Reference Bakken-French, Boyer, Southworth, Thayne, Rood and Carlson2024). We calculate the change in temperature from the 1975 to 1984 mean. We analyze these data for the period 1980–2024.
4. The disappearing glaciers
With Lathrop Glacier on its north face, Mt. Thielsen was the southernmost glacierized volcano in the Oregon Cascades in the latter half of the 20th century. Around the turn of the millennium, this small glacier was still present (Lafrenz, Reference Lafrenz2001), and a photo shared with us by M. Beagle (written communication 23 July 2021) indicated ice presence on 26 August 2012. Fountain and others (Reference Fountain, Glenn and Mcneil2023) listed Lathrop as gone as of an unknown date. Our visit in 2020 confirmed the disappearance of Lathrop Glacier (Table 1).
Oregon Cascades named glaciers, and their GGCL category as of 2023–24. Data in columns year, area and 2015–20 status from Fountain and others (Reference Fountain, Glenn and Mcneil2023). Note that the 2023 areas for Crook and Bend glaciers on Broken Top are based on 2022 Maxar imagery and 2023 Sentinel-2 imagery.

Broken Top has two named glaciers: Bend and Crook (Fig. 1f). Fountain and others (Reference Fountain, Glenn and Mcneil2023) included these as glaciers in their inventory as of 2018. Our field observations place both glaciers as critically endangered because they consistently lack accumulation zones and have concave termini but do have crevasses that are melting in on themselves (Fig. 3b; Table 1).
South Sister had seven named glaciers that were flowing as of 2000 (Ohlschlager, Reference Ohlschlager2015), four of which we place in the GGCL categories: Clark, Carver, Skinner and Eugene (Fig. 1e; Table 1). Fountain and others (Reference Fountain, Glenn and Mcneil2023) listed Clark, Carver and Skinner as snowfields in 2018, with Eugene being an active glacier. Whereas Clark has disappeared, with only a small remnant of ice remaining as of 2020 (Fig. 3e), our field observations require revisions to the other three glacier statuses. In 2020, we found that Eugene lacked crevasses and had a concave terminus but still consisted of an intact ice body. As such, we place it in the almost disappeared category, as it is not an actively flowing glacier but has yet to fragment into multiple remnant ice bodies. Conversely, both Carver and Skinner lack accumulation areas, but have convex termini (Fig. 3c) and crevasses that are melting in on themselves, implying potential ice flow. We list them as critically endangered.
Middle Sister had four named flowing glaciers in 2000 (Ohlschlager, Reference Ohlschlager2015), of which two are in the GGCL categories: Irving and Renfrew (Fig. 1d; Table 1). Whereas Fountain and others (Reference Fountain, Glenn and Mcneil2023) listed Irving as a snowfield in 2018, glacier ice still remains, although it does not flow. We place Irving as almost disappeared because this ice area is continuous but has a concave terminus and lacks crevasses and an accumulation zone (Fig. 3d). Fountain and others (Reference Fountain, Glenn and Mcneil2023) found Renfrew to still be a glacier in 2018. Renfrew has crevasses that are melting in on themselves, but its terminus is concave, and it has no accumulation zone. We thus consider Renfrew to be critically endangered.
North Sister also had four named flowing glaciers in 2000 (Fig. 1d) (Ohlschlager, Reference Ohlschlager2015). Fountain and others (Reference Fountain, Glenn and Mcneil2023) listed Thayer Glacier as completely gone, and we identify it as disappeared (Table 1), but we have found remnant stagnant ice that underlies debris (Fig. 3f). In contrast, Fountain and others (Reference Fountain, Glenn and Mcneil2023) documented Linn as an active glacier in 2018. By 2020, the glacier lacked crevasses and an accumulation zone, and its terminus was concave. Linn is still a continuous ice body, and so we list it as almost disappeared (Table 1).
Mt. Jefferson had five glaciers with Fountain and others (Reference Fountain, Glenn and Mcneil2023) listing them all as active glaciers in 2020 (Fig. 1c). By 2023, we found that Milk Creek Glacier was almost entirely gone, that is, had disappeared, with only a small, stagnant (∼0.006 km2) ice patch remaining (Table 1). Fountain and others (Reference Fountain, Glenn and Mcneil2023) also listed Waldo Glacier as active in 2020. Subsequently, Waldo has lacked crevasses and an accumulation zone and has a concave terminus. We thus consider Waldo to have almost disappeared, because it is still a contiguous ice body (Table 1).
For the 11 named glaciers on Mt. Hood that existed in 2000, we use our observations in Bakken-French and others (Reference Bakken-French, Boyer, Southworth, Thayne, Rood and Carlson2024) to place four of them into the GGCL categories (Fig. 1b; Table 1). Glisan Glacier had stagnated by 2020, and we categorize it as disappeared because the glacier has broken up into a discontinuous ice body. Coalman, Zigzag and Langille glaciers are all still flowing. However, all three have crevasses that are melting in on themselves and have concave termini. Zigzag lacks an accumulation zone, whereas Coalman and Langille have small (<0.3) accumulation zones. As such, we consider these three glaciers to be critically endangered.
5. Discussion and conclusion
Based on our field observations, we place 17 of the 34 named glaciers that existed in the Oregon Cascades at some GGCL status (Table 1). This means that half of the Oregon Cascades named glaciers that existed in 2000 have now either disappeared (∼15%), will disappear in the coming few years (∼12%), or will disappear by 2050 (∼24%).
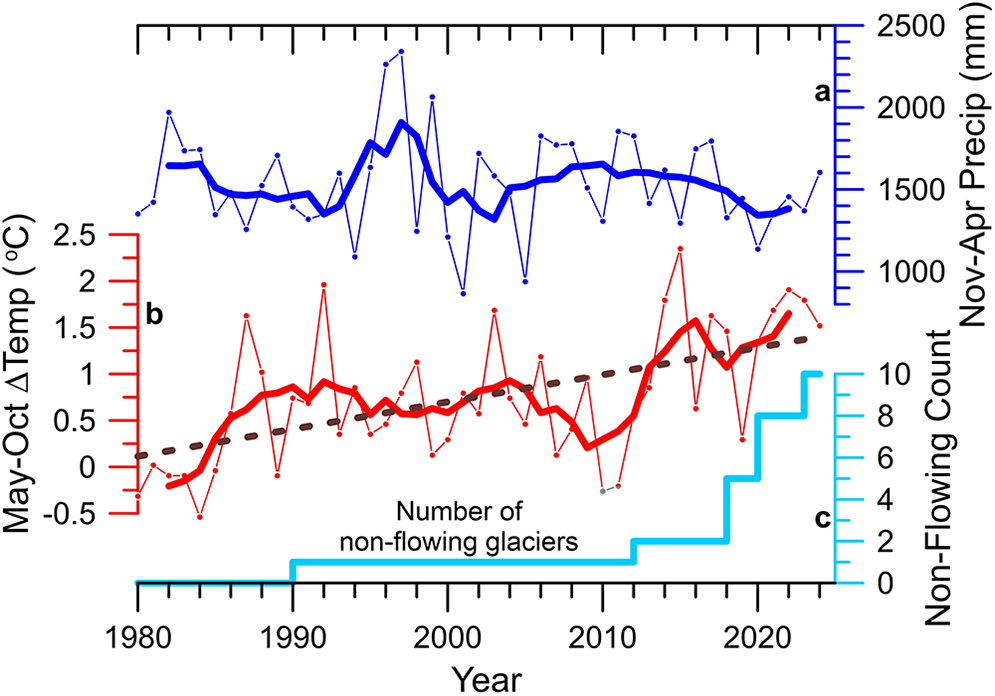
When Palmer Glacier is included, ten named glaciers in the Oregon Cascades have ceased to flow since 1990, nine of which occurred since 2010 (Fig. 4c). Six of these non-flowing glaciers have disappeared, while another four have almost disappeared (Table 1). We consider the six disappeared glaciers as ‘extinct’ in the terminology of GLIMS (Raup and others, Reference Raup, Andreassen, Boyer, Howe, Pelto and Rabatel2025). These six lack evidence of ice flow and past ice flow (e.g., Fig. 3e, 3f), which is the definition of a glacier according to Cogley and others (Reference Cogley2011). The four almost disappeared glaciers lack evidence of ice flow but contain visible folded ice layers indicative of past ice flow (e.g., Fig. 3d); these would not be considered extinct glaciers following Cogley and others (Reference Cogley2011). However, using a definition that requires glaciers to have evidence of current movement would define the four almost disappeared glaciers as being ‘extinct’. As mentioned by Raup and others (Reference Raup, Andreassen, Boyer, Howe, Pelto and Rabatel2025), the transition from ‘glacier’ to ‘extinct glacier’ is complex and GLIMS follows the recommendation of the regional collaborators for registering a glacier as ‘extinct’. For comparison, three glaciers have been officially recorded as extinct on Washington’s Cascade volcanoes, noting Mt. St. Helens’ recent eruptive impacts, and none have been officially reported for Mt. Shasta in California (NSIDC, 2025).
November–April precipitation (a) and May–October temperature change relative to 1975–84 mean (b) for the Oregon Northern Cascades climate division (NOAA, 2025). Symbols are yearly data, thick lines are 5-year running mean, and the dashed line is a significant (p < 0.05) trend. (c) Number of non-flowing glaciers in the Oregon Cascades.

The five glaciers that disappeared in the Oregon Cascades since 2000 have remnant stagnant ice bodies that range in area from 0.000 to 0.025 km2, which are distributed across five volcanoes from Mt. Thielsen in the south to Mt. Hood in the north (Table 1). The four almost disappeared glaciers have stagnant ice areas between 0.025 and 0.097 km2, underlining their greater area relative to disappeared glaciers, despite both categories lacking evidence of current ice flow. These four almost disappeared glaciers are restricted to one on each of the Three Sisters volcanoes and on Mt. Jefferson. The eight critically endangered glaciers have areas of 0.033 to 0.239 km2, which overlap with almost disappeared glaciers, showing how glacier area alone is not sufficient to distinguish between a flowing glacier and an ice mass that used to flow (Pelto and Pelto, Reference Pelto and Pelto2025). These eight critically endangered glaciers are distributed across the Oregon Cascades glacierized volcanoes, spanning from Broken Top to Mt. Hood, but with North Sister lacking a glacier in this GGCL category.
May–October average temperature for the Oregon Northern Cascades climate division (Fig. 1a) has significantly (p = 0.0002) warmed at ∼0.3°C per decade from 1980 to 2024 (Fig. 4b). The 2020–24 May–October mean was ∼1.7°C significantly (p < 0.0001) warmer than the 1975–84 mean. Conversely, there was no significant (p = 0.6353) trend in November–April precipitation (Fig. 4a). While the precipitation amount has not significantly changed (p = 0.4240), spring (e.g., April) heatwaves in the Pacific Northwest have increased since the 1990s, which can reduce snowpack accumulation (Musselman and others, Reference Musselman, Addor, Vano and Molotch2021; Reyes and Kramer, Reference Reyes and Kramer2023).
Given the statistically significant trend in May–October temperature, we attribute the glacier retreat in the Oregon Cascades to increasing temperature, including the impact of spring heat on snowpack, that has moved half of their named glaciers into a GGCL category and caused ten glaciers to stagnate, nine of which occurred after 2010 (Fig. 4c). This temperature control on glacier retreat is similar to what Bakken-French and others (Reference Bakken-French, Boyer, Southworth, Thayne, Rood and Carlson2024) found for overall glacier recession on Mt. Hood since 1900 and what Roe and others (Reference Roe, Christian and Marzeion2021) demonstrated for glacier recession in general. We conclude that glacier retreat and disappearance will continue in the Oregon Cascades until this warming trend is reversed.
Acknowledgements
We thank the U.S. National Forest Service for permitting research access to wilderness areas. Research was supported by a Mazamas Mountaineering Club conservation grant. The Oregon Glaciers Institute is a 501(c)(3) nonprofit supported by private donations. We also thank two reviewers for their insights that improved this manuscript, along with the Associate Chief Editor L. Andreassen and Scientific Editor L. Ruiz. All data in this manuscript are available upon request to the authors and will be available in the GLIMS Glacier Viewer (https://www.glims.org/maps/glims).

 Open access