


Introduction
Luminescence dating has become an indispensable method for establishing the chronological framework of sedimentary landforms and the anthropogenic or environmental proxies they contain (e.g., Lian and Roberts, Reference Lian and Roberts2006; Rhodes, Reference Rhodes2011; Mahan and Dewitt, Reference Mahan, Dewitt and Bateman2019; Murray et al., Reference Murray, Arnold, Buylaert, Guérin, Qin, Singhvi, Smedley and Thomsen2021). The technique is especially useful in cases where there is no organic matter available for radiocarbon dating or the material is beyond the useful limit (∼50 ka) of that method; luminescence dating is also a useful tool for dating the firing of pottery or other heated material (Roberts and Lian, Reference Roberts and Lian2015). Reviews of the evolution of the technique for dating the deposition and burial of sediment can be found in Roberts (Reference Roberts1997), Lian and Roberts (Reference Lian and Roberts2006), and Mahan and Dewitt (Reference Mahan, Dewitt and Bateman2019), while reports on sample collection and preparation together with the application of the technique to various depositional environments can be found in Bateman (Reference Bateman2019). Like most physical techniques, the development of luminescence dating was strongly influenced by the speed at which instrumentation used to measure the phenomenon could be designed, built, tested, and applied to solve various research problems. For that reason, much of its early development was performed by experimental physicists in their laboratories.
In this paper we give a personal and concise account of the history of the development of luminescence dating from the perspective of instrumentation, focusing primarily on that associated with luminescence measurements. Our narrative is based on our experiences from the 1970s and 1980s to the present: first in the laboratories where we were trained (see Acknowledgments), then through interactions with other laboratories collaborating with these facilities, and later through our own subsequent work. We fully acknowledge that many other laboratories also contributed significantly to the development of the field.
The luminescence mechanism and early applications
Luminescence refers to the light emitted by some materials, specifically insulators, in response to an external stimulus, such as heat or light – thermoluminescence (TL) and optically stimulated luminescence (OSL), respectively – or electromagnetic radiation, pressure, or a chemical reaction (e.g., McKeever, Reference McKeever1985). The phenomenon of luminescence has been known for more than 450 years (Harvey, Reference Harvey1957). The earliest known report is likely that of Gesner (Reference Gesner1555), while Boyle (Reference Boyle and Boyle1664) is credited with conducting the first scientific experiments on the subject.
In the case of natural crystalline minerals, luminescence arises due to the presence of impurity and defect sites in the crystal lattice. Some of these sites act as traps for free charges, such as electrons and holes, that when a mineral absorbs ionizing radiation from the environment. When stimulated by light or heat, electrons are evicted from some of the traps and recombine at other sites (recombination centres) in the crystal lattice where excess energy is emitted as light (luminescence). Further stimulation will not result in luminescence unless the crystal absorbs more ionizing radiation. A detailed discussion of the physics behind the luminescence process can be found in Aitken (Reference Aitken1985, Reference Aitken1998), McKeever (Reference McKeever1985), Chen and McKeever (Reference Chen and MCKeever1997), Preusser et al. (Reference Preusser, Degering, Fuchs, Hilgers, Kadereit, Klasen, Krbetschek, Richter and Spencer2008), and Murray et al. (Reference Murray, Arnold, Buylaert, Guérin, Qin, Singhvi, Smedley and Thomsen2021).
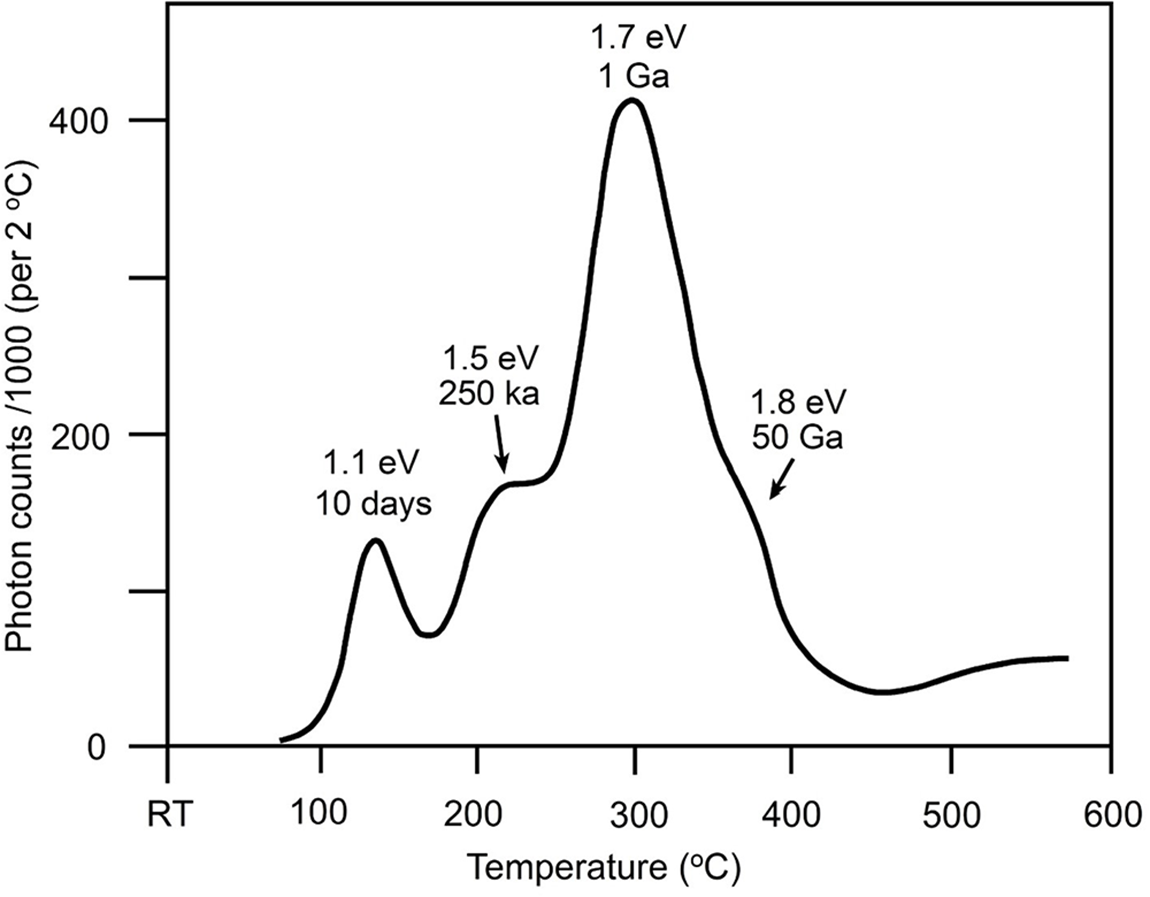
Initial studies of luminescence used TL as a tool to explore impurity-related defects in crystals and other insulators. This involved studying the nature of plots of TL intensity as a function of temperature. The resulting “glow curves” (Fig. 1) consist of several peaks, some of which overlap, where each peak is associated with an electron trap or a collection of traps. TL peaks that appear at higher temperatures in the glow curve represent traps with longer thermal lifetimes (i.e., deep traps) (Fig. 1). As luminescence is dim and cannot usually be seen with the naked eye, photomultiplier devices are needed to measure it. For example, Randall and Wilkins (Reference Randall and Wilkins1945) used an “electron multiplier type of photocell” to produce glow curves from which they could study trap depth in phosphors. However, it was with the invention of the electrostatic photomultiplier tube (PMT) in the late 1930s, and its subsequent refinements through the 1940s, that the study and application of TL accelerated (Fig. 2) (Aitken, Reference Aitken1985). It was the breakthrough paper by Daniels et al. (Reference Daniels, Boyd and Saunders1953), which demonstrated the potential of TL for geological and archaeological applications, including its potential as a dating tool, that ignited widespread research into the viability of TL as a geochronometer. The technique relies on the removal of trapped charge by an event, such as heating, which effectively sets the “clock” to zero. By the early 1960s, various researchers in Europe and North America were applying TL analysis to ancient pottery, but it wasn’t until the work by Aitken et al. (Reference Aitken, Tite and Reid1964), and by others a few years later in Japan, Denmark, and the USA, that it was developed for dating archaeological ceramics and subsequently for authenticity testing of fired artefacts (Aitken, Reference Aitken1985). The minerals of choice for dating are quartz or feldspar. This is because they are common in the environment and their luminescence properties are relatively well understood. Other minerals, such as zircon and calcite have been given some attention (McDougall, Reference McDougall1968).
Example of a plot of thermoluminescence (TL) intensity versus temperature, or glow curve, for a quartz sand that had been given a laboratory gamma dose of 40 Gy (modified from figure 42 in Godfrey-Smith, Reference Godfrey-Smith1991). In general, glow curves consist of various peaks, including some that overlap or are completely hidden by other peaks. In this example four peaks are seen. The trap depths in electronvolts (eV), and associated thermal lifetimes at ambient temperature, are shown for each peak.

Schematic diagram of a photomultiplier tube (PMT). An incident photon is absorbed by the photocathode, held at a positive voltage, resulting in the ejection of a photon (the photoelectric effect). This photoelectron is focused onto a dynode at a higher positive voltage and this results in many more electrons being emitted. This process is repeated through a series of dynodes, each at a progressively higher positive voltage, until the multiples of electrons are collected at the anode where a current is measured using supporting electronics. PMTs are highly efficient in measuring small amounts of light and have been an essential tool in luminescence research since the 1930s despite the introduction of charge coupled devices (CCDs) in the 1970s.

TL dating of sediments
For sediments, the TL resetting event event being dated is either exposure to sunlight during transport and deposition, or exposure to sufficient heat. The first published research on the TL dating of sediments was by Shelkoplyas and Morozov (Reference Shelkoplyas and Morozov1965), Morozov (Reference Morozov1968), and Shelkoplyas (Reference Shelkoplyas1971) in the former Soviet Union, but these papers were not available to researchers in the West until the review by Dreimanis et al. (Reference Dreimanis, Hütt, Raukas and Whippey1978). These early studies did not, however, provide enough information to fully evaluate the results, and there was reason to believe that the techniques employed were unreliable or at least inadequately described (Wintle and Huntley, Reference Wintle and Huntley1982).
In the meantime, independent research by Johnson and Blanchard (Reference Johnson and Blanchard1967) and Bothner and Johnson (Reference Bothner and Johnson1969) demonstrated that the TL dating of sediment showed promise. Similarly promising results were published by Huntley and Johnson (Reference Huntley and Johnson1976) and Wintle and Huntley (Reference Wintle and Huntley1979a). During this time, developments were also being made in China, Poland, and Hungary (Wintle and Huntley, Reference Wintle and Huntley1982), but it was not until the research of Wintle and Huntley (Reference Wintle and Huntley1979a, Reference Wintle and Huntley1979b, Reference Wintle and Huntley1980) that an appropriate method was developed for the TL dating of sediments.
Put simply, what is needed to obtain a luminescence age is an estimate of the laboratory radiation dose that produces the same luminescence intensity as that produced by the radiation dose absorbed in the environment since the resetting event being dated. This is referred to as the equivalent dose (D e), which is estimated by measuring a sample’s (a collection or “aliquot” of grains) luminescence response to increasing doses of laboratory radiation. The luminescence age is then calculated using the ratio between the D e and the rate, R, at which the ionizing radiation was absorbed by the mineral grains while in its natural environment.
In the simplest approach, an additive dose method is used in which several aliquots of the same sample are given progressively increasing laboratory radiation doses. Each aliquot is then heated separately and the resulting TL that arises within a temperature range associated with the release of charge from thermally stable traps is plotted as a function of laboratory dose. A curve is fitted to these data and extrapolated to the dose axis. The D e is then the absolute value of this intercept (Fig. 3). As research progressed, new and more precise methods of determining the D e were developed and tested, though they still relied on constructing dose-response curves (see Lian and Roberts, Reference Lian and Roberts2006 for a review of the different methods of finding D e). The environmental dose rate R, is obtained independently from measured concentrations of the radioisotopes U, Th, K for quartz, with the addition of Rb for feldspar, and a calculated value of the relatively minor (usually) cosmic-ray dose contribution at the geographic location and sample depth (Prescott and Hutton, Reference Prescott and Hutton1994). Radioisotope concentrations are either measured in-house in neighbouring geochemical laboratories, at commercial laboratories, or directly within luminescence dating laboratories using methods such as thick-source alpha counting, beta counting, and high-resolution gamma-ray spectrometry. Ideally, gamma-ray dose-rate measurements are made in situ using a portable gamma-ray spectrometer (Aitken, Reference Aitken1985). Radioisotope concentrations are converted to dose rates using established conversion factors (e.g., Liritzis et al., Reference Liritzis, Stamoulis, Papachristodoulou and Ioannides2013; Cresswell et al., Reference Cresswell, Carter and Sanderson2018; Mahan and Dewitt, Reference Mahan, Dewitt and Bateman2019). Although a range of specialized instruments has been developed for measuring environmental dose rates and administering laboratory radiation doses, a detailed discussion of these is beyond the scope of this paper; a concise review can be found in Mahan and Dewitt (Reference Mahan, Dewitt and Bateman2019).
(Main figure) Example of the most basic method to determine an equivalent dose using TL (modified from figure 1 in Lian and Huntley, Reference Lian, Huntley, Last and Smol2001). Several aliquots of quartz, in this case, are prepared, some are left as is (the naturals, N), whereas others are given increasing doses of laboratory radiation (N + dose) from a 60Co gamma (γ) source, in this case. Typically, several aliquots are used at each dose point. The TL from each aliquot is measured, resulting in glow curves (main figure). (A) The dose-response determined from the sample TL (measured at 5°C per second) that was measured between 355°C and 360°C. (B) Dose axis intercepts plotted as a function of glow curve temperature and the formation of a TL plateau at approximately 350°C that corresponds to an equivalent dose of approximately 80 Gy, which is then divided by the environmental dose rate to get a TL age.

TL instrumentation
Single-aliquot TL readers: the glow oven
The first modern instruments for TL dating were built in-house and employed commercially available bialkali type PMTs (Fig. 2), such as the EMI 9635Q, which have the quantum efficiency needed to convert the weak luminescence emission (comprising photons) to recordable electronic signals that are proportional to the number of photons detected. The PMT is positioned above a vacuum chamber with an optical window, while the sample is mounted on a nichrome or kanthal heater plate within the chamber. The sample is heated at a constant rate, usually at 2°C or 5°C per second, to a high temperature, typically 500–700°C. A chromel–alumel or equivalent thermocouple is spot-welded to the base of the heater plate, and its voltage output is connected to the x-axis of a chart recorder, and also into electronics which control the heating rate. The y-axis records TL intensity derived from the amplified and processed PMT signal output (Fig. 4). At most laboratories these instruments were referred to as “glow ovens”, or “Oxford-style glow ovens” after their invention in Martin Aitken’s laboratory at the University of Oxford. They were also referred to as “Alldred glow ovens”, after John Alldred, who was the primary designer at Oxford, and more generally as “readers”. Soon after their invention these glow ovens became commercially available, but most laboratories with access to machine and electronics workshops built their own systems as this was much more affordable and it allowed greater control over the design, which simplified maintenance and upgrading.
(A) Schematic of the early instrument (glow oven) used to measure TL. See text for details. Modified from figure 1.2 in Aitken (Reference Aitken1985). (B) Photograph of Professor Martin Aitken (1922–2017) in 1989 in one of his laboratories at Oxford University beside an Alldred glow oven and supporting electronics. The glow oven in this photograph has been modified to include an array of infrared LEDs, as described by Spooner et al. (Reference Spooner, Aitken, Smith, Franks and McElroy1990) (within the small collar under the main PMT housing) for optically stimulated luminescence studies of feldspar. A luminescence decay curve characteristic of feldspar can be seen on the screen on the left side of the image. The double-headed “Hacilar” vessel that Professor Aitken is holding is one of several such artifacts, presumed to be ancient, that were shown to be forgeries using TL authenticity testing (see Aitken, Reference Aitken1985, pp. 34–35). The license to publish this image has been acquired from Science Photo Library.

Using a manually operated glow oven is laborious as only one aliquot of a prepared sample (typically several hundreds or more sand grains mounted on an ∼1-cm-diameter stainless steel, aluminum, or platinum disk or cup), is measured at a time. Between measurements the chamber is evacuated and filled with a dry inert atmosphere, such as argon or nitrogen gas. This is needed to minimize unwanted light emitted from the interaction of heated air and grain surfaces (referred to as “spurious” TL), and from the ignition of dust in the chamber. An inert gas also provides an atmosphere around the sample grains, which promotes uniform heating. The atmosphere in the chamber is kept dry by placing a vial of desiccant powder inside, which must be replaced after several measurements. Since it is difficult to maintain the same thermal contact between the heating plate, metal sample disks, and the grains on the disk, in some laboratories a thermal compound paste was applied to the heating plate, which was removed and replaced between measurements, and a light silicon oil was used to adhere the grains to the disk and provide improved thermal contact. Optical glass filters are placed between the vacuum chamber and the PMT to select the luminescence wavelengths of interest and reject infrared (IR) emission from the heater plate. For example, when dating K-feldspar, Schott KG-l and BG-39 filters, together with a Kopp 5-58 filter, are commonly used. The KG-1 and BG-39 filters absorb the unwanted incandescence from the heater plate, and the Kopp 5-58 filter transmits the 400 nm luminescence from K-feldspar used for dating. Some variations on glow oven designs were proposed, including one that used hot nitrogen gas as the source of heat (Bøtter-Jensen, Reference Bøtter-Jensen1978), and another gas-cooled version was developed that used a carbon heating element and a gold-clad copper sample disk (Kelly and Smith, Reference Kelly and Smith1978), but the Oxford-style glow oven remained the most popular, likely because it was less complicated for dating measurements. Irradiation of sample aliquots was commonly done in a separate irradiator, such as a 60Co gamma cell, or by manually placing a 90Sr beta source in a mount located directly above the sample aliquot; much improved operator safety was later achieved by the design of a shielded irradiator housing (e.g., Bailiff, Reference Bailiff1980) (Fig. 5). Having the radiation source onboard reduces the risk of sample grains moving during transport between the reader and the irradiator.
Glow oven used in Ian Bailiff’s laboratory at University of Durham (UK). The PMT housing (A) resting on the glow oven (B) can be replaced with a shielded 90Sr beta irradiator unit (C). With this design samples could be irradiated while remaining on the heating strip, avoiding the chance that grains on the disk would be disturbed during transfer to a separate irradiator. See Bailiff (Reference Bailiff1980) for details on the design and its use. The unit in this image had been removed from its original bench mounting, where the irradiator was transported to the oven using a gantry system. The photograph here shows it being decommissioned so the radiation warning labels have been removed (Photograph by I.K. Bailiff).

Multi-aliquot TL readers
An increasing demand for TL analysis, particularly for the dating of sedimentary deposits, made the use of single-aliquot glow ovens challenging. This spurred the development of semi-automated TL readers that could measure many aliquots in one programmed sequence. The first multi-aliquot TL reader was likely that designed and built by Bøtter-Jensen and Bechmann, (Reference Bøtter-Jensen and Bechmann1968), which could measure TL from 12 sample aliquots in a sequence. Later, a higher-capacity unit was introduced by Bøtter-Jensen (Reference Bøtter-Jensen1977, Reference Bøtter-Jensen1978), which is described in more detail in Bøtter-Jensen and Bundgaard (Reference Bøtter-Jensen and Bundgaard1978). This system held up to 24 aliquots and incorporated a 90Sr beta source (Fig. 6). Instead of the analogue approach used with early glow ovens, this reader used a multichannel analyzer (MCA) and supporting electronics to digitize the PMT signal which allowed for easier analysis of the data. This unit was the prototype for the modern Risø readers that many laboratories use today, and it encouraged the development of other multi-aliquot commercial readers, such as those previously offered by Daybreak Nuclear and Medical Systems (Bortolot, Reference Bortolot2000) and currently by Freiberg Instruments (Richter et al., Reference Richter, Richter and Dornich2013, Reference Richter, Richter and Dornich2015). During the same period, hand-built TL readers of various designs were also being constructed in the former Soviet Union. Among them, the most sophisticated was probably the multi-sample reader developed by Galina Hütt at the Institute of Geology, Academy of Sciences in Tallinn, Estonia.
Multi-sample TL reader described by Bøetter-Jensen (1978). This was likely the first multi-sample unit built. It could measure up to 24 sample disks in a run, incorporated a 90Sr irradiator, and used a multichannel analyzer and a Hewlett Packard (HP) computer to record the data (photograph courtesy of K.J. Thomsen).

With the introduction of the open architecture IBM personal computer (PC) in the early 1980s, and its subsequent clones, MCAs and other electronics became available as cards that could be added to PC computer expansion slots. PC computers could also run various high-level programming languages, which allowed laboratories to design their own software for running instrumentation and for analyzing and presenting data.
Optical dating instrumentation
Single-aliquot readers
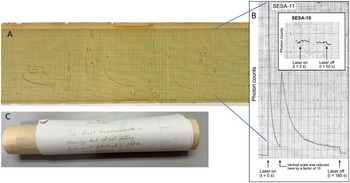
The most significant advancement in luminescence dating since the discovery of TL dating was optical dating (Huntley et al., Reference Huntley, Godfrey-Smith and Thewalt1985), now commonly referred to as optically stimulated luminescence (OSL) dating. The original experiments were performed in May of 1984 in the Department of Physics at Simon Fraser University and demonstrated that when quartz from a sequence of increasingly old stranded coastal sand dunes was stimulated by 50 mW/cm2 green (514.5 nm) light from an argon-ion laser, the resulting luminescence measured in response increased in intensity with stratigraphic age (Fig. 7). Using a simple additive dose method, it was also shown that a sediment sample that had been previously radiocarbon dated to have been deposited about 60 ka gave a similar optical age (Huntley et al., Reference Huntley, Godfrey-Smith and Thewalt1985).
Results of the first optical dating experiments, performed in the Physics Department at Simon Fraser University on May 7, 1984 by D.J. Huntley, D.I. Godfrey-Smith and M.L Thewalt. (A) The chart recorder paper shows several hand-annotated “shine-down” curves. (B) An expanded and enhanced view of part of those data (modified from figure 4 in Lian and Roberts, Reference Lian and Roberts2006). What is shown there is the luminescence decay (shine-down) curve for quartz sample SESA-11, collected from a ∼5 ka raised beach dune at East Naracoorte, South Australia. During measurement the vertical scale was reduced during the measurement after 28 seconds by a factor of 10 to accommodate the unexpected change in luminescence intensity of the sample. The inset graph in B shows a shine-down curve for modern beach quartz sample SESA-19 collected in the same region (the chart recorder pen skipped in the middle of the measurements so 15 s of data were not recorded). These data show that a modern sample gives negligible luminescence intensity. (C) The chart recorder paper is rolled up with a message from Professor Huntley: “History. The first measurements showing that optical dating had great potential – 1984 SFU Physics” (photographs by O.B. Lian).

For sediments, optical dating has been proven superior to TL dating because it selectively measures luminescence produced by the stimulation of electrons stored in the most light-sensitive traps. This is particularly important when the event being dated is the last exposure of sediment to sunlight. Importantly, the apparatus required to measure an OSL signal can be constructed more simply than that for TL, as a vacuum chamber (and vacuum pump), a heating strip, good thermal contact, and a dry inert gas atmosphere were not initially necessary. Although heating elements and an available gas atmosphere were later incorporated in most OSL readers for preheating (to empty electrons from thermally unstable traps filled during laboratory irradiation) and elevated-temperature measurements, the overall design initially remained less complex. This simplification also contributed to improved measurement precision.
The apparatus used for the seminal work on optical dating (Huntley et al., Reference Huntley, Godfrey-Smith and Thewalt1985) was a simple single-aliquot reader made from a folded aluminum sheet where a PMT was positioned directly above the sample, with optical filters placed between them. Filtered laser light was directed onto the sample using a plane mirror (Fig. 8A). The University of Oxford quickly constructed their own argon-ion laser-based system, validating and following up on Huntley’s breakthrough discovery (Smith et al., Reference Smith, Aitken, Rhodes, Robinson and Geldard1986) (Fig. 9). Shortly after, Hütt et al. (Reference Hütt, Jaek and Tchonka1988) discovered that IR light could be used to stimulate trapped charge in feldspar that appeared to be thermally stable enough to provide reliable geological ages. This was a surprise (and controversial) as IR light does not have sufficient energy to evict electrons from thermally stable traps, so Hütt’s results implied that the luminescence generating process in this case was more complex. Hütt’s discovery was also important because there were IR light-emitting diodes (LEDs) available at the time of sufficient power to excite electrons from the traps of interest (Poolton and Bailiff, Reference Poolton and Bailiff1989; Spooner and Franks, Reference Spooner and Franks1990). This made the construction of readers to measure feldspar much less expensive as a laser was not required (Fig. 10), and some TL glow ovens were adapted to incorporate an array of IR LEDs (Spooner et al., Reference Spooner, Aitken, Smith, Franks and McElroy1990 and Fig. 4). Spooner (Reference Spooner and Questiaux1989, Reference Spooner1993) developed an OSL/IR-stimulated luminescence (IRSL) system that delivered selectable stimulation wavelengths, based on an optically filtered 1000-W xenon lamp interfaced by fibre optics to the cryostage of Templer (Reference Templer1985). This system demonstrated that OSL could be produced by any suitable light source, and not only from a large laser, setting the stage for commercially produced OSL readers. It also independently verified the then-controversial discovery of IRSL dating by Hütt. Optical dating of feldspar using IR stimulation (IRSL dating) has since become an invaluable geochronological tool, particularly when the quartz luminescence signal is weak, absent, or compromised by unwanted components. A key challenge, however, remains accounting for anomalous fading in feldspars (Huntley and Lamothe, Reference Huntley and Lamothe2001), especially for “old” samples where the dose-response approaches a limiting saturation value.
Early single-aliquot OSL readers used at David Huntley’s laboratory. (A) The reader used for the seminal experiments by Huntley et al. (Reference Huntley, Godfrey-Smith and Thewalt1985) (modified from their figure 1). (B) The reader designed by O.B Lian around 1987. It used a parabolic mirror salvaged from an old astronomical telescope to direct more luminescence photons onto the PMT. The sample is moved into position using a drawer mechanism similar to that shown for the reader in C. It was later fitted with LEDs and used at least until the mid-1990s (modified from figure 2 in Huntley et al., Reference Huntley, Short and Dunphy1996). (C) This reader was an improvement on that shown in B as it further increased light collection by incorporating a home-made short-focused ellipsoidal mirror. It used high-intensity LEDs instead of a laser. This reader was designed by M. R. Baril in the mid-1990s (Baril, Reference Baril1997).

(A) The main Simon Fraser University optical and thermoluminescence laboratory as it was from the mid 1980s. The single-aliquot reader described in Figure 8B is indicated by the lower of the two white arrows at the left of the photograph; the PMT extends horizontally from its bottom to the right. On the bench shelf, just above it, are several lenses and mirrors used to expand and guide laser light into the reader from an opening in its top, past a shutter mechanism. One of the first IBM PC AT computers (introduced in 1984) is shown on the desk. It was used to control experiments and collect data, with an HP pen plotter to its left and an early HP inkjet printer to its right. The upper white arrow at the left of the image points to an IR laser; a blue/green argon ion laser is to the left, just outside of the image (photograph by O.B. Lian). (B) The Oxford OSL table in 1989. The image at right shows how the beam was directed via mirrors, shutters, and optical elements into the sample chamber, which is under the PMT housing at top right. The beam could be taken off the linear bench at different points, enabling use of secondary chambers for additional experiments. A second sample chamber was used to study optically stimulated phosphorescence. The sample disk was laid on a standard nichrome heater strip which had a cooled glycol/water mixture circulated in its support, allowing for measurements below room temperature. Timed shutters were used, together with polished quartz light guides between the sample and PMT to minimize loss of photon counts (photographs by B.W. Smith).

(A) Schematic of the reader developed by Hütt et al. (Reference Hütt, Jaek and Tchonka1988), which was used to show that dating feldspar with IRSL was feasible (modified from their Figure 1). (B) The sample chamber where the incident light strikes the sample at one focus of the elliptical mirror, as shown in A (photograph taken in 1986 by B.W. Smith).

From the 1970s to the early 1990s the instrumentation in most luminescence research laboratories often appeared chaotic with a myriad of home-made electronic units, webs of cable connections, large lasers and their specialised mounting tables, mirrors and lenses, PC computers, power supplies, amplifiers, photon counters, and plotters (Fig. 9). These complex experimental rigs were used together to run experiments devised to investigate the physical mechanisms behind the luminescence process and to develop and test laboratory protocols for dating. With the advent of compact commercial readers, developed out of these extensive physics-based research programmes, the instrumentation required, especially for those laboratories focusing on dating, became much simplified.
Multi-aliquot readers
Multi-aliquot OSL readers soon followed the simple single-aliquot readers used for the seminal experiments, although single-aliquot readers continued to be improved (Fig. 8) as they remained valuable for experiments devised to understand the fundamental physics behind luminescence mechanisms where high-efficiency light collection was important (e.g., Huntley et al., Reference Huntley, Short and Dunphy1996). Early OSL multi-aliquot readers relied initially on green light from a large argon-ion laser to stimulate a sample (e.g., Godfrey-Smith, Reference Godfrey-Smith1991) (Fig. 11); however, this approach proved too complex and expensive for widespread adaption. One of the first commercially available systems for optical dating was that launched by Littlemore Scientific Engineering (ELSEC) in 1993 (Fig. 12). It featured an automated 64-position sample changer designed to host interchangeable function modules, including an IR diode module developed for IRSL measurements (Spooner et al., Reference Spooner, Aitken, Smith, Franks and McElroy1990), a filtered halogen green (selectable) OSL light source, and 241Am alpha and 90Sr beta irradiation sources. Custom fine-grain sample deposition technology was developed, along with optical bleaching masks (Spooner, Reference Spooner1994); preheat structures and calibration devices were added to ensure reproducible operation. This ELSEC system was specifically designed for isothermal OSL/IRSL dating using the “Australian slide method” developed by Prescott et al. (Reference Prescott, Huntley and Hutton1993). However, this system lacked the capability to heat the sample, precluding both TL dating and application of the rapidly developing single-aliquot protocols, which required disk-by-disk preheating. As a result, the ELSEC system was superseded by newly developing readers capable of both optical and thermal excitation, notably those built by the Risø National Laboratory (now Danish Technical University (DTU), Nutech) and Daybreak Nuclear and Medical Systems.
(A)–(D) The multi-sample OSL reader designed by D.I. Godfrey-Smith in the mid-1980s in the Physics Department of Simon Fraser University. The various mechanisms and functions of the unit are shown. The reader was built in-house and had a 50-aliquot capacity. In the diagram the stimulation is from laser light, but LEDs were later added (modified from figures 3–6 in Godfrey-Smith, Reference Godfrey-Smith1991). In the case of laser light, a beam splitter and mirrors were used to assure uniform illumination of the sample. The reader did not incorporate a heating plate or an irradiator, so aliquot heating was done in a laboratory oven, and irradiations were performed in a 60Co gamma cell. Although this reader was built for fundamental experiments (e.g., Godfrey-Smith et al., Reference Godfrey-Smith, Huntley and Chen1988) it was subsequently used to increase the dating capacity of the laboratory.

One of the world’s first automated optical dating systems that was commercially available. Based initially on the IRSL module of Spooner et al. (Reference Spooner, Aitken, Smith, Franks and McElroy1990), it was then rapidly expanded in collaboration with Littlemore Scientific Engineering (ELSEC) to become a complete optical dating system based on a family of modules and interfaces to an automated sample changer, notably OSL and IRSL, alpha and beta irradiators, and sample management units for reproducible operation for dating.

These new types of OSL/TL reader were all fundamentally enabled by replacing the argon-ion laser with much more affordable filtered green light from incandescent halogen or arc xenon lamps (e.g., Spooner and Questiaux, Reference Spooner and Questiaux1989; Bøtter-Jensen and Duller, Reference Bøtter-Jensen and Duller1992; Bortolot, Reference Bortolot1997; Bøtter-Jensen, Reference Bøtter-Jensen1998) (Fig. 13). At the same time green and blue LEDs were also being tested as a light source, but they were found to be not sufficiently powerful. By the late 1990s, however, green and blue LEDs of sufficient power became available and all modern readers now use them to stimulate quartz. The early years of OSL physics-based research produced numerous innovative instruments. Examples include the investigation of phosphorescence following optical stimulation by Wheeler (Reference Wheeler1988, Reference Wheeler1990), who built a novel photographic flashgun-based reader, demonstrating that long-wavelength phosphorescence from quartz and feldspar appeared to not be a viable dating tool.
An early version of the commercial Risø multi-sample OSL reader introduced in 1997. (A) A schematic of the system (image courtesy of K.J. Thomsen; see also figure 3 in Markey et al., Reference Murray and Roberts1997). (B) A photograph with the PMT removed. Stimulation of quartz was provided by filtered light from a halogen lamp, or from an external xenon or mercury light source. Light is directed and focused onto the sample by a series of lenses or a light guide. IR light is provided by LEDs mounted above the chamber and an ellipsoid mirror is used for light collection. The chamber can be evacuated for TL measurements.

Single-aliquot optical dating
The next important developments were the design and testing of laboratory protocols that allowed an optical age to be determined from a single aliquot of mineral grains. The possibility of optical dating using a single aliquot was first suggested by Huntley et al. (Reference Huntley, Godfrey-Smith and Thewalt1985), who observed that multiple short measurements could be made on a single aliquot without substantially reducing its intensity (i.e., a measurable luminescence signal could be obtained even when only a small fraction of the relevant traps was emptied).
Soon after the introduction of optical dating, several protocols were developed and tested for single multi-grain aliquots of quartz (e.g., Liritzis et al., Reference Liritzis, Galloway and Theocaris1994; Stokes, Reference Stokes1994; Murray and Mejdahl, Reference Murray and Mejdahl1999) and feldspar (e.g., Duller, Reference Duller1991, Reference Duller1995). Protocols were also introduced for aliquots consisting of just a single grain of these minerals (Lamothe et al., Reference Lamothe, Balescu and Auclair1994; Lamothe and Auclair, Reference Lamothe and Auclair1997; Murray and Roberts, Reference Roberts1997; Roberts et al., Reference Roberts, Walsh, Murray, Olley, Jones, Morwood and Tuniz1997). These early single-aliquot protocols were refined and tested, evolving into the single-aliquot regenerative dose (SAR) procedure most laboratories use today (Murray and Wintle, Reference Murray and Wintle2000, Reference Murray and Wintle2003; Wintle and Murray, Reference Wintle and Murray2006). Single-grain dating is particularly valuable when sediment samples contain grain populations with differing values of equivalent dose (ages) or sunlight exposure histories, or when grain populations do not have uniform luminescence properties.
Although Daniels et al. (Reference Daniels, Boyd and Saunders1953) had first demonstrated TL imaging of mineral slices, and Hashimoto et al. (Reference Hashimoto, Hayashi, Koyanagi, Yokosaka and Kimura1986) applied advanced photographic techniques for TL colorimetry of quartz grains, measuring the luminescence from individual mineral grains extracted from dating samples was not achieved until Templer and Walton (Reference Templer and Walton1983) used image intensifier technology to capture the TL from single zircon grains. Subsequently, Templer (Reference Templer1986) developed a PMT-based imaging TL reader for dating arrays of zircon grains, which was later modified to use a micro-channel plate imaging photon detector (IPD, Smith et al. (Reference Smith, Wheeler, Rhodes and Spooner1991), following work by Huntley and Kirkey (Reference Huntley and Kirkey1985). While these systems enabled measurement of the emission from individual grains, they lacked the signal-to-noise sensitivity to be practical for routine single-grain dating. This level of sensitivity was not achieved until Spooner (Reference Spooner2000), at the Australian National University, demonstrated the liquid nitrogen-cooled charge coupled device (LN-CCD)-based “photon-counting imaging system,” which was subsequently refined to incorporate an expanded Offner achromatic f/0.9 reflective optic system (McCulloch et al., Reference McCulloch, Spooner and Jones2011) (Fig. 14). However, these systems were complex and expensive, so during the 1990s the first single-grain sediment optical dating experiments were underway in parallel using readers originally designed for multi-grain aliquot measurements. Individual grains were simply placed onto standard ∼1-cm-diameter disks, using silicon oil as an adhesive, and stimulated with LED light sources (e.g., Roberts et al., Reference Roberts, Walsh, Murray, Olley, Jones, Morwood and Tuniz1997, Reference Roberts, Bird, Olley, Galbraith, Lawson, Laslett and Yoshida1998). The growing recognition of the importance of single-grain dating prompted modifications to multi-aliquot readers to enable routine single-grain analysis. Some adaptions using CCD detectors were explored (e.g., Duller et al., Reference Duller, Bøtter-Jensen and Markey1997), but it was a design using a PMT and a diode-pumped 10 mW Nd:YVO4 laser (Duller et al., Reference Duller, Bøtter-Jensen, Kohsiek and Murray1999a, Reference Duller, Bøtter-Jensen, Murray and Truscott1999b) that led to the development of the dual-laser systems now commercially available (Fig. 15).
The architecture of the highly sensitive photon counting imaging system (PCIS) developed by McCulloch et al. (Reference McCulloch, Spooner and Jones2011).

The modern Risø commercial reader. (A) A modern reader with a detection and stimulation head (DASH) (white arrow), which provides an automated filter changer and IR, blue, and green LEDs for stimulation, and the ability to run with various attachments such as an X-ray source for irradiation, an emission spectrometer (as shown in C), an electron multiplying CCD (EMCCD) imaging system, and a pulsed OSL unit, among others. Comparable commercial readers are provided by Freiberg Instruments. The rectangular unit (black arrow) houses a green (532 nm) 10 mW Nd:YVO4 diode-pumped solid-state laser for stimulating quartz, and an IR (830 nm) 140 mW TTL modulated laser for stimulating feldspar. An X-Y scanning device using movable mirrors mounted on software-controlled encoded motorized linear stages directs one of the two focused lasers, via a beam splitter, onto quartz or feldspar grains that have been placed into 100–300-µm-diameter pits in special aluminum disks. (B) As in A, but with the lid removed from the box that holds the semiconductor lasers, and without a DASH unit installed. The inset is a magnified image of a single-grain disk. (C) The reader shown with an emission spectrometer (Prasad et al., Reference Prasad, Poolton, Kook and Jain2017) attached.

Taking a slightly different approach to spatially-resolved measurement of OSL, the Durham laboratory had developed a laser scanning instrument (Bailiff et al., Reference Bailiff, Clark and Barnett1996) that deployed the focused beam from an argon-ion laser (514 nm) and a motor-controlled X-Y stage. The output of a tunable Q-switched Nd:YAG laser was later added to the scanner, together with photon counting with a 2 ns resolution MCS, enabling the measurement of both spatially and time-resolved luminescence from mineral samples (Bailiff and Mikhailik, Reference Bailiff and Mikhailik2003).
Thermal stability and excitation and emission spectra
A critical aspect of both TL and OSL dating is understanding the physical processes that generate measured luminescence. This ensures that the signal originates from minerals of interest and only from traps that are thermally stable and highly light sensitive in the case of sediment dating (e.g., Akber and Prescott, Reference Akber and Prescott1985; Huntley et al., Reference Huntley, Godfrey-Smith, Thewalt and Berger1988, Reference Huntley, Godfrey-Smith and Haskell1991; Jungner and Huntley, Reference Jungner and Huntley1991; Bailiff and Poolton, Reference Bailiff and Poolton1991; Short and Huntley, Reference Short and Huntley1992; Huntley and Baril, Reference Baril1997; Baril Reference Baril2004a; Baril and Huntley, Reference Baril and Huntley2003). Investigation of these processes often involved measurements of TL at low temperatures, requiring the use of cryostat systems to cool the samples. Several such systems were built during the 1970s and 1980s, including those at Oxford University (Bailiff et al., Reference Bailiff, Bowman, Mobbs and Aitken1977a; Templer, Reference Templer1985; Wheeler, Reference Wheeler1988) and the apparatus of Visocekas et al. (Reference Visocekas, Ceva, Marti, Lefaucheux and Robert1976), which demonstrated that anomalous fading was accompanied by an athermal emission, suggesting a quantum mechanical origin for this effect.
Other work included the study of excitation and emission spectra of the minerals of interest for dating, which required the design of more specialized instrumentation. To accommodate the characteristics of such minerals, relatively powerful monochromatic stimulation sources that are tunable over a wide wavelength range (e.g., ultraviolet to near IR) are required for the former, and highly sensitive spectrometers with a similarly broad spectral range for the latter had to be designed and tested. Early in-house-made spectrometers for TL consisted of rapid-scanning prism and grating instruments, as well as systems based on holographic gratings or interference filters and PMTs for detection. Bailiff et al. (Reference Bailiff, Morris and Aitken1977b) improved on the latter type and developed an affordable spectrometer that was able to store and integrate spectra over successive scans while correcting for variation in the response of the instrument (Fig. 16). In David Huntley’s Simon Fraser University laboratory, TL emission spectra (300–750 nm range) from several feldspar and quartz samples relevant for dating were studied using a spectrometer built around a concave holographic grating (Huntley et al., Reference Huntley, Godfrey-Smith, Thewalt and Berger1988, Reference Huntley, Godfrey-Smith and Haskell1991). From the late 1970s a series of research students in John Prescott’s Adelaide laboratory developed a sophisticated Fourier transform spectrometer that allowed TL, detected by a PMT, to be displayed as three-dimensional plots of intensity versus temperature and wavelength (Jensen, Reference Jensen1982; Akber, Reference Akber1986; Prescott et al., Reference Prescott, Fox, Akber and Jensen1988; Fox, Reference Fox1990) (Fig. 17). In David Huntley’s laboratory Baril (Reference Baril2002) developed a highly sensitive grating spectrometer incorporating a spherical mirror and a CCD detector for studying IRSL emission spectra from irradiated feldspar and feldspar inclusions in quartz (Baril, Reference Baril2004a) (Fig. 18). An application of this spectrometer is reported by Baril and Huntley (Reference Baril and Huntley2003), who also provide a review of other spectrometers that had been built up until that time (see their table 1). Bos et al. (Reference Bos, Winkelman, Le Masson, Sidorenko and Van Eijk2002) developed a low-cost compact TL and OSL spectrometer with a CCD detector that was designed to be attached to existing Risø readers. Emission spectrometers for both TL and OSL can now be acquired commercially. For example, Risø offers a highly sensitive grating spectrometer designed to be attached to their readers, which can detect emissions in the 300–700 nm and 300–850 nm ranges (e.g., Prasad, Reference Prasad2017; Thomsen et al., Reference Thomsen, Kook, Murray and Jain2018), and one of the Freiberg Instruments readers offers something similar (Richter et al., Reference Richter, Richter and Dornich2013).
TL emission spectrometer of Bailiff et al. (Reference Bailiff, Morris and Aitken1977b). The instrument is based on interference filters selected to examine varying light sources. Sixteen interference filters are attached on the edge of a 34-cm-diameter aluminum disk, which is rotated by a motor at 8 revolutions per second. The motor is coupled to the disk shaft by a V-belt. TL from the sample, which is positioned on the heater plate, is collimated by a 12-mm-diameter, f/2 lens (F2). The filters successively interrupt the beam so as to produce light that is focused by a 25-mm-diameter, f/1 lens combination (F1) onto the photocathode of a gallium arsenide (GaAs) photomultiplier tube (type CA 31034) which is cooled thermoelectrically to reduce the dark count. TC = thermocouple.

(A) Schematic of an early version of the 3D TL interferometer developed in John Prescott’s University of Adelaide laboratory (after Jensen, Reference Jensen1982). (B) The instrumentation in 1983, showing a Commodore PET computer that was used to control the experiments. It was eventually replaced by open-architecture PC computers (photograph by B.W. Smith).

Emission spectrometer designed by M.R. Baril in the Physics Department at Simon Fraser University in the late 1990s. The instrument is based on f/2 and f/2.5 concave holographic gratings with nominal bandwidths of 190–800 nm and 500–1200 nm, respectively. Light detection is with a CCD cooled to about −40°C to reduce background counts. See Baril (Reference Baril2002) and Baril and Huntley (Reference Baril and Huntley2003) for additional details.

Measurement of the variation in the intensity of OSL with stimulation wavelength, referred to as quantum efficiency, produces a stimulation spectrum. In addition to allowing the optimization of the generation of OSL from a particular mineral, the stimulation spectrum provides important information related to the “optical” depth of the trap(s) from which charge is evicted, particularly if it contains well-defined peaks. Such spectra are difficult to measure where the wavelengths of the stimulation and emission bands are close, as is the case for quartz (Bøtter-Jensen et al., Reference Bøtter-Jensen, Duller and Poolton1994). However, for the feldspar group of minerals, the stimulation and emission spectral peaks are generally better separated, and the stimulation spectrum for feldspar, initially measured using an arc-lamp-based monochromatic source (Hütt et al., Reference Hütt, Jaek and Tchonka1988), was later defined with higher resolution using a tunable argon-ion-pumped Ti:sapphire laser (Godfrey-Smith and Cada, Reference Godfrey-Smith and Cada1996; Barnett and Bailiff, Reference Barnett and Bailiff1997).
Further detail of the dynamics of the production of optically stimulated luminescence at recombination centres is gained by the measurement of time-resolved luminescence (TRL). This requires a light source that is pulsed and photon-counting instrumentation capable of registering the evolution of the luminescence following the arrival of each stimulating pulse of photons. Initial investigation of TRL (Sanderson and Clark, Reference Sanderson and Clark1994) employed laser sources delivering very narrow pulses (e.g., 10 ns) and multichannel scalars (MCS) capable of registering photon counts on the same timescale. This work revealed the underlying complexity of the recombination routes followed by optically excited charge in feldspars, with recombination lifetimes ranging over six decades, from tens of ns to ms (Clark et al., Reference Clark, Bailiff and Tooley1997; Clark and Bailiff, Reference Clark and Bailiff1998). Such fundamental studies using pulsed stimulation sources configured in various experimental modes have continued to find direct application in the development of the method, and provide new avenues for exciting developments (e.g., Prasad et al., Reference Prasad, Poolton, Kook and Jain2017).
Concluding remarks
Luminescence dating, and its associated instrumentation, have evolved rapidly since the 1960s. Early instruments were designed to investigate the physical processes underlying luminescence and to identify which luminescence signals could be harnessed for dating. Current developments include the use of sophisticated imaging devices to map mineral distribution on rock and sediment surfaces. These approaches were first explored by Duller et al. (Reference Duller, Bøtter-Jensen and Markey1997) (see also Baril, Reference Baril2004b; and the review by Roberts et al., Reference Roberts, Jacobs, Li, Jankowski, Cunningham and Rosenfeld2015), and they have more recently gained interest for dating rock surfaces (e.g., Andričević et al., Reference Andričević, Sellwood, Freiesleben, Hidy, Kook, Eppes and Jain2023; Gliganic et al., Reference Gliganic, McDonald and Meyer2024). Furthermore, they have driven the development of mineral imaging systems capable of recording IR-stimulated luminescence from centimetre-scale samples using an electron multiplying CCD (EMCCD) (Sellwood et al., Reference Sellwood, Kook and Jain2022), or by laser scanning (Bench et al., Reference Bench, Sanderson and Feathers2024).
The portable OSL reader, or pOSL readers (not to be confused with “pulsed OSL”), is another innovative instrument used for applied luminescence research. pOSLs are simplified versions of standard laboratory units in that they cannot irradiate or heat samples and they therefore cannot provide absolute ages. Nevertheless, they can be valuable for studying variations in luminescence signals in order to map mineralogically complex stratigraphic sequences in the field or from cores, or to provide relative age estimates that can guide further sampling for full dating (e.g., Stone et al., Reference Stone, Bateman, Burrough, Garzanti, Limonta, Radeff and Telfer2019; Woor et al., Reference Woor, Hughes, Stancey, Enkin, D’Arcy, Lian, Bostock and Peacock2025). Although pOSL readers have been available for more than a decade (Sanderson and Murphy, Reference Sanderson and Murphy2010; Kook et al., Reference Kook, Murray, Lapp, Denby, Ankjaergaard, Thomsen, Jain, Choi and Kim2011) their use for tracking sediment provenance is only now gaining traction (Gray et al., Reference Gray, Mahan, Springer and Pigati2018, Reference Gray, Jain, Sawakuchi, Mahan and Tucker2019; Munyikwa et al., Reference Murray, Arnold, Buylaert, Guérin, Qin, Singhvi, Smedley and Thomsen2021). With the growing interest of using luminescence signals for rock surface dating and for sediment provenance analysis we anticipate rapid advances in the instruments used in these fields (see the discussion in Wallinga, Reference Wallinga and Bateman2019).
A discussion of the software used to run luminescence experiments and analyze data is beyond the scope of this paper, but it warrants brief mention because we expect software development to have a profound influence on future luminescence dating research. We mentioned earlier that with the advent of open-architecture PC computers, and with the introduction of high-level programming languages designed to run on them, luminescence researchers created their own programs to control their instruments and analyze data. For example, in the early 1990s D.J. Huntley made his DOS-based luminescence data analysis software available, and Burggraaf and Haskell (Reference Burggraaf and Haskell1994) provided a software package for TL and OSL spectrometry data that enabled extraction of TL glow curves from individual grains. In the following decade, software, such as Analyst, was developed for Risø readers (Duller, Reference Duller2015) that incorporates sophisticated statistical approaches used for multi-aliquot (single- and multi-grain) dating to estimate a representative D e (Galbraith et al., Reference Galbraith, Roberts, Laslett, Yoshida and Olley1999; Galbraith, Reference Galbraith2010). Additional software packages were subsequently developed by others for other commercial instruments. Freely available software for estimating dose rates and calculating ages, and for plotting data, also became available (Durcan, Reference Durcan, King and Duller2015; Liang and Forman, Reference Liang and Forman2019). With the advent of the programming language R, specifically designed for data analysis and graphical presentation, a suite of user-friendly and very powerful tools was developed for analyzing and visualizing luminescence data (Kreutzer et al., Reference Kreutzer, Burow, Dietze, Fuchs, Fischer and Schmidt2017). These tools were later incorporated into Analyst (Duller, Reference Duller2018). Perhaps the next leap forward will be incorporating artificial intelligence (AI) into luminescence analysis software packages. The use of AI to recognize complex patterns in medical X-ray images is already being developed (e.g., Catalina et al., Reference Catalina, Vidal-Alaball, Fuster-Casanovas, Escalé-Besa, Comellas and Solé-Casals2024), and similar approaches could be applied to luminescence research, for example to identify spatial patterns in rock surface image data, or to quickly and objectively analyze luminescence decay curves and deconvolute their various signal components in order to identify and extract those most suitable for dating.
Acknowledgments
This paper evolved from an invited talk given by O.B.L. at the 2024 New World Luminescence Dating Workshop held at Desert Research Institute, Reno, Nevada, USA, during the 40th anniversary of the seminal experiments that launched optical dating. We would like to give our appreciation for our mentors who launched our careers in luminescence research, these include: the late M.J. Aitken (Research Laboratory for Archaeology and the History of Art (RLAHA), Oxford University, United Kingdom); D.J. Huntley (Department of Physics, Simon Fraser University, Canada); the late J.R Prescott (Department of Physics and Mathematical Physics, University of Adelaide, Australia); L. Bøtter-Jensen and the late V. Mejdal (Risø National Laboratory, now part of the DTU, Denmark). We also thank Nicholas Lancaster (Senior Editor), Paul Hanson (Guest Editor), and two anonymous reviewers for their constructive feedback that significantly improved the manuscript.


 Open access