

INTRODUCTION
Central Asia is characterised by extreme continental climate conditions with enormous local variability related to great relief amplitude and distance from large water bodies. Extensive semiarid high mountain massifs, which include the Pamir, the Pamir-Alay, Tien Shan, and Hindu Kush Mountains, are surrounded by the Karakum and Kyzylkum deserts on the west and the Taklamakan desert on the east. Because of these unique features, central Asia influences environmental conditions far beyond its geographic borders; thus this is a key area for understanding modern climate change and for past climate reconstruction on a supraregional scale.
The central Asian regions located on the edge of the great midlatitude Karakum and Kyzylkum deserts and the high mountain massifs of Pamir and Tien Shan are very sensitive to the climate change that has taken place over the last few millennia, which has had a great impact on human history and on eco-environmental systems (deMenocal, Reference deMenocal2001; Yadava et al., Reference Yadava, Bräuning, Singh and Yadav2016; Yin et al., Reference Yin, Su and Fang2016; Owczarek et al., Reference Owczarek, Opała-Owczarek, Rahmonov, Razzokov, Jary and Niedźwiedź2017b). The recent rapid temperature increase in the Pamir-Alay region is in phase with an overall global trend (Giese et al., Reference Giese, Mossig, Rybski and Bunde2007; Chevallier et al., 2012, Reference Chevallier, Pouyaud, Mojaïsky, Bolgov, Olsson, Bauer and Froebrich2014). However, longer trends of changes in precipitation are more difficult to evaluate. Understanding the hydroclimatological response to large-scale climatic change during the last millennium is crucial (Chen et al., Reference Chen, Chen, Holmes, Boomer, Austin, Gates, Wang, Brooks and Zhang2010); however, regional studies are still lacking. The majority of central Asian palaeoclimatic studies are based on data for the Tibetan Plateau, Tien Shan, or Aral Sea basin, while the Pamirs region is among those that have been investigated for past climate variations in arid central Asia to a lesser extent (e.g., Froebrich et al., Reference Froebrich, Bauer, Ikramova and Olsson2007; Wegerich et al., Reference Wegerich, Olsson and Froebrich2007; Savitskiy et al., Reference Savitskiy, Schlüter, Taryannikova, Agaltseva and Chub2008; Olsson et al., Reference Olsson, Gassmann, Wegerich and Bauer2010).
Existing studies based on remote-sensing methods and glacio-hydro-meteorological monitoring data point up the possible impacts of climate change on the shrinking of glaciers, changes in the amount and distribution of precipitation (rainfall and snowfall), and flow regime (Chevallier et al., Reference Chevallier, Pouyaud, Mojaïsky, Bolgov, Olsson, Bauer and Froebrich2014). The main issue for long-term climatological analysis in this semiarid area is a lack of accurate instrumental data. Existing data are lacking or incomplete or cover a short time span; thus little is known about the magnitude and frequency of past hydroclimate variability (Williams and Konovalov, Reference Williams and Konovalov2008; Chevallier et al., Reference Chevallier, Pouyaud, Mojaïsky, Bolgov, Olsson, Bauer and Froebrich2014). The unavailability of long-term, reliable meteorological records for the Pamir region leads to the use of natural climate proxies to learn about the history of long-term climatic variability. There have been an attempts to use various proxy methods, such as sedimentologic and geochemical evidence of lake-level changes (Komatsu and Tsukamoto, Reference Komatsu and Tsukamoto2015; Heinecke, L., Mischke, S., Adler, K., Barth, A., Biskaborn, B.K., Plessen, B., Nitze, I., Kuhn, G., Rajabov, I., Herzschuh, U., unpublished manuscript, http://dx.doi.org/10.5194/cp-2016-34); sclerochronological records (Taft et al., Reference Taft, Mischke, Wiechert, Leipe, Rajabov and Riedel2014); the dendroglaciological approach (Narama, Reference Narama2002); lichenometric data (Solomina, Reference Solomina1996); loess-palaeosol sequences (Bronger et al., Reference Bronger, Winter, Derevjanko and Aldag1995; Shackleton et al., Reference Shackleton, An, Dodonov, Gavin, Kukla, Ranov and Zhou1995); and surface exposure dating with cosmogenic nuclides (Zech et al., Reference Zech, Abramowski, Glaser, Sosin, Kubik and Zech2005), to reconstruct the features of past climate changes from the Late Pleistocene to the Holocene in the Pamir region. More precise analysis of climate variability is possible thanks to the dendrochronological method, which enables precision of climatic reconstruction on an annual level and can be used over time spans of several hundred to one thousand years (Fritts, 1976). Despite the recent proliferation of high-resolution climate reconstructions for central Asia, there have been no studies focused on reconstruction of past hydroclimate variability derived from annually resolved proxies in the Pamir-Alay Mountains.
The dendroclimatological potential of the Pamir-Alay Mountains was pointed out in the reconnaissance studies of Mukhamedshin (Reference Mukhamedshin1968) and Maksimov and Grebenyuk (Reference Maksimov and Grebenyuk1972), who collected Juniperus turkestanica specimens more than a thousand years old in an attempt to estimate climate fluctuations. Recently, dendroclimatic signal was investigated in the growth rings of Ephedra equisetina (Opała et al., Reference Opała, Niedźwiedź and Rahmonov2013) and various juniper species from Tajikistan (over a maximum chronological time span of 1005–2014) (Opała et al., Reference Opała, Niedźwiedź, Rahmonov, Owczarek and Małarzewski2017; Opała-Owczarek et al., 2017, Reference Opała-Owczarek, Owczarek, Rahmonov and Niedźwiedź2018) and Uzbekistan (over a maximum chronological time span of 1705–2012) (Seim et al., Reference Seim, Tulyaganov, Omurova, Lyutsian, Botman and Linderholm2016). This area was also studied by Chen et al. (Reference Chen, He, Bakytbek, Yu and Zhang2016), who reconstructed a 294 yr stream-flow record using tree rings of Turkestan junipers. Encouraged by these results, we developed in the present study the first reconstruction of precipitation changes based on the millennial-length tree-ring–width record from the Pamir-Alay Mountains.
DATA AND METHODS
Geographic settings and climate
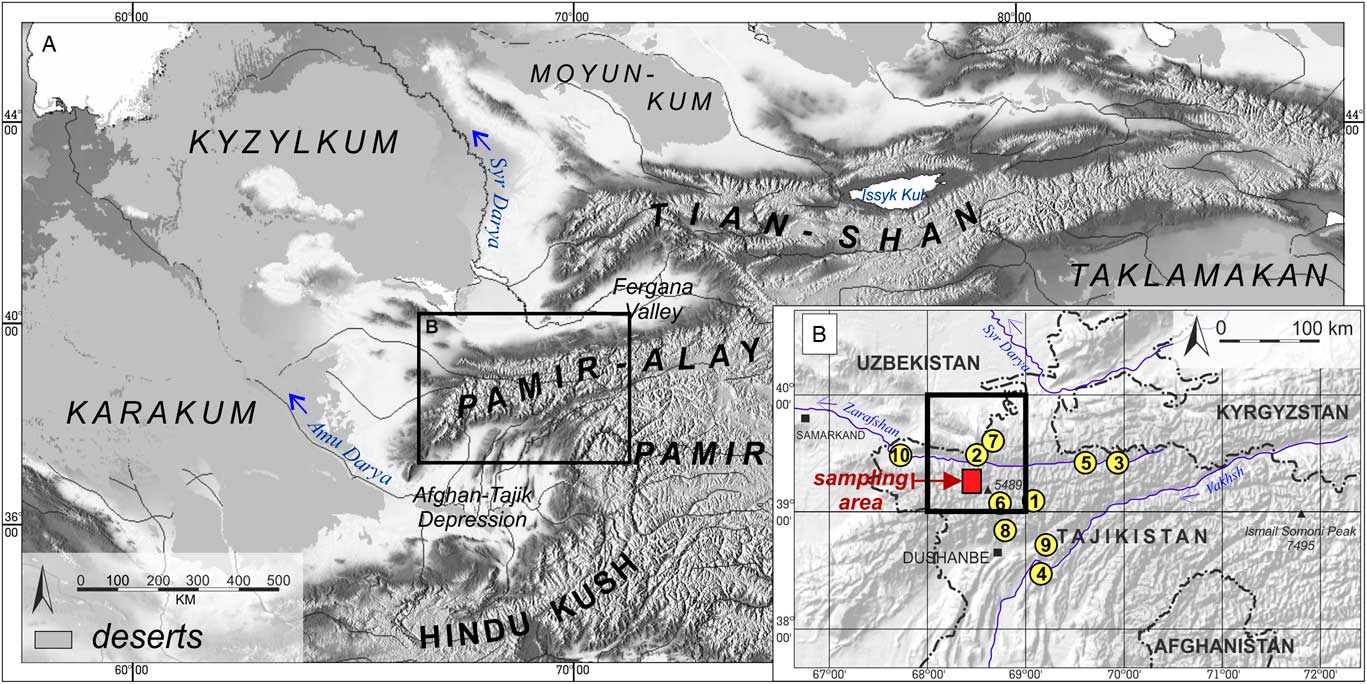
The Pamir-Alay system is located in northwestern Tajikistan, eastern Uzbekistan, and, partly, in the western part of Kyrgyzstan (Fig. 1A). Three ranges, the Turkestan Mountains in the north, the Zarafshan Mountains in the middle, and the Gissar Range to the south, extend more than 450 km in an east–west direction (longitudes 67°21'–71°45.6'E) and about 120 km from south to north (latitudes 38°34.8'–39°37.8'N). This region is drained by the Syr Darya and Amu Darya tributaries and the Zarafshan River. The sampling area is located in the western part of the Pamir-Alay within the Zarafshan Range (Fig. 1A), surrounded by the Karakum and Kyzylkum Deserts and by the semidry Afghan-Tajik Depression to the south. The highest part of the Zarafshan Range is the Fann Mountains (Chimtarga Peak, 5489 m above sea level [asl]). The Pamir-Alay, with a maximum elevation of ~5400–5600 m asl, is characterised by typical high-mountain relief with U-shaped valleys, glaciers, and steep slopes with active mass movements (Fig. 2A). This region is characterised by high seismicity, connected with its location in the vicinity of the Pamir frontal thrust system (Schurr et al., Reference Schurr, Ratschbacher, Sippl, Gloaguen, Yuan and Mechie2014; Owczarek et al., Reference Owczarek, Opała-Owczarek, Rahmonov and Mendecki2017a). Geologic structures include mainly Upper Palaeozoic (Vlasov et al., Reference Vlasov, Dyakov and Cherev1991). Quaternary deposits are mainly found within the river valleys and mountain forelands, where they build fluvial and glaciofluvial terraces (Fig. 2B). Loess deposits occur in the western and southwestern piedmont zones of the Pamir-Alay. The thickness of the loess cover ranges from 30 to 50 m in the western Pamir-Alay (WPA) foreland to 200 m in the Afghan-Tajik Depression (Goudie et al., Reference Goudie, Rendell and Bull1984; Shackleton et al., Reference Shackleton, An, Dodonov, Gavin, Kukla, Ranov and Zhou1995; Ding et al., Reference Ding, Ranov, Yang, Finaev, Han and Wang2002). Geographic factors of the Pamir-Alay region, including latitudinal mountain barriers surrounded by vast deserts, influence the high value of atmospheric aerosol accumulation. Dust originating mainly in the Karakum and Kyzylkum Deserts is transported by west winds and deposited in the valleys and the mountain forelands (Fig. 2B). Average dust accumulation in this area is 0.2 mm/yr (Finaev, Reference Finaev2014).
(colour online) Location of the research area. (A) The relief and main geographic regions in the western part of the central Asia. (B) Location of the sampling area within the western part of the Pamir-Alay Mountains. Grid (39–40°N, 68–68°E) used in the climate reconstruction, and meteorological stations are also placed: Anzob Pass (1), Shahristan Pass (2), Dehauz (3), Sanglok (4), Madrushkent (5), Iskanderkul (6), Sangiston (7), Gushari (8), Faizabad (9), and Pandjikent (10).
(colour online) (A) General view of the high-mountain landscape of the western Pamir-Alay Mountains, note numerous traces of mass movements, mainly debris flows and landslides. (B) Quaternary deposits filling the Zarafshan River valley in the vicinity of the sampling area; poor visibility is associated with the penetration of dust into the valley from the Kyzylkum desert. (C, D) Sampled Juniperus semiglobosa growing at elevation 2900–3200 m above sea level.

The climate of the study area is under the influence of the westerlies, with very high local contrasts depending on altitude and landforms. The lowest part of the region (Dushanbe, 800 m; Samarkand, 724 m) is similar to Mediterranean regions, designated Csa in the Köppen and Geiger climate classification (Kottek et al., Reference Kottek, Grieser, Beck, Rudolf and Rubel2006), with very hot and dry summers. Parts of the valley bottoms and mountain foreland represent a cold semiarid steppe climate (BSk) (Penjikent, 1016 m asl) with annual precipitation below 400 mm and four extremely dry months (June–September). In the lower parts of the mountains, the climate is cold temperate, with wet spring seasons and dry summers (Dsb type). Above the upper tree line of juniper forests (about 3300 m asl) where the July temperature drops below 10°C, climate conditions are typical of mountain tundra (ET type).
The mean annual temperature is above 0°C below 3200 m asl, ranging from 15.1°C in Dushanbe (800 m) to –1.8°C at Anzob Pass (3373 m). In Dushanbe, the average temperature varies from 2.6°C in the coldest month (January) to 27.4°C in the warmest month (July). At Anzob Pass, corresponding values range from –12.5° to 9.5°C. Average annual totals of precipitation on the mountainous ranges and slopes at altitudes of 3000–3400 m asl reach 400–500 mm. In the valleys, these values drop to 250–300 mm (Rahmonov et al., Reference Rahmonov, Szczypek, Niedźwiedź, Myga-Piątek, Rahmonov and Snytko2017). Most precipitation occurs in the spring. The summer months, including September, are very dry (Supplementary Tables 1 and 2, Fig. 3B). Typical conditions for the middle part of the mountains are presented in the climate diagram for Anzob Pass (Fig. 3A).
(colour online) (A). Climatic diagram for Anzob Pass. Ta, average annual temperature; Pa, average annual precipitation total (after data of Williams and Konovalov [Reference Williams and Konovalov2008] for the years 1941–2007, partly updated by data from June 2013 to August 2017). (B) Comparison of the annual course of precipitation totals averaged from 10 stations (“AvgZMts-10stations”) and selected points in the western Pamir-Alay.

The only forest-forming species in the Pamir-Alay are junipers (Fig. 2C and D). Juniper forest communities grow at relatively low elevations (1900 m asl) and reach up to 3500 m asl. Three groups of phytocoenoses can be distinguished in this area: Juniperus seravschanica, which prefers relatively lower altitudes; Juniperus semiglobosa; and mixed, combining both species (Rahmonov et al., Reference Rahmonov, Szczypek, Niedźwiedź, Myga-Piątek, Rahmonov and Snytko2017). Because of human pressure, the oldest trees and the largest forest areas have survived in the subalpine and alpine landscapes at the upper limit of juniper occurrence (Opała et al., Reference Opała, Niedźwiedź, Rahmonov, Owczarek and Małarzewski2017; Opała-Owczarek et al., Reference Opała-Owczarek, Owczarek, Rahmonov and Niedźwiedź2018). Juniperus semiglobosa, 6 to 8 m high, forms here an open forest (Fig. 2C and D), with poorly developed undergrowth in which shrubs occur individually as low or deciduous species because of unfavourable climatic conditions (Rahmonov et al., Reference Rahmonov, Szczypek, Niedźwiedź, Myga-Piątek, Rahmonov and Snytko2017).
Dendrochronological data
The study site is located in the vicinity of Chimtarga Peak (5489 m asl) in the Zaravshan Range. In 2015, 80 tree cores from Himalayan pencil junipers (Juniperus semiglobosa Regel) were collected from a steep (30–40°) slope covered by rocky soil substrate, which is unfavourable for water storage (Fig. 2 C and D). Sampled trees grow on the slope with a southern exposure near the timberline at elevations of about 2900–3200 m asl. We attempted to collect trees from different age classes, with special attention paid to old-growth trees characterised by crown dieback. Trees were cored with Pressler increment borers (diameter 5.15 mm) perpendicularly to the slope to avoid the influence of reaction wood, which is often developed in gymnosperm trees on the downslope side of the stem to support trees growing on slopes (Fritts, Reference Fritts1976). In subsequent steps, samples were transported to the laboratory, where they were processed according to standardised methodology: air-dried, mounted, and progressively sanded (Cook and Kairiukstis, Reference Cook and Kairiukstis1990). Ring widths were measured to the nearest 0.001 mm using a system for automatic recognition of tree rings, WinDENDRO (Regent Instruments Inc., 2006). Measured sequences were cross dated using the software TSAP-Win (Rinn, Reference Rinn2010), and then checked statistically using the COFECHA program (Holmes, Reference Holmes1983). We removed age-related trends and translated the raw tree-ring series to dimensionless tree-ring indices by fitting a negative exponential curve or linear regression curve to the measured values. All series were merged and combined into a mean chronology using a biweight robust mean function in the ARSTAN program (Cook and Krusic, Reference Cook and Krusic2005). To evaluate the quality of the developed chronology, we calculated a series of statistical parameters: mean correlation within series, mean sensitivity, mean growth ring, mean index, first-order autocorrelation, signal-to-noise ratio, expressed population signal (EPS), and Rbar (Wigley et al., 1984; Speer, 2010).
Meteorological data
The dendroclimatological analysis was calculated on the basis of single-station data, regional mean series, and gridded data to select the best data set for calibration purposes. The locations of the meteorological stations, grid points, and study area are presented in Figure 1. Meteorological data were obtained from Central Asia Temperature and Precipitation Data, 1879–2003 (Trohimow, Reference Trohimow1968; Williams and Konovalov, Reference Williams and Konovalov2008) and Climate Research Unit TS 2.1 (Mitchell and Jones, Reference Mitchell and Jones2005). The longest series, spanning the period 1891–2017, was collected for the meteorological station in Samarkand (WMO code 38696; 39°34′N, 66°57′E; altitude 724 m asl), located in eastern Uzbekistan, about 120 km west of our sampling area in the foreland of the Pamir-Alay. The early part of the data (1981–2000) was based on Williams and Konovalov (Reference Williams and Konovalov2008); the most recent (2001–September 2017) was collected from the Ogimet synoptic messages database (Valor and López, Reference Valor and López2017) and recalculated for monthly values.
For the mountain areas, the most representative is the meteorological station at Anzob Pass (3373 m). The meteorological series in Central Asia Temperature and Precipitation Data, 1879–2003 (Williams and Konovalov, Reference Williams and Konovalov2008) covers only the period 1940–2007. We updated this series for the years 2013–2017 based on the Ogimet database (Valor and López, Reference Valor and López2017).
Considering proximity to the sampling sites, elevation, and extent of climate records, we selected data from the 10 meteorological stations (1930–1995) listed in Table 1, which were used to develop a regional precipitation series. The data were corrected and verified by comparison between the nearest stations. The meteorological data were also obtained from the gridded precipitation data sets for the period 1901–2013 and the Palmer Drought Severity Index (PDSI) data for the same period. We selected the grid 39°30'N, 66°30'E the nearest to our sampling site. The PDSI is a drought metric indicating regional moisture conditions by incorporating antecedent precipitation, soil moisture demand, and water supply. The index, which ranges from extremely dry (negative values) to extremely wet (positive values) levels, can be used to identify long-term meteorological drought (Palmer, Reference Palmer1965).
Meteorological stations used for calculation of average monthly precipitation (1930–1995).

Source: Williams and Konovalov (Reference Williams and Konovalov2008).
A comparison of the annual course of the data from different sources is presented in Figure 3B. For comparison with the final reconstruction, we used precipitation data averaged from 10 stations, gridded precipitation and PDSI data, and the longest series from the Samarkand meteorological station with monthly resolution. Decadal variability was highlighted by applying an 11 yr running average to the final reconstruction curve. Dry and wet periods were identified through comparison with long-term averages.
Statistical analysis and climate reconstruction
The relationship between tree-ring chronologies and climate data was analysed using DendroClim 2002 (Biondi and Waikul, Reference Biondi and Waikul2004). The temporal stability of climate-growth relationships was assessed using a moving correlation function with a 40 yr time window. Correlation analyses were performed for the period of the so-called dendroclimatological year (from the previous June to the current September of a given year [pJun–Sep]) because tree growth can be affected by the climatic conditions of both the previous and current growing seasons (Fritts, Reference Fritts1976). Climate-growth responses were analysed for the period common to both climate data (precipitation and PDSI) and tree-ring data: 1930–1993 (54 yr). The results enabled us to choose the most appropriate parameter for hydroclimatic reconstruction and to determine the most appropriate linear regression model for climate reconstruction (Cook and Kairiukstis, Reference Cook and Kairiukstis1990). Following the successful cross calibration/validation and positive results of verification tests (which included the reduction of error, the coefficient of efficiency, and sign tests; see Fritts, Reference Fritts1976), the procedure of calibration was repeated over the entire time interval. The obtained new model coefficient was used to reconstruct past climate changes from preinstrumental tree-ring index variation.
Within the context of interpretation of long-term variations in the dendroclimatic record, a number of methods have been developed to detect regime shifts and change points in time series. In our study, we used an exploratory method based on a sequential t-test that may signal a regime shift. A detailed description of this algorithm for testing climate regime shifts, developed by Rodinov (Reference Rodionov2004), can be found at http://www.beringclimate.noaa.gov/regimes.
To demonstrate the spatial representativeness of our reconstruction, we conducted spatial correlations between the obtained reconstruction and the gridded precipitation and humidity data set for the common period 1940–2015, using the Royal Netherlands Meteorological Institute (KNMI) Climate Explorer (http://climexp.knmi.nl) (Trouet and Van Oldenborgh, Reference Trouet and Van Oldenborgh2013).
RESULTS AND DISCUSSION
Tree-ring chronology development
The collection of 80 samples resulted in the construction of a tree-ring chronology composed of 29,846 ring-width measurements of the 64 best-correlated series (Fig. 4). The oldest investigated juniper possessed 1323 growth rings, a finding similar to that of the pioneer study of Mukhamedshin (Reference Mukhamedshin1968), based on only a few cores and recent work of Opała et al. (Reference Opała, Niedźwiedź, Rahmonov, Owczarek and Małarzewski2017). Juniper trees reaching ages of up to 2000 yr were also found in the Tien Shan (Esper, Reference Esper2000) and Himalayas (Yadav et al., Reference Yadav, Singh, Dubey and Mishra2006), and on the Tibetan Plateau (Yang et al., Reference Yang, Qin, Wang, He, Melvin, Osborn and Briffa2014). However, other authors working in the WPA were not successful in locating trees more than 1000 yr old (cf. Chen et al., Reference Chen, He, Bakytbek, Yu and Zhang2016; Seim et al., Reference Seim, Tulyaganov, Omurova, Lyutsian, Botman and Linderholm2016). The developed ring-width chronology of Himalayan pencil junipers from the Pamir-Alay spans the years AD 693–2015, with a statistically acceptable part consisting of the years 908–2015 (1108 yr) when taking into account replicate (>3) and mean segment correlation (>0.32), or 1004–2015 (1012 yr) with an EPS level >0.85. The period 1004–1250 is characterised by EPS values fluctuating around 0.85 and dropping slightly below the commonly accepted threshold of 0.85 during several short periods between 1200 and 1250. However, because of a lack of information for this area from the beginning of the second millennium, we present the results from the early period of our reconstruction (before 1250), stating that they should be interpreted with caution.
Regional tree-ring–width chronology of Juniperus semiglobosa from western Pamir-Alay and its samples depth. Brown line represents value of expressed population signal (EPS). (For interpretation of the references to colour in this figure legend, the reader is referred to the web version of this article.)

Detailed chronology statistics are presented in Table 2. The mean correlation between trees indicates the strength of the common signal among the series. Statistically significant first-order autocorrelation shows the important effect of the previous year’s growth conditions on the current year’s growth ring (AC=0.763).
Statistical characteristics of the western Pamir-Alay (WPA) chronology. EPS, expressed population signal.

Climate signal in tree-ring width chronology
Correlation analysis revealed statistically significant correlations between tree-ring chronology and moisture conditions. We investigated the correlation coefficients between ring width and various seasonal assemblages of precipitation conditions to determine the most suitable seasonal window for climate reconstruction. The highest level of positive correlations was observed between tree-ring width and precipitation measured at the Anzob Pass station (Fig. 5). A strong positive correlation was found between tree-ring width (TRW) data and precipitation from the previous December to the current February (r=0.67, P<0.0001, n=54). TRW also corresponded to annual and seasonal precipitation totals. The results of moving correlation (illustrated in Fig. 6 only for the most important seasons: December–February [DJF], pJun–Sep) show that positive correlations with precipitation in nongrowing seasons are constant throughout the study period, whereas correlations with precipitation over longer periods (pJun–Sep) decrease slightly after the second half of the 1980s.
(colour online) Correlations of juniper ring-width chronology from western Pamir-Alay with meteorological data for different months and seasons during the common period 1940–1993. Dark bars indicate significance at the 99% level of confidence. DJF, December–February; JJA, June–August; MAM, March–May; PDSI, Palmer Drought Severity Index; pJun–Sep, previous June to the current September; pOct–Jun, previous October to current June; SON, September–November.

(colour online) Scatter plot of western Pamir-Alay (WPA) tree-ring width indices and December–February (DJF) precipitation (A) and precipitation from previous June to current September (pJun–Sep) (B). (C) Moving window correlations between juniper ring-width indices and December–February precipitation and precipitation from previous June to current September (pJ-S).

Correlations between tree-ring chronology and gridded precipitation data showed similar results, with the highest values for winter-month precipitation and seasonal/annual means. However, further analysis showed weaker relationships with precipitation when calculated for regional mean precipitation series consisting of data from 10 meteorological stations within the study area. Regarding the response of tree-ring width to moisture conditions, significant positive correlations were observed between tree-ring width and PDSI in spring, summer, and annual averages, including previous and current growing seasons. As PDSI is a direct measure of soil moisture availability (most accurate for warm seasons), the results obtained for March–May and June–August appear to be the most reliable. However, it should be noted that PDSI often measures moisture for both the current and the previous season.
The results of dendroclimatic analysis indicate that the growth of Himalayan pencil junipers from southern slopes in the WPA is limited mainly by moisture conditions (Fig. 5). Our result confirms the general physiological characteristics of trees growing in arid and semiarid regions (e.g., Fritts, Reference Fritts1974). Similar relationships have been demonstrated for junipers from many regions of central Asia (e.g., Tian et al., 2007; Davi et al., Reference Davi, Jacoby and D’Arrigo2009; Liang et al., Reference Liang, Shao and Liu2009; Liu et al., Reference Liu, Bao, Song, Cai and Sun2009; Yang et al., Reference Yang, Qin, Wang, He, Melvin, Osborn and Briffa2014; Gou et al., Reference Gou, Deng, Gao, Chen, Cook, Yang and Zhang2015). We also confirmed the assumption that trees growing on steep south-facing slopes are subjected to drought stress because of a high level of solar radiation combined with the high run-off and low water storage capacity of shallow soils (e.g., Fritts, Reference Fritts1974; Zhang et al., Reference Zhang, Yuan, Liu, Wei, Yu, Chen, Fan, Shang, Zhang and Qin2013; Seim et al., Reference Seim, Tulyaganov, Omurova, Lyutsian, Botman and Linderholm2016). Higher levels of precipitation result in higher levels of soil moisture, reduction of drought stress, and, consequently, wider rings. Additionally, higher levels of winter precipitation (mostly in the form of snow) mean that trees may absorb more moisture in the early growing season (Fritts, Reference Fritts1976). Snowmelt from the nongrowing season provides a large portion of the moisture required for intense photosynthesis activity and ring-width formation; therefore, a greater relative influence of moisture on tree growth can be observed for nongrowing seasons than for current early growing seasons (Gou et al., Reference Gou, Deng, Gao, Chen, Cook, Yang and Zhang2015; Fang et al., Reference Fang, Frank, Zhao, Zhou and Seppä2015). The results of correlation analysis are of substantial physiological significance and thus enable tree-ring–based reconstruction. Trees from the studied region adapt to these environmental conditions by utilising moisture for a whole dendroclimatological year (pJun–Sep), as has been observed in other arid and semiarid regions. Positive responses to annual precipitation have also been reported for other arid and semiarid sites (e.g., Shao et al., Reference Shao, Huang, Liu, Liang, Fang and Wang2005; Liang et al., Reference Liang, Shao and Liu2009; Liu et al., 2007, 2009, Reference Liu, Wang, Hao, Song, Cai, Tian, Sun and Linderholm2011; Chen et al., Reference Chen, Chen, Holmes, Boomer, Austin, Gates, Wang, Brooks and Zhang2010; Zhang et al., Reference Zhang, Yuan, Liu, Wei, Yu, Chen, Fan, Shang, Zhang and Qin2013; Fang et al., Reference Fang, Frank, Zhao, Zhou and Seppä2015).
Dendroclimatic reconstruction
The results of dendroclimatic analysis, showing clear dependence on precipitation conditions, indicate the potential for dendroclimatic reconstruction. The strongest signal recorded in the annual growth of ring width was winter precipitation (Fig. 5). Because our aim was to provide information on long-term precipitation variations that would constitute an important contribution to the discussion on the impact of climate change on human history, we also provide the reconstruction of annual precipitation for the period from the previous June to September of a current growth year. The reconstruction of precipitation conditions over longer periods (e.g., moisture for a hydrologic year or dendroclimatological year) is more suitable for spatial/regional comparisons with other records and areas. Split-sample calibration/verification was used to evaluate the model. The results of these procedures, presented in Table 3, indicate that our regression models are valid. Owing to a distinct linear correlation between these variables, two simple linear regression models were designed as follows:
 $${\rm P}_{{{\rm DJF}}} {\rm {\equals}117}{\rm .26{\times}TRI}$$
Split period calibration (r cal) and verification (r ver) statistics for the reconstruction approach. CE, coefficient of efficiency; RE, reduction of error.

(r=0.671, N=54, R 2=45.1%, R 2 adjusted=44.1%, F=41.72, SEE=29.15, P<0.000), where
PDJF is the precipitation from December to February and TRI is the ring-width index at year t. SEE is a standard error of estimate.
 $${\rm P}_{{{\rm p}\,{\rm Jun}{\minus}{\rm Sep}}} {\rm {\equals}105}{\rm .44{\plus}418}{\rm .85{\times}TRI}$$
(r=0.580, N=53, R 2=33.7%, R 2 adjusted=32.5%, F=25.97, SEE=117.48, P<0.000), where
PpJun–Sep is the precipitation from the previous June to the current September and TRI is the ring-width index at year t.
Based on the regression models, we reconstructed precipitation variability for the previous December to the current February and the previous June to the current September over the past 1100 yr in the WPA. The reconstructions account for 45.1 and 33.7% of winter and annual precipitation, respectively, of the observed instrumental precipitation variance during the period 1940 to 1993 (Fig. 6).
The precipitation reconstructions for the past millennium presented here revealed interannual- to decadal- and centennial-scale variations (Fig. 7). Differences between the two versions of the reconstruction exist only because of the dimensions of the two climate variables taken into account. As a result of this, long-term means (510 vs. 113 mm), standard deviations (197 vs. 84 mm), and ranges of variation (1948 vs. 790 mm) all differ. The most visible feature of the reconstruction is considerable low-frequency climate variations. The reconstruction revealed a prolonged drought phase in the tenth century and a distinct period of dry conditions in the thirteenth century. Pronounced drought phases also occurred in the late eighteenth and early nineteenth centuries and the first half of the twentieth century (Fig. 7). The driest episode in the last 1100 yr took place in the first half of the thirteenth century (1211–1240), with a mean annual precipitation of 366 mm, which is ~30% lower than the long-term mean (Supplementary Table 3, Fig. 7B). The second and the third driest 30 yr episodes within the reconstruction took place in the tenth century, in 960–989 (with a mean annual precipitation ~28% lower than the long-term mean) and 927–956 (with a mean annual precipitation ~25% lower than the long-term mean). In addition, the analysis of year-to-year variation showed that 9 of the 20 driest years in the whole millennium occurred in the tenth century. Humid conditions prevailed in the eleventh and twelfth centuries, followed by a pronounced dry spell in the thirteenth century prior to their resumption until the end of the fourteenth century. A rapid transition between dry and wet climate conditions took place around 1650. The period from the mid-seventeenth to the beginning of the eighteenth century is the wettest in the whole period of the reconstruction. Subsequently, the climate conditions became wet in the second half of the nineteenth century, and relatively wetter conditions continued for the next 80 yr. The late twentieth century displayed another rapid transition between dry and wet climate conditions, similar to the ones from the mid-seventeenth century, at the turn of the ninth and tenth centuries, and between the tenth and eleventh centuries. The highest number of extremely wet years was recorded in the twelfth (8), seventeenth (2), and twentieth (5) centuries (Supplementary Table 4). In sum, in the last 1100 yr in the WPA there were nine dry periods (AD 805–834, 890–919, 927–956, 960–989, 1211–1240, 1579–1608, 1624–1653, 1810–1839, and 1925–1954) and eight wet periods (AD 1098–1127, 1157–1186, 1301–1330, 1344–1373, 1660–1689, 1707–1736, 1883–1912, and 1985–2015).
Reconstruction of winter precipitation for the western Pamir-Alay (the red line indicates regime-shift detection; years in which change point was recorded are also marked) (A) and precipitation from previous June to current September (with dry and wet periods) (B). The 20 yr mean is marked by a thick line, and the long-term mean by a dotted line. (For interpretation of the references to colour in this figure legend, the reader is referred to the web version of this article.)

The regime shift analysis enabled the precise identification of abrupt shifts in precipitation regimes. The most pronounced changes can be observed at the turn of the twelfth and thirteenth centuries and the turn of the fourteenth and fifteenth centuries, about 1650, about 1850, and after 1990 (Fig. 7). The results of the regime shift analysis, when compared with information on solar activity, enabled the identification of some regularities. When solar activity declines, an increase in precipitation is observable; this was especially pronounced during the Maunder Minimum (∼ 1650–1750) and, to a lesser extent, during the late Wolf (∼ 1300–1340) and Oort Minima (ca. 1000–1050). However, this was not confirmed in the case of the Dalton Minimum (∼ 1790–1830), for which a rather low level of precipitation was reconstructed. The course of the reconstructed precipitation is particularly interesting during the period 1394–1571, the longest period in the regime shift analysis. This 177-yr-long homogeneous period, with values close to the long-term average, closely matches the period of the Spörer Minimum (1420–1570). We have pointed out only a few similarities; a full explanation of the relationship between solar activity and the course of precipitation requires additional detailed research.
For the period from the previous June to the current September of a given year, we compared the results of reconstruction with three selected precipitation series and PDSI data (Fig. 8) using standardised z values. For the period 1901–2013, we compared reconstructed pJun–Sep precipitation with gridded precipitation data (Fig. 8A) and PDSI indexes (Fig. 8B). The long-term course smoothed by the 11 yr moving average is very similar for both variables. The best agreement is visible for the humid period 1900–1915 and the very wet period after 1985. Good agreement is visible in two additional periods: one short (1913–1921) and one more prolonged (1930–1953). Comparison of the reconstructed values with precipitation averaged from 10 meteorological stations during the period 1930–1995 also shows significant dry conditions during the first 10 yr (1940–1950). The reconstructed precipitation for this dry period is underestimated in comparison with measured values. In the reconstruction period between 1955 and 1985, values represent average conditions, whereas real precipitation was higher by about one-half standard deviation. This period is characterised by a high level of interannual variability, which is not visible on the smoothed series.
(colour online) Comparison of the reconstructed precipitation total (“PrecRec-z”) from previous June to September in western Pamir-Alay (“mov11,” 11 yr moving averages) with: standardized values of the grid (39°30'N, 68°30'E) precipitation (“pJun-Sep-z”) (A), standardized values of the Palmer Drought Severity Index (“PDSIz-pJun-Sep”) in the grid (39°30'N, 68°30'E) (B), standardized values of the average precipitation from 10 stations (“PrecAv10-z”) (C), and standardized values of the precipitation in Samarkand (D).

An interesting result was obtained for the longest precipitation series (1891–2017) from Samarkand (Fig. 8D). In spite of this city’s distance from our sampling area (120 km), the reconstructed and observed data follow very similar courses. Particularly good agreement is visible in the very wet contemporary period after 1990. The biggest divergence is visible in the years 1907–1920, when severe drought conditions were noted in Samarkand. The closest agreement between the smoothed curves is visible between 1920 and 1990, despite differences in certain selected years.
In the comparisons conducted between reconstructed and observed precipitation, differences in variance can be observed. The reconstructed values seem overly flat in relation to the actual values; hence rescaling should be considered for precise reconstruction of actual values of precipitation in the later stages of the work. It is well known that elimination of variance reduction in the regression model is possible through application of the scaling procedure (e.g., Esper et al., Reference Esper, Frank, Wilson and Briffa2005; Opała and Mendecki, Reference Opała and Mendecki2014).
Spatial correlation results showed that WPA precipitation reconstruction was significantly positively correlated with gridded humidity data over large parts of the southern part of the Kyzylkum (eastern Uzbekistan) and the central and eastern part of the Karakum Deserts (eastern Turkmenistan), as well as the semiarid Afghan-Tajik Depression (northern Afghanistan) and Pamir-Alay forelands (Tajikistan) (Fig. 9A). Investigation of the geographic representation of our reconstruction also showed good agreement with gridded precipitation data. A strong positive relationship was found for the southeastern Kyzylkum (Uzbekistan), as well as a weaker relationship for the northern part of Turkmenistan, the northwestern part of Afghanistan and western Kyrgyzstan, and south-central Kazakhstan (Fig. 9B). These results indicate that the obtained millennium-long record of hydroclimatic variability can also be used, to some extent, as a proxy for surrounding semidry and dry areas where no tree-ring data are available.
(colour online) Spatial correlations between reconstructed previous June–September precipitation and gridded previous June–September humidity (A) and gridded previous June–September precipitation (B). The correlations were calculated for the 1979–2012 period.

REGIONAL COMPARISON OF MOISTURE VARIABILITY IN THE PAST MILLENNIUM
The presented palaeoclimatic record of precipitation variability in the Pamir-Alay is the first such detailed hydroclimatic reconstruction for this region. Previous attempts based on tree-ring data revealed hydrometeorological variability over the last two to three centuries only (Chen et al., Reference Chen, He, Bakytbek, Yu and Zhang2016). Similarities between reconstructions during this period have been found between Chen’s records and ours. A broader comparison with proxies other than tree rings is more difficult, as they show only general tendencies, lower temporal resolution, or only temperature sensitivity (Mischke et al., Reference Mischke, Rajabov, Mustaeva, Zhang, Herzschuh, Boomer and Brown2010; Narama and Okuno, 2006; Taft et al., Reference Taft, Mischke, Wiechert, Leipe, Rajabov and Riedel2014; Komatsu and Tsukamoto, Reference Komatsu and Tsukamoto2015; Welc et al., Reference Welc, Toychiew, Suska-Malawska, Marks and Mętrak2016; Wolff et al., Reference Wolff, Plessen, Dudashvilli, Breitenbach, Cheng, Edwards and Strecker2017).
Comparison with selected annually resolved proxies from central Asia (Fig. 10), against the background of well-known periods of warmer and drier conditions during the Mediaeval Warm Period (MWP) and of a colder, more humid climate during the Little Ice Age (LIA; after Lamb, Reference Lamb1977) shows a number of similarities. Various available records generally show similar low-frequency trends, indicating large-scale events occurring in central Asia (Yang et al., Reference Yang, Wang, Bräuning, Dong and Esper2009). Dry phases in the tenth and thirteenth centuries are also present in reconstructions from the Pamir Plateau based on lacustrine sediments (Lei et al., Reference Lei, Tian, Bird, Hou, Ding, Oimahmadov and Gadoev2014), a multiproxy reconstruction from the Tien Shan Mountains (Yang et al., Reference Yang, Wang, Bräuning, Dong and Esper2009), and an annually resolved oxygen isotope ratio from juniper tree-ring cellulose from the Karakoram (Treydte et al., Reference Treydte, Schleser, Helle, Frank, Winiger, Haug and Esper2006). The second of these droughts was also distinguished in tree-ring records from arid regions of the Himalayas (Yadava et al., Reference Yadava, Bräuning, Singh and Yadav2016) and the Qilian Mountains (Gou et al., Reference Gou, Deng, Gao, Chen, Cook, Yang and Zhang2015). The drought that occurred in the early MWP (ninth and tenth centuries) and was reflected in the dendrochronological record from the Pamir-Alay has also been noted in the speleothem data from the Uluu-Too cave located in the northern forelands of the Pamir-Alay (southern rim of the Fergana Basin, southwestern Kyrgyzstan) (Wolff et al., Reference Wolff, Plessen, Dudashvilli, Breitenbach, Cheng, Edwards and Strecker2017). The socioeconomic consequences of the ninth/tenth-century drought—for example, the collapse of the Tang Dynasty (AD 907) (Su et al., Reference Su, Liu, Fang and Ma2016) or the decline of ancient Panjikent on the Silk Road (Owczarek et al., Reference Owczarek, Opała-Owczarek, Rahmonov, Razzokov, Jary and Niedźwiedź2017b)—can also be detected in many regions of central Asia. Fewer similarities are highlighted during the Little Ice Age period, which in many reconstructions is a period of considerably wetter climatic conditions. In the precipitation reconstruction from the Pamir-Alay, this period is not consistent: dry and wet phases occur alternately. Dry periods are also present in the LIA in the reconstructions from the Tibetan Plateau and Qilian Mountains. In addition, the historical records gathered by Yadava et al. (Reference Yadava, Bräuning, Singh and Yadav2016) tell us that in the former Turkestan, which was a huge desert during the first half of the fourteenth century, adverse environmental conditions continued into the mid-fifteenth century. Low levels of precipitation and very dry conditions also existed in Afghanistan during the late fifteenth to early sixteenth centuries. Desert-like conditions were reported from Kabul (Beveridge, Reference Beveridge1921). Socioeconomic threats such as famines (e.g., the well-documented deadly famine in 1520) and invasions were among the consequences of these extremely unfavourable climatic conditions (Yadava et al., Reference Yadava, Bräuning, Singh and Yadav2016). Furthermore, the single-year occurrences of deadly dust storms, snow evaporation, severe sandstorms, and prolonged drought described for the areas of Afghanistan and the former Turkestan are consistent with dry periods that can be distinguished in our precipitation reconstruction. The wet period at the end of the LIA (1850–1900) is in line with moisture reconstruction from surrounding areas. Similarly, the wetting trend in the twentieth century was noted not only in the Pamir-Alay, but also in the records from the Karakoram and Himalayas.
(colour online) Comparison of wet and dry period in the last millennium summarized on the basis of different proxy records (data from: Treydte et al., Reference Treydte, Schleser, Helle, Frank, Winiger, Haug and Esper2006; Yang et al., Reference Yang, Wang, Bräuning, Dong and Esper2009; Lei et al., Reference Lei, Tian, Bird, Hou, Ding, Oimahmadov and Gadoev2014; Gou et al., Reference Gou, Deng, Gao, Chen, Cook, Yang and Zhang2015; Wernicke et al., 2015; Yadava et al., Reference Yadava, Bräuning, Singh and Yadav2016). LIA, Little Ice Age; MWP, Mediaeval Warm Period.

CONCLUSIONS
Here we present the first precipitation reconstruction for the area of the Pamir Mountains based on newly developed tree-ring–width chronology from juniper trees growing on the southern slope. Strong sensitivity to winter and to pJun–Sep precipitation was found. In the course of the reconstruction, we identified nine relatively short dry periods and six wet periods since 900. Strong similarities were found when comparing our reconstruction to those of adjacent areas. Particular attention should be paid to the present humid period (since 1990). During the LIA, the humid period of 1650–1700 was particularly marked. In contrast, the driest conditions appeared at the end of the eighteenth and beginning of the nineteenth centuries. For the years 1400–1650, regular fluctuations with small amplitudes were observed around the mean. The most interesting is the MWP, characterised by a long dry phase before 1000 and a second dry phase at the end of the MWP in the years 1200–1250. However, in the middle of the MWP, humid climate conditions are clearly marked.
Spatially, the moisture response extends over large parts of the interior of western central Asia. Our reconstruction may constitute valuable information about climate history for surrounding semidry and dry areas. The results are therefore an important contribution to the development of high-resolution palaeoclimatology in drylands.
ACKNOWLEDGMENTS
We are grateful to Piotr Owczarek for field assistance and Oimahmad Rahmonov for logistic support. For the calculation of regime shifts, we used Visual Basic code provided by Sergei Rodionov on the website https://www.beringclimate.noaa.gov/regimes. Our thanks are also due to Łukasz Małarzewski for technical support with software. This research was financed by the Polish National Science Centre (NCN), grant number 2013/09/B/ST10/00634. The authors would like to thank Lewis Owen, Yurena Yanes, and the two anonymous reviewers for helpful comments and suggestions on this manuscript.
Supplementary material
To view supplementary material for this article, please visit https://doi.org/10.1017/qua.2018.21


 Open access