





1. Introduction
An island in a magnetic field topology is a closed magnetic flux tube, characterized by a central elliptic point, called an O-point, hyperbolic X-points and a separatrix surface, isolating the structure from the rest of space (figure 1a). Particles within the separatrix circulate around the elliptic point in a bound trajectory with a resonant frequency proportional to the island width, while particles outside the separatrix are not resonant but still experience periodic changes in energy and momentum (Heidbrink & White Reference Heidbrink and White2020). Regions of stochastic magnetic field lines can occur when homoclinic tangles form near the island X-points (Joseph et al. Reference Joseph, Evans, Runov, Fenstermacher, Groth, Kasilov, Lasnier, Moyer, Porter, Schaffer and Schneider2008), when neighbouring island chains overlap (Fenstermacher et al. Reference Fenstermacher, Evans, Osborne, Schaffer, Aldan, Degrassie, Gohil, Joseph, Moyer, Snyder and Groebner2008; Sun et al. Reference Sun, Jia, Zang, Wang, Liang, Liu, Yang, Guo, Gu, Li and Lyu2016; Nazikian et al. Reference Nazikian, Hu, Ashourvan, Eldon, Evans, Grierson, Logan, Orlov, Park, Paz-Soldan and Poli2021) or when a single island chain bifurcates into sub-island chains (Wu et al. Reference Wu, Evans, Canal, Ferraro, Lyons and Orlov2019; Bardóczi & Evans Reference Bardóczi and Evans2021a; Evans et al. Reference Evans, Wu, Canal and Ferraro2021). Stochasticity of the magnetic field lines can enhance cross-field transport due to chaotic particle trajectories (Horton & Ichikawa Reference Horton and Ichikawa1996). In all three stochasticity mechanisms mentioned here (X-point-proximity tangles, island overlap and island bifurcation), the stochastic region coexists with remnants of magnetic islands (figure 1b), that can act as attractors (Smith & Kaufman Reference Smith and Kaufman1978). In these circumstances, non-local interactions occur simultaneously with chaotic trajectories, and the resulting particle transport can be subdiffusive, diffusive or superdiffusive (Spizzo et al. Reference Spizzo, White, Maraschek, Igochine and Granucci2018). The plots in figure 1 were generated using the TRIP3D code (Evans, Moyer & Monat Reference Evans, Moyer and Monat2002; Kalling et al. Reference Kalling, Evans, Orlov, Schissel, Maingi, Menard and Sabbagh2011).
Poincaré plots of DIII-D shot #172 330. (a) The structure of a magnetic island chain in the core plasma. The separatrix is drawn by a red dashed line to guide the eye. (b) Edge plasma stochastic region along with remnants of magnetic islands during island overlap induced by coil perturbations.

Magnetic island structures and field-line stochasticity are ubiquitous in the inhomogeneous and non-stationary space environment (e.g. solar wind plasma (Khabarova et al. Reference Khabarova, Zank, Li, Le Roux, Webb, Dosch and Malandraki2015, Reference Khabarova, Zank, Li, Malandraki, le Roux and Webb2016)), Earth's magnetosphere (Øieroset et al. Reference Øieroset, Lin, Phan, Larson and Bale2002; Chen et al. Reference Chen, Bhattacharjee, Puhl-Quinn, Yang, Bessho, Imada, Mühlbachler, Daly, Lefebvre, Khotyaintsev and Vaivads2008, Reference Chen, Bessho, Lefebvre, Vaith, Asnes, Santolik, Fazakerley, Puhl-Quinn, Bhattacharjee, Khotyaintsev and Daly2009) and in controlled laboratory settings (e.g. tokamaks (Bardóczi & Evans Reference Bardóczi and Evans2021b; Yoo et al. Reference Yoo, Wang, Startsev, Ma, Ethier, Chen and Tang2021) and stellarators (Suzuki Reference Suzuki2020; Landreman, Medasani & Zhu Reference Landreman, Medasani and Zhu2021)). Since both features can originate from the dynamical processes of magnetic reconnection and turbulence, their concurrence is common in magnetized plasma (Choi et al. Reference Choi, Bardōczi, Kwon, Hahm, Park, Kim, Woo, Park, Yun, Yoon and McKee2021). An outstanding research question in space plasma and magnetically confined fusion is understanding the cause and effect of such complexity in the magnetic field topology. Specifically, it is not clear how the presence of either island chains or stochasticity influences particle acceleration to suprathermal energies, and whether the interplay between the two features enhances or diminishes cross-field transport for a given scenario. An example approach to studying these questions is considering a toroidal magnetized plasma experiment where the number, size, location and overlap of magnetic islands can be controlled using small-amplitude resonant magnetic perturbations (RMPs).
The effects of magnetic field perturbations on particle transport have been previously investigated in tokamak experiments where RMPs were used to control plasma--wall interactions and edge localized modes (ELMs) (Evans et al. 2005; Evans et al. Reference Evans, Moyer, Burrell, Fenstermacher, Joseph, Leonard, Osborne, Porter, Schaffer, Snyder and Thomas2006a; Fenstermacher et al. Reference Fenstermacher, Evans, Osborne, Schaffer, Aldan, Degrassie, Gohil, Joseph, Moyer, Snyder and Groebner2008; Suttrop et al. Reference Suttrop, Eich, Fuchs, Günter, Janzer, Herrmann, Kallenbach, Lang, Lunt, Maraschek and McDermott2011; Orlov et al. Reference Orlov, Moyer, Evans, Paz-Soldan, Ferraro, Nazikian, deGrassie, Grierson, Eldon, Fenstermacher and King2016). However, these studies have typically focused on high-confinement (H-mode) plasmas, where the plasma response to the external perturbation fields is large – complicating the analysis. As in many contexts in plasma physics where low-dimensional chaos may occur, little is known about the complex dynamics resulting from the self-consistent back reaction of collective effects on the field-line structure and the chaos-induced transport which presumably causes the plasma response. This necessitates the development of comprehensive three-dimensional (3-D) simulations, capturing nonlinear plasma response. Yet, most simulations of the plasma response to 3-D magnetic fields have been limited to linear single- or two-fluid resistive MHD modelling using a single-toroidal-helicity applied magnetic perturbation (Izzo & Joseph Reference Izzo and Joseph2008; Strauss et al. Reference Strauss, Sugiyama, Park, Chang, Ku and Joseph2009). It has been identified that the development of advanced simulations and the interpretation of H-mode experimental results can benefit from improved analytical models informed from low-confinement (L-mode) plasma experiments where the plasma response is minimized (Schmitz Reference Schmitz2012).
This paper presents an experimental study of non-thermal electron transport in L-mode toroidal plasmas with magnetic islands and regions of stochastic magnetic field lines. Here, we analyse DIII-D experiments conducted in the DIII-D tokamak (Schmitz Reference Schmitz2012), where 3-D non-axisymmetric RMPs were created using two rows of six window-frame coils located off-midplane inside the vessel (Orlov et al. Reference Orlov, Moyer, Evans, Mordijck, Osborne, Fenstermacher, Snyder and Unterberg2010). These coils were used to create and grow magnetic islands at the $n = 3$ rational surfaces (i.e. at safety factor ratios $q = m/n$
 , where $n = 3$
 ) and to cause the controlled formation of stochastic regions in the edge plasma through island chain overlap. These experiments featured low density, inner-wall limited L-mode discharges with no neutral beam injection, using only ohmic heating. In such conditions, the nonlinear plasma response is expected to be negligible, which allows for the study of electron transport as a function of the magnetic field topology constructed from vacuum field simulations. Here, we consider small-amplitude magnetic field perturbations $\delta B$
 , such that $(\delta B)/{B_T}\mathrm{\ \mathbin{\lower.3ex\hbox{$\buildrel< \over {\smash{\scriptstyle\sim}\vphantom{_x}}$}}\ }{10^{ - 4}}$
 , where ${B_T}$
 is the toroidal magnetic field. A main finding of this study is that suprathermal electron transport is enhanced or suppressed depending on electron location with respect to the large magnetic islands in the core plasma. We also established that the prominence of the suprathermal electron feature is proportional to the width of the stochastic region in the edge plasma.
For each examined $B$ -field topology, to infer the cross-field electron transport, we implemented an electron ‘tagging’ technique, which has been previously used to study ion acceleration in linear plasma (Skiff, Anderegg & Tran Reference Skiff, Anderegg and Tran1987) and suprathermal electrons in toroidal plasma (Skiff, Boyd & Colborn Reference Skiff, Boyd and Colborn1994). Electron cyclotron heating (ECH) and current drive (ECCD) pulses were employed to produce a temporally modulated and spatially localized enhanced current leading to a perturbation of the local electron population in a desired resonance layer within the plasma. Then, the time-dependent radial spreading of the ‘tagged’ electrons was observed from electron cyclotron emission (ECE) measurements. Normally, it is expected that due to resonance with the ECH wave frequency, the tagged electrons will heat up and then thermalize, leading to a uniform increase in the plasma temperature profile. However, if the resonant layer contains suprathermal electrons, the tagging causes them to escape from the plasma before thermalization can occur. The latter results in ECE profiles where the edge plasma channels measure considerably higher electron temperature than what is calculated from Thomson scattering (TS) data. Since TS fits assume Maxwellian (thermal) electron distributions, the observed deviations are interpreted as signatures of non-thermal electrons, as discussed in § 2.
In addition to ECE profiles, gamma emission signals from scintillator detectors were used to determine if the observed non-thermal electrons were also relativistic. Runaway electrons, travelling at relativistic speeds, were detected during the first ECH/ECCD pulse in several discharges, but not during subsequent ECH/ECCD pulses. A possible explanation is that runaways are generated and confined in the core plasma during current ramp up at the beginning of each discharge, and then de-confined by the interaction with the first ECH/ECCD pulse. Interestingly, in each discharge, suprathermal features in the ECE measurements were observed during all ECH/ECCD pulses, but no peaks in the scintillator data were recorded after the first pulse, indicating that electrons detected during subsequent pulses were non-thermal but also non-relativistic. Thus, in this study, we could distinguish between two types of energetic particles: non-relativistic suprathermal electrons and runaway electrons.
This paper is organized as follows. Section 2 introduces the details of the experimental set-up and presents the main results; namely, the observation of energetic electrons from several diagnostic measurements. In § 3, the magnetic field topology corresponding to the experimental conditions is obtained from simulations of the vacuum magnetic field. These simulations are used to identify the number, size and location of magnetic islands. In this section, we also discuss the 3-D coil current threshold needed to induce island overlap in the edge plasma, resulting in a region of stochastic magnetic field lines. Section 4 provides interpretation of the results from the comparison between simulations and experiments. Specifically, we discuss the possible mechanisms leading to the presence of energetic electrons for each magnetic field topology. In § 5, we summarize the conclusions and discuss future work. The Appendix provides an expanded discussion on the electron tagging technique and its limitations.
2. Experimental results
2.1. Electron ‘tagging’ experiments on DIII-D
Here, we consider ten discharges, shot numbers 172 321–172 330, which were part of the 2017 Frontiers in Science campaign at DIII-D. Each shot was an inner-wall limited L-mode discharge (figure 2a) with no neutral beam injection, using only ohmic heating and modulated ECH and ECCD pulses during the plasma current ${I_p}$ plateau (figure 2b). In each shot, the ECCD is obtained by toroidally aiming the ECH launchers (as opposed to only radially aimed, which provides heating only, and no ECCD). Typical parameters for this campaign were ${I_p} = (0.7\unicode{x2013} 1.1)\textrm{MA}$
 , toroidal magnetic field ${B_t} \approx 2\; T$
 and edge safety factor ${q_{95}} = (4.8\unicode{x2013} 7.4)$
 . Note that two of the current profiles in figure 2(b), shot 172 325 (orange line) and shot 172 326 (light green line) drop sharply at time $\mathrm{\ \mathbin{\lower.3ex\hbox{$\buildrel> \over {\smash{\scriptstyle\sim}\vphantom{_x}}$}}\ }5000\ \textrm{ms}$
 due to plasma disruption. Thus, the present analysis only includes data for time $< 5000\ \textrm{ms}$
 . The ${q_{95}}$
 factor provides the ratio between the poloidal winding number m and the toroidal winding number n of the magnetic field lines on the surface corresponding to the $95\,\%$
 of the magnetic flux. For these discharges, the ratio $m/n$
 increases monotonically from the core to the edge surfaces. The ${q_{95}}$
 factor is a useful measure quantifying the number of rational surfaces, and hence the number of magnetic islands, that can be supported in the edge plasma. Higher ${q_{95}}$
 corresponds to increased number of closely spaced surfaces and higher ${q_{95}}$
 shear in the edge, which in turn yields higher number of islands and increased probability for overlap of neighbouring island chains. However, lower ${q_{95}}$
 can support wider islands in the edge plasma, which can result in wider stochastic edge region when RMP is applied. This will be further discussed in § 3.2.
(a) Inner-wall limited L-mode discharge plasma shape for shot 172 330 at 2600 ms showing an ECH/ECCD pulse consisting of electromagnetic waves from six gyrotrons (coloured lines in the plot). The solid lines on the plot represent magnetic flux surfaces. (b) Plasma current ${I_p}$ and (c) RMP coil current ${I_{\textrm{RMP}}}$
 time traces for shots 172 321–172 330. The grey shaded rectangles in (b) and (c) mark the time intervals of the ECH/ECCD pulses.

To minimize plasma response, measures were taken to maintain low plasma densities, ${n_e} = (0.9\unicode{x2013} 1.6) \times {10^{19}}\;{\textrm{m}^{ - 3}}$ , without triggering locked modes (standard $n = 1$
 error field correction applied via the ex-vessel C-coils), or sawtooth instabilities after $t = 1000\ \textrm{ms}$
 . For the simple inner-wall limited geometry, low plasma density and lack of toroidal plasma rotation (due to no neutral beam heating), the plasma response is likely weak, which allows to infer the relevant transport mechanisms from simulations of the vacuum magnetic field topology (as discussed in § 3.1). In each shot, a magnetic field perturbation was induced using DIII-D in-vessel I-coils (Evans et al. Reference Evans, Moyer, Watkins, Osborne, Thomas, Becoulet, Boedo, Doyle, Fenstermacher, Finken and Groebner2005a,Reference Evans, Moyer, Watkins, Thomas, Osborne, Boedo, Fenstermacher, Finken, Groebner, Groth and Harrisb), whose current amplitude was varied in the range ${I_{\textrm{RMP}}} ={\pm} (1\unicode{x2013} 6)\ \textrm{kA}$
 (see figure 2c and table 1). An important goal for these experiments was to measure changes in electron transport as a function of RMP coil current and link them to the amount of magnetic field stochasticity produced by the perturbation. In § 3.2 we will demonstrate that increasing the width of the stochastic edge region yields an increase in the observed suprathermal electron transport.
ECH/ECCD parameters for shots 172 322–172 330 obtained from TORAY code.

To quantify transport, the experiments utilized a technique called ‘electron tagging’, in which an ECH/ECCD pulse produces a temporally modulated and spatially localized enhanced current at a specific location within the discharge. In cyclotron heating, resonance occurs between the cyclotron frequency ${\omega _c}$ of electrons and the frequency ${\omega _{\textrm{ext}}}$
 of external beam of electromagnetic radiation. At DIII-D, the frequency of the gyrotrons is fixed at 110 GHz, which corresponds to a vertical resonant layer extending from the core to the edge plasma. The heating location is adjusted by aiming the gyrotrons so that the ECH/ECCD beam intersects the (~vertical) resonance layer at the desired toroidal flux/radial location, so that electrons at that location receive a ‘kick’ from the electromagnetic beam. Then, the time-dependent radial spreading of the electron perturbation can be observed from TS and ECE measurements. Each experimental shot discussed here included six ECH/ECCD pulses with typical pulse duration of ${\approx} 250\ \textrm{ms}$
 and amplitudes in the range $(1.1\unicode{x2013} 3.4)\ \textrm{MW}$
 . The six pulses occurred at fixed times in each discharge (see grey rectangles in figure 2b,c), which allows for meaningful comparison across discharges. Table 1 lists parameters relevant to the ECH/ECCD tagging and RMP perturbations used in the experiments. Here, ${I_{\textrm{RMP}}}$
 is the $n = 3$
 RMP coil current amplitude, ${P_{\textrm{ABS}}}$
 is the integrated power absorbed in each pulse, ${I_{\textrm{ECCD}}}$
 is the integrated current drive in each pulse and ${\rho _{\textrm{ECCD}}}$
 is the peak (normalized) radial location of the current drive. In all shots, the ECH pulse frequency was ${\nu _{\textrm{ECH}}} = 110\ \textrm{GHz}$
 , and the ECH polarization was X-mode second harmonic. The selected time slices feature different combinations of perturbation current, ECH absorbed power and ECCD current. All values in table 1 were obtained using TORAY (Prater et al. Reference Prater, Farina, Gribov, Harvey, Ram, Lin-Liu, Poli, Smirnov, Volpe, Westerhof and Zvonkov2008). TORAY is a ray tracing code for studying ECH and current drive in toroidal geometry. Figure 3 shows typical TORAY plots of the radial distribution of ECH heat flux and ECCD current flux, together with the integrated values used in table 1.
Shot 172 330 at $2600\ \textrm{ms}$ : radial distribution of (a) ECH power absorption; (b) ECCD current drive, obtained using TORAY code. Different colours correspond to the six gyrotrons available at DIII-D. The curve in black in each shot represents the total values.

2.2. Observation of suprathermal electron transport
The presence of suprathermal electrons can be inferred from an unusual increase in electron temperature in the edge plasma at normalized radius $\rho \mathrm{\ \mathbin{\lower.3ex\hbox{$\buildrel> \over {\smash{\scriptstyle\sim}\vphantom{_x}}$}}\ }1$ , observed in ECE radiometer measurements, as shown in figure 4. What is observed in the present experiments is a milder case of the more extreme example of non-thermal ECE shown by Harvey et al. (Reference Harvey, O'Brien, Rozhdestvensky, Luce, McCoy and Kerbel1993) (in general, $\rho$
 is the square root of the normalized toroidal flux surface). The DIII-D ECE radiometer (Austin & Lohr Reference Austin and Lohr2003) is a multichannel heterodyne system that provides electron temperature from measurements of optically thick, second harmonic ECE. The instrument viewing is along a horizontal chord at the tokamak midplane at a toroidal angle of 81 degrees. If the radial electron transport evolves according to classical diffusion, the electron temperature measured by ECE cords is expected to decrease with increasing radial location, following a similar pattern as the TS (Ponce-Marquez et al. Reference Ponce-Marquez, Bray, Deterly, Liu and Eldon2010) data (dashed green lines in figure 4). In all examined shots, the electron temperature measured by ECE cord 01 was consistently higher than the temperature measured by ECE cord 02, even though cord 01 is located at larger radial location $\rho$
 than cord 02.
Radial distribution of electron temperature from ECE for shot 172 330 (a) at $2500\ \textrm{ms}$ prior to an ECH/ECCD pulse (b) at $2560\ \textrm{ms}$
 during an ECH/ECCD pulse. Dashed green lines represent electron temperature from a fit to the TS data, which assume thermal electron distribution function.

Vertical green lines in figure 4 indicate the location of several rational surfaces, while the vertical red line in figure 4(b) indicates the location of the ECH/ECCD tagging for that discharge. The safety factor, or q profile, and the locations of the $q = 1$ and $q = 2$
 surfaces mentioned throughout the paper, are inferred from the magnetics-only Grad--Shafranov equilibrium solution. As no neutral beams were used in these discharges to keep the plasma rotation and plasma response minimized, the motional Stark effect measurements of the pitch angle in the plasma core were not available for the shots presented here.
Figure 4 shows a typical ECE profile from shot 172 330 before and during the ECH/ECCD pulse. While in both cases, the temperature measured by cord 01 is higher than the one measured by cord 02, the tagging technique clearly enhances the observed suprathermal ECE tail. Comparison between figures 4(a) and 4(b) reveals that, during the tagging, the entire ECE radial profile shifts to higher temperatures (note the difference in the abscissa) but the tail feature and the flat region around the $q = 2$ surface are preserved. The flattening of the ECE profile around the $q = 2$
 surface, which is observed for all examined discharges, can be associated with a $2/1$
 island located on that surface. A main difference between figures 4(a) and 4(b) is that prior to the pulse, the temperature measurements around the $q = 1$
 surface are somewhat flat, while during the pulse, the temperature profile in the same region exhibits a steep slope. Flat regions around the $q = 1$
 surface can be associated with the presence of a sawtooth instability or of another magnetic island chain. Since the conditions in the present discharges were carefully selected to minimize plasma response, a sawtooth instability was not observed for these shots, suggesting that the flat region is caused by a $q = 1$
 island chain. The plasma equilibrium in these discharges is calculated using magnetics-only equilibrium fitting (EFIT) reconstruction (as described in Heidbrink & White (Reference Heidbrink and White2020). The safety factor profile for both time slices shown in figure 4 is almost identical resulting in almost identical location of the rational surfaces. Therefore, the locations of the q surfaces (vertical green lines on the plots) do not change appreciably. Typical uncertainty in TS data is 10% (as verified using OMFIT), while the uncertainty in ECE measurements is assumed as 5%. The error bar on DIII-D ECE measurements is based on when the primary calibration was performed with the Michelson interferometer as described in Austin et al. (Reference Austin, Ellis, Doane and James1997).
Examination of similar ECE distribution plots for the other discharges leads to several observations: (i) the change around the $q = 1$ surface during the tagging is sensitive to ECH power, (ii) the first ECH/ECCD pulse in each shot leads to the most prominent suprathermal tail on the ECE distribution and (iii) the suprathermal tail is present with and without the RMP coil perturbations. However, in § 4, we discuss how the RMP coil perturbations indirectly affect the observed electron transport through the formation of stochastic edge plasma region.
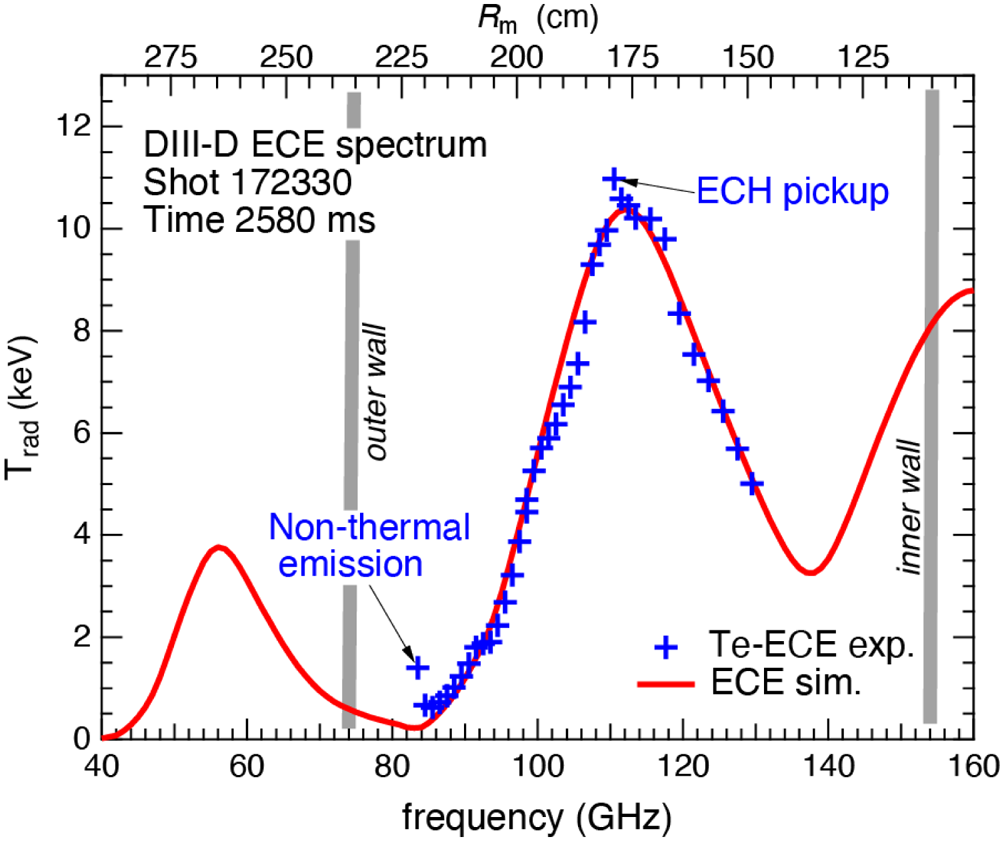
To verify that the observed increase in ECE measurements at $\rho \mathrm{\ \mathbin{\lower.3ex\hbox{$\buildrel> \over {\smash{\scriptstyle\sim}\vphantom{_x}}$}}\ }1$ is not caused by the drop of plasma density outside the separatrix, ECE simulations were conducted (using the ECESIM code (Austin & Pandya Reference Austin and Pandya2010)) to obtain the expected electron temperature as a function of frequency expected for a Maxwellian electron distribution. Figure 5 shows the simulation results for discharge 172 330 at $2580\ \textrm{ms}$
 (solid red line), together with the ECE measured values (blue crosses). The ECE simulations were informed by TS data. Deviation from predicted ECE temperature is clearly visible for frequencies $< 84\ \textrm{GHz}$
 . With the low-density L-mode edge, the ECE is marginally blackbody from the region inside the last closed flux surface, where channels >1 reside, and optically thin for the emission measured by channel 1. Nevertheless, as the simulation shows, one does not expect the edge emission to be elevated if the electron distribution is Maxwellian. Thus, this high temperature measured by ECE is likely caused by suprathermal electrons in the plasma, the radiation escaping due to the low optical thickness of the edge channels.
Electron temperature as a function of frequency for shot 172 330 at $2580\ \textrm{ms}$ . Solid red line shows the predicted values from ECE simulations assuming thermal electron distribution. Blue crosses mark experimental data from ECE measurements. The second axis under the plot shows the location of the ECE chords as a function of major axis ${R_m}$
 .
.
2.3. Runaway electrons
Runaway electrons could be distinguished from the general non-thermal electron population as they also induced gamma emission on fast neutron scintillator counters (figure 6). The hard X-ray signals are measured by an uncollimated plastic scintillator placed near the vacuum vessel. Signals from an adjacent ZnS scintillator that is an order of magnitude less sensitive to X-rays (Heidbrink Reference Heidbrink1986) confirms that the plastic scintillator is measuring hard X-rays. In figure 6, shot 172 321 (black line) does not exhibit peaks in the scintillator data. For most other shots, a large peak was observed during the first ECH/ECCD pulse followed by a much smaller peak during the second pulse and no peaks in subsequent pulses. This suggests that the pulses cause depletion of the runaway electrons. Shots 172 325 (light green line) and 172 326 (orange line) exhibit peaks both prior to and during the pulses, indicating an overall larger population of relativistic electrons in these shots.
Runaway-electron-induced gamma emission on the fast neutron scintillator counter for several shots from the same campaign. Shaded rectangle areas indicate the timing of the ECH pulses.

Interestingly, in each discharge, ECE deviations from the TS fits were observed during all ECH/ECCD pulses, but no peaks in the scintillator data were observed after the second pulse, indicating that electrons detected during subsequent pulses were non-thermal but also not relativistic. The ECE radiometers at DIII-D are preferentially sensitive to non-thermal synchrotron emission from energetic electrons. Due to the radial viewing geometry of the ECE radiometers on DIII-D, these diagnostics probe the high pitch-angle $(60\mathrm{^\circ\unicode{x2013}}90\mathrm{^\circ })$ and low-energy $(1\ \textrm{MeV}\unicode{x2013} 5\ \textrm{MeV)}$
 energetic electron population (Paz-Soldan et al. Reference Paz-Soldan, Cooper, Aleynikov, Eidietis, Lvovskiy, Pace, Brennan, Hollmann, Liu, Moyer and Shiraki2018). The HXR detectors used here cover all pitch angles $(0\mathrm{^\circ }\; \unicode{x2013} 90\mathrm{^\circ )}$
 and electron energy in the range $(5\ \textrm{MeV}\unicode{x2013} 30\ \textrm{MeV)}$
 . Thus, we expect that the signals showed in figure 6 correspond to energetic electrons with energy $\mathrm{\ \mathbin{\lower.3ex\hbox{$\buildrel> \over {\smash{\scriptstyle\sim}\vphantom{_x}}$}}\ }5\ \textrm{MeV}$
 , while the non-thermal electron populations detected by ECE after the first ECH/ECCD pulse have energies in the range $(1\ \textrm{MeV}\unicode{x2013} 5\ \textrm{MeV)}$
 . Accurate determination of energy and pitch angle is not available in the present experiments, but will be explored in an upcoming experimental campaign, which will utilize multiple additional diagnostics available at DIII-D, including the gamma ray imager (Pace et al. Reference Pace, Cooper, Taussig, Eidietis, Hollmann, Riso, Van Zeeland and Watkins2016) and visible synchrotron emission from a tangential camera (Yu et al. Reference Yu, Hollmann, Commaux, Eidietis, Humphreys, James, Jernigan and Moyer2013).
The observation of scintillator peaks only during the first ECH/ECCD pulse in some of the examined discharges suggests that the tagging technique can deplete the relativistic runaway population. While this effect has been observed empirically before, the exact mechanism leading to the release of the runaway electrons from the core to the edge plasma is not well understood. Since runaway electrons are accelerated to relativistic speeds likely during the current ramp-up at the beginning of the discharges, we do not expect that their initial transport is strongly affected by the island chain structure or stochastic regions in the magnetic field. However, their transition from strongly confined to lost orbits during an ECH/ECCD pulse can result from spontaneous or induced changes in the magnetic field topology, including stochastization of magnetic field lines near island X-points or island bifurcation. Interestingly, figure 6 shows smaller but distinct peaks in the period $1900\unicode{x2013} 2300\ \textrm{ms}$ for discharges 172 325 and 172 326 (light green and orange dots, respectively.) Since there is no sawtooth instability, ECH/ECCD pulse, or 3-D coil perturbation in this period, the observed peaks in the scintillator data suggest a spontaneous deconfinement of suprathermal electrons. Spontaneous island bifurcation has been recently observed in DIII-D H-mode experiments for rotating islands in the core plasma (Bardóczi & Evans Reference Heidbrink and White2021a).
2.4. Suppression of the suprathermal feature
In the present experiments, the observed suprathermal features did not appear to change appreciably as the amplitude of the RMP current was varied. For example, at 2600 ms the RMP current for shot 172 330 (figure 4b) was ${I_{\textrm{RMP}}} = 0\ \textrm{kA}$ ; yet the ECE plot exhibits a pronounced suprathermal tail. We note that for all examined cases, the first ECH deposition was performed with no RMP perturbation, and this first pulse always resulted in the largest electron temperature peak and the largest enhancement in the difference between trace 01 and trace 02 measurements. As mentioned in § 2.3, this effect is likely due to the release of runaway electrons. Thus, in § 4, where we discuss how RMP-induced edge stochasticity affects non-thermal electron transport, we do not consider data from these first ECH/ECCD pulses. In § 4, we show that for fixed properties of the ECH/ECCD pulses and fixed RMP current values, the non-thermal transport depends on the size, location and distribution of magnetic islands across the plasma.
To demonstrate that the suprathermal electron tail is persistent even after the first pulse (which depletes the runaway electrons), figure 7(b) shows the ratio between temperature measured by ECE cords 01 and 02 as a function of time for all examined shots. One expects that ${T_{01}}/{T_{02}}$ would be below one for discharges with electron temperature profiles that decrease monotonically in the plasma edge. In the examined discharges, this ratio is bigger than 1 for all cases, except shots 172 328 and 172 329, where the ECE measurement did not extend beyond $\rho \approx 0.8$
 and the outermost ECE channels 02 and 01 were located not in the edge, but in the core of the plasma. Therefore, we omit data from 172 328 and 172 329 in figure 7. While for all other shots, the ratio ${T_{01}}/{T_{02}}$
 increases during ECH/ECCD pulses (shaded areas in figure 7b,c), the effect is reversed for shot 172 326 (orange line), as can be seen in figure 7(c). Shot 172 325 (light green line) exhibits transitional behaviour, where the ratio is only slightly enhanced at the onset of an ECH/ECCD pulse and gradually decreases over a time period longer than the pulse.
Shots 172 322−172 327, 172 330: (a) time trace of calibrated ECH power, (b) time trace of the ratio ${T_{01}}/{T_{02}}$ and (c) zoomed in version of the same plot focused around a single ECH pulse. Shaded areas in (b) and (c) indicate the timing of the ECH pulses from (a). Dashed black lines in (a) and (b) mark the ECH pulse shown in (c).

Since the timing of the ECH/ECCD pulses was performed uniformly for all discharges (figure 7a), the observed differences are not due to offset in the pulse timing. From table 1, we see that the RMP coil current, the ECH power and the location of the ECCD current drive for shots 172 325 and 172 326 have similar values to other cases. The only parameter that differs considerably across the nine examined discharges is the ECCD current, which varies in the interval ${I_{\textrm{ECCD}}} = (45\unicode{x2013} 409)\ \textrm{kA}$ (see table 1). However, the relationship between ${T_{01}}/{T_{02}}$
 and ${I_{\textrm{ECCD}}}$
 does not seem to follow a simple (linear or power law) trend. Instead, the transitional and reversed behaviour of shots 172 325 and 172 326 seems to occur at intermediate values of the ECCD current ${I_{\textrm{ECCD}}} \approx (70 - 90)\ \textrm{kA}$
 . Thus, it is not clear if the observed phenomenon is caused by the value of ${I_{\textrm{ECCD}}}$
 . In the next section we compare data from experiments with vacuum field simulations, which suggest that the observed phenomenon is related to the characteristics of the island structure in these discharges.
3. Numerical analysis
A major goal of this study is to investigate how magnetic field topology affects the resulting cross-field electron transport. Possible mechanisms to consider include: (i) shift in the location of the $q = 1$ island surface with respect to the ECH/ECCD pulses, (ii) formation of stochastic region in the edge plasma due to island overlap, (iii) opening of additional small islands throughout the plasma. Due to the Hamiltonian nature of the magnetic field lines (Abdullaev Reference Abdullaev2010), these three mechanisms are not independent of each other. For example, opening of additional small islands can lead to island overlap in the edge plasma, which in turn produces an edge stochastic region. Vacuum simulations (discussed below) indicate that the transition to stochasticity leads to a shift in the location of large island chains throughout the plasma. Thus, for a fixed location of the ECH/ECCD pulse, the shifted location of the large island can change the resulting electron diffusion.
As the plasma response in the present experiments is assumed to be weak, we expect that conclusions about electron transport can be drawn from vacuum field simulations performed with the TRIP3D code (Evans et al. Reference Evans, Moyer and Monat2002) and the SURFMN code (Schaffer et al. Reference Schaffer, Menard, Aldan, Bialek, Evans and Moyer2008). In TRIP3D, the positions of 8550 B-field lines in toroidal geometry are evolved under conditions informed from the experiments. The results include Poincaré plots of each discharge at a specific time of interest and histograms of the field-line displacements as a function of their initial positions. In addition, SURFMN simulations were conducted to determine the number and width of magnetic islands for increasing mode number of the RMP perturbation and the vacuum island overlap width. Below, we show representative plots illustrating key features of the magnetic field. A full set of experimental and simulation plots will be provided by the authors upon reasonable request.
The TRIP3D simulations presented here include the axisymmetric equilibrium field with the superimposed perturbations from the external an internal perturbation coils and known intrinsic error fields but does not include the self-consistent plasma response currents. This approach is appropriate in this case of inner-wall limited discharge with no plasma rotation. Such discharges typically do not have significant plasma response. This is supported by very low levels in the $n = 1,\; 2$ , and 3 MHD activity in the experiment (as observed in the DIII-D n1rms, n2rms and n3rms signals). In all discharges in this experiment, the MHD activity levels were below 10% of what is typically observed in DIII-D H-mode plasmas with NBI torque injections.
3.1. Large islands location with respect to ECH/ECCD pulse
As we saw in § 2, figure 7, in most examined cases, the ECH/ECCD pulses tend to enhance the suprathermal effect, which is visible by the time trace of the ${T_{01}}/{T_{02}}$ ratio. However, in shot 172 325, this effect is diminished, and in shot 172 326, the ECH/ECCD pulse leads to a drop of the ${T_{01}}/{T_{02}}$
 ratio. One possibility is that the compared discharges had substantially different plasma conditions, perturbation parameters or features of the ECH/ECCD pulses. All discharges were low density, inner-wall limited, with only ohmic heating and no neutral beam heating. The possible role of changing plasma density in the core during ECH/ECCD pulses will be discussed in § 4. Examination of table 1 reveals that the 3-D perturbation current and properties of the ECH/ECCD pulses used in shots 172 325 and 172 326 are very similar to those used in other shots. Specifically, the perturbation current increases from $0\ \textrm{kA}$
 to $5.7\ \textrm{kA}$
 , the ECH power is approximately $2.2\ \textrm{MW}$
 and the ECCD current is in the range $(70\unicode{x2013} 90)\ \textrm{kA}$
 is deposited at radial location ${\rho _{\textrm{ECCD}}} \in (0.21,0.24)$
 . One notable difference is that shots 172 325 and 172 326 have the highest plasma current ${I_p}$
 and the lowest ${q_{95}}$
 values, which suggests that the radial location of the initial island structure (before RMPs are turned on) in these cases differ. This observation is interesting, as it suggests that, for a fixed location of the ECH/ECCD pulse, the location of the magnetic island chains can be manipulated to either enhance or diminish radial electron transport. Similarly, for a fixed distribution of island chains, we expect that differences in the electron transport will be observed when the tagging is performed at different locations with respect to the large islands.
In the present experiments, the ECH/ECCD deposition locations were similar across all shots, as seen from table 1. While, in principle, DIII-D has the flexibility of independently varying ${q_{95}}$ for more-or-less fixed $q$
 -values in the core, in the present study, shots with large ${q_{95}}$
 values have the $q = 1$
 surface closer to the magnetic axis. In addition, these shots have steeper rate of change $q^{\prime}$
 , which is why they can support larger number of rational surfaces, and therefore, more islands in the edge plasma. In contrast, here, shots with smaller ${q_{95}}$
 tend to support fewer larger island chains further away from the magnetic axis. Thus, since the location of the ECH/ECCD pulse is roughly fixed to $\rho \approx 0.1\unicode{x2013} 0.2$
 for all cases, it is expected that the electron tagging occurred at different locations with respect to the $q = 1$
 island for shots with different ${q_{95}}$
 values. In the presence of large magnetic islands, the radial electron diffusion should be slower than diffusion across unperturbed nested surfaces since the electrons need to diffuse across additional surfaces in the island interior. In addition, it has been experimentally demonstrated that electron heat diffusivity is reduced inside an island's O-point (Inagaki et al. Reference Inagaki, Tamura, Ida, Nagayama, Kawahata, Sudo, Morisaki, Tanaka and Tokuzawa2004). Thus, we expect that radial electron transport across islands can lead to electron sub-diffusion due to trapping effects. However, the motion of electrons trapped inside the separatrix of an island becomes ergodic and eventually all particles adopt the constants of motion of the exact resonance creating the island perturbation (Heidbrink & White Reference Heidbrink and White2020). As a result, the energy of electrons trapped in surfaces across the island width does not drop with radial location. This effect should be more pronounced for wider islands.
This is evident from the flat regions in the ECE plots (figure 4), which are assumed to coincide with island locations (e.g. consider the region around the $q = 2$ surface). While the ECE temperature stays constant throughout the width of the island, the temperature calculated from TS (green dashed line in figure 4) drops across the same region. Since the TS and ECE have different poloidal and toroidal locations, it is possible that ECE is probing the island chains’ O-points, while TS is probing X-points. It is also possible that the TS prediction yields dropping electron temperature because it is assuming Maxwellian electron distribution, which smoothens irregularities in the raw data. In either case, we expect that if the flat regions in ECE measurements coincide with island chain locations, when electrons escape the exterior surfaces of these islands, they will have higher energy than the energy they would normally have at the same radial location if the island perturbation were not there. In other words, islands can trap electrons, slowing down their cross-field diffusion, but electrons de-confined from islands will exhibit suprathermal transport in comparison with electrons that were not trapped by islands. The ECH/ECCD pulses used in the present experiments are a possible mechanism for such electron release from island surfaces.
ECCD techniques have been previously used to shrink magnetic islands (Gantenbein et al. Reference Gantenbein, Zohm, Giruzzi, Günter, Leuterer, Maraschek, Meskat and Yu2000; Petty et al. Reference Petty, La Haye, Luce, Humphreys, Hyatt, Lohr, Prater, Strait and Wade2004) if the current drive location is carefully chosen to coincide with the O-point of the island. If the current is driven off axis, but inside an island, it may be expected to still cause some shrinking due to perturbation of the separatrix surface and nearby surfaces. In the present analysis, we neglect this effect for the following reason. The current relaxation time for the ECCD in our experiments $\mathrm{\sim }1\ \textrm{s}$ , while the pulse duration used here is $250\ \textrm{ms}$
 . Thus, we expect that the ECCD pulses would not modify the parallel current profile. To confirm this, we compared the $q$
 profiles for a time slices right before and during ECCD pulses and verified that there are no changes. Therefore, we expect that the ECCD perturbations do not appreciably change the structure of the magnetic islands in the present experiments. This point is further discussed in the Appendix.
Based on the above logic, if the current drive location ${\rho _{\textrm{ECCD}}} < {\rho _{q = 1}}$ , where ${\rho _{q = 1}}$
 is the location of the $q = 1$
 island axis, the tagged electrons will have to diffuse across the large $q = 1$
 island, which should cause trapping and reduced suprathermal feature. In contrast, if ${\rho _{\textrm{ECCD}}}\mathrm{\ \mathbin{\lower.3ex\hbox{$\buildrel> \over {\smash{\scriptstyle\sim}\vphantom{_x}}$}}\ }{\rho _{q = 1}}$
 , the electrons can only be trapped in the smaller islands distributed at radius $\rho > {\rho _{\textrm{ECCD}}}$
 , and the suprathermal feature may not be appreciably affected. While the ECH/ECCD pulses are fairly localized, both the power deposition and the current drive have a finite spatial spread (see figure 3). To determine the spatial spread of electron tagging with respect to the spatial spread of the $q = 1$
 island chain, TORAY simulations were used to determine the 3-D location (in the radial, poloidal and toroidal directions) of each pulse, while TRIP3D Poincaré maps were computed to identify the underlying vacuum field structure for each discharge. While it was determined that none of the pulse locations coincided exactly with the O-point of the $q = 1$
 island, differences in suprathermal electron transport were observed when the tagging occurred at different locations with respect to ${\rho _{q = 1}}$
 .
.
Figure 8 shows the TRIP3D Poincaré plots for several shots where the observed electron transport behaviour differed during ECH/ECCD pulses. In these plots, the vacuum field topology was reconstructed for the toroidal plane corresponding to the toroidal location of the ECE diagnostic. Note that the TS diagnostic is located at a different toroidal angle where the magnetic topology is different from the one presented in the figure. A comparison between ECE line of sight and TS line of sight on TRIP3D plots can be found in Evans, et al. (Reference Evans, Ida, Ohdachi, Tanaka, Suzuki, Shafer, Unterberg, Inagaki and Austin2014).
TRIP3D Poincare plots of shot numbers (a) 172 322 and (b) 172 330, where enhancement of the suprathermal electron feature was observed during the ECH/ECCD pulse and shot numbers (c) 172 325 and (d) 172 326, where reduced transport was observed. All plots are generated for toroidal angle $\phi = 279\mathrm{^\circ }$ (TRIP3D coordinate system), which coincides with the location of the ECE diagnostic ($81\mathrm{^\circ }$
 in DIII-D machine coordinates).
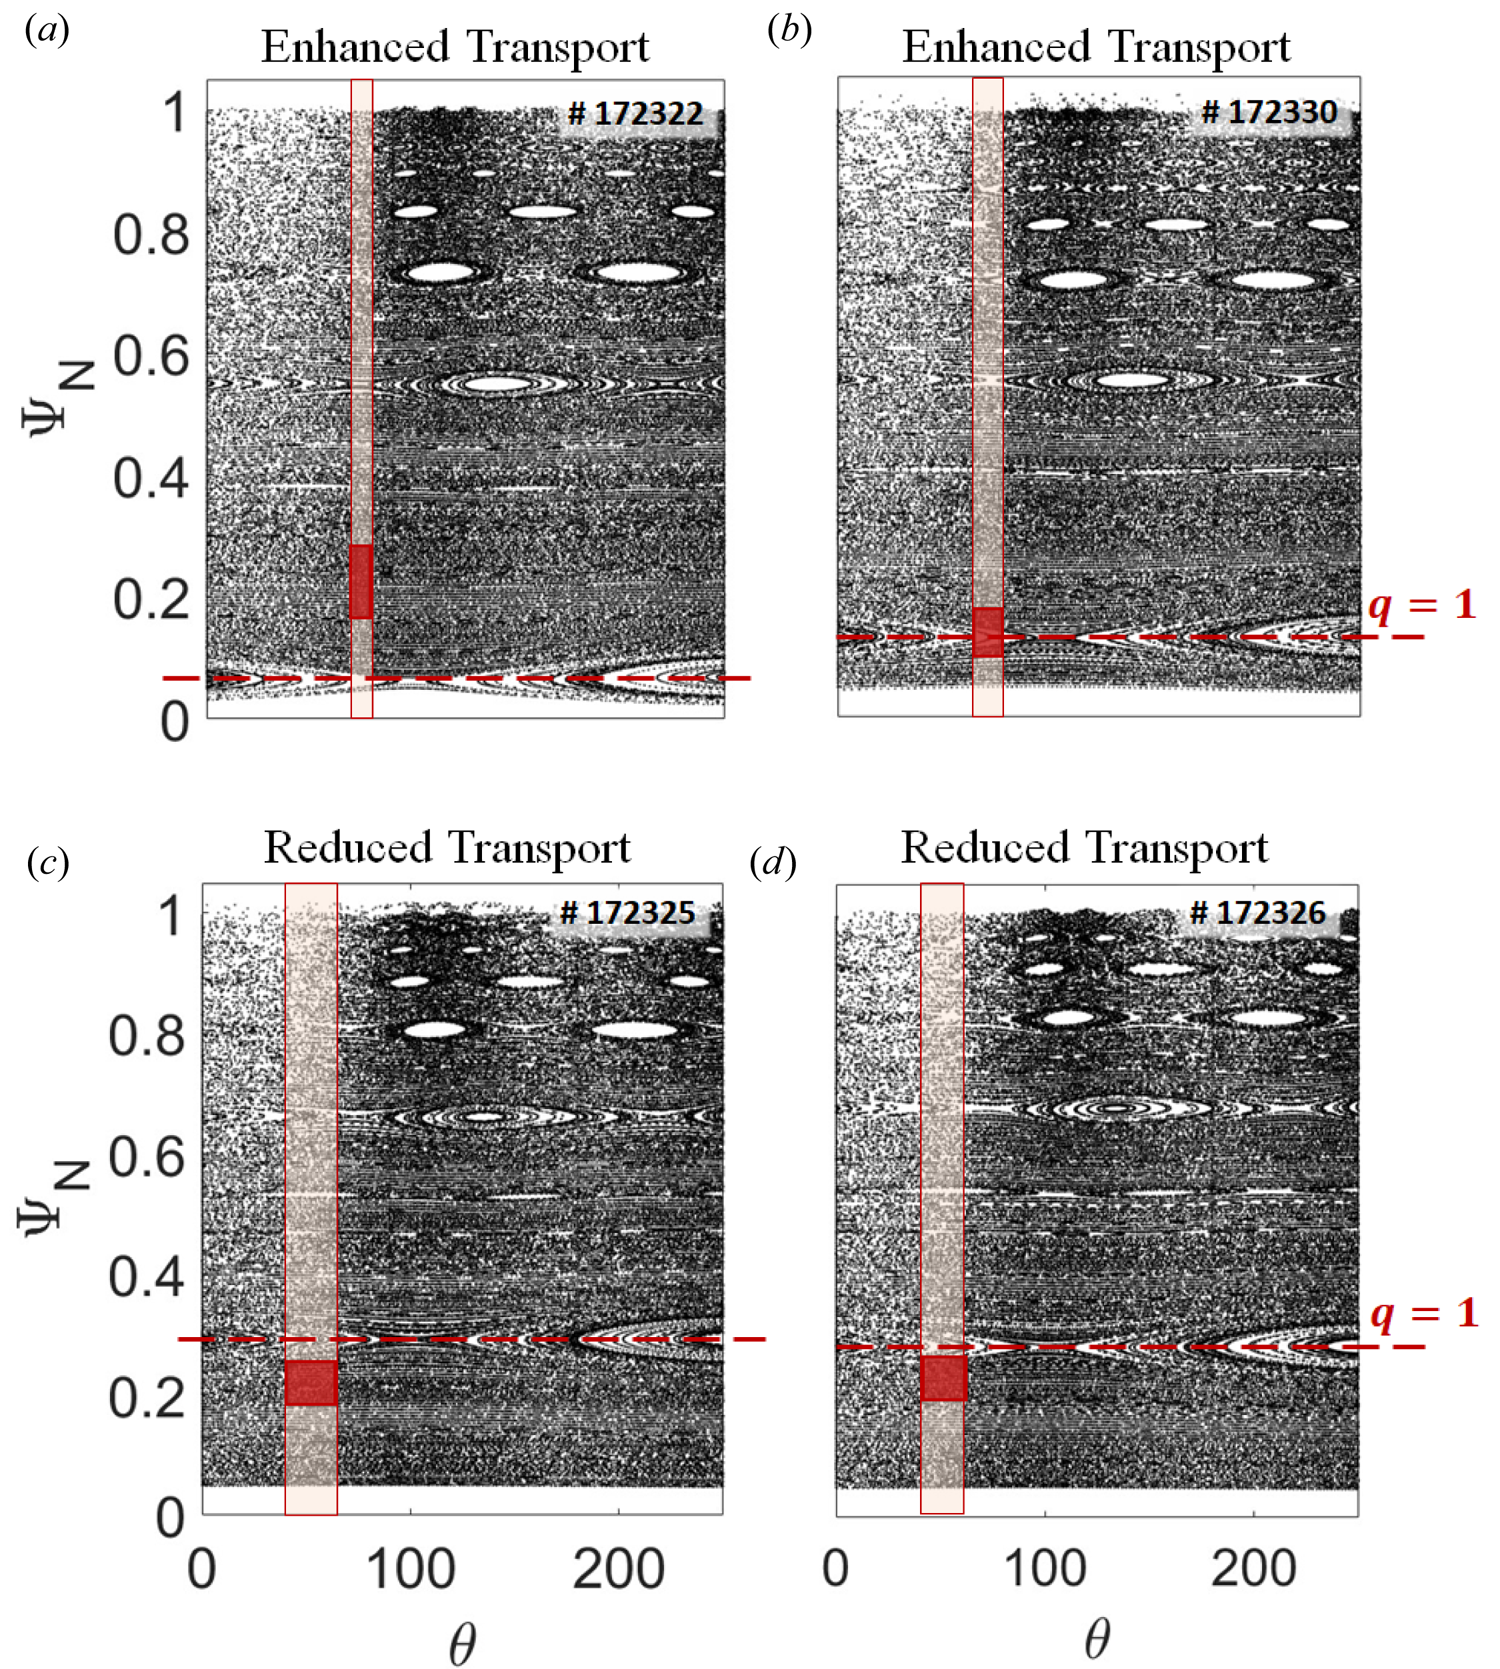
In shots 172 322 and 172 330 (figure 8a,b and red/magenta lines in figure 7), the suprathermal feature was enhanced during each pulse, while in shot 172 326 (figure 9d and orange line in figure 7) the suprathermal feature was reduced during each pulse. For shot 172 325 (figure 8c and light green line in figure 7), the suprathermal feature was initially diminished, and subsequently slightly increased during the pulse, which is what we consider an intermediate behaviour. Red rectangles in each plot in figure 8 indicate the location of the ECH/ECCD pulse with respect to a large magnetic island residing on the $q = 1$ surface (marked by a dashed red line). In the enhanced-transport cases, the location of the electron tagging is at ${\rho _{\textrm{ECCD}}} > {\rho _{q = 1}}$
 (figure 8a) or close to the X-point of the $q = 1$
 island (figure 8b) and the radial ‘line of sight’ (marked by extended light pink rectangles) passes through the X-points of other islands. In contrast, in the reduced-transport cases (figure 8c,d), the tagging occurs at ${\rho _{\textrm{ECCD}}} < {\rho _{q = 1}}$
 and the line of sight for the tagged electrons passes through thicker regions of neighbouring islands. Examination of the other discharges confirms the trends observed in figure 8.
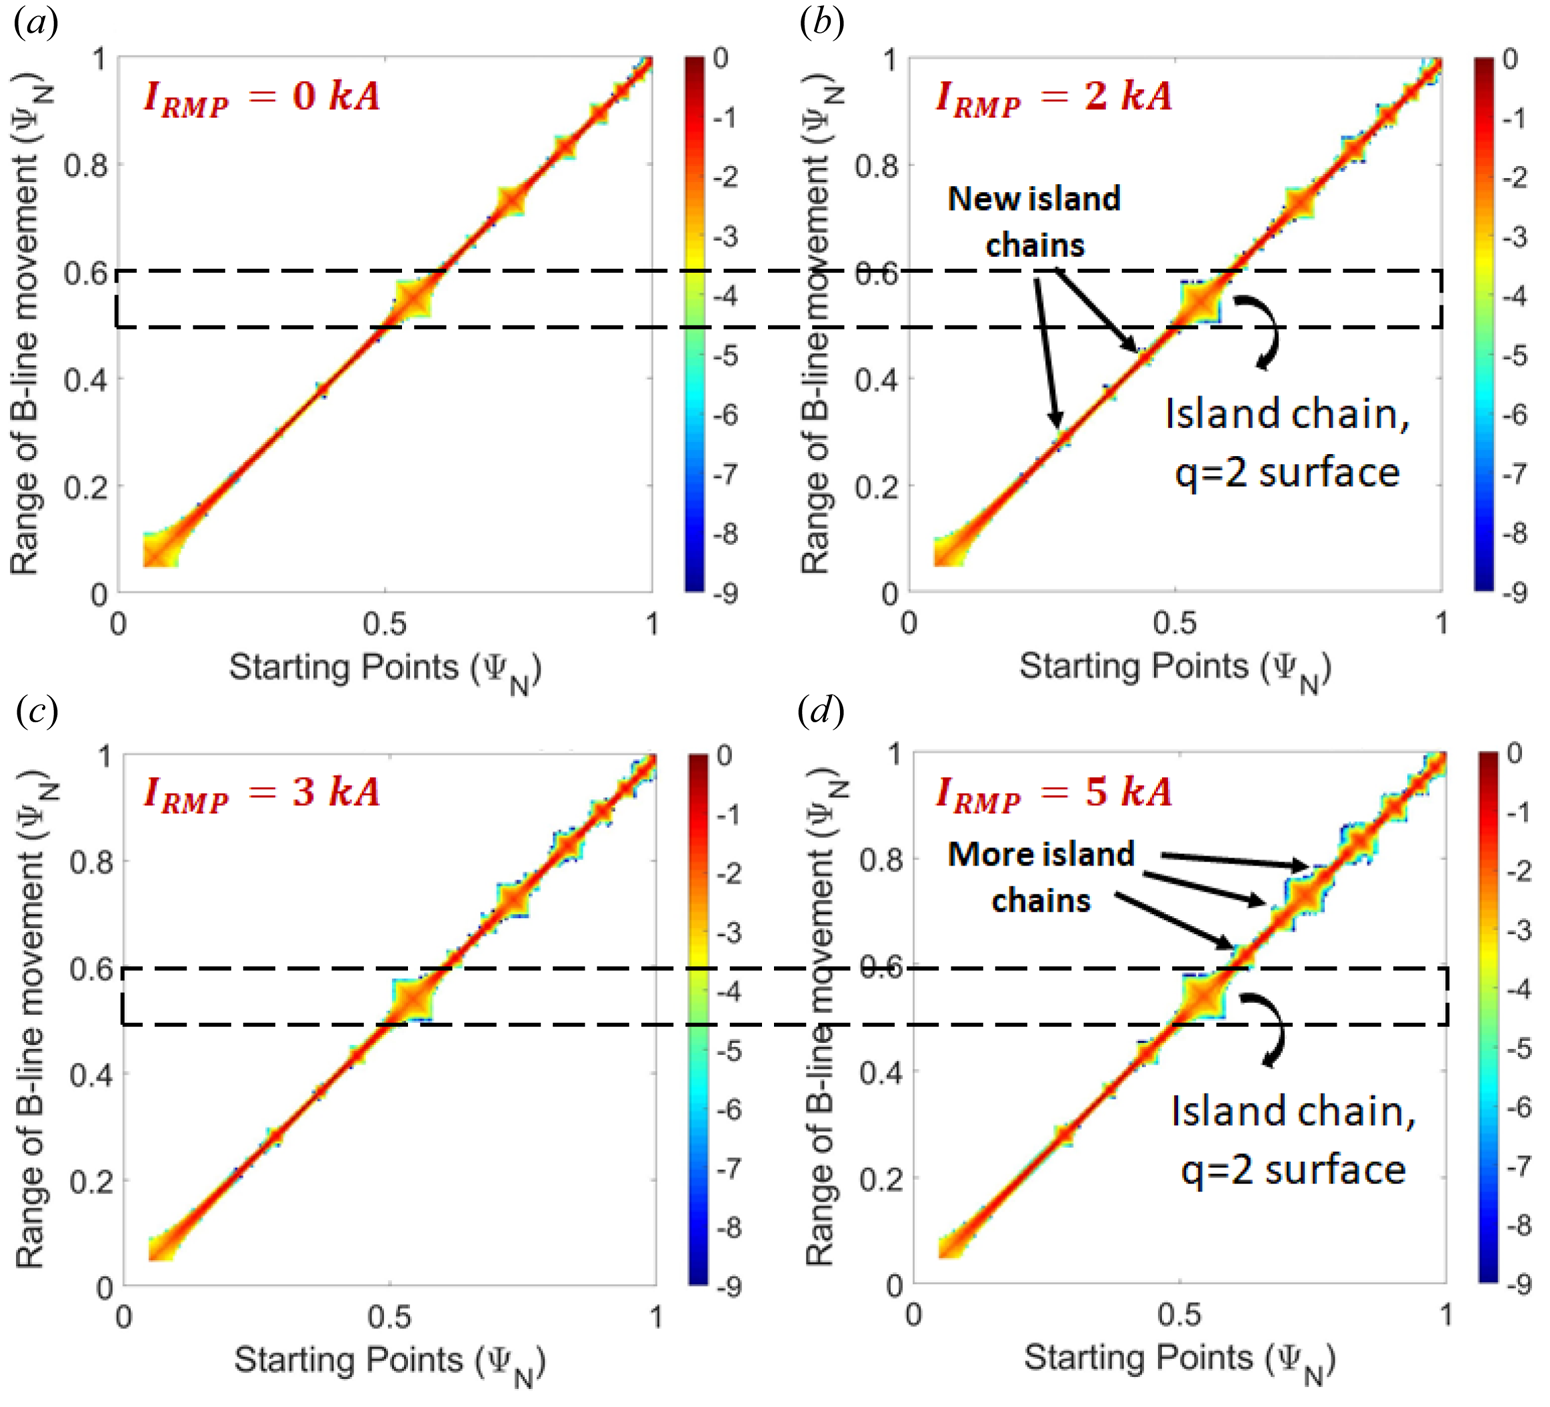
Shot 172 322: histogram of B-line displacements from the original position (a) at $2600\ \textrm{ms}$ when ${I_{\textrm{RMP}}} = 0\ \textrm{kA}$
 , (b) at $3100\ \textrm{ms}$
 when ${I_{\textrm{RMP}}} = 2\ \textrm{kA}$
 , (c) at $4100\ \textrm{ms}$
 when ${I_{\textrm{RMP}}} = 4\ \textrm{kA}$
 and (d) at $5100\ \textrm{ms}$
 when ${I_{\textrm{RMP}}} = 5\ \textrm{kA}$
 . The colour bar is a log scale of the normalized number of field lines, crossing a given location in space.
These observations are compared against findings from Evans et al. (Reference Evans, Ida, Ohdachi, Tanaka, Suzuki, Shafer, Unterberg, Inagaki and Austin2014), where measurements of changes in the time it takes for modulated electron cyclotron heat pulses to propagate across the O-point of a $2/1$ magnetic island in DIII-D were consistent with a model in which the island spontaneously bifurcates from smooth flux surfaces to a partially stochastic region. In other words, heat transport was observed to be slower across the unperturbed island surfaces and faster across partially stochasticized regions. In the present study, we find evidence that suprathermal electron transport is suppressed when the electron cyclotron heat pulse diffuses across the large $q = 1$
 island and enhanced when the pulse diffuses across island X-points, where local stochasticity is expected to occur. Although these results are preliminary, they hint towards the possible role of magnetic islands into acceleration and trapping of electrons. This will be further explored by the authors in a next experimental campaign where the ECH/ECCD pulse will be delivered at different locations with respect to the large island chains.
3.2. Transition to stochasticity
It has been proposed that raising RMP coil currents can induce a transition from a regime dominated by nested magnetic flux surfaces through a regime with a variety of magnetic islands to a regime where the islands have ‘overlapped’ to produce an extended region of stochastic field lines. A regime with ideal nested flux surfaces is not accessible in the present experiments even at ${I_{\textrm{RMP}}} = 0\ \textrm{kA}$ as magnetic perturbations from intrinsic error fields and EFC coils always lead to the formation of island structures. In particular, even in the absence of RMPs, all examined experiments feature at least two large island chains, one at the $q = 1$
 surface and another one at the $q = 2$
 surface. To produce a region of stochastic field lines in the edge plasma, RMPs were used to create and grow islands at the $n = 3$
 surfaces until island overlap was achieved. We observe that increasing the RMP coil current leads to both the formation of new smaller islands and stochastization of the large islands’ exteriors. As discussed below, the critical current value for the transition to stochasticity is dependent on the ${q_{95}}$
 for each discharge.
Possible uncertainties in the calculation of the magnetic islands result from the uncertainties in the location of the resonant surfaces (uncertainties in safety factor profile in Grad--Shafranov equilibrium reconstruction) and the uncertainties in the estimation of the magnitude of the perturbation field in the plasma (uncertainties in the measurements of coil currents and representation of the coil geometries as simplified thin wires). Given the stochastic nature of the fields near the island chains and in the plasma edge, detailed quantification of uncertainties is quite complicated and lies outside of the scope of this paper.
Figure 9 shows histograms of the B-line displacements from their initial position computed with TRIP3D using initial conditions from shot 172 322. In this discharge, the ${I_{\textrm{RMP}}}$ was varied from $0\ \textrm{kA}$
 to $5\ \textrm{kA}$
 in three steps (red line in figure 2c). The colour bar in each plot from figure 9 represents a log scale of the normalized number of times a B-line intersected a given location in space. In this representation, narrow red line regions correspond to nested magnetic surfaces, or locations in space where the lines did not deviate significantly from their initial positions as the simulation was advanced. Wide rhombus regions on the plots indicate the locations of magnetic island chains, and irregular blue regions suggest stochastization of the field lines.
In figure 9(a), for ${I_{\textrm{RMP}}} = 0\ \textrm{kA}$ , the B-line histogram shows two big islands, located at the $q = 1$
 and $q = 2$
 surfaces, and $4\unicode{x2013} 5$
 smaller, but distinct islands located between the $q = 2$
 surface and the edge plasma. These initial islands are created by the intrinsic error fields in DIII-D (shifted and tilted poloidal field coils and B-field buswork) and by the $n = 1$
 error field correction currents (in the DIII-D C-coils). The values for the intrinsic fields in DIII-D have been previously measured and discussed in more detail in Orlov et al. (Reference Orlov, Moyer, Evans, Mordijck, Osborne, Fenstermacher, Snyder and Unterberg2010, Reference Orlov, Moyer, Evans, Wingen, Buttery, Ferraro, Grierson, Eldon, Watkins and Nazikian2014, Reference Orlov, Moyer, Evans, Paz-Soldan, Ferraro, Nazikian, deGrassie, Grierson, Eldon, Fenstermacher and King2016). As the current in the RMP coils is increased to ${I_{\textrm{RMP}}} = (2\unicode{x2013} 3)\ \textrm{kA}$
 (figure 9b,c), new island chains emerge between the $q = 1$
 and $q = 2$
 surfaces and the previous island chains develop slightly stochastic exterior (blue colour around rhombus structures). For ${I_{\textrm{RMP}}} = 5\ \textrm{kA}$
 (figure 9d), more island chains emerge in the edge region and stochastic exteriors are enhanced. However, even at ${I_{\textrm{RMP}}} = 5\ \textrm{kA}$
 , the island chains in shot 172 322 remain distinct all the way to the edge and no significant formation of a connected stochastic layer is observed.
The transition to a regime where the edge islands overlap, resulting in a region of stochastic field lines, is visible when higher RMP current is applied. Figure 10 shows that, at ${I_{\textrm{RMP}}} =- 6\ \textrm{kA}$ for shot 172 330 (figure 10a) and at ${I_{\textrm{RMP}}} = 5.7\ \textrm{kA}$
 for shot 172 326 (figure 10b), a stochastic layer forms in the region ${\varPsi _N} = (0.8\unicode{x2013} 1)$
 . These regions are not fully stochastic as remnants of island core structures are still visible in both cases. However, the stochastic exterior of these former island chains now surrounds all of them in the edge region. These results are further confirmed from SURFMN simulations, which show that an overlap of the edge island chains occurs at ${\varPsi _N} = 0.84$
 for ${I_{\textrm{RMP}}} =- 6\ \textrm{kA}$
 in shot 172 330 (figure 10c) and at ${\varPsi _N} = 0.80$
 for ${I_{\textrm{RMP}}} = 5.7\ \textrm{kA}$
 in shot 172 326 (figure 10d). Comparison of TRIP3D histograms and SURFMN plots for the rest of the examined experiments reveals that a stochastic edge region is also observed to appear in shots 172 324–172 328 at ${I_{\textrm{RMP}}} = 5.7\ \textrm{kA}$
 and in shot 172 329 at ${I_{\textrm{RMP}}} =- 6\ \textrm{kA}$
 , suggesting that the phenomenon is repeatable and observable with both positive and negative currents.
TRIP3D histograms of B-line spread at $3100\ \textrm{ms}$ for (a) shot 172 330 and (b) shot 172 326. SURFMN plots of island width at $3100\ \textrm{ms}$
 for (c) shot 172 330 and (d) shot 172 326 Shaded regions in (c) and (d) indicate the width of stochastic region, where island surfaces overlap.

For the $n = 3$ perturbations used here, the six I-coils are energized in $+- +- +-$
 or $-{+} -{+} -{+}$
 patterns, and what is shown here for ${I_{\textrm{RMP}}}$
 is the value in the first of these coils (the one located at 30 degrees toroidally in DIII-D). Thus, the difference between positive and negative ${I_{\textrm{RMP}}}$
 is shifting the perturbation by 60 degrees toroidally, which results in shifted toroidal locations of the island O-points and X-points, but no difference in the number, width or radial location of the island chains. The phase of the ${I_{\textrm{RMP}}}$
 (0 or 60 degrees) changes how that perturbation couples to the intrinsic and EFC fields (which are fixed toroidally).
Examination of similar histograms calculated for the rest of the experiments suggests that the RMP current threshold needed to transition from individual islands with small stochastic exteriors (figure 9d) to island remnants surrounded by common stochastic region (figure 10a,b) varies with the q profile for each shot. The present experiments were not performed with small enough ${I_{\textrm{RMP}}}$ steps to pinpoint the exact threshold value for each q profile. However, for a fixed type of perturbation (here $n = 3$
 perturbation from RMP coil), shots with smaller ${q_{95}}$
 values are observed to form wider stochastic regions in the edge plasma. This makes sense as the smaller ${q_{95}}$
 means that fewer but larger islands are present close to the edge and small island growth can lead to overlap. However, cases with higher ${q_{95}}$
 value can support more perturbation modes in the edge, i.e. more island chains. In these cases, a transition to stochasticity can be achieved by a combination of perturbations from different coils, which can be desirable as it reduces the threshold current requirement for each coil. Finally, we note that once the stochastic regions form (figure 10a,b), the locations of the $q = 1$
 and $q = 2$
 islands shift towards smaller ${\varPsi _N}$
 . This suggests that if the observed electron transport is dependent on the location of $q = 1$
 island chains with respect to the ECH/ECCD pulses (as discussed in § 3.1), the controlled formation of a stochastic region in the edge plasma can be used as a method to manipulate electron transport.
4. Discussion
4.1. The role of changing plasma density
In § 2 we distinguished two types of energetic electrons: relativistic runaway electrons that occur during the first ECH/ECCD pulse for most discharges, and electrons that are neither thermal nor relativistic, observed during subsequent ECH/ECCD pulses. The former resulted in both enhanced ECE temperatures and signals on the HXR detectors, which suggest that their energy is $\mathrm{\ \mathbin{\lower.3ex\hbox{$\buildrel> \over {\smash{\scriptstyle\sim}\vphantom{_x}}$}}\ }5\ \textrm{MeV}$ . The latter type of energetic electrons caused elevated ECE temperature profiles with suprathermal feature in the edge plasma measurements, but they did not yield substantial peaks on the HXR detectors, suggesting that the energy of these electrons is $< 5\ \textrm{MeV}$
 . We quantified the non-thermal feature using the ratio ${T_{01}}/{T_{02}}$
 , where ${T_{01}}({T_{02}})$
 is the temperature of ECE chord 1 (chord 2). A value ${T_{01}}/{T_{02}} > 1$
 indicates the presence of suprathermal electrons and the bigger the ratio, the more pronounced is the non-thermal feature. In figure 8, we showed that the ECH/ECCD pulses enhance the ratio ${T_{01}}/{T_{02}}$
 for most discharges but decrease the ratio for shots 172 325 and 172 326. In this section, we discuss the possible role of changing plasma density in the observed transport differences.
DIII-D experiments using the gamma ray imager (GRI) system (Pace et al. Reference Pace, Cooper, Taussig, Eidietis, Hollmann, Riso, Van Zeeland and Watkins2016; Paz-Soldan et al. Reference Paz-Soldan, Cooper, Aleynikov, Eidietis, Lvovskiy, Pace, Brennan, Hollmann, Liu, Moyer and Shiraki2018) have suggested that the energetic electron distribution ${f_e}$ for low-density (ohmic heating only) discharges exhibit a non-monotonic feature as a function of electron energy ${E_e}$
 , with a peak location dependent on the plasma density (see figure 11 from Paz-Soldan et al. Reference Paz-Soldan, Cooper, Aleynikov, Eidietis, Lvovskiy, Pace, Brennan, Hollmann, Liu, Moyer and Shiraki2018). The energies recorded in those experiments were in the range ${E_e} \in (3\unicode{x2013} 16)\ \textrm{MeV}$
 . That study showed that as the plasma density was increased from ${n_e} = 1 \times {10^{19}}\;{\textrm{m}^{ - 3}}$
 to ${n_e} = 1.5 \times {10^{19}}\;{\textrm{m}^{ - 3}}$
 , the whole ${f_e}$
 profile shifted downwards (i.e. less counts at all energies) and the distribution peak location shifted from $7\;$
 to $5\ \textrm{MeV}$
 . In other words, for such discharge conditions an increased plasma density leads to suppression of the suprathermal features by both decreasing the total number of energetic electrons detected and the peak ${E_e}$
 value. In the present experiments, where the plasma conditions are similar to those in Paz-Soldan et al. (Reference Paz-Soldan, Cooper, Aleynikov, Eidietis, Lvovskiy, Pace, Brennan, Hollmann, Liu, Moyer and Shiraki2018), the electron density ${n_e}$
 was measured using multichannel CO2 interferometer (MCI) and TS data (Ponce-Marquez et al. (Reference Ponce-Marquez, Bray, Deterly, Liu and Eldon2010). In the absence of ECH/ECCD pulses, the mid-plane, line-averaged plasma density obtained from MCI data (Van Zeeland & Carlstrom Reference Van Zeeland and Carlstrom2004) (figure 11a) shows electron densities within the range ${n_e} \approx (1\unicode{x2013} 1.5) \times {10^{13}}\ \textrm{c}{\textrm{m}^{ - 3}}$
 , which is similar to the densities examined in Paz-Soldan et al. (Reference Paz-Soldan, Cooper, Aleynikov, Eidietis, Lvovskiy, Pace, Brennan, Hollmann, Liu, Moyer and Shiraki2018). Similar density range was observed from TS data.
Electron density from MCI (a) mid-plane, line-averaged data (b) line-averaged data from a chord viewing the edge plasma.

Comparison with scintillator data (figure 6) suggests that the shots with lowest electron density (1 672 327–172 330) exhibit the most pronounced peaks, i.e. highest count of relativistic runaway electrons, during the first ECH/ECCD pulse. This observation is in agreement with the findings from Paz-Soldan et al. (Reference Paz-Soldan, Cooper, Aleynikov, Eidietis, Lvovskiy, Pace, Brennan, Hollmann, Liu, Moyer and Shiraki2018). However, in figure 6 we also observed scintillator data peaks prior to the first ECH/ECCD pulse for discharges 172 325 and 172 326, which have higher line-averaged electron density. Therefore, we conclude that plasma density alone cannot account for the observation of runaway electrons in our study. We further observe that, during all ECH/ECCD pulses, the electron density increases, on average, by $0.5 \times {10^{13}}\ \textrm{c}{\textrm{m}^{ - 3}}$ . The increased density during ECH appears to result partially from increased carbon influx due to higher power flux to the walls based on partially ionized edge carbon emission and core Zeff measurements. The suprathermal features are enhanced for most cases, except for discharges 1 723 225 and 172 326. For these two cases, line-averaged MCI densities measured in the edge plasma suggest that shots 172 325 and 172 326 consistently had the highest electron density in the edge, which is expected as ${n_e}\sim {I_p}$
 , all else being equal. This may be one reason why, for these shots, the suprathermal feature in figure 6 was suppressed during ECH/ECCD pulses. However, high density in the edge does not explain the observation of runaway electron peaks and suprathermal tails in the absence of ECH/ECCD for these two shots. Thus, we conclude that, while electron density is an important factor, it does not explain all features of the non-thermal electron transport observed here.
4.2. The role of RMP perturbations
The vacuum field simulation results from § 3 suggest that suprathermal electron transport is enhanced or suppressed based on the deposition location of the ECH/ECCD pulse with respect to the $q = 1$ island chain. Specifically, for similar radial locations of the ECH/ECCD pulse, comparison of ECE signals with vacuum field simulations suggests that suprathermal transport is diminished when ${\rho _{\textrm{ECCD}}} < {\rho _{q = 1}}$
 (shots 172 325 and 172 326), possibly due to electron trapping in the $q = 1$
 island chain. We further discussed that the formation of a stochastic region in the edge plasma due to sufficient RMP perturbations can lead to a shift in the location of the unperturbed island chains in the core plasma. Thus, we expect that the RMPs can affect electron transport in two ways: (i) directly – by eliminating small islands in the edge plasma (reducing small trapping effects and enabling chaotic trajectories) and (ii) indirectly – by moving the core islands to smaller radial locations (reducing large trapping effects).
Since both mechanisms are expected to reduce the island trapping effects, we expect that increasing the width of the stochastic region should lead to increased suprathermal effect. Figure 12 shows a plot of the ratio ${T_{01}}/{T_{02}}$ as a function of the vacuum islands overlap width (viow) (Evans et al. Reference Evans, Orlov, Wingen, Wu, Loarte, Casper, Schmitz, Saibene, Schaffer and Daly2013) for discharges that simultaneously had non-zero RMP and the ECE chords 01 and 02 located in the edge plasma. While not ideal, an almost linear relationship can be observed for time scales of the order of ${\approx} 200\ \textrm{ms}$
 , where an increasing viow leads to an enhanced ${T_{01}}/{T_{02}}$
 ratio, supporting the hypothesis that wider stochastic region in the edge can lead to enhanced electron transport. Note, however, that the width of the stochastic region does not only depend on the current amplitude in the RMP coils. For a fixed current amplitude, viow further depends on the initial field topology, which is discussed later in this section.
Vacuum islands overlap width (viow) in units of normalized poloidal flux versus the ratio ${T_{01}}/{T_{02}}$ during RMP coil perturbation. Here, ${I_{\textrm{RMP}}} = 5.\textrm{7}\ \textrm{kA}$
 for shots 172 324–172 327 and ${I_{\textrm{RMP}}} =- 6\ \textrm{kA}$
 for shot 172 330. Data here were collected during the time interval $3180\ \textrm{ms}\unicode{x2013} 3200\ \textrm{ms}$
 .
.

Deviations from a linear trend in figure 12 may result from several inconsistencies among the discharges. First, the ECH power and the ECCD current drive are not identical for all shots. Specifically, the typical ECH power for pulses in shot 172 330 (magenta colour in figure 7a) was $2.7\unicode{x2013} 3\ \textrm{MW}$ , while the power in shot 172 324 was as low as $1.6\ \textrm{MW}$
 and approximately $2.2\ \textrm{MW}$
 for other shots. Additionally, as seen from figure 7(a), the pulses in shot 172 330 exhibit large fluctuations (${\sim} 10\ \textrm{ms}$
 drops in power), which result in fluctuations in the ${T_{01}}/{T_{02}}$
 . This leads to the large error bar in the ${T_{01}}/{T_{02}}$
 values for this shot (magenta colour in figure 12).
Data in figure 12 correspond to a time periods where the magnitude of the RMP coil currents was $0\ \textrm{kA}$ for shot 172 324, $- 6\ \textrm{kA}$
 for shot 172 330 and $5.7\ \textrm{kA}$
 for the other three shots. As can be seen in figure 12, similar ${I_{\textrm{RMP}}}$
 can result to different widths of the edge stochastic region, which is likely due to the differences in the ${q_{95}}$
 profile. Figure 13(a) shows a plot of viow as a function of ${q_{95}}$
 for a time interval without RMP (unfilled diamonds) and a time interval with RMP (filled diamonds). As can be seen, in the absence of RMP, the discharges with the largest ${q_{95}}$
 have the largest viow. This makes sense since discharges with large ${q_{95}}$
 already support more islands in the edge (due to other coil perturbations), which leads to higher probability for overlap even without the additional RMP. When RMPs with similar ${I_{\textrm{RMP}}}$
 are applied, the discharges with the smallest ${q_{95}}$
 form the largest viow. Without perturbation, those discharges support fewer islands in the edge plasma, but those islands are larger. Thus, when the RMPs are applied, a modest growth of the larger islands can lead to closing of the gaps between them and trigger the onset of stochasticity due to island overlap.
(a) Vacuum islands overlap width (viow) versus ${q_{95}}$ . Unfilled symbols correspond to time with no RMP, while filled symbols correspond to times when the RMP coils are on. (b) The ratio ${T_{01}}/{T_{02}}$
 versus ${q_{95}}$
 during RMP coil perturbation. For both plots, when RMP is on, ${I_{\textrm{RMP}}} = 5.7\ \textrm{kA}$
 for shots 172 324–172 327 and ${I_{\textrm{RMP}}} =- 6\ \textrm{kA}$
 for shot 172 330.

The EFIT calculation of the $q$ profile for discharge 172 330 at time 2960 ms right before an ECH/ECCD pulse is applied (black dashed line) and time 3080 ms during the ECH/ECCD pulse (magenta dashed line).

Figure 13(b) shows the plot of ${T_{01}}/{T_{02}}$ as a function of ${q_{95}}$
 for a time interval with perturbation coils on and similar RMP currents in all shots, but no ECH/ECCD tagging. This plot supports the observation that, for similar ${I_{\textrm{RMP}}}$
 , discharges with smaller ${q_{95}}$
 exhibit a more pronounced suprathermal feature, possibly due to the formation of a wider edge stochastic region. The relationship between safety factor and edge plasma transport has been previously discussed in the context of ELM suppression studies in DIII-D. The ELMs are potentially damaging pedestal instabilities in the edge tokamak plasmas that can be caused by edge current density and/or pressure driven peeling-ballooning instabilities (Schmitz et al. Reference Schmitz, Evans, Fenstermacher, Frerichs, Jakubowski, Schaffer, Wingen, West, Brooks, Burrell and DeGrassie2008). It has been demonstrated (Fenstermacher et al. Reference Fenstermacher, Evans, Osborne, Schaffer, Aldan, Degrassie, Gohil, Joseph, Moyer, Snyder and Groebner2008) that ELM suppression in H-mode plasma can be correlated with a threshold width of the edge stochastic region. Similar to the present work, the stochastic region in Fenstermacher et al. (Reference Fenstermacher, Evans, Osborne, Schaffer, Aldan, Degrassie, Gohil, Joseph, Moyer, Snyder and Groebner2008) is defined as the edge region having magnetic islands with Chirikov parameter $> 1$
 (i.e. island overlap), based on vacuum calculations excluding the self-consistent plasma response. The threshold width of the stochastic region needed for the ELM suppression in Fenstermacher et al. (Reference Fenstermacher, Evans, Osborne, Schaffer, Aldan, Degrassie, Gohil, Joseph, Moyer, Snyder and Groebner2008) was found to vary with the safety factor profile. Depending on the ${q_{95}}$
 , the threshold width could be achieved by increasing the $n = 3$
 RMP field strength or by varying the combinations of $n = 3$
 and $n = 1$
 perturbations.
(a) Scintillator signals for discharges 172 321–172 330. (b) Ratio between temperature measured by ECE cords 01 and 02 for discharges 172 321–172 330.

While the present experiments are using low-confinement (L-mode) discharges and the studied transport is suprathermal electrons (versus ELMs in H-mode plasmas in Fenstermacher et al. Reference Fenstermacher, Evans, Osborne, Schaffer, Aldan, Degrassie, Gohil, Joseph, Moyer, Snyder and Groebner2008), future extension of the present study may be helpful in explaining the physical mechanisms guiding the correlation between ELMs suppression and width of the edge stochastic region. The study in Fenstermacher et al. (Reference Fenstermacher, Evans, Osborne, Schaffer, Aldan, Degrassie, Gohil, Joseph, Moyer, Snyder and Groebner2008) demonstrates that increasing width of the edge stochastic region leads to ELM suppression, while in the present study, we find that increasing viow leads to enhanced radial transport of suprathermal electrons. Thus, an initial hypothesis can be formed suggesting that release of suprathermal electron populations through radial transport may result in mitigation of edge/pedestal instabilities, such as ELMs. The possible relationship between energetic electrons and ELMs is not a new idea. For example, measurements of microwave and X-ray emission during ELM activity in the MAST tokamak indicate the presence of suprathermal, magnetic-field-aligned electron populations (Freethy et al. Reference Freethy, McClements, Chapman, Dendy, Lai, Pamela, Shevchenko and Vann2015). Therefore, an interesting question for future research is understanding the complex relationships between energetic electrons, ELM activity and edge plasma stochasticity. As electron kinetic effects are typically not incorporated in fluid models for the instability that drives ELMs, data from L-mode experiments, such as the those presented here, can prove valuable.
5. Conclusions and next steps
Here, we presented the results from DIII-D experiments, where energetic electron transport was investigated using an electron tagging technique. Each considered shot was an inner-wall limited L-mode discharge, using only ohmic heating (no neutral beam injection). The plasma densities were intentionally kept low to avoid nonlinear plasma response and to allow for comparison between diagnostic measurements and vacuum field simulations. ECH/ECCD pulses were used to cause resonance with electrons within narrow regions in the core plasma. Then, the spatial and temporal spread of the tagged electrons was observed on ECE and HXR diagnostics. Two types of energetic electrons were identified: relativistic (runaway) electrons on energy $\mathrm{\ \mathbin{\lower.3ex\hbox{$\buildrel> \over {\smash{\scriptstyle\sim}\vphantom{_x}}$}}\ }5\ \textrm{MeV}$ and electrons that were not relativistic, yet, non-thermal with energies $< 5\ \textrm{MeV}$
 . To improve the accuracy of energy measurements, the team plans to conduct future experiments, where additional diagnostics are employed, including GRI, improved scintillators (HXR) and visible synchrotron emission. We further plan to analyse the present data using a fractional Laplacian spectral approach (Padgett et al. Reference Padgett, Kostadinova, Liaw, Busse, Matthews and Hyde2020; Kostadinova et al. Reference Kostadinova, Banka, Padgett, Liaw, Matthews and Hyde2021) to better understand the interplay between non-locality and stochasticity in the field topology and the resulting anomalous electron diffusion. Nevertheless, the present study is an important first step that demonstrates that the combination of electron tagging, diagnostic measurements and vacuum field simulations can be used to probe the local transport of electron populations located within a narrow region within the plasma discharge. Specifically, of future interest will be probing electron transport at locations where interesting magnetic field topology (islands/stochastization) are expected to occur.
Another interesting result is the observed reduction of the electron suprathermal feature for discharges where the electron tagging occurred at radial locations smaller than the location of the large $q = 1$ island chain. We attribute this reduced transport to trapping effects caused by the island chain. When an electron diffuses through a wide island, the diffusion time may be reduced, but when an electron is released from an island, it has been transported radially without cooling. In other words, the electron's temperature ends up higher than the temperature it would have had if the island were not there. Further investigation is needed to understand the exact mechanisms guiding the interaction between energetic electrons and magnetic islands. A future experimental campaign led by the authors will aim to quantify the relationships between electron transport and island topology, including island width, location, structure (e.g. X-points vs. O-points) and dynamics (island shrinking or bifurcation). This future study will aim to reproduce similar experimental scenarios, but extra care will be taken to minimize the effects of plasma density fluctuations and spatial spread of the ECH pulses. Another observation is that the large island chains shift location when the RMP coil is on, which results from emergence of new island chains and the increased width of the stochastic region in the edge. Therefore, we conclude that the 3-D coils can be used to manipulate the location of islands with respect to the location of ECH/ECCD pulses, which in turn is expected to enhance or suppress the suprathermal electron feature.
Finally, we established that the prominence of energetic electron features on the ECE data seems to be proportional to the width of the RMP-induced edge stochastic region. We further observe that in the absence of RMP perturbation, discharges with larger ${q_{95}}$ are more likely to form an edge stochastic layer due to their ability to support many small islands in the edge, resulting from various coil perturbations. However, for fixed non-zero amplitude of the RMP coil current, we observe that discharges with smaller ${q_{95}}$
 can form wider regions of edge stochastic fields due to easier overlap of large island chains located closer to the edge. Thus, we expect that when edge stochastic region is desired, a combination of coil perturbations should be used for discharges with large ${q_{95}}$
 , while an increasing RMP current amplitude may be more effective for cases with smaller ${q_{95}}$
 . These findings may be useful for future experiments attempting to control energetic electron transport or the occurrence of ELMs using plasma edge stochasticity.
Acknowledgements
The authors thank S.H. Nogami, W.W. Heidbrink and J.T. McClenaghan for assistance and useful discussions.
Editor Troy Carter thanks the referees for their advice in evaluating this article.
Declaration of interests
The authors report no conflict of interest.
Funding
This material is based upon work supported by the U.S. Department of Energy, Office of Science, Office of Fusion Energy Sciences, using the DIII-D National Fusion Facility, a DOE Office of Science user facility, under Awards DE-SC0023061, DE-FG02-05ER54809, DE-SC0021405, DE-FG02-97ER54415 and DE-FC02-04ER54698.
Disclaimer
This report was prepared as an account of work sponsored by an agency of the United States Government. Neither the United States Government nor any agency thereof, nor any of their employees, makes any warranty, express or implied or assumes any legal liability or responsibility for the accuracy, completeness or usefulness of any information, apparatus, product or process disclosed, or represents that its use would not infringe privately owned rights. Reference herein to any specific commercial product, process or service by trade name, trademark, manufacturer or otherwise does not necessarily constitute or imply its endorsement, recommendation or favouring by the United States Government or any agency thereof. The views and opinions of authors expressed herein do not necessarily state or reflect those of the United States Government or any agency thereof.
Author contributions
E.G.K. developed the theoretical interpretation supporting the experimental and numerical results. D.M.O. performed the TRIP3D and SURFMN simulations. D.M.O., M.K. and F.S. designed and conducted the DIII-D experiments. M.E.A. conducted the ECE spectrum simulations. All authors contributed equally to analysing data, reaching conclusions and in revising the paper.
Appendix A. Mechanisms of tagging techniques
Here, we provide a more detailed explanation of the ECH/ECCD technique, its relationship to Vlasov tagging of electrons and comparison with the tagging techniques used for ions.
For ion tagging, a laser is used to optically ‘pump’ quantum states of ions that are occupied and then look at the changes in the light emission from the plasma. Such a change in the emission is expected because the atomic state densities have been changed by pumping and those changes move with the particles. A second laser beam can be used to allow for obtaining more specific information because the second laser can additionally constrain a velocity component of the tagged particles at the viewing location.
The principles of the electron tagging technique (called Vlasov tagging) are similar. The idea of Vlasov tagging is to make a small perturbation of the electron distribution function which does not change the plasma equilibrium and only slightly changes the particle orbits. This transient change in the distribution function, particularly at high energies, modifies the corresponding emission wherever the particles go. The key idea is that the perturbation detected in the diagnostics measurements is dominated by the perturbation experienced by the high-energy tail of the electron distribution, which allows us to use this technique to study the properties of that tail. Depending on the electron energy of the perturbed population, the change in emission can be detected in synchrotron or cyclotron emission. The resulting incremental emission is a function of time and frequency space. The details of this function are dependent on the plasma parameters. For example, the higher the plasma density, the faster the decay in time of the incremental emission. Vlasov tagging is a general concept for diagnosing the properties of electron distributions. For example, although there is no plasma, even when a weak electron beam and a Faraday cup are used to track field lines in tokamaks and stellarators via electron orbits, they are in a way using Vlasov tagging.
To our knowledge, Vlasov tagging of electrons was first introduced in a paper by Fisch & Kritz (Reference Fisch and Kritz1989), where they proposed that details of the plasma parameters can be inferred by recording the transient synchrotron radiation from perturbed hot tokamak electrons. The brief transient heating of the plasma in this study was achieved using lower-hybrid waves. Similar ideas were discussed by Fidone & Giruzzi (Reference Fidone and Giruzzi1990) who argued that emission and absorption of electron cyclotron radiation is sensitive to the suprathermal electron momentum distribution and can, therefore, be used to diagnose the fast electron tail. This work showed that the resonance velocity governing the interaction of a wave with a given electron momentum distribution is a key parameter in the diagnostics of high-energy tails. The resonance velocity (or collective response) represents the appropriate average of the one-particle resonance over the momentum distribution, which is sensitive to the shape of the suprathermal distribution.
In Skiff et al. (Reference Skiff, Boyd and Colborn1994), a tag pulse of lower-hybrid waves was used to make a small perturbation in the electron distribution function that was subsequently detected and resolved in parallel velocity and time using electron cyclotron wave absorption (ECA) on a microwave beam that passed through the plasma. In that experiment the electrons did not escape the plasma, but remained confined. This experiment was an analogy between the optical pumping of ions and the small Vlasov perturbations of the electron distribution function that allows for tracking the electron orbits.
One of the main ideas of the current manuscript is that one could use the Vlasov tagging technique with passive ECE instead of ECA and still get some useful information. Here, we emphasize that there always exist suprathermal electrons in any discharge. The tagging technique does not produce the suprathermal electron population. Instead, it produces a small linear perturbation in the electron distribution, which in turn, yields a measurable perturbation on the electron emission signals, which is mostly dominated by the changes in the distribution at high energies. In the present experiments, the ECH/ECCD pulse creates a local perturbation of the electron distribution function in the core plasma. The ECE profile is examined to detect changes at the time of the ECH/ECCD perturbation. Finally, observation of deviations from a Maxwellian profile in the ECE data, such as the increase of electron temperature in the edge plasma (figure 4 of the revised manuscript), are interpreted as signatures of suprathermal electrons. Finally, assuming the ECH/ECCD perturbations are small and linear, we assume that higher electron temperature detected from the ECE measurements in the edge plasma corresponds to a larger population of non-thermal electrons for a given discharges.
Appendix B. Limitations of Vlasov tagging
Vlasov tagging, ideally, is supposed to employ small linear perturbations which do not involve a change in transport that has effects on the equilibrium. The technique can be used to observe the transport conditions if the ECE is sensitive enough that small perturbations can be observed. As the present experiments use both heating and current drive, it is important to discuss if the resulting perturbations are small and linear. It has been argued in Coda et al. (Reference Coda, Alberti, Blanchard, Goodman, Henderson, Nikkola, Peysson and Sauter2003) that for heating power of up to $2.8\ \textrm{MW}$ (similar to the powers used in the present experiments), the detection of the energetic electrons only depends on the toroidal injection angle and the resulting current drive. For perpendicular injection, i.e. no current drive, the electron temperatures from TS, ECE and HXR measurements are Maxwellian. However, for a critical angle of $\mathrm{\ \mathbin{\lower.3ex\hbox{$\buildrel> \over {\smash{\scriptstyle\sim}\vphantom{_x}}$}}\ }10\mathrm{^\circ--}12\mathrm{^\circ }$
 , both the HXR photon temperature and the ECE radiative temperature are well in excess of the bulk plasma temperature measured by TS (see figure 1 of that paper). Therefore, we expect that the ECH does not affect the electron distribution function in the absence of a current drive. Figure 1 from Coda et al. (Reference Coda, Alberti, Blanchard, Goodman, Henderson, Nikkola, Peysson and Sauter2003) also suggests that the suprathermal feature varies linearly with the increase in toroidal angle, i.e. linear dependence on current drive.
In Coda et al. (Reference Coda, Alberti, Blanchard, Goodman, Henderson, Nikkola, Peysson and Sauter2003), the toroidal injection angle was varied within the same discharge, which allowed for a meaningful conclusion on the linear relation between the increasing angle and the increasing electron temperature observed on the ECE and HXR. In the present study, six gyrotrons were used simultaneously to cause the perturbation. Since the aiming of these gyrotrons cannot be changed during the same shot, the toroidal and poloidal injection angles were different in each discharge, in addition to having different $q$ profiles. This makes it challenging to draw similar conclusions on the linearity of the current drive perturbation across discharges. A dedicated future study should be performed to demonstrate linearity. For ECCD used in the present experiments, one increases the perpendicular energy of enough electrons that the collisional drag is asymmetric in parallel velocity. This can cause a change in transport to the degree that you are changing the current significantly, leading to an observable change in the plasma $q$
 profile. The current relaxation time for the ECCD in our experiments ${\sim} 1\ \textrm{s}$
 , while the pulse duration used is $250\ \textrm{ms}$
 . Therefore, we expect that the ECCD pulses would not modify the parallel current profile. To confirm this, in figure 14 we plot the $q$
 profile calculated for a time slices right before and during ECCD pulses. As the $q$
 profile remains unchanged, we expect that the ECCD perturbations can be considered small.
Appendix C. Properties of the intrinsic suprathermal populations
It is known that DIII-D and many other plasma machines have intrinsic suprathermal electron population, which is generated during current ramp up. Typically, it is thought that the current ramp up is one of the dominant mechanisms for generating the sub-population of relativistic runaway electrons in tokamaks. However, there may be multiple other sources of electron acceleration in magnetized plasmas, including turbulence, waves and magnetic island effects. One of the main goals of the present work is to better understand the possible role of magnetic islands and field stochasticity on the electron acceleration and resulting anomalous diffusion. We present evidence of the existence of two distinct types of suprathermal electrons: runaway electrons and non-relativistic non-thermal electrons. Each of these populations exists prior to the EC tagging as evident from HXR scintillator data and ECE measurements for time slices with no ECH/ECCD pulses.
For example, the figure below shows the time trace of the hard X-ray scintillator data for shots 172 321–172 330. In figure 6 (copied in figure 15a), we added grey rectangles to mark the timing of the ECH/ECCD pulses. One can see that, while the biggest peaks are observed during the first ECH/ECCD pulse, smaller peaks are seen for the time before the first pulse. We interpret these peaks as signatures of relativistic runaway electrons leaving the plasma and colliding with the scintillator on the wall. Similarly, in figure 7(b) (copied in figure 15b), we see that ratio between temperature measured by ECE cords 01 and 02 as a function of time is always greater than 1, i.e. ${T_{01}} > {T_{02}}$ for all examined shots, suggesting that suprathermal electrons are inherently present for these discharge conditions. The tagging technique just exaggerates the ratio. Comparison of the two figures shows that, after the second ECH/ECCD pulse, the scintillator no longer detects signals (third grey rectangle on the left figure), while the ECE still records suprathermal electrons in the edge plasma (third, fourth and fifth grey rectangles on the right figure). Thus, we can conclude that the non-relativistic but also non-thermal electron populations do not leave the plasma volume, unlike the runaways.
A reconstruction of the electron distribution function for these discharges is beyond the scope of the present work. It has been attempted previously for runaway electrons in DIII-D using GRI data in combination with synthetic diagnostics in Paz-Soldan et al. (Reference Paz-Soldan, Cooper, Aleynikov, Eidietis, Lvovskiy, Pace, Brennan, Hollmann, Liu, Moyer and Shiraki2018). However, the present paper is mostly focused on the sub-population of electrons that are neither relativistic nor thermal. We assume that those electrons do not leave the plasma as they only show on ECE edge measurements data but not on the scintillators. In addition, GRI diagnostic was not used in the present experiments as it records very high noise when C-coils are used for error field correction in DIII-D (which is the case for the present discharges). Thus, similar reconstruction of the electron distribution is not possible using the data from the present study.


 Open access

