

1 Comparative forms: introduction
The morphosyntactic properties of comparative constructions has been a prolific topic in linguistics. English presents an interesting case because it has both morphological/synthetic comparatives and periphrastic/analytic comparatives (henceforth, we will use the terms synthetic comparative (SC) and analytic comparative (AC), respectively). In many cases both forms are appropriate for a particular adjective, as illustrated for friendly in (1) (Hilpert Reference Hilpert2008; Mondorf Reference Mondorf2009).
However, there are also adjectives which do not form a synthetic comparative (e.g. *seriouser) and instead form an analytic comparative with more (e.g. more serious), or adjectives which strongly favor a synthetic comparative (e.g. taller) and disfavor an analytic comparative (e.g. more tall) (Mondorf Reference Mondorf2009: 189).
In the latter case, it has been argued that the use of an analytic comparative (AC) leads to an evaluativity inference, meaning that the compared entities hold a gradable property to a degree equal to or larger than the contextual standard (Rett Reference Rett2008, Reference Rett2014; Moracchini Reference Moracchini2019). For example, while the continuation but both are short cannot follow the sentence with AC (2a), it is fine with the synthetic form (2b) since it does not yield such an evaluativity inference.
In addition to morphological and analytic comparatives, there is a third variant, which combines both strategies, the so called double comparative (DC), as illustrated in (3).
The distribution of the three comparative forms has been shown to depend on various factors, including morphophonological restrictions, syntactic, semantic and pragmatic properties, as well as sociolinguistic factors, such as register and language variety. The source of this information is primarily corpus-based (Mondorf Reference Mondorf, Rohdenburg and Mondorf2003, Reference Mondorf2009; Hilpert Reference Hilpert2008) and there has been very limited experimental research (Boyd Reference Boyd2007; LaFave Reference LaFave2015). In this article, we build on the findings from these studies in order to experimentally investigate (i) the appropriateness of the three different comparative forms and (ii) whether and, if so, to what extent any of the three forms trigger an evaluativity inference.
Since we use findings from corpus-based studies to experimentally investigate the three forms, this article contributes to a much broader question about the relation between language usage and linguistic competence, which has been controversially discussed (see Trudgill Reference Trudgill, Coupland and Jaworski1997 for an original observation regarding the deviation of rating judgments from frequency of usage). As White & Rawlins (Reference White and Rawlins2020) put it, the question is how direct the relationship between well-formedness and linguistic experience is (White & Rawlins Reference White and Rawlins2020: 1).Footnote 1 One line of approach proposes a direct link between frequency and ratings, for example, grammaticality judgment (see Lau et al. Reference Lau, Clark and Lappin2017 and the references therein). However, this has been disputed by Sprouse et al. (Reference Sprouse, Yankama, Indurkhya, Fong and Berwick2018) and White & Rawlins (Reference White and Rawlins2020), who showed that whether there is a correlation between frequency and grammaticality depends on a variety of factors including the type of phenomenon investigated. For instance, the adjective big is reported to occur, in the British National Corpus (BNC), 4,466 times as a synthetic comparative (bigger) and only once as an analytic comparative (more big) (Hilpert Reference Hilpert2008). Would one then expect native speakers to evaluate more big low (below the mid-point) in a grammaticality scale? While forced choice tasks showed that low-frequency constructions are dispreferred, other judgment tasks like acceptability ratings do not necessarily generate matching results (Arppe & Järvikivi Reference Arppe and Järvikivi2007).
Therefore, the debate narrows down to the question of how corpus and experimental findings relate. For instance, a rating study by LaFave (Reference LaFave2015) provided evidence that the analytic variant of monosyllabic adjectives (e.g. high) received relatively high acceptability ratings despite their low occurrence ratio in corpora (LaFave Reference LaFave2015: 6). Thus, in this case, the frequency and the rating results diverge, which shows that even though constructions are used less, language users still accept them.
In this article, we present a first step towards combining corpus and psycholinguistic approaches to comparatives in American and British English by building our hypotheses on existing findings of corpus studies and testing them using a judgment task. In particular, we examined the appropriateness of the three comparative forms in formal and informal register using a rating task and, in addition, we tested if participants detected a difference in evaluativity depending on the variant used. Our findings converge with LaFave’s (Reference LaFave2015) previous conclusions that there is a discrepancy between corpus frequency and experimental ratings.
The article is structured as follows: section 2 presents previous research on factors determining comparative alternation that are pertinent to our research questions. In section 3, we present the experimental study. Section 4 presents the results and in section 5, we discuss our main findings. Section 6 concludes and points towards further research avenues based on our findings.
2 Background on English comparative distribution
In cases in which there is more than one form with the same or similar function, as illustrated in (4), they are rarely in free variation.

The rich corpus research on comparative distribution has identified a variety of factors (26 in Mondorf Reference Mondorf2014: 213 and references therein) affecting the choice between synthetic and analytic comparative. One factor, which is relevant to all three forms, is the lexical frequency of the adjective (Gathercole Reference Gathercole1985; Mondorf Reference Mondorf, Rohdenburg and Mondorf2003, Reference Mondorf2009; Graziano-King & Cairns Reference Graziano-King and Cairns2005; Hilpert Reference Hilpert2008; LaFave & Guy Reference LaFave and Guy2011). Below we concentrate on the factors that are most relevant for our study.
2.1 The role of morphophonology and syntax
First of all, the availability of a synthetic form largely depends on the interaction of various morphophonological aspects. For example, it is traditionally stated that monosyllabic adjectives form synthetic comparatives, whereas trisyllabic adjectives strongly prefer the AC form (Frank Reference Frank1972; Aronoff Reference Aronoff1976; Quirk et al. Reference Quirk, Greenbaum, Leech and Svartvik1985). Crucially, the length-factor interacts with many other factors, which makes it difficult to formulate a rule (Mondorf Reference Mondorf2009). For instance, sensible has three syllables in the positive form, but it can form a synthetic comparative, because sensibler is of equal length. In addition, prefixes are not counted as fully fledged syllables (e.g. unhappier is possible) (see Mondorf Reference Mondorf, Houswitschka, Knappe and Müller2006: 590ff., 2009: 37ff.). Several other factors play a role: stress-final adjectives favor an analytic form, while stress-initial adjectives favor a morphological form (Hilpert Reference Hilpert2008; Mondorf Reference Mondorf2009; LaFave Reference LaFave2015). Vowel- or consonant-final segments or the stress pattern of the previous word may affect the choice of the comparative form.
Additionally, Mondorf (Reference Mondorf2009) shows that the more syntactically complex the construction is, the more likely is the analytic form (see also Mondorf Reference Mondorf2014). The syntactic position of the adjective also has an influence: attributive comparative constructions exhibit a preference for SCs, whereas predicative constructions favor ACs (Mondorf Reference Mondorf2009: 80-6). We restrict ourselves to exclusively predicative constructions (see section 3.1).
It was shown that overall, the complexity at all levels (morphophonological, syntactic, semantic, pragmatic) associates with higher frequencies of the analytic form (Mondorf Reference Mondorf2014). This conclusion seems to be further supported by Boyd (Reference Boyd2007), who examined adjectives showing variation between a synthetic and an analytic comparative based on the frequencies of each adjective. The finding common to all experiments is that complexity, whether semantic or syntactic, is associated with a higher ratio of the analytic variant than the morphological form.
As for the distribution of DCs, since they combine a synthetic and an analytic form as in (5a), morphophonology plays an equally important role. Notice that it is also possible for the -er morpheme to be doubled, as in (5b). However, as noted in Wood (Reference Wood2012), it is not clear whether the latter form is grammatical or whether it can be treated as more of a ‘language game’ instead.Footnote 2 In this work, we focus exclusively on more + -er DCs.
Based on corpus research, González-Díaz (Reference González-Díaz2006, Reference González-Díaz2008a) shows that DCs are available across all diachronic stages of English (see also Jespersen (Reference Jespersen1954 [1909])). The factors favoring a DC reported in this work have to do more with the semantic, pragmatic and social aspects of an utterance, which we discuss in the following subsections.
2.2 The role of semantics and pragmatics
At first glance, synthetic and analytic comparative forms are functionally equivalent in Labov’s terminology (Reference Labov1972: 271). The three sentences in (6) all convey that the degree to which Nina is tall exceeds the degree to which Mira is tall. However, the literature on comparatives suggests that there are differences between the three variants. That is, they have related semantic meanings but might not be functionally equivalent. Therefore, we can call the different variants alternatives, which refers to ‘sets of linguistic expressions that stand in a defined linguistic relationship to each other’ (Lüdeling et al. Reference Lüdeling, Alexiadou, Adli, Donhauser, Dreyer, Egg, Feulner, Gagarina, Hock, Jannedy, Kammerzell, Knoeferle, Krause, Krifka, Kutscher, Lütke, McFadden, Meyer, Mooshammer, Müller, Maquate, Norde, Sauerland, Solt, Szucsich, Verhoeven, Waltereit, Wolfsgruber and Zeige2022: 11).

In the literature on comparatives, there are two distinct lines of approach which, however, reach a similar conclusion regarding the interpretation of the analytic form, with very different and, one could argue, opposite argumentation. The general assessment is that the analytic form, compared to the synthetic, can express a more emphatic or evaluative interpretation (cf. Mondorf Reference Mondorf2009: 112). For example, as Mondorf (Reference Mondorf2009; cf. also Jespersen Reference Jespersen1954 [1909]) observes, the analytic form must follow the synthetic one if they are conjoined to express gradual increase. Furthermore, the analytic comparative was found to be associated with extra emphasis (Rohr Reference Rohr1929). In the same spirit, González-Díaz (Reference González-Díaz2003) indicates that indeed the percentage of ACs increases in contexts which seem to favor degree contrast. Degree contrast is illustrated by the example in (7). In this case it is established that the comparison is set to a degree higher than the contextual standard. It is in this type of environment that a higher ratio of the analytic variant (e.g. more pretty) is expected.
The example is one in which emphasis can be ruled out in very concrete terms. In particular, the comparative in (7) is found in an environment where it is already established that there is a certain degree of prettiness that exceeds the contextual standard – this is an evaluative interpretation of the comparative, enforced by the context. Notice that an evaluative interpretation is not obligatory with all comparative forms. For example, the comparative in (6a) doesn’t entail that Nina and Mary are tall; it could be that they are both short (see the examples in (2)).
A line of research in formal semantics, presented analytically and argued for in Rett (Reference Rett2008, Reference Rett2014) and Moracchini (Reference Moracchini2019), converges with the observations in Mondorf (Reference Mondorf2009) and González-Díaz (Reference González-Díaz2003) and proposes that when there is a frequently used SC form, ACs give rise to an evaluative interpretation, as illustrated in (2), repeated in (8):
Notice that, unlike the notion of emphasis and degree intensity, the notion of evaluativity is semantically defined and is therefore more easily testable. So far, however, there are no experimental results on evaluativity of analytic comparative forms (see Brasoveanu & Rett Reference Brasoveanu and Rett2018 for an experimental study of evaluativity in different constructions). Additionally, Mondorf (Reference Mondorf2009) notices that it is hard to find evidence in corpora which confirms the hypothesis that the AC alternative adds emphasis or degree intensity.
So far, we have presented the common intuition expressed for ACs, namely that in certain cases they are associated with emphasis or analyzed as being evaluative, in the sense that they establish a relatively high degree of comparison. However, this convergent conclusion is reached through very different lines of argumentation in the literature. One the one hand, Mondorf (Reference Mondorf2009, Reference Mondorf2014) follows the idea that the analytic form is the simplest in that there is transparency, i.e. comparison is expressed by a particular free morpheme (see Mondorf Reference Mondorf2014). Under this view, the AC is the most appropriate to occur in a semantically complex environment.
Rett (Reference Rett2008, Reference Rett2014) and Moracchini (Reference Moracchini2019), on the other hand, based on the syntactic differences between the synthetic and the analytic forms (Matushansky Reference Matushansky, Megerdoomian and Bar-el2001; Solt Reference Solt, Aloni, Bastiaanse, de Jager and Schulz2010), argue that the analytic form is the most complex (marked) variant and therefore has an additional evaluative meaning. According to Mondorf (Reference Mondorf2009, Reference Mondorf2014), the AC is an easier-to-process variant, which – in cognitively complex environments – can reduce processing load, whereas according to the evaluative approach, ACs are syntactically more complex competitors to SCs, leading to a more marked, evaluative interpretation. The idea of associating ‘marked’ constructions with additional meaning is common in linguistics. Rett (Reference Rett2014) mentions Horn’s (Reference Horn and Shiffrin1984) Principle of least effort, which states ‘the use of a marked (relatively complex) expression when a corresponding unmarked (simpler, less effortful) alternate expression is available tends to be interpreted as conveying a marked message’ (Rett Reference Rett2014).Footnote 3
What is not clear, under this view, is whether in cases in which both forms (SC/AC) are commonly attested (e.g. readier: 42% vs. more ready: 58%, according to Mondorf Reference Mondorf2014: 211), the same semantic effect is observed, i.e. associating the AC with an evaluative inference. This question is related to the notion of markedness, which is a polysemous term and in several cases a form can be marked under one aspect and unmarked under a different one (Haspelmath Reference Haspelmath2006). Markedness is defined as structural complexity (Moracchini Reference Moracchini2019). It has been shown independently that the AC variant is structurally more complex than the morphological one (Matushansky Reference Matushansky, Megerdoomian and Bar-el2001; Solt Reference Solt, Aloni, Bastiaanse, de Jager and Schulz2010). In Matushansky’s analysis, the AC variant involves a quantity phrase (headed by the quantifier much) which is missing in simple comparatives, thus there is more structure (see also the semantic analysis in Solt Reference Solt, Aloni, Bastiaanse, de Jager and Schulz2010). Moracchini (Reference Moracchini2019), building on the relation between structural complexity and implicature computation as developed in Fox & Katzir (Reference Fox and Katzir2011), analyzes the evaluativity inference as a scalar implicature derived by the availability of two comparative forms with different structural complexity for the same adjective. This analysis differs from the analysis in Rett (Reference Rett2014), who argues that the evaluativity inference is a manner implicature arising when a marked form is used. According to Mondorf’s (Reference Mondorf, Rohdenburg and Mondorf2003) approach, we would also expect the analytic form (whenever there is a synthetic counterpart) to be used in cognitively more complex environments. In our study, we target the question of whether the analytic form favors an evaluative inference, but, crucially, our experimental design cannot differentiate between the two approaches. This would require an on-line experimental task measuring reaction times among other things.
Regarding the interpretation of DCs, there is no relevant research in formal semantics. Despite having two comparative elements (more and -er), DCs do not indicate double comparison, i.e. having more than two entities compared as illustrated in (9) (see Corver Reference Corver2005; Wood Reference Wood2012 citing Nevins Reference Nevins and Trommer2012: 92). According to three native speakers we consulted, this type of comparison, to the extent that it is possible, can also be expressed with the analytic alternative, thus DCs are not special in this way.
Therefore, once more the same question arises as to whether the distribution of functional alternatives differs and on what grounds. Based on Rett (Reference Rett2008, Reference Rett2014) and Moracchini (Reference Moracchini2019), we would expect DCs, like ACs, to be structurally more complex than their simple comparative counterparts and, therefore, to trigger an evaluativity inference. In Mondorf (Reference Mondorf, Rohdenburg and Mondorf2003, Reference Mondorf2009, Reference Mondorf2014), it is not stated whether the DC form, combining the synthetic and analytic formation, is a form which requires less or more processing cost than the corresponding forms. Given the idea of morpheme transparency, a DC might actually instantiate the simplest form in terms of processing and thus, under this view, we would expect to find it in cognitively more complex environments.
To our knowledge, the only attempt to define whether there is an interpretation difference between DCs and simple comparatives investigates DCs in the diachrony of English, and shows that at certain stages, DCs were frequently associated with greater emphasis or intensity (González-Díaz Reference González-Díaz2003, Reference González-Díaz2006, Reference González-Díaz2008a). In particular, in Middle English and Early Modern English the majority of DCs were in environments in which there was emphasis or an indication of evaluativity due to certain degree premodifiers like much, a lot, far. For example, González-Díaz (Reference González-Díaz2006: 640) shows that DCs often occurred in environments in which the level of comparison is set at a high degree (exceeding the contextual standard) or it is common to use a double superlative in environments where the members compared already possess the property to a high degree. Regarding Present-Day English (PDE), the contexts found to indicate emphasis are those with an intensifier (González-Díaz Reference González-Díaz2006). In total, 60 percent of DC occurrences appear with degree modifiers, but 35 percent of these modifiers are minimizers (i.e. slightly, a bit). Nevertheless, she reports that even in PDE, the ratio of intensifiers with DCs is overall higher than the corresponding ratio with ACs and SCs (González-Díaz Reference González-Díaz2006: 639). Those insights regarding emphasis can be recast as an evaluativity inference.
2.3 Sociolinguistic factors: register and speaker background
In addition to semantics and pragmatics, sociolinguistic factors have also proven relevant for the distribution of the three comparative forms, for example, the register and language background of the speaker. RegisterFootnote 4 is defined as the recurring ‘intra-individual variation, that is, the conventionalized and recurrent linguistic patterns of (individuals in) a speech community depending on the situational-functional context’ (Pescuma et al. Reference Pescuma, Serova, Julia, Sauermann, Schäfer, Adli, Bildhauer, Egg, Hülk, Ito, Jannedy, Kordoni, Kuehnast, Kutscher, Lange, Lehmann, Liu, Lütke, Maquate, Mooshammer, Mortezapour, Müller, Norde, Pankratz, Patarroyo, Plesca, Rodríguez-Ronderos, Rotter, Sauerland, Schulte, Schüppenhauer, Sell, Solt, Terada, Tsiapou, Verhoeven, Weirich, Wiese, Zaruba, Zeige, Lüdeling and Knoeferle2022: 2), which allows for a broad understanding of the situation and the language function. To illustrate this concept: while someone might prefer to use the word dinner when talking to their superior at their job, the same person might use supper when talking to their spouse. In both cases, the speaker aims to convey similar concepts, yet uses different lexical alternatives to refer to the same event. Each alternative could serve different communicative functions or purposes (Biber & Conrad Reference Biber and Conrad2019), for example, in terms of creating social distance and closeness. While in the first situation, the use of dinner might appear more serious and distant – which could be more appropriate in a formal setting – the use of supper might appear as more casual and, therefore, more appropriate for an informal setting. As this example shows, situations and functions are intertwined. Due to many contributing extra- and intra-linguistic factors, specific register might not arise cross-culturally from similar configurations of parameters (Berruto Reference Berruto, Auer and Schmidt2010; Agha Reference Agha1999, Reference Agha, Agha and Frog2015). For instance, one might expect different conventions in different speech communities, like American and British English. This was experimentally investigated, using a rating study (Rotter & Liu Reference Rotter and Liu2023). Participants read short stories including distant (e.g. judge) and close (e.g. friend) social relation labels and rated the formality of the anticipated sentence. The results showed overall similar patterns between American and British English speakers, in that distant labels were associated with formal and close labels with less formal situations.
The influence of register on the choice of the comparative form has been shown in different corpus studies. Mondorf (Reference Mondorf2009: 185-6) reports that lower levels of formality, i.e. informal register/style,Footnote 5 are associated with a higher ratio of the synthetic alternative, meaning that shorter alternatives are preferred. However, it is also shown that in syntactically complex environments, this preference for the SC over the AC variant is reversed (Mondorf Reference Mondorf2009). That is, in less formal register/style, when the syntactic structure is more complex (e.g. in non-attributive adjectives) the ratio of ACs increases compared to the ratio of SCs. This pattern is not attested in formal register/style (Mondorf Reference Mondorf2009: 186-90).
The attested association of AC and informality might be due to the emphasis in the semantic and pragmatic domain; informal registers have been shown to tolerate additional emphasis more easily than formal registers. For instance, a hyperbole contains the attribute ‘more of X’, i.e. ‘more of the same’ (Claridge Reference Claridge2011: 5). Such uses of hyperbole were attested across registers and styles, yet, for several reasons, it is more frequent in more informal and familiar contexts (Claridge Reference Claridge2011: 178). ACs and DCs can be considered as a type of hyperbole in their emphatic or evaluative interpretation. The informal context might therefore influence speakers’ preference for these comparative alternatives. Crucially, DCs in PDE are also found in formal texts, suggesting that this comparative alternative has lost the social stigma it had (González-Díaz Reference González-Díaz2006: 651). DCs were considered stigmatized and unacceptable for a long time in Standard English (Auer & González-Díaz Reference Auer and González-Díaz2005 citing Biber et al. Reference Biber, Johansson, Leech, Conrad and Finegan1999: 525; see also González-Díaz Reference González-Díaz and van Ostade2008b).
Furthermore, differences in the usage of the comparative forms can be found between the American and British English speech communities. While fewer comparative forms are used overall in American English than in British English, the proportion of ACs compared to SCs is found to be higher in American English than in British English (Mondorf Reference Mondorf2009). The overall lower use of comparatives and the higher ratio of AC occurrences might be explained as a strategy to compensate for the complexity of the adjectives investigated and syntactic environments (Mondorf Reference Mondorf2009). Notice, however, that for the majority of highly frequent monosyllabic adjectives (e.g. big, small, high, low, etc.), there is no difference since the analytic alternative is practically non-existent or very rarely attested in either variety. Crucially, the ratio of ACs increases in stylistically less formal newspapers in both American and British English, presumably to compensate for a relatively high processing load associated with the set of adjectives chosen (Mondorf Reference Mondorf2009: 189-90).
The third comparative type, DCs, is a morphosyntactic feature found across many non-standard English varieties. According to Szmrecsanyi & Kortmann (Reference Szmrecsanyi, Kortmann, Kortmann and Schneider2004), DCs are among the eleven most frequently used morphosyntactic features in English varieties (attested in 34 out of 46 investigated varieties; Szmrecsanyi & Kortmann Reference Szmrecsanyi, Kortmann, Kortmann and Schneider2004: 1154). They can be found in both American and British English varieties (González-Díaz Reference González-Díaz2006, Reference González-Díaz2008a) to different degrees (Wood Reference Wood2012; Wolfram & Schilling-Estes Reference Wolfram and Schilling-Estes2016), for instance, in African American Vernacular (Włodarczyk Reference Włodarczyk2007), Appalachian (Montgomery Reference Montgomery, Kortmann and Schneider2004), as well as British Isles English (Kortmann Reference Kortmann, Kortmann and Schneider2004), among others. Thus, the readiness to use DCs might also be dependent on the language variety spoken (see also Szmrecsanyi & Kortmann Reference Szmrecsanyi, Kortmann, Kortmann and Schneider2004, Reference Szmrecsanyi and Kortmann2008).
2.4 Current study
As has been shown in the previous sections, different aspects, such as register and the language user’s background, influence the usage and interpretation of the three comparative forms. Taking findings from corpus research (Mondorf Reference Mondorf, Rohdenburg and Mondorf2003, Reference Mondorf2009; Hilpert Reference Hilpert2008) as a starting point, we focus on a subset of adjectives which show a preference for the SC (i.e. big, long, wide, thick, heavy, tall, warm, high, bright, small, short, thin, light, cold, low, narrow, dark, cheap)Footnote 6 and at the same time are suitable for assessing the availability of an evaluative inference (Brasoveanu & Rett Reference Brasoveanu and Rett2018; Moracchini Reference Moracchini2019). For this reason, all the adjectives we have used are gradable adjectives which encode a measurable property on a standard scale (size, height, width, etc.). Furthermore, we use the findings by Rotter & Liu (Reference Rotter and Liu2023) and manipulate formal and informal contexts via social relations to investigate register effects.
Based on the literature, we formulated hypotheses which we tested experimentally with a judgment task. Thus, we use ratings to assess the appropriateness in relation to register and the interpretation, the latter to test whether speakers assign an evaluative interpretation. More specifically, we asked the following research questions:
(RQ1) Which factors (i.e. register and English variety) influence the appropriateness of the three comparative variants (i.e. SC, AC and DC)?
(RQ2) Do the three comparative variants (i.e. SC, AC and DC) differ with respect to the degree of evaluativity they convey?
In order to answer the two research questions, we derived two sets of hypotheses associated with the appropriateness (H1) and the evaluativity (H2) of SC, AC and DCs (see section 2.2). For both sets, we formulate expectations in terms of (i) type of comparative form, (ii) register and (iii) background of the language comprehender. Furthermore, we explore hypotheses (EH) concerning the influence of dialect on the appropriateness ratings.
First, the predictions in relation to appropriateness ratings and (RQ1): (i) Comparative types: we expect ACs (see (H1a)) and DCs (see (H1b)) to be rated lower than SCs due to the selection of adjectives (see section 3.1 for details) and the lower frequency of DCs than SCs. Furthermore, we are interested in potential differences between ACs and DCs – as mentioned in section 2.1, DCs are particularly good with adjectives which prefer SCs, so they could be rated as more appropriate than plain ACs. On the other hand, DCs yield at least structurally a greater degree of complexity, which might result in lower appropriateness ratings compared to ACs. In addition to the structural complexity, there is the factor of stigmatization. Given that DCs have been considered stigmatized forms, one might also expect lower appropriateness ratings for these forms (see section 2.3). Given the existing evidence in the literature, we do not formulate a directed hypothesis but still report the result. (ii) Register differences: we expect ACs to be rated lower in formal than in informal contexts (see (H1c)), due to a higher frequency in informal texts than in formal ones (cf. Mondorf Reference Mondorf2009). We also expect DCs to be rated similarly – lower ratings in formal than in informal contexts (see (H1d)) – due to their atypical form and the association with dialects. SCs should be the most preferred form and thus, we do not expect a register difference (see (H1e)). (iii) Language users’ background: we expect no difference between American and British English speakers in terms of AC (see (H1f)) and DCs (see (H1g)). Although earlier studies report fewer comparatives in American than in British English overall (cf. Mondorf Reference Mondorf2009), these findings are not directly transferable to experimental data. DCs are attested in both varieties (cf. González-Díaz Reference González-Díaz2006, Reference González-Díaz2008a), but differences were not reported. Furthermore, we want to explore differences of dialect versus non-dialect speakers. We expect no differences of SC, as the standard alternative (see (EHa)). Regarding ACs and DCs, it is not clear based on previous research to what extent the two variants for the particular adjectives tested are used in modern American and British English dialects. It is possible that, since ACs and DCs are more atypical for these adjectives, they will be rated as overall more appropriate by dialect speakers than non-dialect speakers (see (EHb) and (EHc)).
Lastly, the predictions in relation to the evaluativity ratings and (RQ2): (i) Comparative types: we expect participants to detect an evaluativity inference for ACs but not for SCs, as predicted by the theoretical works we presented in section 2.2 (see (H2a)). We expect a similar result for DCs – an evaluativity inference for DC in comparison to SC – due to their higher syntactic complexity (see (H2b)). Furthermore, we do not predict a meaning difference between ACs and DCs (see (H2c)), as the literature does not provide any evidence for this. (ii) Register differences and (iii) English variety: since syntactic/structural complexity is independent of register and language variety, we think that the evaluation of comparative forms should not be directly affected by the formality level (see (H2d) and (H2e)) or the language type (see (H2f) and (H2g)).


Our study is, to our knowledge, the first experimental approach which taps into the gap between language usage and perception of those comparative forms and explores the influence of extralinguistic factors.
3 Experimental study
In order to test the aforementioned hypotheses, we conducted a rating study with American and British English participants. Section 3.1 describes the design and the items. In section 3.2, we detail the procedure followed in the study. Section 3.3 includes the relevant demographic and language background information on the participants. Lastly, in section 3.4, we describe the data analysis.
3.1 Design and materials
The experiment was conducted using a 3×2 factorial within-subject design, with the factor COMPARATIVEFootnote 7 forms and its levels SC (Synthetic Comparative) vs. AC (Analytic Comparative) vs. DC (Double Comparative), as well as FORMALITY and its levels formal vs. informal. We combined the data obtained from American and British English participants and added a between-subjectFootnote 8 factor, ENGLISH VARIETY, with AE vs. BE as levels, resulting in a 3×2×2 factorial design. We generated 18 items which were counterbalanced across participants. Each item contained a different adjective, i.e. we tested 18 adjectives (big, long, wide, thick, heavy, tall, warm, high, bright, small, short, thin, light, cold, low, narrow, dark, cheap). The criteria for selecting the adjectives were that they (i) form and favor a morphological comparative, and (ii) encode a measurable property on a standard scale (i.e. dimensional adjectives) (Bierwisch Reference Bierwisch, Bierwisch and Lang1989). For the FORMALITY manipulation, we used social relations of interlocutors, distinguishing between close/private (e.g. friend, names) and distant/public labels, (e.g. manager, professor) (cf. Rotter & Liu Reference Rotter and Liu2023).
Items were in the form of short stories (10). (S1) and (S2) set a context that aims to introduce the two compared entities and the corresponding property. (S3) contains the formality manipulation via social relations and first names. (S4) contains the manipulation on the comparative. (Q1) asks about the appropriateness of (S4) in the given context. (Q2) targets whether (S4) gives rise to an evaluativity inference, i.e. whether both entities hold the relevant property (e.g. long) to a degree that exceeds the contextual standard, therefore concluding that the property encoded by the antonym (e.g. short) cannot hold for the two entities.

We used 18 critical items together with 84 filler items which were in a similar short story structure. The experiment was implemented using PCIbex (Zehr & Schwarz Reference Zehr and Schwarz2018) and hosted on the PCIbex farm platform (https://farm.pcibex.net/). Participants accessed the experiment through the crowd-sourcing platform Prolific (www.prolific.com) and received monetary compensation for their participation.
3.2 Procedure
The experiment took roughly thirty-five minutes. Participants gave their informed consent before accessing the instructions for the experimental part. Then, they first familiarized themselves with the experimental setup with four practice stories. (S1) to (S3) were shown separately one after the other, with the space key being used to continue after reading the sentence. (S4) remained on the screen while (Q1) (see figure 1, panel A) and (Q2) (see figure 1, panel B) appeared separately under the sentence together with the scale. The answers to the questions were given on a seven-point Likert scale in which all points were labeled (see figure 1), i.e. ‘Certainly not/yes’ (1/7), ‘Probably not/yes’ (2/6), ‘Possibly not/yes’ (3/5), ‘Unclear’ (4). Participants used the appropriate keys to indicate their answers. After each story, a fixation cross appeared for 400 ms in order to enforce a proper distinction between the stories. After the experiment, the participants answered a short survey about their demographic and language background, i.e. self-reports of being non-dialect or dialect speakers with the possibility to provide the specific dialect by text entry.
Screenshots of the experiment. (S2) is shown in the middle of the screen, below the question on the appropriateness (Q1, panel A) and the interpretation (Q2, panel B) together with the seven-point Likert scale. Participants used the keys to indicate their answers.

Descriptive statistic: mean ratings of (Q1) appropriateness with standard deviation (SD) on a seven-point Likert scale (1: Certainly not, 7: Certainly yes) per dataset. SC =synthetic comparative, AC = analytic comparative, DC = double comparative.

3.3 Participants
We collected data from 120 self-reported native speakers of American and 120 self-reported native speakers of British English in a gender-balanced way (i.e. female: $ {\mathrm{N}}_{AE} $
= 60,
$ {\mathrm{N}}_{AE} $
= 60, $ {\mathrm{N}}_{BE} $
= 60; male:
$ {\mathrm{N}}_{BE} $
= 60; male: $ {\mathrm{N}}_{AE} $
= 60,
$ {\mathrm{N}}_{AE} $
= 60, $ {\mathrm{N}}_{BE} $
= 60; non-binary:
$ {\mathrm{N}}_{BE} $
= 60; non-binary: $ {\mathrm{N}}_{AE} $
= 0,
$ {\mathrm{N}}_{AE} $
= 0, $ {\mathrm{N}}_{BE} $
= 0). All participants provided their informed consent, which was approved by the Ethics Committee of the Deutsche Gesellschaft für Sprachwissenschaft (DGfS) in the context of SFB 1412 ‘Register’.
$ {\mathrm{N}}_{BE} $
= 0). All participants provided their informed consent, which was approved by the Ethics Committee of the Deutsche Gesellschaft für Sprachwissenschaft (DGfS) in the context of SFB 1412 ‘Register’.
The mean age of the American participants was 36.2 years (SD = 12.1), ranging from 18 to 65 years, and that of the British participants was 37.1 years (SD = 11.4), ranging from 20 to 63 years.
In total, 12.5 percent of the participants reported to be a dialect speaker with three American English dialects (i.e. African American Vernacular and Southern American English dialect (N = 1), as well as Midwestern (N = 3) and Southern (N = 6) American English dialect, no specification (N = 1)) and fifteen British English dialects (i.e. Bristolian (N = 1), Brummie (N = 1), Cardiff (N = 1), Derbyshire (N = 1), Doric (N = 1), Estuary (N = 1), Geordie (N = 1), Leicester (N = 1), Midlands (N = 1), Norfolk (N = 1), Northern (N = 1), Scottish (N = 2), Sussex (N = 1), Welsh (N = 1) and Yorkshire (N = 3) British English dialect, no specification (N = 1)). A completed college degree was the highest education of more than a third of the participants (37.9%). Less than one-third (32.9%) possess a graduate diploma, 28.3% had completed high school, and below 1% of the participants did not finish high school. More than half of the participants grew up in a suburban environment (54.6%), while 27.9% indicated that they had grown up in an urban and 17.5% in a rural environment.
3.4 Data analysis
Our inclusion criteria were an age range between 18 to 65 and being a native speaker of English, which applied to all participants. Thus, the data of 240 participants was used. The collected data consisted of reading times for (S1) to (S4) and of reaction times for (Q1/2). We used the reading time measurements to exclude trials in which one sentence was attended for less than 400 ms. This ensured that participants paid attention to all sentences of the short stories. We removed 510 trails (11.8%).
The remaining data was analyzed using the cumulative link mixed models for ordinal regressionFootnote 9 implemented in the package ordinal (Christensen Reference Christensen2019) for the software R (R Core Team Reference Team2023).
(Q1) and (Q2) were separately analyzed with two analyses each: (A1) focused on the mainFootnote 10 and interaction effects, and (A2) served as an exploratory analysis, taking into account the demographic information of the participants.
For (A1), we used treatment coding and calculated separated models with AC and DC as reference levels (e.g. AC-model – AC: 0, SC/DC: 1). Furthermore, the factors FORMALITY (formal: 0.5, informal: -0.5), ENGLISH VARIETY/EV (AE: 0.5, BE: -0.5) were sum coded. The model included all possible two-way interactions (e.g. AC-model – FORMALITY×SC, FORMALITY×DC, FORMALITY×EV, EV×SC, and EV×DC), as well as three-way interactions (e.g. AC-model – FORMALITY×SC $ \times $
EV and FORMALITY×DC
$ \times $
EV and FORMALITY×DC $ \times $
EV). If an interaction showed a significance, we conducted sub-analyses by splitting the data into the level of the significant main effects in order to resolve the direction of the interaction. We report only on the results which are useful for the direction of the interaction.
$ \times $
EV). If an interaction showed a significance, we conducted sub-analyses by splitting the data into the level of the significant main effects in order to resolve the direction of the interaction. We report only on the results which are useful for the direction of the interaction.
For (A2), we calculated three models – each with the data of one level of the factor COMPARATIVE. We included the following demographic information as factors with sum coding: GENDER with the levels female (0.5) and male (-0.5), DIALECT with the levels non-dialect (0.5) and dialect speaker (-0.5), as well as EV similarly coded to (A1). AGE was added as a continuous variable. Each model only contained main effects and no interactions.
The link functions of the models were identified by comparing the loglikelihood for each of the five possible link functions (i.e. probit, logit, cauchit, loglog and cloglog), which has the advantage that the chosen function follows the shape of the data and accounts for skewness to maximize the model’s fit (Christensen Reference Christensen2011). In order to identify the random effect structure, we used the most parsimonious model approach (Bates et al. Reference Bates, Kliegl, Vasishth and Baayen2018). Models rendering single fit or non-converging were identified as too complex, and the next converging simpler model was used. In case of competing models with similar random effect structure, we used the model with the smallest Akaike Information Criterion (AIC). The final models used for significance testing are indicated in the result section. P-values were obtained with the help of loglikelihood ratio test comparisons of nested models (Bates et al. Reference Bates, Kliegl, Vasishth and Baayen2018). All statistical values, i.e. means, estimates and the like, are rounded to the second decimal except for p-values smaller than 0.01. Values below 5 were rounded off, and values equal or above 5 were rounded up.
4 Results
In the following, we present the results of the experiment. The results (R) are labeled according to the question about the appropriateness (Q1) and evaluativity (Q2), i.e. RQ1 and RQ2, together with a continuous number for easier identification in the discussion. Section 4.1 reports the results of the appropriateness ratings (Q1) as the dependent variable. Section 4.2 details the results with the evaluativity ratings (Q2).
4.1 Appropriateness rating (Q1)
The descriptive results of the appropriateness ratings (Q1) are depicted in figure 2 and table 1. Figure 3 represents distribution of participants’ mean and the overall mean with error bars. Figure 4 shows the mean and error bars for each adjective used in (S2) of the items. Section 4.1.1 details the results from the main analysis (A1). Section 4.1.2 reports on the results of the explorative analysis (A2).
Means and error bars of the (Q1) appropriateness ratings (seven-point Likert scale, 1 = Certainly not, 7 = Certainly yes) for the six conditions and per dataset. Formal conditions are shown on the left and informal on the right of the x-axis. The y-axis represents the ratings. Orange bars represent the synthetic comparative (SC), yellow bars the analytic comparative (AC) and blue bars the double comparative (DC). Bars connected with solid lines represent the results from the American English (AE) and dashed lines from the British English (BE) dataset.

Means of (Q1) appropriateness ratings per subject in transparent and overall result in opaque dots with error bars (seven-point Likert scale, 1 = Certainly not, 7 = Certainly yes). SC (synthetic comparative) conditions are shown on the left, AC (analytic comparative) in the middle and DC (double comparative) on the right of the graph. Orange represents the formal conditions and blue the informal conditions.

Means of (Q1) appropriateness ratings per adjectives on a seven-point Likert scale (1 = Certainly not, 7 = Certainly yes) for the six conditions. Formal conditions are shown on the left and informal on the right of the x-axis. The y-axis represents the ratings. Orange bars represent the synthetic comparative (SC), yellow bars the analytic comparative (AC) and blue bars the double comparative (DC).

4.1.1 Main analysis (A1)
Using (Q1) appropriateness ratings as the dependent variable, (A1) contained two models with AC and DC as reference levels. The loglog function turned out to fit the data best for both models.
The output of the first model using AC as reference level is shown in table 2. The model with random subject intercepts with slopes for SC, DC and the two-way interaction DC $ \times $
EV, as well as random item intercepts with slopes for SC, DC and the two-way interactions SC
$ \times $
EV, as well as random item intercepts with slopes for SC, DC and the two-way interactions SC $ \times $
F and SC
$ \times $
F and SC $ \times $
EV fit the data best. The results showed a significant effect of SC (RQ1.1) in that AC was rated lower than SC (
$ \times $
EV fit the data best. The results showed a significant effect of SC (RQ1.1) in that AC was rated lower than SC ( $ \hat{\beta} $
= 1.03,
$ \hat{\beta} $
= 1.03, $ {\chi}^2(1) $
= 36.40, p
$ {\chi}^2(1) $
= 36.40, p $ < $
0.0001). There was a significant effect of FORMALITY (RQ1.2) in that
$ < $
0.0001). There was a significant effect of FORMALITY (RQ1.2) in that $ {\mathrm{AC}}_{formal} $
conditions were rated lower than
$ {\mathrm{AC}}_{formal} $
conditions were rated lower than $ {\mathrm{AC}}_{informal} $
conditions (
$ {\mathrm{AC}}_{informal} $
conditions ( $ \hat{\beta} $
= -0.22,
$ \hat{\beta} $
= -0.22, $ {\chi}^2(1) $
= 10.96, p = 0.0009). There were no other significant main effects, e.g. DC (RQ1.3) or EV (RQ1.4) effects. Furthermore, two three-way interactions turned out significant: (i) SC
$ {\chi}^2(1) $
= 10.96, p = 0.0009). There were no other significant main effects, e.g. DC (RQ1.3) or EV (RQ1.4) effects. Furthermore, two three-way interactions turned out significant: (i) SC $ \times $
F
$ \times $
F $ \times $
EV (
$ \times $
EV ( $ \hat{\beta} $
= -0.40,
$ \hat{\beta} $
= -0.40, $ {\chi}^2(1) $
= 4.16, p = 0.04) and (ii) DC
$ {\chi}^2(1) $
= 4.16, p = 0.04) and (ii) DC $ \times $
F
$ \times $
F $ \times $
EV (
$ \times $
EV ( $ \hat{\beta} $
= -0.41,
$ \hat{\beta} $
= -0.41, $ {\chi}^2(1) $
= 4.56, p = 0.03).
$ {\chi}^2(1) $
= 4.56, p = 0.03).
Main analysis (A1): output of the AC (analytic comparative) model with (Q1) appropriateness ratings as dependent variable. SE = standard error. The symbol ‘ $ {}^{\star } $
’ marks significant results.
$ {}^{\star } $
’ marks significant results.

The sub-analysis showed that (i) the three-way interaction SC $ \times $
F
$ \times $
F $ \times $
EV stems from (a) the FORMALITY effect in the AC data in that
$ \times $
EV stems from (a) the FORMALITY effect in the AC data in that $ {\mathrm{AC}}_{formal} $
was rated lower than
$ {\mathrm{AC}}_{formal} $
was rated lower than $ {\mathrm{AC}}_{informal} $
(RQ1.5), this effect was not present in the SC data (RQ1.6). (b) There were significant differences between AC vs. SC in both FORMALITY levels with a larger effect size in the formal than informal condition. (ii) The other three-way interaction stems from higher ratings of the
$ {\mathrm{AC}}_{informal} $
(RQ1.5), this effect was not present in the SC data (RQ1.6). (b) There were significant differences between AC vs. SC in both FORMALITY levels with a larger effect size in the formal than informal condition. (ii) The other three-way interaction stems from higher ratings of the $ {\mathrm{AC}}_{formal} $
in the AE than BE dataset (RQ1.7), this effect was not present in the
$ {\mathrm{AC}}_{formal} $
in the AE than BE dataset (RQ1.7), this effect was not present in the $ {\mathrm{DC}}_{formal} $
condition (RQ1.8).
$ {\mathrm{DC}}_{formal} $
condition (RQ1.8).
The output of the second model using DC as reference level is shown in table 3. The model with random subject intercepts with slopes for SC and AC, as well as random item intercepts with slopes for SC, AC and the two-way interactions SC $ \times $
F and SC
$ \times $
F and SC $ \times $
EV fit the data best. There was a significant effect of SC (RQ1.9) in that DC was rated lower than SC (
$ \times $
EV fit the data best. There was a significant effect of SC (RQ1.9) in that DC was rated lower than SC ( $ \hat{\beta} $
= 1.07,
$ \hat{\beta} $
= 1.07, $ {\chi}^2(1) $
= 47.67, p
$ {\chi}^2(1) $
= 47.67, p $ < $
0.0001). The results showed a significant effect of FORMALITY (RQ1.10) in that
$ < $
0.0001). The results showed a significant effect of FORMALITY (RQ1.10) in that $ {\mathrm{DC}}_{formal} $
conditions were rated lower than
$ {\mathrm{DC}}_{formal} $
conditions were rated lower than $ {\mathrm{DC}}_{informal} $
conditions (
$ {\mathrm{DC}}_{informal} $
conditions ( $ \hat{\beta} $
= -0.19,
$ \hat{\beta} $
= -0.19, $ {\chi}^2(1) $
= 7.97, p
$ {\chi}^2(1) $
= 7.97, p $ < $
0.005). There were no other significant main effects, e.g. AC (RQ1.11) or EV (RQ1.12) effects.
$ < $
0.005). There were no other significant main effects, e.g. AC (RQ1.11) or EV (RQ1.12) effects.
Main analysis (A1): output of the DC (double comparative) model with (Q1) appropriateness ratings as dependent variable. SE = standard error. The symbol ‘ $ {}^{\star } $
’ marks significant results.
$ {}^{\star } $
’ marks significant results.

Two interaction effects showed a significance: (i) The two-way interaction F $ \times $
EV (
$ \times $
EV ( $ \hat{\beta} $
= -0.30,
$ \hat{\beta} $
= -0.30, $ {\chi}^2(1) $
= 4.71, p = 0.03) and (ii) the three-way interaction AC
$ {\chi}^2(1) $
= 4.71, p = 0.03) and (ii) the three-way interaction AC $ \times $
F
$ \times $
F $ \times $
EV (
$ \times $
EV ( $ \hat{\beta} $
= 0.40,
$ \hat{\beta} $
= 0.40, $ {\chi}^2(1) $
= 4.28, p = 0.04).
$ {\chi}^2(1) $
= 4.28, p = 0.04).
The sub-analysis showed that (i) the two-way interaction is driven by the FORMALITY effect in that formal conditions were rated lower than informal conditions in the AE data (RQ1.13); this effect was not present in the BE data (RQ1.14). (ii) The three-way interaction stems from higher ratings of the $ {\mathrm{AC}}_{formal} $
in the AE than BE dataset (RQ1.15); this effect was not present in the
$ {\mathrm{AC}}_{formal} $
in the AE than BE dataset (RQ1.15); this effect was not present in the $ {\mathrm{DC}}_{formal} $
condition (RQ1.16).
$ {\mathrm{DC}}_{formal} $
condition (RQ1.16).
4.1.2 Explorative analysis (A2)
The output of the three models for (A2) taking the ratings of (Q1) as the dependent variable are shown in table 4.
Explorative analysis (A2): output of the three models with (Q1) appropriateness ratings as dependent variable. SC = synthetic comparative, AC = analytic comparative, DC = double comparative, EV = the factor ENGLISH VARIETY. The symbol ‘ $ {}^{\star } $
’ marks significant results.
$ {}^{\star } $
’ marks significant results.

Descriptive statistics: mean ratings of (Q2) evaluativity with standard deviation (SD) on a seven-point Likert scale (1: Certainly not, 7: Certainly yes) per dataset. SC = synthetic comparative, AC = analytic comparative, DC = double comparative.

The SC model with subject and item intercepts with the logit link function fit the data best. The results showed no significant effects, e.g. DIALECT effect (RQ1.17).
The AC model with subject intercepts with the loglog link function fit the data best. The results showed a significant FORMALITY effect (RQ1.18) in that $ {\mathrm{AC}}_{formal} $
conditions were rated lower than
$ {\mathrm{AC}}_{formal} $
conditions were rated lower than $ {\mathrm{AC}}_{informal} $
conditions (
$ {\mathrm{AC}}_{informal} $
conditions ( $ \hat{\beta} $
= -0.18,
$ \hat{\beta} $
= -0.18, $ {\chi}^2(1) $
= 5.68, p = 0.02). Furthermore, there was a significant main effect of AGE (RQ1.19) in that the older the participant the lower the ratings for AC (
$ {\chi}^2(1) $
= 5.68, p = 0.02). Furthermore, there was a significant main effect of AGE (RQ1.19) in that the older the participant the lower the ratings for AC ( $ \hat{\beta} $
= -0.03,
$ \hat{\beta} $
= -0.03, $ {\chi}^2(1) $
= 10.17, p = 0.001). No other effect turned out significant, e.g. a DIALECT effect (RQ1.20).
$ {\chi}^2(1) $
= 10.17, p = 0.001). No other effect turned out significant, e.g. a DIALECT effect (RQ1.20).
The DC model with subject and item intercepts with the loglog link function fit the data best. The results showed a significant FORMALITY effect (RQ1.21) in that $ {\mathrm{DC}}_{formal} $
conditions were rated lower than
$ {\mathrm{DC}}_{formal} $
conditions were rated lower than $ {\mathrm{DC}}_{informal} $
conditions
$ {\mathrm{DC}}_{informal} $
conditions $ (\hat{\beta} $
= -0.19,
$ (\hat{\beta} $
= -0.19, $ {\chi}^2(1) $
= 16.56, p
$ {\chi}^2(1) $
= 16.56, p $ < $
0.001). Furthermore, the results showed a GENDER effect (RQ1.22) in that women rated DC conditions higher than men (
$ < $
0.001). Furthermore, the results showed a GENDER effect (RQ1.22) in that women rated DC conditions higher than men ( $ \hat{\beta} $
= 0.05,
$ \hat{\beta} $
= 0.05, $ {\chi}^2(1) $
= 5.10, p = 0.02). No other effect turned out significant, e.g. a DIALECT effect (RQ1.23).
$ {\chi}^2(1) $
= 5.10, p = 0.02). No other effect turned out significant, e.g. a DIALECT effect (RQ1.23).
4.2 Evaluativity rating (Q2)
The descriptive results of the evaluativity ratings (Q2) are depicted in figure 5 and table 5. Figure 6 represents distribution of participants’ mean and the overall mean with error bars. Section 4.2.1 details the results from the main analysis (A1). Section 4.2.2 reports on the results of the explorative analysis (A2).
Means and error bars of the (Q2) evaluativity ratings (seven-point Likert scale, 1 = Certainly not, 7 = Certainly yes) for the six conditions and per dataset. Formal conditions are shown on the left and informal on the right of the x-axis. The y-axis represents the ratings. Orange bars represent the synthetic comparative (SC), yellow bars the analytic comparative (AC), and blue bars the double comparative (abbreviated with DC). Bars connected with solid lines represent the results from the American English (AE) and dashed lines from the British English (BE) dataset.

Means of (Q2)-evaluativity ratings per subject in transparent and overall result in opaque dots with error bars (seven-point Likert scale, 1 = Certainly not, 7 = Certainly yes). SC (synthetic comparative) conditions are shown on the left, AC (analytic comparative) in the middleand DC (double comparative) on the right of the graph. Orange represents the formal conditions, blue the informal conditions.

4.2.1 Main analysis (A1)
Using (Q2) evaluativity ratings as the dependent variable, (A1) contained two models with the AC and DC as reference levels. The loglog function turned out to fit the data best for both models.
The output of the first model using AC as reference level is shown in table 6. The model including random subject intercepts with slopes for SC, DC and the two-way interaction DC $ \times $
F as well as random item intercepts, fit the data best. There was an effect of SC (RQ2.1) in that AC was rated lower than SC conditions (
$ \times $
F as well as random item intercepts, fit the data best. There was an effect of SC (RQ2.1) in that AC was rated lower than SC conditions ( $ \hat{\beta} $
= 0.17,
$ \hat{\beta} $
= 0.17, $ {\chi}^2(1) $
= 7.85, p = 0.005). There was a significant effect of DC (RQ2.2) in that AC was rated lower than DC conditions (
$ {\chi}^2(1) $
= 7.85, p = 0.005). There was a significant effect of DC (RQ2.2) in that AC was rated lower than DC conditions ( $ \hat{\beta} $
= 0.15,
$ \hat{\beta} $
= 0.15, $ {\chi}^2 $
(1) = 6.11, p = 0.01). The results showed a significant effect of FORMALITY (RQ2.3) in that AC
$ {\chi}^2 $
(1) = 6.11, p = 0.01). The results showed a significant effect of FORMALITY (RQ2.3) in that AC $ {}_{formal} $
conditions were rated lower than
$ {}_{formal} $
conditions were rated lower than $ {\mathrm{AC}}_{informal} $
condition (
$ {\mathrm{AC}}_{informal} $
condition ( $ \hat{\beta} $
= -0.15,
$ \hat{\beta} $
= -0.15, $ {\chi}^2(1) $
= 5.06, p = 0.02). There was no other significant main effect, e.g. EV (RQ2.4) effect or interaction, e.g. SC
$ {\chi}^2(1) $
= 5.06, p = 0.02). There was no other significant main effect, e.g. EV (RQ2.4) effect or interaction, e.g. SC $ \times $
F (RQ2.5) or SC
$ \times $
F (RQ2.5) or SC $ \times $
EV (RQ2.6).
$ \times $
EV (RQ2.6).
Main analysis (A1): output of the AC (analytic comparative) model with (Q2) evaluativity ratings as dependent variable. SE = standard error. The symbol ‘ $ {}^{\star } $
’ marks significant results.
$ {}^{\star } $
’ marks significant results.

Furthermore, the two-way interaction DC $ \times $
F showed a significance (
$ \times $
F showed a significance ( $ \hat{\beta} $
= 0.22,
$ \hat{\beta} $
= 0.22, $ {\chi}^2(1) $
= 4.65, p = 0.03). A sub-analysis showed that it stems from a significant DC effect in the formal condition in that
$ {\chi}^2(1) $
= 4.65, p = 0.03). A sub-analysis showed that it stems from a significant DC effect in the formal condition in that $ {\mathrm{DC}}_{formal} $
is rated higher than
$ {\mathrm{DC}}_{formal} $
is rated higher than $ {\mathrm{AC}}_{formal} $
(RQ2.7). This effect was not present in the informal conditions (RQ2.8).
$ {\mathrm{AC}}_{formal} $
(RQ2.7). This effect was not present in the informal conditions (RQ2.8).
The output of the second model using DC as reference level is shown in table 7. The model with random subject intercepts with slopes for SC and AC, as well as random item intercepts fit the data best. The results showed a significant effect of AC (RQ2.9) in that DC were rated higher than AC ( $ \hat{\beta} $
= -0.14,
$ \hat{\beta} $
= -0.14, $ {\chi}^2(1) $
= 5.07, p = 0.02). Other effects, e.g. FORMALITY (RQ2.10), SC (RQ2.11), or EV (RQ2.12), or interactions, e.g. SC
$ {\chi}^2(1) $
= 5.07, p = 0.02). Other effects, e.g. FORMALITY (RQ2.10), SC (RQ2.11), or EV (RQ2.12), or interactions, e.g. SC $ \times $
F (RQ2.13) and SC
$ \times $
F (RQ2.13) and SC $ \times $
EV (RQ2.14), showed no significance.
$ \times $
EV (RQ2.14), showed no significance.
Main analysis (A1): output of the DC (double comparative) model with (Q2) evaluativity ratings as dependent variable. SE = standard error. The symbol ‘ $ {}^{\star } $
’ marks significant results.
$ {}^{\star } $
’ marks significant results.

4.2.2 Explorative analysis (A2)
All three models fit best with the loglog link function. The output of the models for (A2) taking the ratings of (Q2) as the dependent variable are shown in table 8.
Explorative analysis (A2): output of the three models with (Q2) evaluativity ratings as dependent variable. SE = standard error, SC =synthetic comparative, AC = analytic comparative, DC = double comparative, EV = the factor ENGLISH VARIETY. The symbol ‘ $ {}^{\star } $
’ marks significant results.
$ {}^{\star } $
’ marks significant results.

The SC model with subject and item intercepts fit the data best. The results showed a significant effect of GENDER (RQ2.15) in that women rated SC conditions higher than men ( $ \hat{\beta} $
= 0.03,
$ \hat{\beta} $
= 0.03, $ {\chi}^2(1) $
= 16.26, p
$ {\chi}^2(1) $
= 16.26, p $ < $
0.0001). Furthermore, there was a significant EV effect (RQ2.16) in that American English participants rated SC conditions less appropriate than British English participants (
$ < $
0.0001). Furthermore, there was a significant EV effect (RQ2.16) in that American English participants rated SC conditions less appropriate than British English participants ( $ \hat{\beta} $
= -0.20,
$ \hat{\beta} $
= -0.20, $ {\chi}^2(1) $
= 30.38, p
$ {\chi}^2(1) $
= 30.38, p $ < $
0.0001). No other effect turned out significant.
$ < $
0.0001). No other effect turned out significant.
The AC model with subject intercepts fit the data best. The results showed a significant FORMALITY effect (RQ2.17) in that formal conditions were rated lower than informal conditions ( $ \hat{\beta} $
= -0.14,
$ \hat{\beta} $
= -0.14, $ {\chi}^2(1) $
= 3.94, p
$ {\chi}^2(1) $
= 3.94, p $ < $
0.05). No other effect turned out significant.
$ < $
0.05). No other effect turned out significant.
The DC model with subject and item intercepts fit the data best. The results showed no significant effects.
5 Discussion
The current study takes a first step to experimentally investigate certain aspects in the distribution of the three comparative variants, synthetic comparatives (SC – taller), analytic comparatives (AC – more tall) and double comparatives (DC – more taller). Building on corpus-based research which highlights an array of linguistic and extralinguistic factors affecting the production of the comparative alternatives, we explored their perception by American and British English speakers, taking register effects into consideration, with two research question: (i) their appropriateness (RQ1) and (ii) their interpretation in terms of evaluativity (RQ2) – see section 2.4. The results of the experiment are summarized in table 9, additionally, the results on the influence of the speakers background is summarized in table 10. The findings partially confirm the sets of hypotheses on the appropriateness (H1) and the evaluativity (H2) of the forms (see section 2.4). Furthermore, we formulated explorative hypothesis based on the influence of demographic background. We first report on the results from the appropriateness ratings, then on the evaluativity ratings, and lastly on the explorative analyses.
Summary of the results for the appropriateness (Q1) and evaluativity (Q2) ratings together with the hypotheses (see section 2.4). SC =synthetic comparative, AC = analytic comparative, DC = double comparative. ‘ $ < $
’ indicates the direction of the significant effect in that the levels to the left of the symbol are smaller than those on the right side, ‘
$ < $
’ indicates the direction of the significant effect in that the levels to the left of the symbol are smaller than those on the right side, ‘ $ > $
’ meaning the reverse. The symbol ‘–’ marks non-significant effects. Hypotheses in bold (e.g. 1a) indicate that they are in line with the experimental evidence.
$ > $
’ meaning the reverse. The symbol ‘–’ marks non-significant effects. Hypotheses in bold (e.g. 1a) indicate that they are in line with the experimental evidence.

Summary of the results for the explorative analysis of the appropriateness (Q1) and evaluativity (Q2) ratings. SC = synthetic comparative, AC = analytic comparative, DC = double comparative, AE = American English, BE = British English. ‘ $ < $
’ indicates the direction of the significant effect in that the levels to the left of the symbol are smaller than those on the right side, ‘
$ < $
’ indicates the direction of the significant effect in that the levels to the left of the symbol are smaller than those on the right side, ‘ $ > $
’ meaning the reverse. ‘
$ > $
’ meaning the reverse. ‘ $ \uparrow $
’ indicates that the following level significantly increases and ‘
$ \uparrow $
’ indicates that the following level significantly increases and ‘ $ \downarrow $
’ that it decreases. The symbol ‘–’ marks non-significant effects.
$ \downarrow $
’ that it decreases. The symbol ‘–’ marks non-significant effects.

First, AC (RQ1.1) and DC (RQ1.9) were rated as significantly less appropriate than SC, which supports (H1a) and (H1b). As expected, SC is rated high across both English varieties and registers, since the SC form is preferred for the tested adjectives. However, the overall rating of ACs and DCs is well above the middle of the Likert-scale (4) with mean ratings exceeding 5 – showing that those forms were considered quite appropriate by the native English speakers who participated in the study. These findings provide evidence for the hypothesis that the correlation between corpus frequency (i.e. language use) and judgments (i.e. language competence) is not as strong as predicted by certain probabilistic models of language competence (Lau et al. Reference Lau, Clark and Lappin2017), in line with the argumentation in Sprouse et al. (Reference Sprouse, Yankama, Indurkhya, Fong and Berwick2018); White & Rawlins (Reference White and Rawlins2020). Considering the very restricted availability of the analytic comparative forms in corpora, under a probabilistic model we would expect lower ratings in the current study. Our finding is in line with other experimental results by Boyd (Reference Boyd2007) and LaFave (Reference LaFave2015), which also confirm that perception data exhibits higher rates of variation than production data (Hilpert Reference Hilpert2008; Mondorf Reference Mondorf2009). It is important to notice though, that this difference between production and perception does not apply to all adjectives; we indeed observe different patterns for the adjective narrow, which in corpus studies has been shown to have a relatively higher ratio of ACs compared to the other adjectives used in our study (i.e. 14/550, Hilpert Reference Hilpert2008: table A2b). As illustrated in figure 4, the AC (more narrow) and SC (narrower) ratings are closer to each other than for any other adjective. Interestingly, we notice a similar pattern for the adjective heavy as well: the mean rating converges for AC (more heavy) and SC (heavier) (see table A1 in the Appendix for means per condition). Overall, our study indicates that the type of comparative form has a crucial impact on their perception. However, looking at the ratings levels and individual adjectives, we see only a partial difference between psycholinguistic studies on perception and corpus-based findings on production (see Adli Reference Adli, Adli, García and Kaufmann2015 for a related discussion).
Comparing the two less frequent alternatives, AC and DC, our results showed no differences in their appropriateness ratings (RQ1.3/11), which hints at their similarity. This finding invalidates claims that DCs are irregular, regional or illiterate, as assumed in certain grammars or dictionaries (see the entry in Fowler’s Dictionary of Modern English Usage, Butterfield Reference Butterfield2015). Furthermore, figure 3 shows little rating variation for SC with most subject means between 5 to 7. By contrast, ACs and DCs exhibit large rating variation with subject means across the entire span of the scale (i.e. 1 to 7). This supports the view that especially for the variants that are prescriptively characterized as non-canonical, large-scale individual differences between the participants are to be expected, depending on their sociolinguistic background, but variation within-participants is also possible due to uncertainty.
In terms of the register effects on the appropriateness ratings, we found evidence that overall, AC (RQ1.2/5/18) is rated as less appropriate in formal than informal contexts, which supports (H1c). One possible explanation is that informal register – in line with the association that non-standard language more easily tolerates forms treated as less typical or correct by traditional grammar (Ferguson Reference Ferguson1959; Heylighen & Dewaele Reference Heylighen and Dewaele1999). Furthermore, for AC forms, the formal condition was rated more appropriate in AE than in the BE dataset (RQ1.7/15). Since the interaction between formality and English variety was not significant, the AC-formal effect is not due to an overall difference in the formality judgments of the English varieties. This could represent a converging result in line with the corpus finding that American English speakers use ACs more frequently than British English speakers (Mondorf Reference Mondorf2009: 172). American English speakers may therefore be more inclined to accept AC forms in formal speech. However, this point requires further research focusing on the formal dimension of AC forms in American and British English. Notice that according to Mondorf, the ratio of ACs which are found in relatively complex constructions increases in less formal register/style compared to SCs (Mondorf Reference Mondorf2009: 185-90) in both language varieties. Crucially, there was no formal vs. informal difference in the SC ratings (RQ1.6), which is in line (H1e).
For DC, the picture is different: while there is an overall effect of register in that DC was rated less appropriate in formal than in informal contexts (RQ1.10), we also found that this effect is mostly driven by the AE dataset (RQ1.13/14). Thus, (H1d) cannot be confirmed for BE but is in line with the AE data. Furthermore, the formal condition of DCs is rated equally across both English varieties (RQ1.8/16), which is further in line with (H1g). The finding for British English seems to pattern with González-Díaz’s finding, based on corpus research, that DCs appear in both formal and informal texts in Present-Day English (González-Díaz Reference González-Díaz2006: 653). In Modern English, DC variants appear in American English dialects (Wolfram & Schilling-Estes Reference Wolfram and Schilling-Estes2016: 383), such as Appalachian English or African American Vernacular English (Włodarczyk Reference Włodarczyk2007), as well as British English dialects, such as Tyneside (Beal Reference Beal, Milroy and Milroy1993) and Southern British English (Edwards Reference Edwards, Milroy and Milroy1993). Our finding might indicate that American English speakers associate DC forms with dialects more so than British English speakers, which therefore leads to the judgment that DCs are appropriate in contexts which allow for the use of dialect, such as informal ones. British speakers might not have this strong association. This register difference across American and British English in prescriptively considered ungrammatical forms, e.g. DC, is in line with a rating study on negative concord, e.g. I didn’t eat no apple (Rotter & Liu Reference Rotter and Liu2024). In this study, a register effect was found only in the American study in that negative concord was judged as less appropriate in formal than informal contexts.
Lastly, we found significant main effects for neither AC (RQ1.4) nor DC (RQ1.12), which is in line (H1f) and (H1g), respectively. Thus, the previously discussed frequency difference in the two English varieties might not play out due to the selection of adjectives which anyway strongly prefer the SC variant. However, these findings are based on null hypotheses thus their generalizability has to be taken with caution.
Besides the appropriateness ratings, we also collected data on the interpretation to examine whether language comprehenders assign an evaluative interpretation to the comparative forms. First, AC received significantly lower ratings than SC (RQ2.1), which supports the hypothesis that ACs are more likely than SCs to trigger an evaluative inference, as exemplified in (2a) (H2a). However, we did not find a difference between DC and SC (RQ2.11) and AC received lower ratings than DC (RQ2.2/9). Thus (H2b) (DC would receive lower evaluativity ratings than SC) and (H2c) (AC and DC would receive equal evaluativity ratings) cannot be confirmed. Instead of AC and DC both generating an evaluative interpretation which opposes the SC form, only AC did in our findings. SC and DC generated a similar interpretation. Thus, we can conclude that there is an effect of evaluativity but only partially for ACs. For DCs, the result cannot be easily integrated in existing findings. As we noticed above, there is no discussion in formal semantics regarding the interpretation of DCs. Following the same line of argumentation based on complexity, we hypothesized that DCs might also give rise to evaluativity since they are syntactically more complex than the corresponding SCs (Matushansky Reference Matushansky, Megerdoomian and Bar-el2001; Rett Reference Rett2008, Reference Rett2014; Moracchini Reference Moracchini2019, see also Alexiadou et. al. Reference Alexiadou, Karkaletsou and Oikonomou2024, for Greek DCs). This hypothesis was in line with the reported environments in which DCs appear in corpora, suggesting that they are evaluative or at least emphatic (González-Díaz Reference González-Díaz2006, Reference González-Díaz2008a). Thus, given this background, it is puzzling that DCs generated a similar evaluativity effect to SCs.
Regarding the differences in terms of evaluativity ratings between the register manipulation, we found evidence that AC is rated lower in formal than in informal conditions (RQ2.3), which is against (H2e) (AC receives equal evaluativity ratings in formal and in informal conditions). Such an effect was not present for DC (RQ2.10) or SC (RQ2.5/13); the latter finding is in line with (H2d). ACs seem to act very differently in comparison to SCs and DCs. We found evidence that in the formal condition, AC is rated lower than DC (RQ2.7), which was not present in the informal condition (RQ2.8). This could show that an evaluativity inference most likely emerges in formal contexts in which, otherwise, the choice of an AC is judged less appropriate by the participants. Thus, there is an interplay between different factors affecting the distribution and the interpretation of the different comparative alternatives (Mondorf Reference Mondorf2014). In conclusion, there is a register effect of AC, and it exhibits a stronger evaluativity effect in formal situations in comparison to DC.
Regarding language variety, we did not find evidence that American or British speakers rated the evaluativity of ACs (RQ2.4) or DCs (RQ2.12) differently, which is in line with (H2f) and (H2g). Additionally, SCs (RQ2.6/14) showed no differences as well, which was not part of our hypotheses.
Overall, the results indicate that the three forms are not functionally equivalent (cf. Labov Reference Labov1972) – ACs especially seem to generate different levels of evaluativity than the other alternatives. However, as can be seen in figure 6, the mean ratings of participants are equally distributed across the entire scale independently from the formality manipulation. This could hint at a large rater variation, but also towards an issue with the task used to assess evaluativity in the different comparative strategies. As pointed out to us by Sophie Moracchini (p.c.), the evaluativity effect might not arise due to the fact that there were only two entities compared with each other. This can have an effect on the way the degree of comparison is understood by the participants, i.e. relative to one of the two entities. Additional considerations involve the nature of the question which was addressed directly to the participants in the study. Thus, the participant did not judge the question from the view point of the interlocutors in the story but based on their own perspective. We leave it for future research to investigate whether a modification of the current design might result in a different evaluativity effect for the three comparative forms or whether SCs and DCs are equivalent in terms of their interpretation.
In addition, we conducted explorative analyses taking the demographic data, i.e. age, gender, dialect and English variety, into consideration. For a complete picture, we added the factor formality which, in all models, mirrored the effects of the main analysis. For SC expressions, we found no influence of the speakers’ background properties on the level of appropriateness; particularly, there was no effect of the dialect (RQ1.17), which is in line with (H1a). Given that the adjectives in the study all favored the SC alternative, a lack of effects is not surprising. For AC expressions, the results showed an age effect (RQ1.19): the older the participant, the lower the appropriateness rating. No difference was found between dialect and non-dialect speakers (RQ1.20). As for DC expressions, we found a gender difference in that women gave higher ratings than men (RQ1.23). Furthermore, no influence of dialect was found (RQ1.23). As for the evaluativity, we found a gender effect in the SC condition in that women gave higher ratings against an evaluative interpretation than men (RQ2.15). In addition, there was difference in terms of variety in that American English participants gave higher likelihood ratings against an evaluative interpretation than British English participants. As for AC and DC, no influence of the demographic background was found.
The results on the influence of the speakers’ demographic and language background give a first impression. However, the statements cannot be clearly generalized. Thus, the implications of our findings need to be taken with caution. First, the absence of a dialect effect might be due to the low amount of self-reported dialect speakers (see section 3.3). Our data being self-reports may lead to participants consciously or unconsciously omitting such information. Second, the age effect might show that older participants were less tolerant in terms of their judgments for AC forms. Whether this might hint at language change in the context of comparative forms, we would like to keep for further research. Lastly, regarding the finding that women judge DCs more appropriate than men, it is often claimed in sociolinguistic research that women disfavor stigmatized features due to social pressure (cf. Lakoff Reference Lakoff1973; Carli Reference Carli1990; Labov Reference Labov2001: 293). Other works, however, show a more differentiated picture: while women were found to adopt conventions of the formal register, they drive innovations in the informal register (cf. Degaetano-Ortlieb et al. Reference Degaetano-Ortlieb, Säily and Bizzoni2021). Thus, the underlying reasons for the reported influence of dialect, age and gender are diverse. Our study was a first step to identify potential influences on the perception and interpretation of comparative forms. The discussion of the demographic background needs to be further explored in future research, directly targeting related questions.
Having discussed the results in relation to the hypotheses, we would like to answer our aforementioned research questions. (RQ1) asked about the factors which influence the appropriateness of the comparative forms. We found that the comparative form and the register both had a strong effect on the levels of appropriateness. ACs and DCs in formal vs. informal contexts seemed to be differently perceived by American and British English speakers. Furthermore, we can add that interindividual differences seem to play a role, yet their underlying mechanism needs to be further researched. (RQ2) asked about the evaluativity of the three forms. This question cannot be clearly answered. Results on the interpretation of ACs partially confirmed the observations in the literature. However, more research is necessary to reach a conclusive answer. We discussed potential shortcomings in the design of the interpretation question (Q2).
Before concluding the article, we would like to briefly discuss the scope and limitations of the reported study. Registers are multidimensional, i.e. they are a construct of different situational-functional parameters as well as different linguistic features, e.g. modality of the text (written vs. spoken), location (in the city center vs. at a conference), topic of conversation (summary of the last business meeting vs. chat about the happenings of the day) among others (Biber Reference Biber, Lüdeling and Kytö2009; Lüdeling et al. Reference Lüdeling, Alexiadou, Adli, Donhauser, Dreyer, Egg, Feulner, Gagarina, Hock, Jannedy, Kammerzell, Knoeferle, Krause, Krifka, Kutscher, Lütke, McFadden, Meyer, Mooshammer, Müller, Maquate, Norde, Sauerland, Solt, Szucsich, Verhoeven, Waltereit, Wolfsgruber and Zeige2022). In our study, we focused on one particular situational parameter, namely formality through the social relation of the interlocutor. Thus, future work needs to incorporate further parameters to investigate the multidimensionality of register in relation to comparative forms. Taking these limitations into consideration, our study, using strictly controlled contexts, gives a first impression of how and to what extent the type of comparative forms, register and English variety affect the perception of comparative forms.
6 Concluding remarks and future directions
Our study presented a first attempt to experimentally investigate the appropriateness and evaluativity of the synthetic (shorter), analytic (more short) and double (more shorter) comparative alternatives. We confirmed the hypothesis that the type of the comparative influences the ratings: the analytic and double comparative showed lower appropriateness levels than the synthetic comparative. We also found evidence that register influences the way in which the alternatives are perceived, while analytic and double comparative alternatives are rated as less appropriate in formal than in informal contexts, the context did not show an effect on the synthetic alternative. Furthermore, the AC shows a different behavior in terms of the interpretation than the other forms, in that there is a stronger effect of evaluativity. Our results show that the type of comparative and register influence their perception, and thus provide converging psycholinguistic evidence to corpus findings. However, there is divergence in terms of the size of the effect (i.e. a form which may be unavailable in a corpus receives mean rating above the middle). Regarding evaluativity, our results partially confirm the semantic analyses by Rett (Reference Rett2008) and Moracchini (Reference Moracchini2019), which predict an evaluativity effect for ACs, but the size of the effect is not as strong as one might expect. For DCs, our findings diverge from the corpus findings, which deserves further attention in future studies.
Further research focusing on the processing and methods used to investigate evaluativity, or alternatively degree intensity, is needed to gain more insight into the relationship between the morphosyntactic and semantic properties of comparative constructions.
From a register research point of view, our study showed that the forms of comparatives are suitable to investigate register knowledge. Further studies could potentially look into the social meanings and personae (cf. Hall-Lew et al. Reference Hall-Lew, Moore, Podesva, Hall-Lew, Moore and Podesva2021) associated with the forms as part of their communicative functions.
Finally, the processing of comparatives provides fertile ground for cross-linguistic research. For example, in other languages, like Greek, synthetic and analytic comparatives are supposed to be in free variation for a large class of adjectives (though see Karkaletsou & Alexiadou Reference Karkaletsou and Alexiadou2023). It would be interesting to compare the two forms in different registers and, additionally, in terms of possible evaluativity effects they give rise to.
Data repository
The datasets for this study can be found in the online repository: https://osf.io/vfzwm/
Appendix: Adjectives used in the study
Descriptive statistics: mean ratings of (Q1) appropriateness with standard deviation (SD) on a seven-point Likert scale (1: Certainly not, 7: Certainly yes) per adjective. SC =synthetic comparative, AC = analytic comparative, DC = double comparative


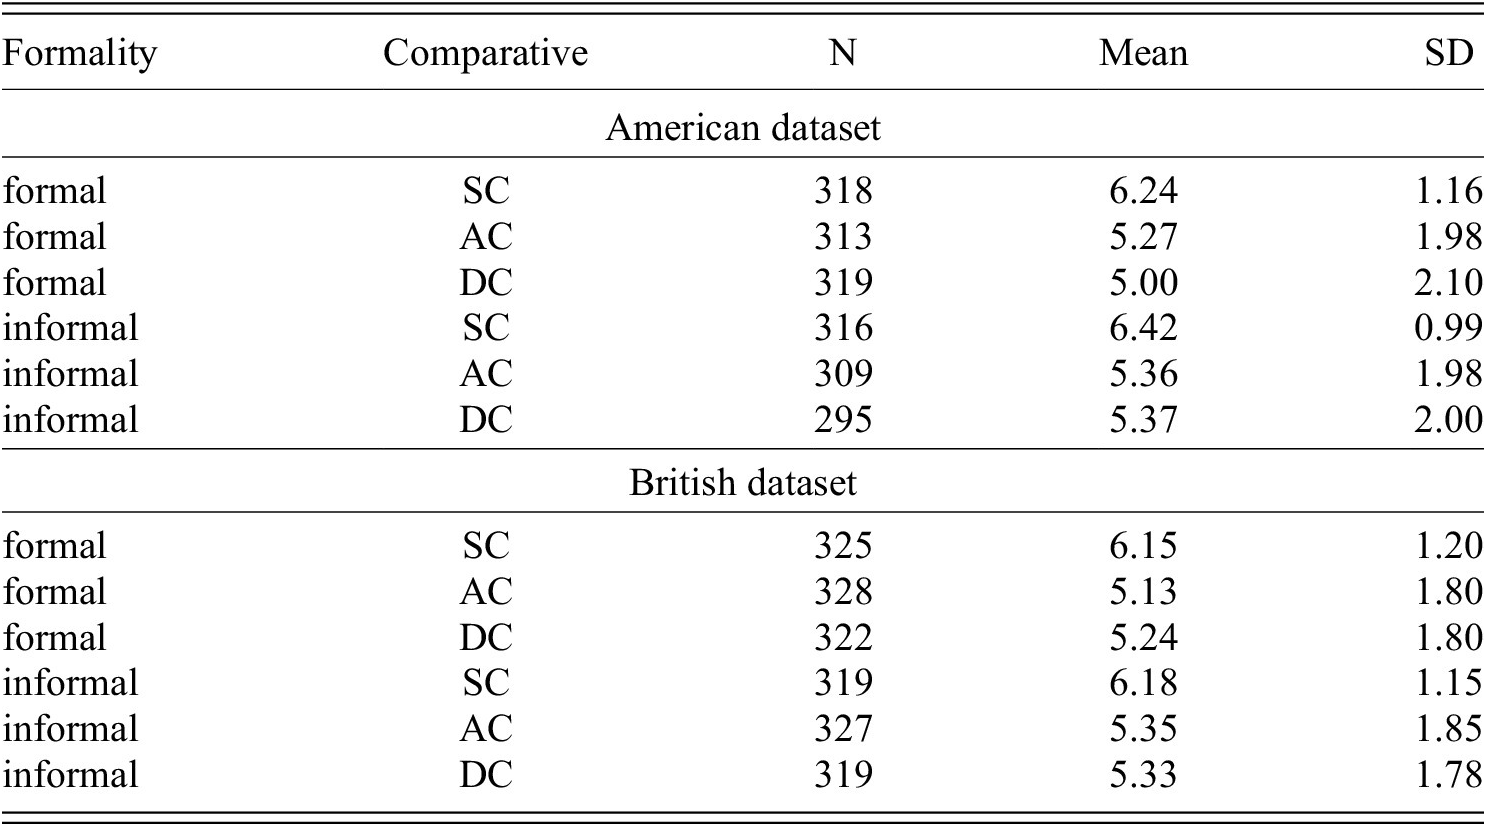
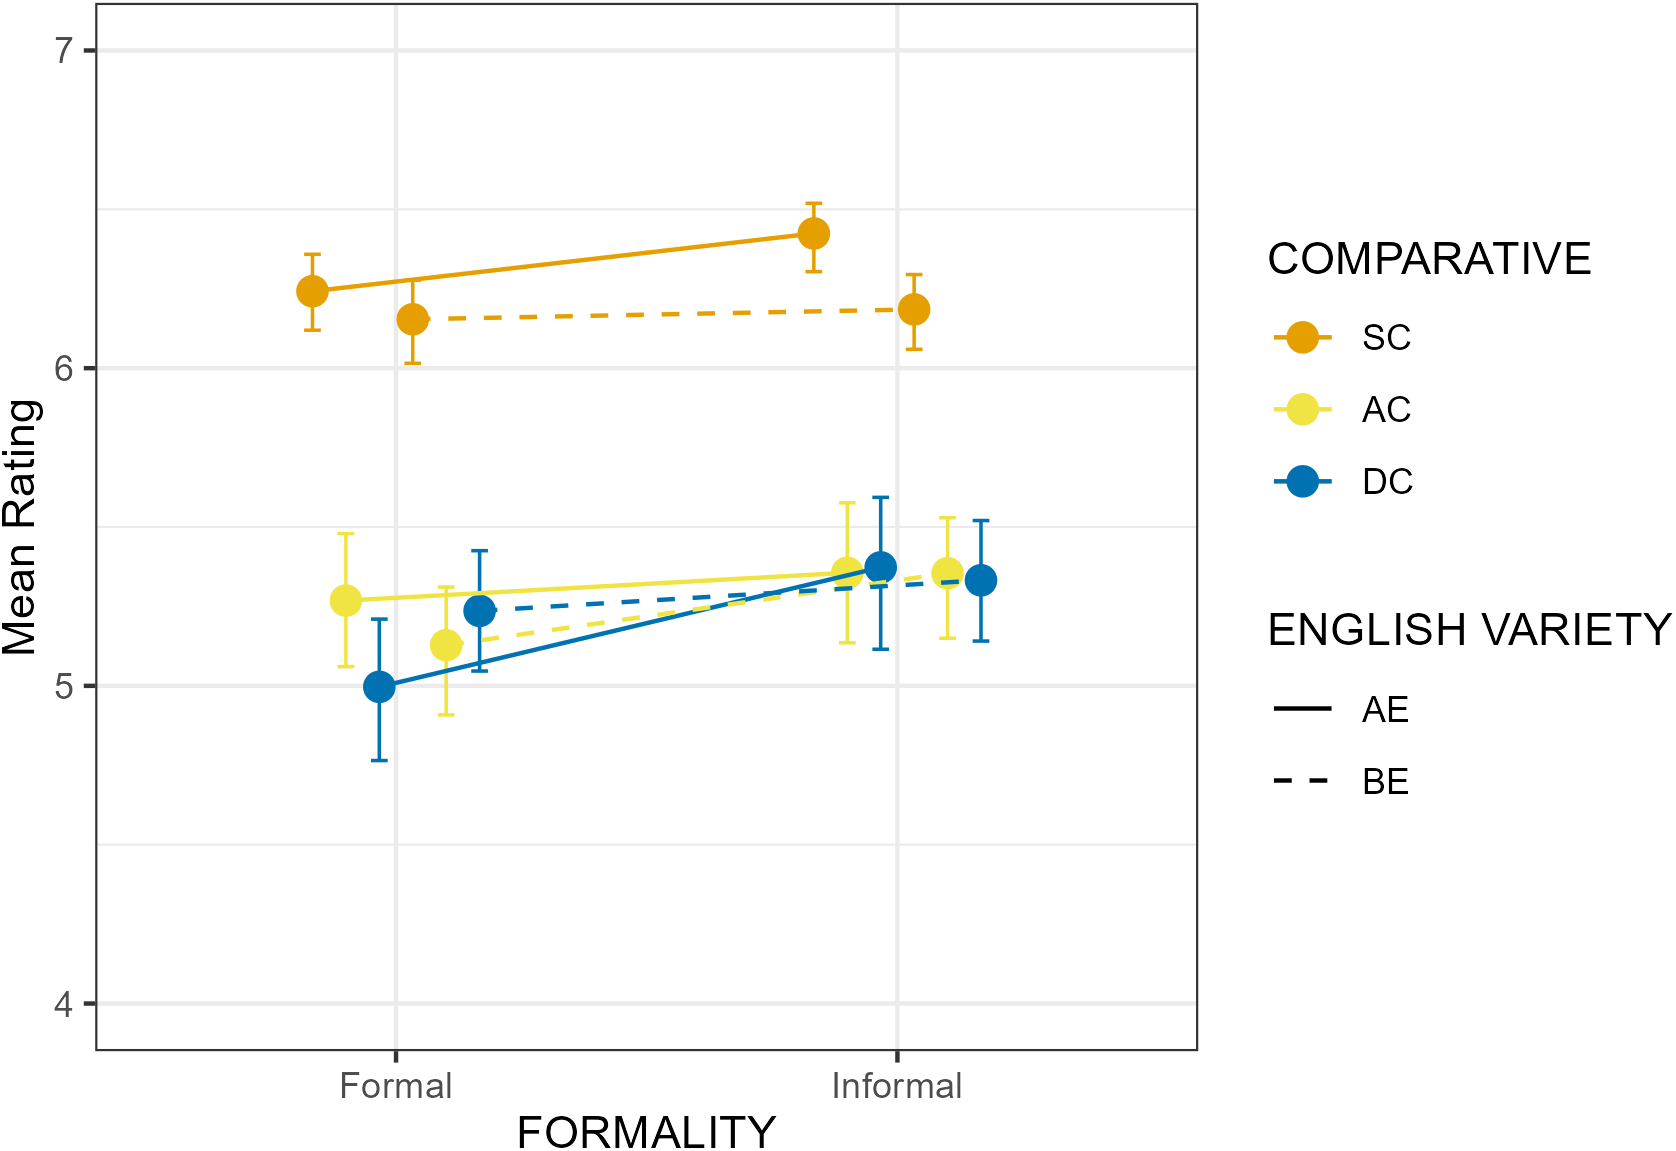


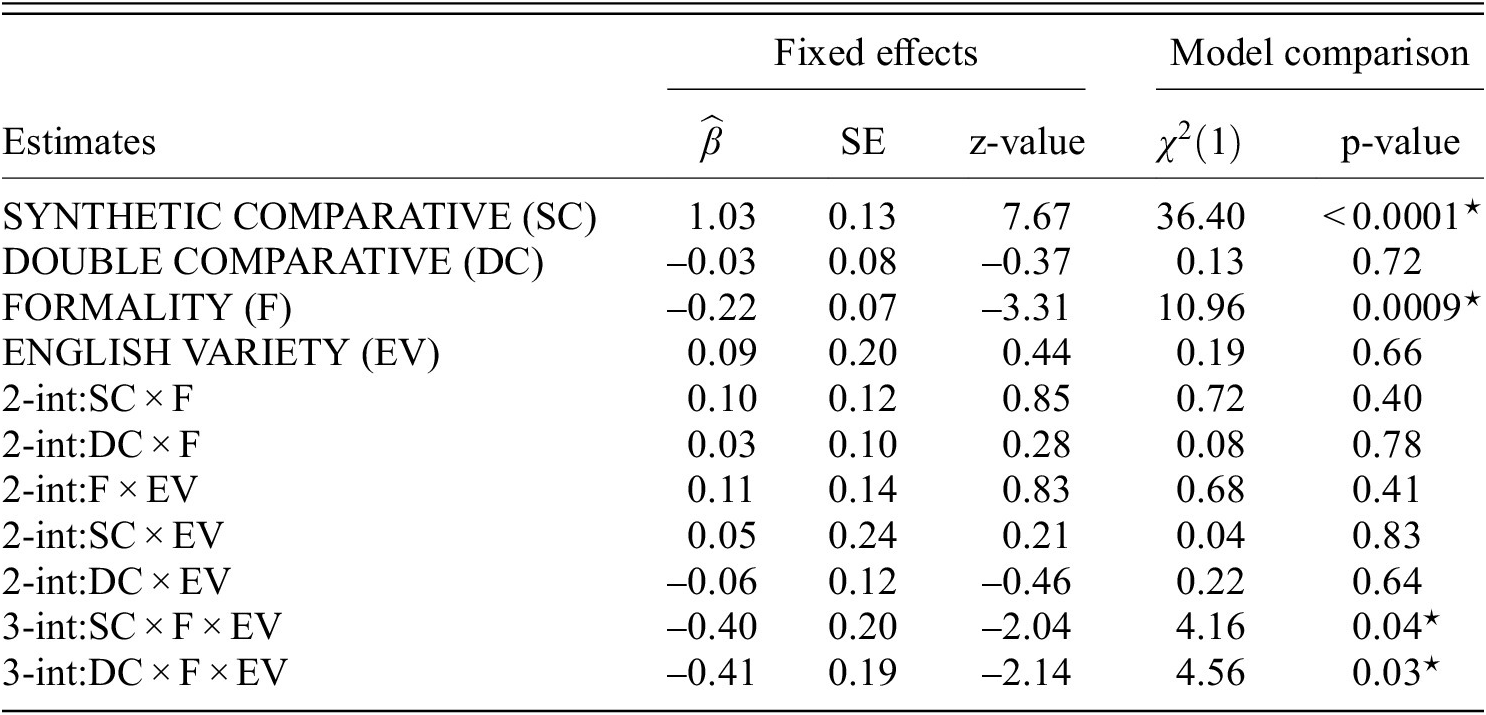

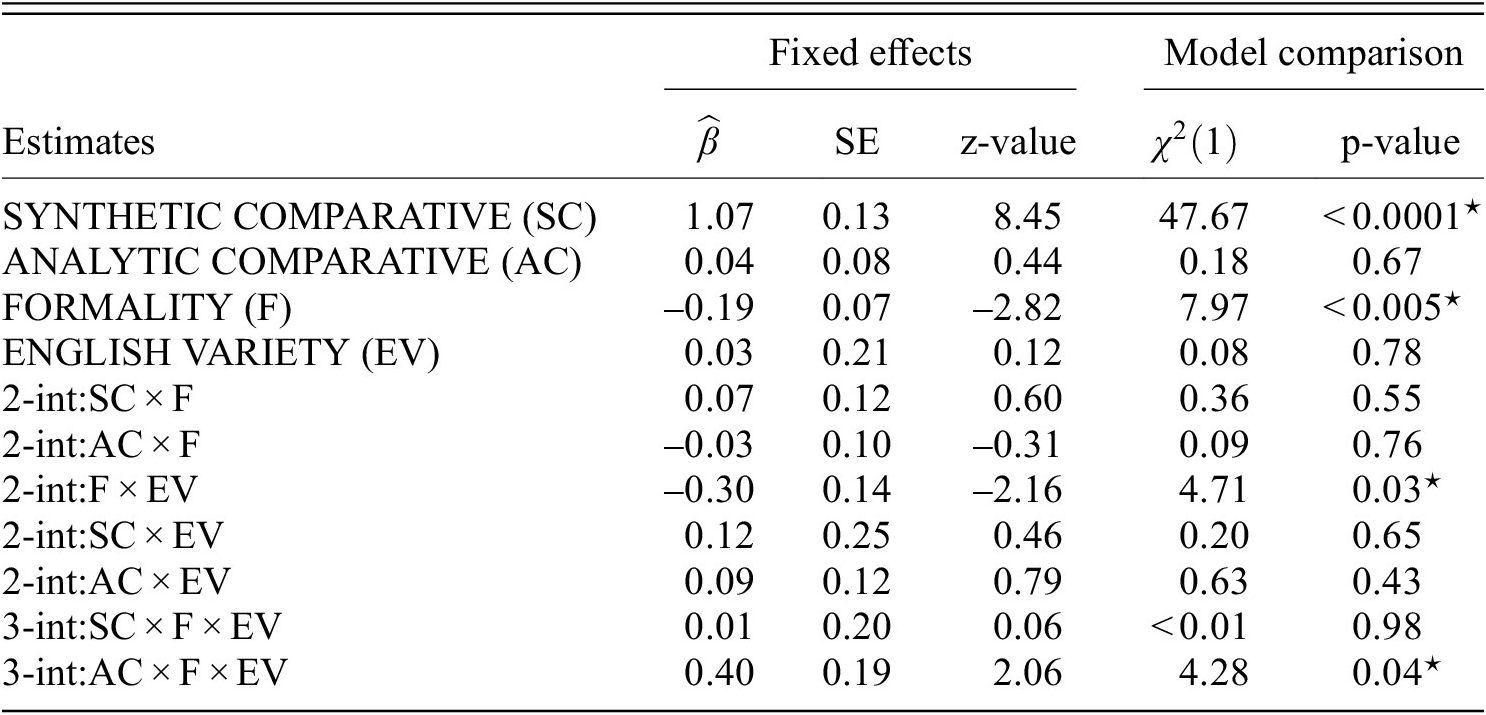

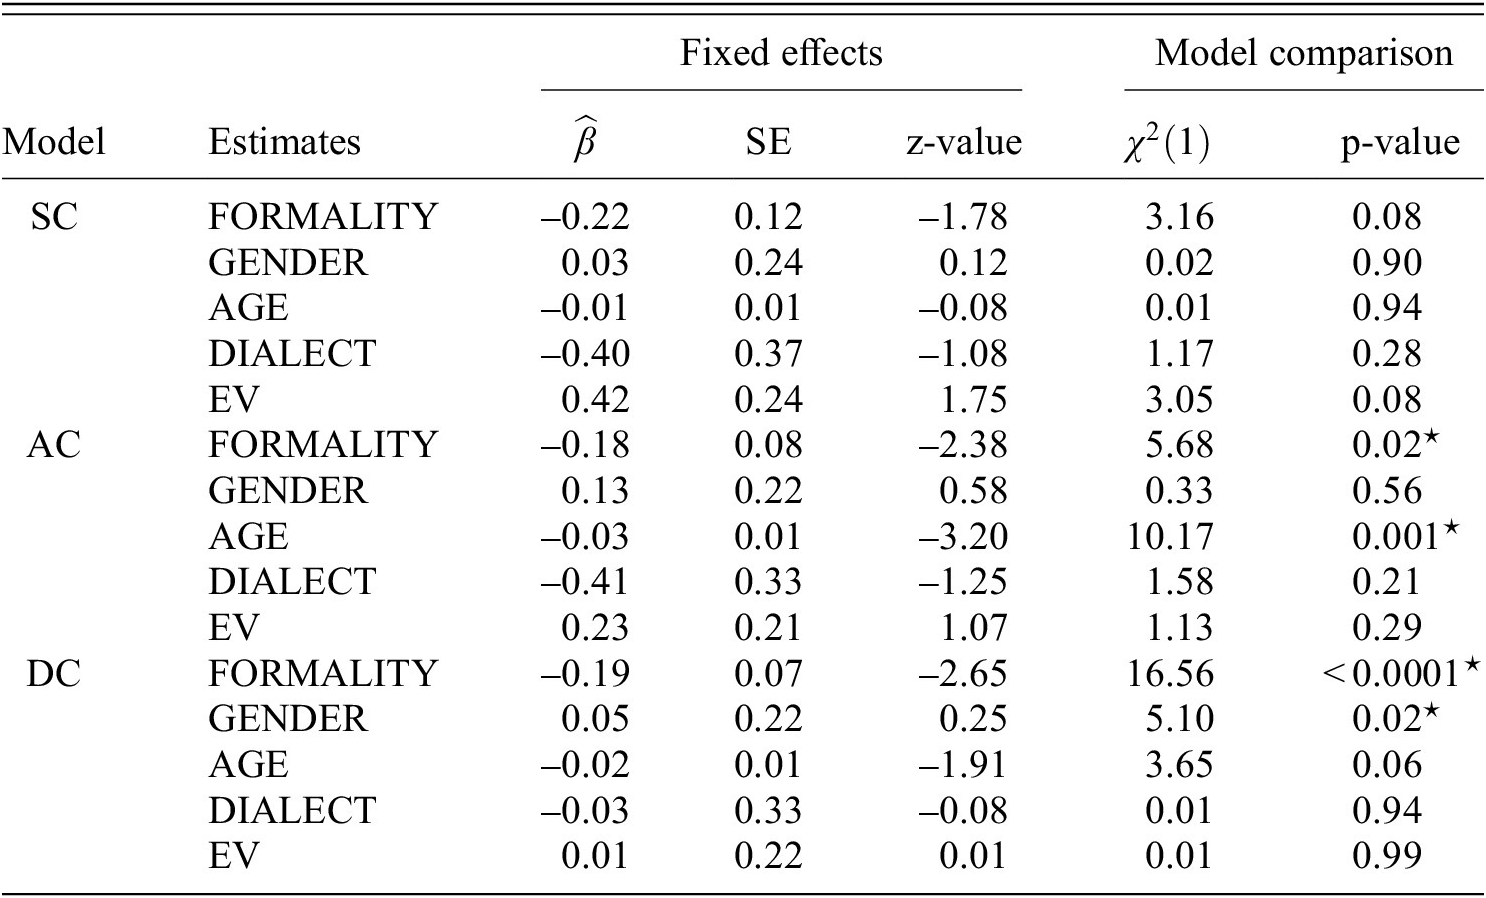

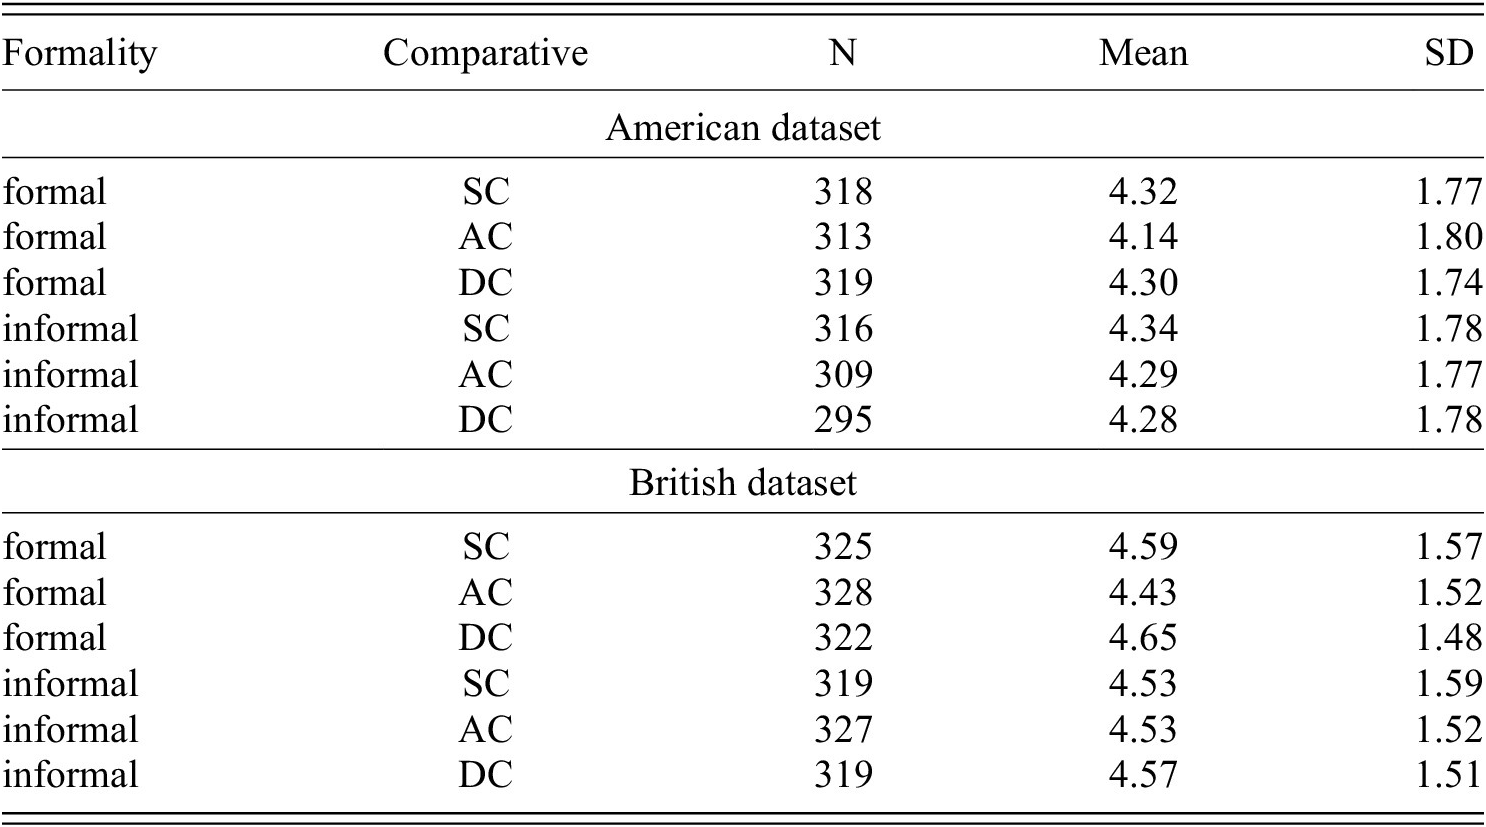
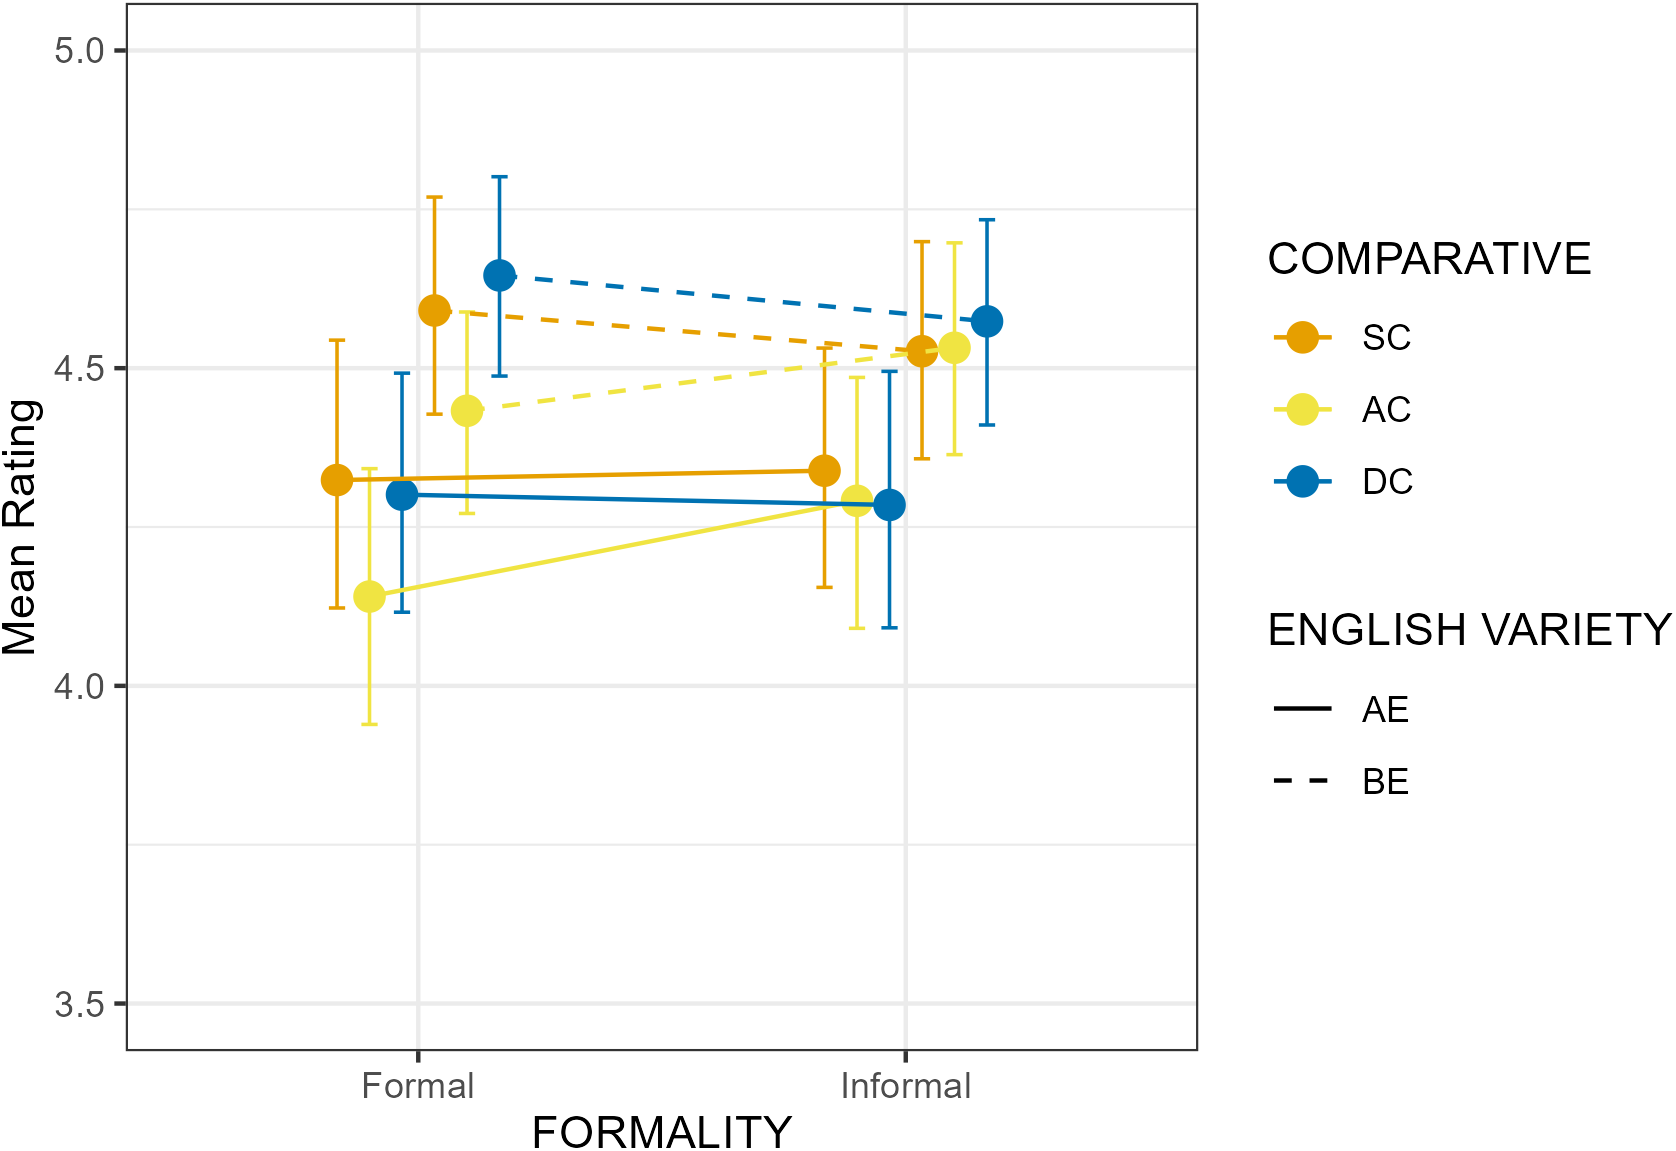


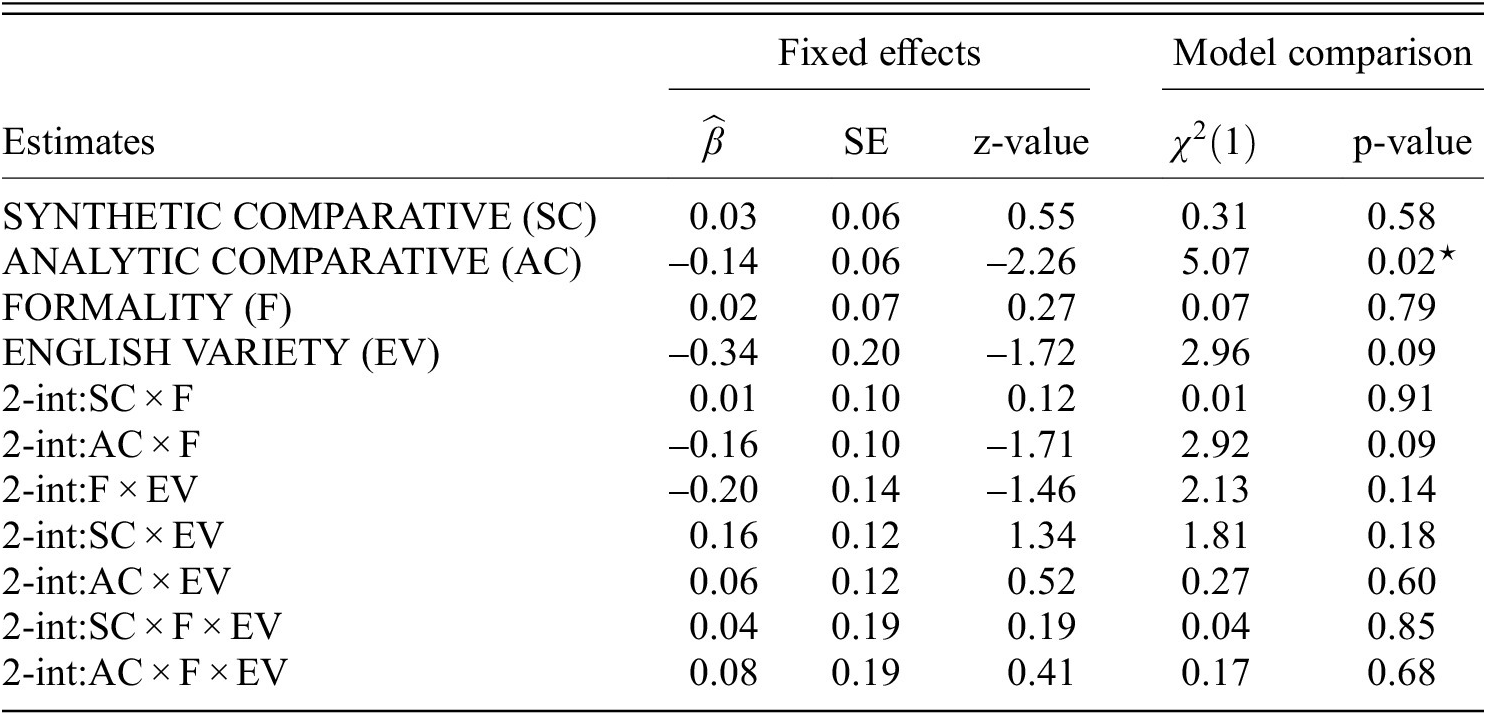

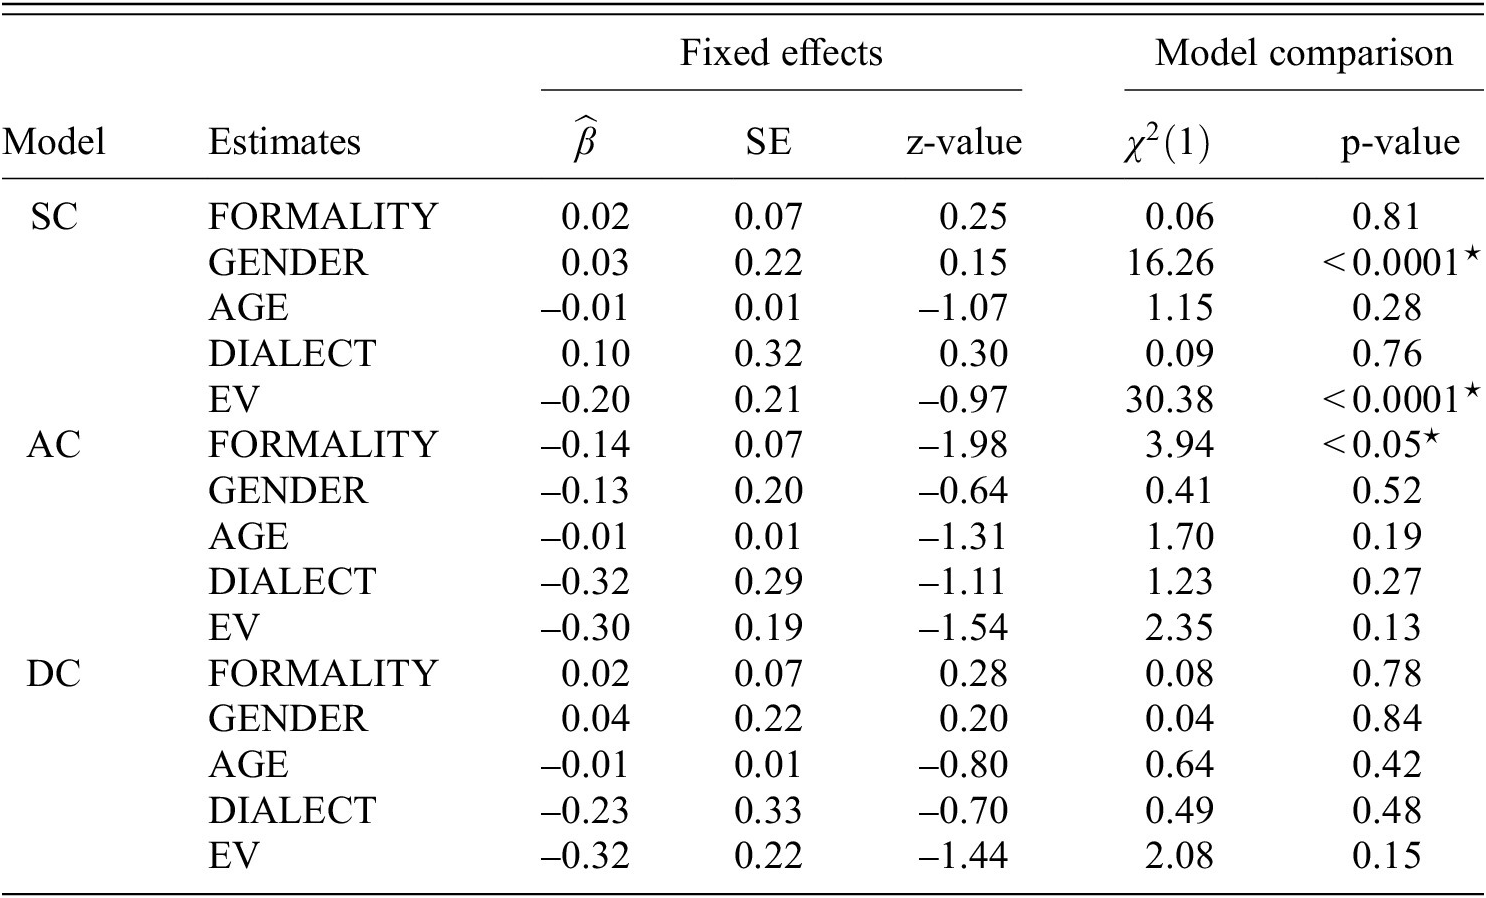

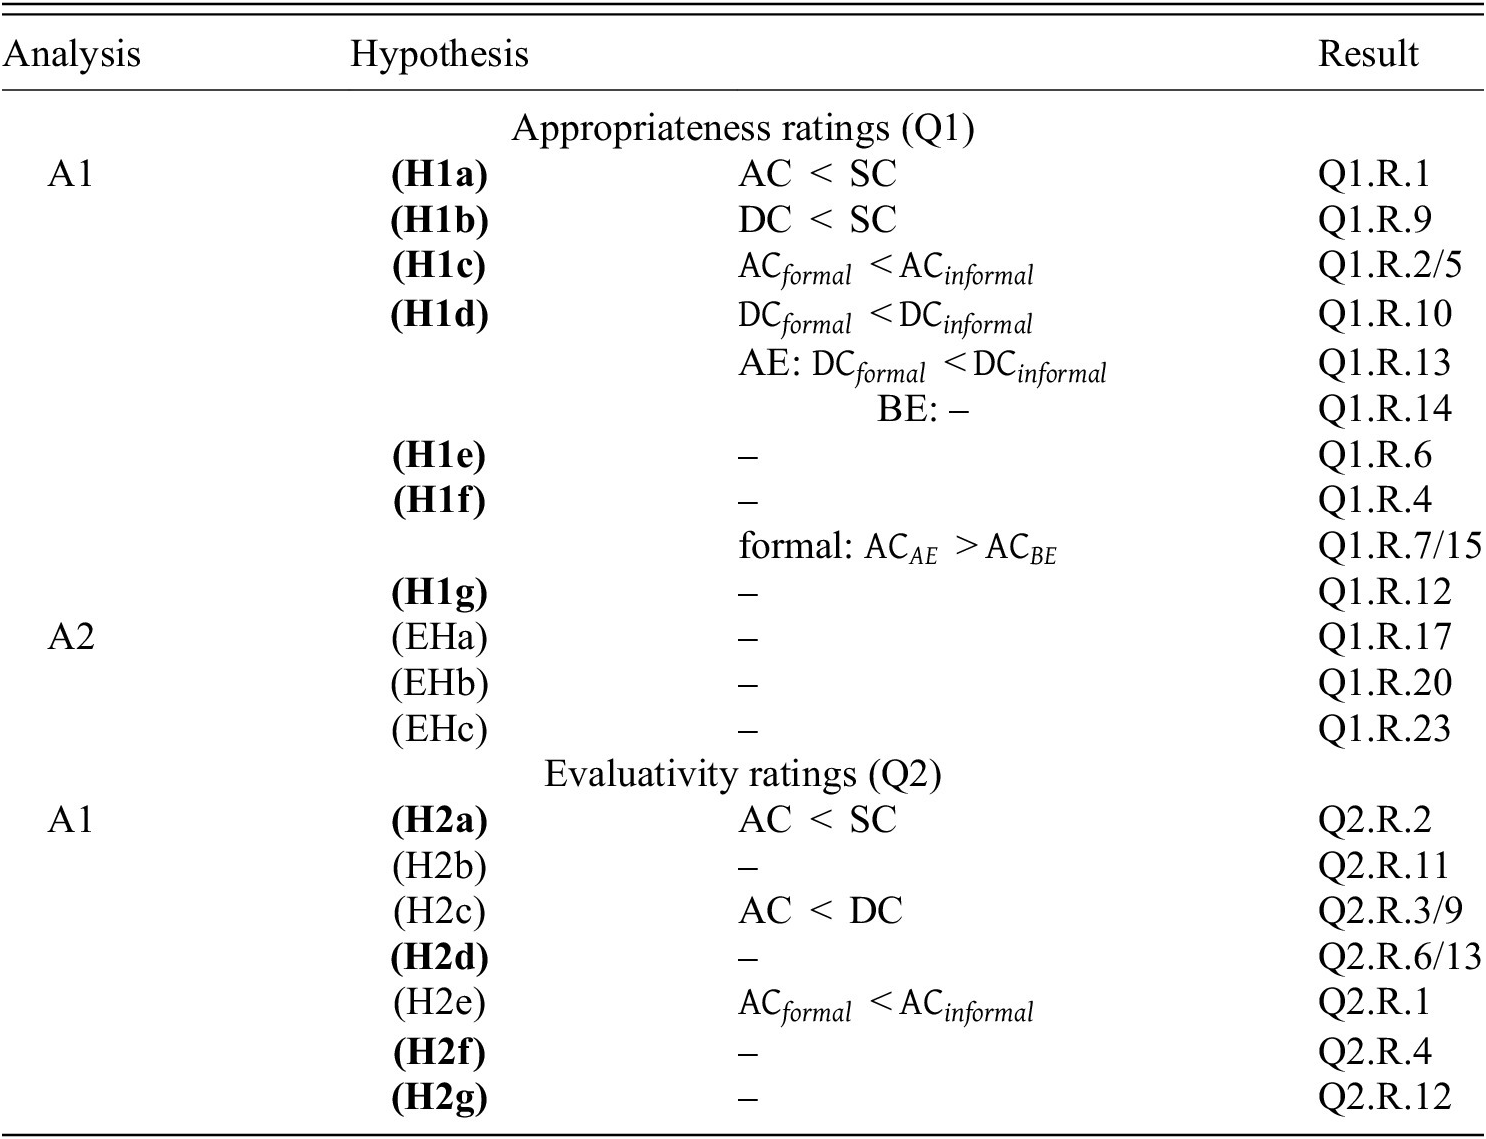


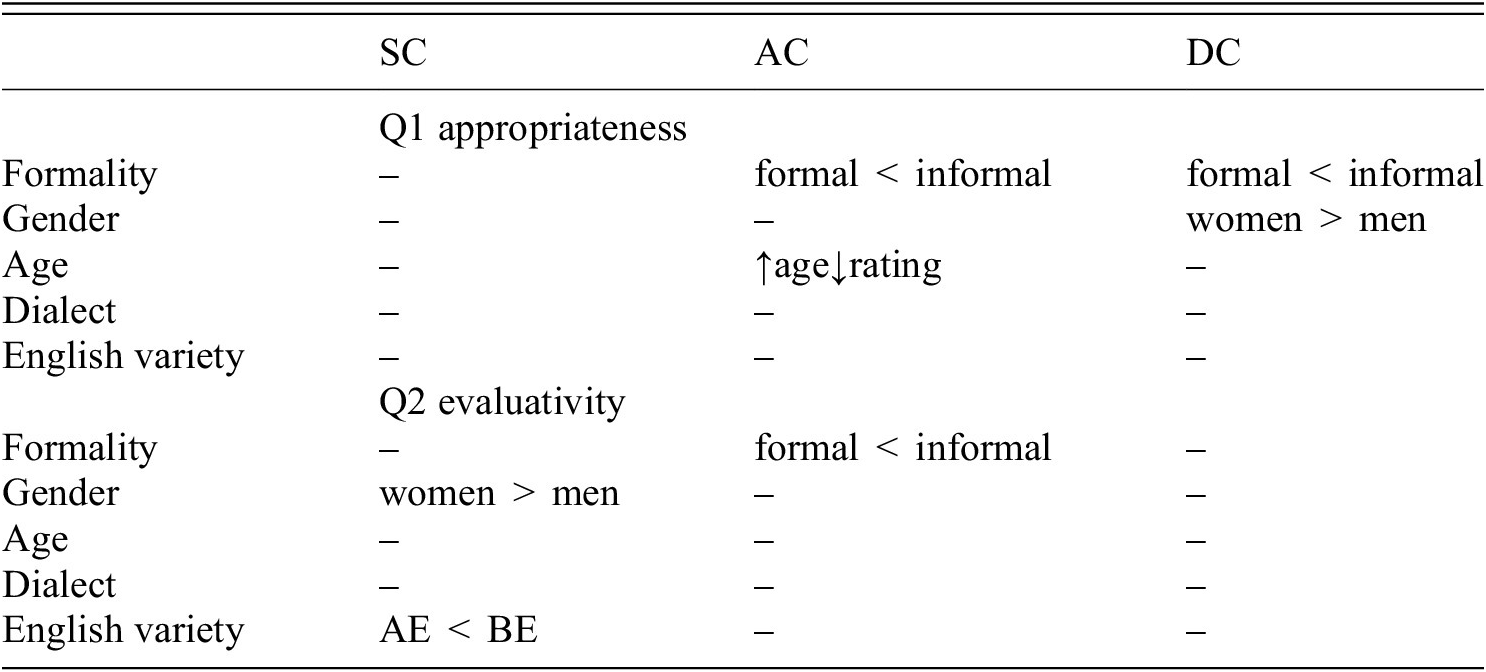


 Open access