Introduction
Trichomonas vaginalis is the causative agent of human trichomoniasis, the most common non-viral sexually transmitted infection worldwide, affecting ~276.4 million people annually (Poole and McClelland, Reference Poole and McClelland2013). This flagellated protist is responsible for severe health complication, such as chronical inflammation (vaginitis, urethritis and prostatitis), infertility, increasing the risk of prostate and cervical cancer, and facilitating the infection and transmission of the human immunodeficiency virus (HIV) (Petrin et al., Reference Petrin, Delgaty, Bhatt and Garber1998).
The cellular and molecular mechanisms of T. vaginalis pathogenesis have not been clearly elucidated due to the multifactorial nature of its virulence mechanisms described up to date. Particularly, multiple molecules have been identified in the cellular damage caused by T. vaginalis, such as porins (Fiori et al., Reference Fiori, Rappelli, Rocchigiani and Cappuccinelli1993), phospholipases (Lubick and Burgess, Reference Lubick and Burgess2004) and proteinases localized on the parasite surface or secreted into the extracellular medium, depending on the environmental conditions (Figueroa-Angulo et al., Reference Figueroa-Angulo, Rendón-Gandarilla, Puente-Rivera, Calla-Choque, Cárdenas-Guerra, Ortega-López, Quintas-Granados, Alvarez-Sánchez and Arroyo2012). Trichomonas vaginalis has multiple proteinases, mainly of the cysteine type (CPs), differentially modulated by iron, playing crucial roles in the virulence of T. vaginalis, in cytoadherence (TvLEGU-1) (Arroyo and Alderete, Reference Arroyo and Alderete1989; Rendón-Gandarilla et al., Reference Rendón-Gandarilla, Ramón-Luing, Ortega-López, Rosa de Andrade, Benchimol and Arroyo2013), cytotoxicity (TvCP39 and TvCP65) (Alvarez-Sánchez et al., Reference Alvarez-Sánchez, Avila-González, Becerril-García, Fattel-Facenda, Ortega-López and Arroyo2000; Ramón-Luing et al., Reference Ramón-Luing, Rendón-Gandarilla, Puente-Rivera, Ávila-González and Arroyo2011), haemolysis (TvCP4) (Cárdenas-Guerra et al., Reference Cárdenas-Guerra, Arroyo, Rosa de Andrade, Benchimol and Ortega-López2013), apoptosis induction (TvCP2, TvCP3, TvCP4 and TvCPT) (Sommer et al., Reference Sommer, Costello, Hayes, Beach, Gilbert, Lucas and Singh2005), among others. Additionally, trichomonad CPs are found in the vaginal secretions of patients with trichomoniasis, some of which are immunogenic (Hernández et al., Reference Hernández, Marcet and Sarracent2014; Arroyo et al., Reference Arroyo, Cárdenas-Guerra, Figueroa-Angulo, Puente-Rivera, Zamudio-Prieto and Ortega-López2015). During vaginal infection, trichomonads are constantly exposed to stress conditions throughout the menstrual cycle, competition for nutrients with the vaginal microflora, and host immune response, among others. However, T. vaginalis adapts and responds to environmental changes, differentially modulating the expression of multiple genes, including those encoding virulence factors, to maintain a chronic infection (Figueroa-Angulo et al., Reference Figueroa-Angulo, Rendón-Gandarilla, Puente-Rivera, Calla-Choque, Cárdenas-Guerra, Ortega-López, Quintas-Granados, Alvarez-Sánchez and Arroyo2012). Glucose is the primary carbon source for T. vaginalis under both anaerobic and aerobic conditions. Thus, the energy generation through glycolysis is vital to the maintenance of a trichomonal chronic infection. The major source of glucose in the vaginal fluid is from the glycogen derived from vaginal epithelial cells through the action of α-glucosidase and β-amylase (Stafkova et al., Reference Stafkova, Rada, Meloni, Zarsky, Smutna, Zimmann, Haranta, Pompach, Hrdy and Tachezy2018). We recently reported that T. vaginalis is exposed to different glucose levels (0.3–36.65 mm) during vaginal infection of women with trichomoniasis. We also reported that glucose promotes trichomonad growth and increases the adherence levels of parasites to laminin and fibronectin (Miranda-Ozuna et al., Reference Miranda-Ozuna, Hernández-García, Brieba, Benítez-Cardoza, Ortega-López, González-Robles and Arroyo2016). Trichomonas vaginalis also activates survival mechanism, such as metabolic reprogramming, enhancing antioxidant ability and autophagy, as a response to nutritional stress by glucose restriction (Huang et al., Reference Huang, Chen, Fang, Cheng, Cheng, Chen, Wu, Ku, Chen, Lin and Tang2014, Reference Huang, Ong, Wu, Hsu, Lin, Fang, Cheng, Huang, Chiu and Tang2017). These data suggest that glucose is also an essential nutrient for T. vaginalis; however, its effects on trichomonal pathogenesis have not been explored yet.
Here, we assessed the effect of nutritional stress by glucose-restriction (GR) on the trichomonal cytotoxicity and apoptosis induction of HeLa cells and proteolytic activity involved in cellular damage. GR condition increases the cytotoxicity levels of T. vaginalis and the proteolytic activity released by T. vaginalis during host–parasite interaction with HeLa cell monolayers. Furthermore, TvCP2 plays a key role in cytotoxicity and apoptosis induction to HeLa cells under GR conditions.
Materials and methods
Parasites and HeLa cell cultures
Trichomonas vaginalis parasites from the fresh clinical isolate CNCD188 (Alvarez-Sánchez et al., Reference Alvarez-Sánchez, Avila-González, Becerril-García, Fattel-Facenda, Ortega-López and Arroyo2000) were cultured for 1 week by daily passages in trypticase-yeast extract (TY) medium supplemented with 25 mm glucose (MERCK) [standard glucose concentration in the regular medium TYG; normal glucose (NG)] and 10% heat-inactivated bovine serum (HIBS) after incubating at 37 °C for 20 h. For growing parasites in different glucose concentrations, TY-HIBS medium was either supplemented with 50 mm glucose (high glucose; HG) or not supplemented with extra glucose (GR), containing ⩽1 mm glucose derived from medium components (Miranda-Ozuna et al., Reference Miranda-Ozuna, Hernández-García, Brieba, Benítez-Cardoza, Ortega-López, González-Robles and Arroyo2016). HeLa cells were grown in Dulbecco's Modified Eagle Medium (DMEM) (Gibco Laboratories, Grand Island, NY, USA) supplemented with 10% HIBS for 48 h at 37 °C in a 5% CO2 atmosphere to obtain confluent HeLa cell monolayers (Alvarez-Sánchez et al., Reference Alvarez-Sánchez, Solano-González, Yañez-Gómez and Arroyo2007).
Preparation of protein extracts and gel electrophoresis separation by sodium dodecyl sulfate-polyacrylamide gel electrophoresis (SDS-PAGE)
Total protein extracts (TPE) were obtained from parasites (2 × 10⁷) grown under both glucose (HG and GR) conditions by 10% trichloroacetic acid (TCA) precipitation at 4 °C overnight (ON) and analysed by SDS-PAGE on 12% polyacrylamide gels. Similarly, protease-resistant extracts (PRE) were obtained from parasites (2 × 10⁷) grown under both glucose conditions without protease inhibitors, which leaves the proteolytic activity intact for detection. Briefly, parasites suspended in PBS pH 8 were lysed with 0.5% sodium deoxycholate (DOC) for 20 min at 4 °C, centrifuged at 16 000 × g for 30 min at 4 °C, and analysed by SDS-PAGE on 12% polyacrylamide gels. The proteolytic activity from PRE or DMEM-TYG medium (20 µL) obtained after 60 min parasite–HeLa cell interaction was analysed by substrate SDS-PAGE on 12% polyacrylamide gels co-polymerized with 0.2% gelatin (Bio-Rad Laboratories, Hercules, CA, USA). Proteinases were renatured with 2.5% Triton X-100 and activated with 100 mm sodium acetate buffer, pH 4.5, containing 0.1% β-mercaptoethanol for 12 h or 18 h at 37 °C, respectively, as described by Cárdenas-Guerra et al. (Reference Cárdenas-Guerra, Arroyo, Rosa de Andrade, Benchimol and Ortega-López2013). Gels were Coomassie brilliant blue (CBB) stained to show the proteolytic activity as white bands against a blue background.
Western blot (WB) assays
For WB assays, TPE or PRE from parasites (2 × 10⁷) grown under HG or GR conditions were separated by SDS-PAGE, blotted onto nitrocellulose (NC) membranes (0.2 µm pore size; Bio-Rad), blocked with 10% nonfat dried milk in PBS-Tween 20 [PBS pH 7 with 0.1% Tween 20 (PBS-T20)], and incubated with different primary antibodies (all diluted in PBS-T20): anti-TvCP2r (1:2000 dilution), anti-TvCP3r (1:2000 dilution), anti-TvCP4r (1:1000 dilution), anti-TvCP12r (1:2000 dilution), anti-TvCP39r (1:1000 dilution), anti-TvLEGU-1r (1:500 dilution), anti-Tv-CatDr (1:200 dilution) and anti-TC-2r (1:200 dilution) for 18 h at 4 °C. After incubation for 1 h at 37 °C with a peroxidase-conjugated goat anti-rabbit secondary antibody (1:3000 dilution in PBS-T20 with 5% nonfat dried milk; Bio-Rad), the reactive bands were developed using a chemiluminescence system (SuperSignal West Pico Chemiluminescent Substrate; Thermo Scientific-Pierce). Images were captured with a ChemiDoc XRS System (Bio-Rad) and analysed using the Quantity One software (Bio-Rad). Alpha-enolase protein (TvENO) detected with an anti-TvENOr antibody (1:2000 dilution in PBS-T20) was used as a loading or secretion control, since it is not affected by glucose. Triosephosphate isomerase (TvTIM), detected with an anti-TvTIMr antibody (1:1000 dilution in PBS-T20) was used as a control protein upregulated by glucose (Miranda-Ozuna et al., Reference Miranda-Ozuna, Hernández-García, Brieba, Benítez-Cardoza, Ortega-López, González-Robles and Arroyo2016). These experiments were performed at least two independent times with similar results.
Cytotoxicity assay
Cytotoxicity assays were performed by a colorimetric method as described by Alvarez-Sánchez et al. (Reference Alvarez-Sánchez, Avila-González, Becerril-García, Fattel-Facenda, Ortega-López and Arroyo2000) with some modifications. Briefly, parasites grown under HG or GR conditions were suspended in DMEM:TY interaction medium [2:1 (vol/vol)] without HIBS, supplemented with 50 mm glucose (HG) or without glucose (GR), according to the parasite glucose growth condition. Parasites (2 × 10⁵ well−1) were added to confluent HeLa cell monolayers on 96-well microtiter plates (~4 × 10⁴ cells well−1) at a 5:1 ratio (parasite: HeLa cell) and incubated for 15, 30 and 60 min at 37 °C in a 5% CO2 atmosphere, washed 5× with PBS at RT, and HeLa cell monolayer destruction was assessed using light microscopy and spectrophotometric quantification at 570 nm. The interaction medium after 60 min host–parasite interaction was recovered, centrifuged and the supernatant was analysed by zymography for the presence of trichomonad secreted proteinases. Control parasites in the interaction medium without serum and with or without glucose (TYG:DMEM or TY:DMEM) were monitored for cell viability at the same incubation time of the assay by the trypan blue exclusion method. Parasite viability was maintained between 99 and 98% throughout the assay (up to 60 min) under both interaction media.
For cytotoxicity inhibition experiments, parasites grown under GR conditions were pre-incubated with increasing concentrations (0, 25, 50, 100 and 200 µg mL−1) of an anti-TvCP2r immunoglobulin G (IgGs) (purified by the caprylic acid method, as previously reported; Sánchez-Rodríguez et al., Reference Sánchez-Rodríguez, Ortega-López, Cárdenas-Guerra, Reséndiz-Cardiel, Chávez-Munguía, Lagunes-Guillen and Arroyo2018) for 30 min at 37 °C, before interaction with confluent HeLa cell monolayers on 96-well microtiter plates for 30 min at 37 °C in a 5% CO2 atmosphere. The same concentrations of preimmune (PI) rabbit serum IgGs were used as a negative control. Untreated parasites were taken as 100% cytotoxicity. The experiment was performed in triplicate at least three independent times, with similar results.
Apoptosis assays
Apoptosis assays (Annexin V-FITC and DNA fragmentation assay) were performed using the same protocol described above for cytotoxicity inhibition experiments. After incubation of T. vaginalis with confluent HeLa cell monolayers on 96-well microtiter plates for 30 min at 37 °C in a 5% CO2 atmosphere and washed 5 times with PBS at room temperature (RT), remnant HeLa cell monolayers were labeled for 15 min using the Annexin V-fluorescein isothiocyanate (FITC) Fluorescence Microscopy Kit (BD Pharmingen), following the manufacturer's recommendations. The FITC fluorescent signal from apoptotic HeLa cells was analysed by epifluorescence microscopy (Nikon, Japan) (Sommer et al., Reference Sommer, Costello, Hayes, Beach, Gilbert, Lucas and Singh2005) and quantitated by a spectrofluorometric analysis (SpectraMax Gemini EM spectrofluorometer).
For DNA fragmentation assay, after incubation of T. vaginalis with confluent HeLa cell monolayers on 6-well microtiter plates (at a 4:1 ratio) for 30 min at 37 °C in a 5% CO2 atmosphere, the supernatant was recovered and centrifuged. The cells attached in the plate and in the pellet were lysed with the lysis buffer (10 mm Tris-HCl pH 7.4, 5 mm EDTA, 0.2% Triton X-100). DNA was pretreated with RNase A (50 µg mL−1) and proteinase K (1 mg mL−1), recovered by phenol-chloroform extraction and precipitated with ethanol and 3 M sodium acetate. Normal-grown parasites and HeLa cells treated with 5% H2O2 for 30 and 60 min at 37 °C in a 5% CO2 atmosphere were used as positive controls. The DNA was analysed by electrophoresis in 2% agarose gels (Abcam Protocols, 2018).
In vitro secretion assays
The in vitro secretion assays were performed as described by Cárdenas-Guerra et al. (Reference Cárdenas-Guerra, Arroyo, Rosa de Andrade, Benchimol and Ortega-López2013) with few modifications. Parasites grown under HG or GR condition were harvested, washed three times with PBS pH 7 and suspended (1 × 10⁶ parasites mL−1) in PBS supplemented with 50 mm glucose or without glucose, according to the parasite growth condition (HG or GR, respectively). The parasites were incubated at 37 °C for 60 min, parasite viability was measured by the trypan blue exclusion method, and the supernatant containing secretion products (SP) was clarified by centrifugation at 900 × g and filtered through a 0.22 µm NC membrane. The proteins were precipitated with 10% TCA at 4 °C ON, separated by SDS-PAGE on 12% polyacrylamide gels, blotted onto NC membrane, and analysed by WB assay to confirm the presence of TvCP2 in the SP. To identify TvCP2 by mass spectrometry (MS) in the in vitro SP, the protein band of interest was manually excised from the CBB-stained gel and a matrix-assisted laser desorption/ionization (MALDI)-time of flight (TOF) MALDI-TOF/TOF MS analysis was performed at the Protein Core Facility, (CINVESTAV-IPN, Unidad Irapuato).
Immunolocalization of TvCP2 by indirect immunofluorescence assays (IFA)
To determine the localization of TvCP2 under different glucose conditions, IFA and confocal microscopy analyses were performed using parasites grown under HG and GR conditions and an anti-TvCP2r antibody. For TvCP2 localization, parasites were fixed with 4% formaldehyde in PBS for 20 min at RT on coverslips, washed two times with 20 mm NH4Cl in PBS (NH4Cl-PBS), two times with 0.2% bovine serum albumin (BSA) in PBS (PBS-BSA) and two times with PBS before permeabilization with 0.02% Triton X-100 in PBS for 5 min at RT. Parasites were then incubated with an anti-TvCP2r antibody or PI serum (both at a 1:100 dilution) for 1 h at RT, washed five times with PBS, and incubated with a FITC-conjugated anti-rabbit secondary antibody (1:100 dilution) (Thermo Scientific-Pierce) for 1 h at RT. For nuclei staining, the coverslips were mounted with Vectashield- 4′,6-diamidino-2-phenylindole (DAPI) mounting solution (Vector Laboratories, Burlingame, CA) and the parasites were analysed by confocal microscopy using a Zeiss microscope and ZEN 2012 software (Carl Zeiss, Germany). For lysosome staining, live parasites (1 × 10⁶ parasites mL−1) grown under both glucose conditions (HG and GR) were incubated with 2 µ m Lysotracker Red DND-99 (Invitrogen) following the manufacturer's instructions for 30 min at 37 °C with gentle shaking. Parasites were then washed, fixed and processed as described for IFA with the anti-TvCP2r antibody.
Immunogold labelling and transmission electron microscopy (TEM)
Parasites grown under HG and GR conditions were fixed with 4% formaldehyde-0.2% glutaraldehyde in serum-free DMEM, dehydrated in ethanol, embedded in LR White resin (London Resin Co. Ltd., Berkshire, UK) and polymerized under UV light at 4 °C for 18 h. Ultrathin sections were mounted on mesh nickel grids, incubated with an anti-TvCP2r primary antibody (1:30 dilution), for 18 h, washed, incubated with a 15 nm gold particle-conjugated goat anti-rabbit IgGs secondary antibody (Ted Pella, Inc., Reeding, CA, USA) for 1 h at RT, and contrasted with uranyl acetate and lead citrate. As a negative control, the secondary antibody alone was used. Ultrathin sections were analysed by TEM in a JEM-1011 transmission electron microscope (JEOL Ltd., Tokyo, Japan).
Scanning electron microscopy (SEM)
After parasite–HeLa cell interaction in TY:DMEM interaction medium without serum for 45 min at 37 °C, samples were fixed in 2.5% glutaraldehyde in cacodylate buffer for 30 min at 37 °C, washed with PBS and milli-Q water, dehydrated in ethanol, critical point-dried with CO2 in a Sandri-780 dryer (Tousimis®) and coated with gold using a JFC-1100 ionizer (JEOL Ltd., Tokyo, Japan). The samples were analysed with a JEOL-JSM 7100 F scanning electron microscope (JEOL Ltd., Tokyo, Japan).
Statistical analysis
Statistically significant differences between means were determined by analysis of variance (ANOVA) using GraphPad Prism 5.0. The data were analysed by one-way ANOVA using the Tukey method comparing all pairs of columns (P < 0.05) for Figs 1, 2 and 5. The scores showing statistical significance are indicated in the figures with an asterisk. The corresponding P values are indicated in the figure legends.
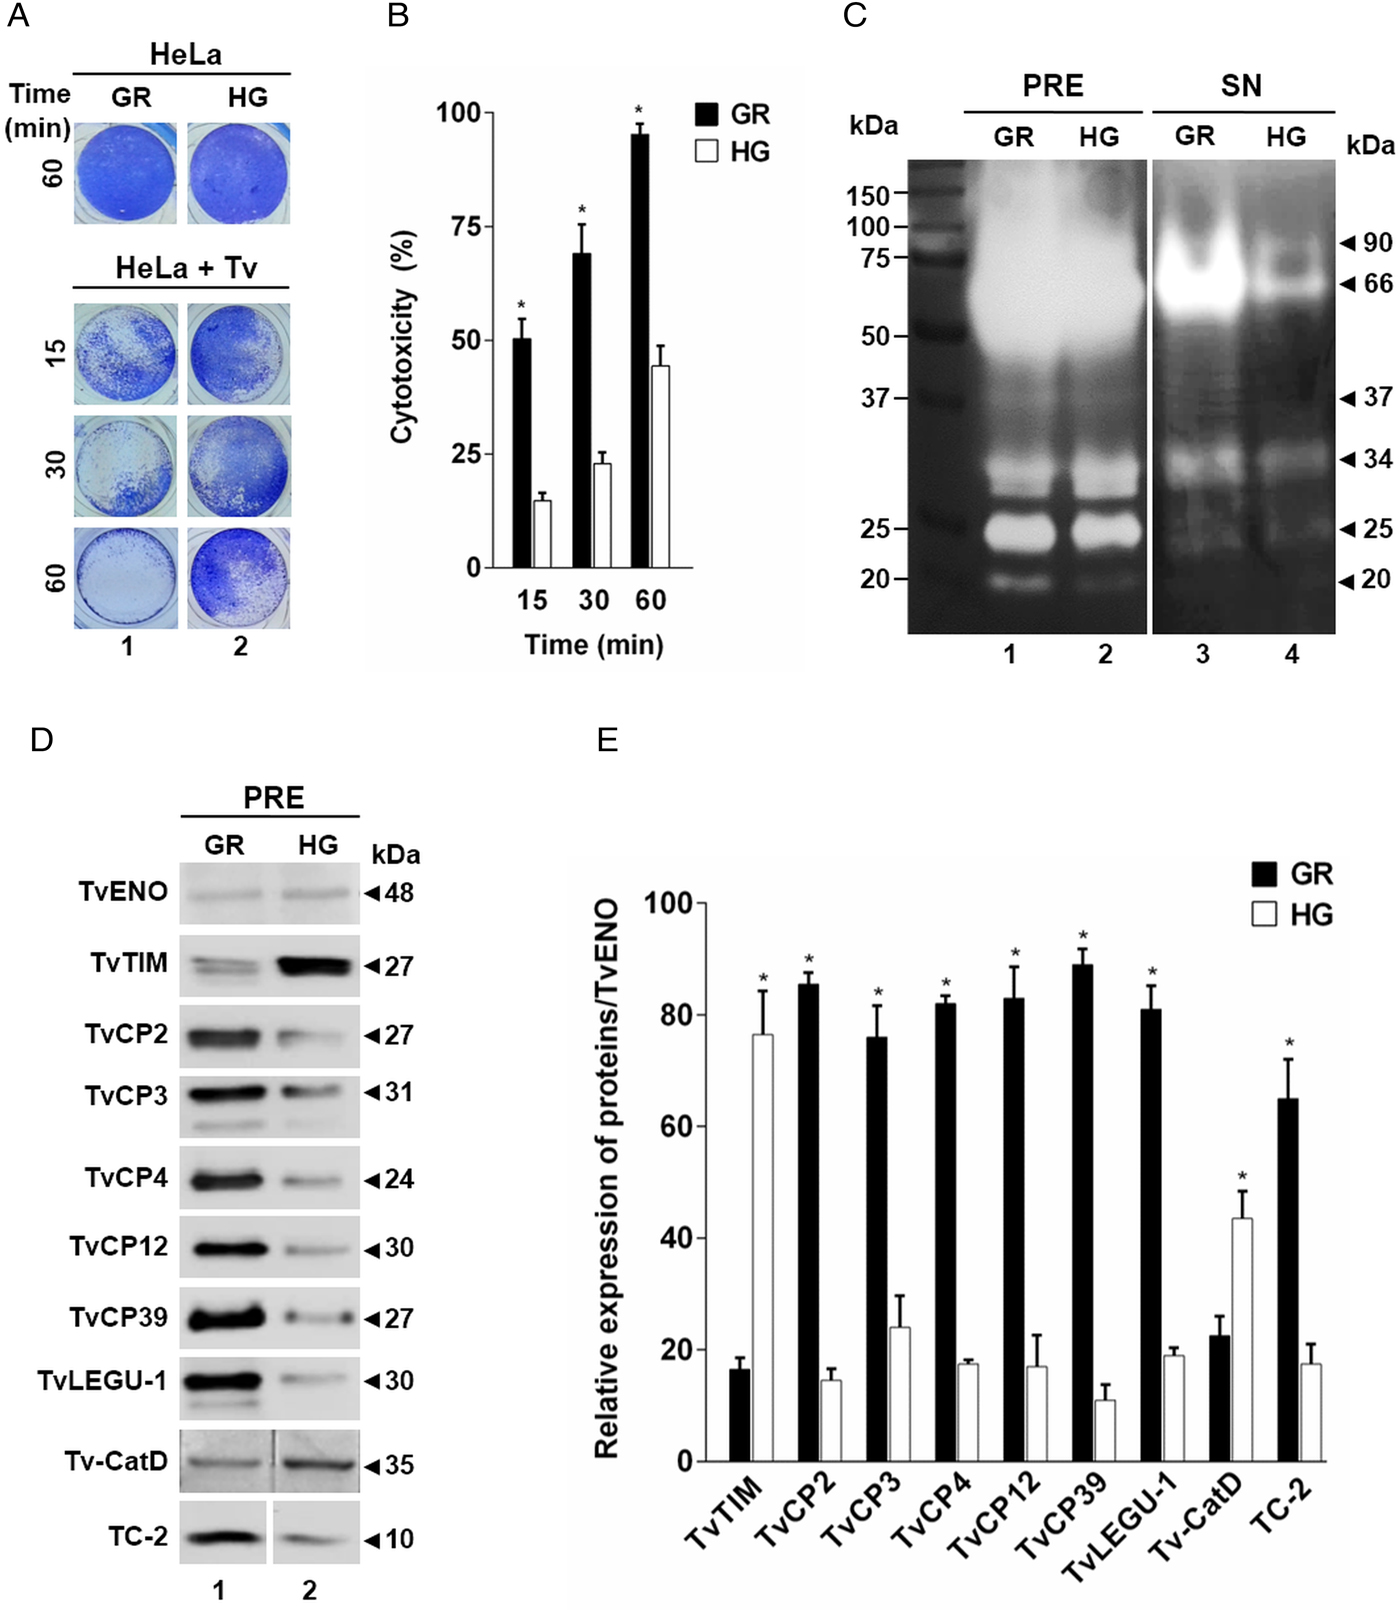
Effect of glucose on the cytotoxicity levels, proteolytic activity and amount of different proteins of Trichomonas vaginalis. (A) Cytotoxicity assays to show HeLa cell monolayers integrity by staining with crystal violet dye, after 15, 30 and 60 min interaction with T. vaginalis under glucose-restricted (GR) (Lane 1) or high glucose (HG) (lane 2) conditions. HeLa cell monolayers incubated 60 min under both GR and HG conditions, but without T. vaginalis were used as 100% monolayer integrity controls. (B) Percentage of cytotoxicity levels on HeLa cells induced by T. vaginalis at different times (15, 30 and 60 min), under GR (black bars) or HG (white bars) conditions determined by spectrophotometric analysis of the eluted dye from HeLa cell monolayers. (C) Zymogram of proteinase-resistant extracts (PRE) (lanes 1 and 2) or supernatants (SN) (lanes 3 and 4) obtained after interaction of HeLa cell monolayers with parasites grown under GR (lanes 1 and 3) or HG (lanes 2 and 4) conditions for 60 min at 37 °C and 5% CO2 atmosphere. (D) WB assays of proteinase-resistant extracts (PRE, 35 µg per lane) from parasites grown under GR (lane 1) or HG (lane 2), transferred onto NC membrane and incubated with different primary antibodies against recombinant proteinases of T. vaginalis (TvCP2, TvCP3, TvCP4, TvCP12, TvCP39, TvLEGU-1 and Tv-CatD). An anti-trichocystatin 2 (TC-2r) antibody recognizes a 10-kDa band of an endogenous inhibitor of CPs, TC-2. An anti-enolase (TvENOr) antibody that recognizes a 48-kDa band was used as a control protein (TvENO) not affected by glucose. An anti-triosephosphate isomerase (TvTIMr) antibody that recognizes a 27-kDa band was used as a control protein (TvTIM) for a positive glucose modulation. (E) Densitometric analysis of the bands detected by WB (D) using the Quantity One software (Bio-Rad). The bar graphs show the relative amounts of TvTIM, TvCP2, TvCP3, TvCP4, TvCP12, TvCP39, TvLEGU-1, Tv-CatD and TC-2 proteins normalized to the level of the TvENO protein. For B and E, the error bars indicate the standard deviation (SD) of three and two independent experiments, respectively. The asterisk (*) shows significant differences (P < 0.05) as determined by ANOVA. Arrowheads show the proteolytic activity bands in the zymogram (C) and the molecular weight of protein bands detected by WB in kDa (D).
Glucose-restricted (GR) condition up-regulates the amount and in vitro secretion of TvCP2 by Trichomonas vaginalis. (A) SDS-PAGE and Coomassie brilliant blue (CBB) staining of 12% polyacrylamide gels were performed to assess the total protein extracts (TPE) from parasites grown under GR (lane 1), NG (lane 2) and HG (lane 3) conditions. (B) For WB assays, duplicated gels from the panel (A) transferred onto NC membranes were incubated with different primary antibodies, including an anti-TvCP2r antibody (α-TvCP2r; 1:2000 dilution) that recognized a 27-kDa band corresponding to the native TvCP2 protein. An anti-hexokinase antibody (α-EhHKr; 1:1000 dilution) that recognized a 43-kDa band was used as a control protein (TvHK) for glucose-induced modulation. An anti-enolase (α-TvENOr) antibody that recognized a 48-kDa band was used as a control protein (TvENO) not affected by glucose. A preimmune rabbit serum (PI) (1:1000 dilution) was used as a negative control. (C) Densitometric analysis of the bands detected by WB (B) using the Quantity One software (Bio-Rad). The bar graphs show the relative amount of TvCP2 protein, under the three glucose conditions (GR, NG and HG), normalized to the level of the TvENO protein, which was used as a loading control. The error bars indicate standard deviations (SDs) of three independent experiments. The asterisk (*) show significant differences (P < 0.05), as determined by ANOVA. (D) SDS-PAGE and CBB staining of 12% polyacrylamide gels of proteins present in secretion products (SP) of T. vaginalis, obtained in GR (lane 1) and HG (lane 2), concentrated with 10% TCA precipitation and transferred onto NC membranes for WB assays. The α-EhHKr antibody (1:1000 dilution) was used as a control of a protein (TvHK) that is not secreted under both glucose conditions (GR and HG) (lanes 3 and 4). The α-TvENOr antibody was used as a control of a secreted protein (TvENO) that is not affected by glucose condition (lanes 5 and 6). The α-TvTIMr antibody was used as a control of a secreted protein (TvTIM) induced by glucose (lanes 7 and 8). The α-TvCP4r antibody was used as a control of a secreted protein (TvCP4) downregulated by glucose (lanes 9 and 10). The α-TvCP2r antibody was used to follow the secretion of TvCP2. Arrowheads show the expected protein bands detected by WB.

Results
Effect of glucose on the cytotoxicity levels and the amount and proteolytic activity of T. vaginalis proteinases
To assess the effect of glucose on the cytotoxicity of T. vaginalis, parasites grown under both (GR and HG) glucose conditions were incubated with confluent HeLa cell monolayers and the levels of cellular destruction were determined by a colorimetric method. Interestingly, the optical microscopy (Fig. 1A) and spectrophotometric analyses (Fig. 1B) showed that parasites under GR conditions exhibited the highest levels of monolayers destruction (~95%) compared to parasites under HG conditions (~44%) after 60 min interaction. These differences were significant.
In addition to contact-dependent cytotoxicity, T. vaginalis secretes molecules with a proteolytic activity that could contribute to cellular damage. To confirm this, we performed zymograms of the PRE and supernatants obtained after 60 min of HeLa–Tv interaction under both (GR and HG) glucose conditions (Fig. 1C). Our results showed the presence of four main bands (~90-, ~66-, ~34- and ~25-kDa) with proteolytic activity released after host–parasite interaction under both glucose conditions (Fig. 1C, lanes 3 and 4). However, under GR condition the proteolytic activity bands were more intense, especially the ~66 kDa band, than under HG condition. Zymograms from PRE (Fig. 1C, lanes 1 and 2) under both glucose conditions (GR and HG) were used as controls of the effect of glucose on the total trichomonad proteolytic activity. These results showed that certain CPs are released by T. vaginalis during HeLa–Tv interaction mainly under GR conditions.
To determine the effect of glucose on the amount of proteins related to trichomonal virulence, particularly with cellular damage, PRE from parasites grown under both (GR and HG) glucose conditions were analysed by WB assays using different anti-proteinases antibodies (Fig. 1D). Our results showed an increase in the amount of proteinases TvCP2, TvCP3, TvCP4, TvCP12, TvCP39, TvLEGU-1 and the endogenous inhibitor of CPs, trichocystatin-2 (TC-2), under GR condition (Fig. 1D, lane 1) compared to the reduced amount of Tv-CatD and TvTIM under the same GR condition, because these are two glucose upregulated proteins, used as positive controls of the HG effect (Fig. 1D, lane 2). These differences corroborated by densitometric analysis (Fig. 1E) of the bands detected by WB normalized against the TvENO band, used as a loading control, were significant (P < 0.05) for all the proteins studied.
GR induces expression and secretion of TvCP2 in T. vaginalis.
The cysteine proteinase TvCP2 was previously identified as part of a 30 kDa band (CP30) with proteolytic activity found in in vitro SP of T. vaginalis composed of four CPs (CP2, CP3, CP4 and CPT), negatively regulated by iron and involved in cytotoxicity and apoptosis induction to vaginal epithelial cells (Sommer et al., Reference Sommer, Costello, Hayes, Beach, Gilbert, Lucas and Singh2005; Kummer et al., Reference Kummer, Hayes, Gilbert, Beach, Lucas and Singh2008). In addition, we recently reported that TvCP2 is one of the trichocystatin-3 (TC-3; an endogenous CP inhibitor) targeted CPs (Sánchez-Rodríguez et al., Reference Sánchez-Rodríguez, Ortega-López, Cárdenas-Guerra, Reséndiz-Cardiel, Chávez-Munguía, Lagunes-Guillen and Arroyo2018). Together, these data suggest that TvCP2 could be involved in cytotoxicity. However, TvCP2 has not been characterized yet as an individual CP. Thus, we followed TvCP2 in further experiments to investigate the effect of glucose in this particular CP and its possible role in cytotoxicity.
By WB using PRE from parasites grown under GR and HG conditions and an anti-TvCP2r antibody, we found that the amount of TvCP2 is reduced by glucose (Fig. 1D). To confirm the glucose negative effect, TPE from parasite grown under GR (⩽1 mm), NG (25 mm) and HG (50 mm) conditions were analysed by SDS-PAGE (Fig. 2A) and WB assays using an anti-TvCP2r antibody (Fig. 2B). Our results show the highest amount of the 27-kDa TvCP2 band in parasite proteins from GR condition (Fig. 2B, lane 1) compared with those from NG and HG conditions (Fig. 2B, lanes 2 and 3). These differences corroborated by densitometric analysis of the WB TvCP2 bands normalized against the TvENO band (Fig. 2C) were significant (P < 0.05). WB with an anti-EhHKr antibody, using the same TPE extracts, was performed as a control of a protein positively regulated by glucose, showing an opposite effect to TvCP2 (Fig. 2B). PI rabbit serum was used as a negative control for WB (Fig. 2B). Thus, these data show that the amount of TvCP2 is reduced by glucose.
To determine whether glucose affects the secretion of TvCP2, we performed an in vitro secretion and WB assays (60 min at 37 °C) using parasites grown under GR and HG glucose conditions and an anti-TvCP2r antibody. Parasites showed 95–97% viability at the end of the secretion assay. Figure 2D shows that TvCP2 is secreted under both glucose conditions (Fig. 2D, lanes 11 and 12). The TvCP2 band was more intense in the SP of parasites in the GR (Fig. 2D, lane 11) than in the HG conditions; whereas the control TvENO band showed similar intensity in both glucose condition, suggesting that secretion of TvENO is not affected by glucose levels (Fig. 2D, lanes 5 and 6). In contrast, the TvTIM band showed greater intensity in the HG (Fig. 2D, lanes 8) than in the GR conditions; whereas the TvCP4 band showed greater intensity in the GR (Fig. 2D, lane 9) than in the HG conditions. Both proteins were used as positive controls of secreted proteins under both glucose conditions. As a negative control of secretion, the TvHK was not detected by the specific antibody, as expected (Fig. 2D, lanes 3 and 4). The CBB-stained control gel showed the protein profile of SP of parasites in the GR and HG conditions (Fig. 2D, lanes 1 and 2). The presence of TvCP2 in the in vitro secretion products detected by the anti-TvCP2r antibody (Fig. 2D) was confirmed by MS analysis. Five peptides with identical masses to TvCP2 (TVAG_057000) were identified by MALDI-TOF/TOF MS analysis that represents 22% TvCP2 sequence coverage (Supplementary Fig. S1). Thus, these data show that TvCP2 is part of the released products of live trichomonads promoted by glucose restriction condition.
TvCP2 is localized in the cytoplasm, vesicles and on the surface of T. vaginalis
To assess the cellular localization of TvCP2 in trichomonads grown under different glucose conditions, we performed IFA on formaldehyde-fixed and permeabilized parasites using an anti-TvCP2r antibody. By confocal microscopy, higher fluorescence signal (in green) on cytoplasm (free and in vesicles) and close to the surface of parasites grown under GR (Fig. 3A, panels a–e) than under HG conditions (Fig. 3A, panels f–j) was observed, which was further confirmed by immunogold localization TEM images (Fig. 3B). As a negative control, in parasites incubated with PI serum (Fig. 3A, panels k–o) no green fluorescent was observed, as expected.
The TvCP2 proteinase is localized in cytoplasmic vesicles and on the surface of Trichomonas vaginalis. (A) Nomarsky microscopy and indirect immunofluorescence to detect the cytoplasmic, lysosomal and vesicle localization of TvCP2 in permeabilized parasites grown under GR (a–e) and HG (f–j) conditions. Before fixation, live parasites were incubated for 30 min at 37 °C with LysoTracker red to stain lysosomes. Parasites were then fixed, blocked and incubated with a primary anti-TvCP2r antibody (1:100 dilution) followed by a FITC-conjugated secondary antibody (1:100 dilution). As a negative control, permeabilized parasites grown under GR condition incubated with preimmune (PI) rabbit serum (1:100 dilution) followed by a FITC-conjugated secondary antibody (k–o) were used. The confocal microscopy (Zeiss) images show nuclei labelled with DAPI (in blue), lysosomes (acid vesicles) stained with LysoTracker (in red) and TvCP2 labelled with FITC (in green). The merged images show the low levels of co-localization between TvCP2 and parasite lysosomes (in yellow). Bar size: 10 µm. These experiments were performed two independent times, with similar results. (B) Possible vesicle trafficking routes to the plasma membrane of TvCP2. TEM analysis of immunogold labelling of ultrathin sections of parasites grown under GR (panels a, c and d) and HG (panel b) conditions using a primary α-TvCP2r antibody at 1:30 dilution and a secondary antibody conjugated to 15 nm gold particles. The TEM images show parasites in GR conditions directly incubated with a secondary antibody conjugated to gold particles as a negative control (panel d). In general, TvCP2 gold labelling free in the cytoplasm, in cytoplasmic vesicles (V), vesicles close to the plasma membrane (PM) and on the parasite surface (arrows). N, nucleus. Bar: 1 µm.
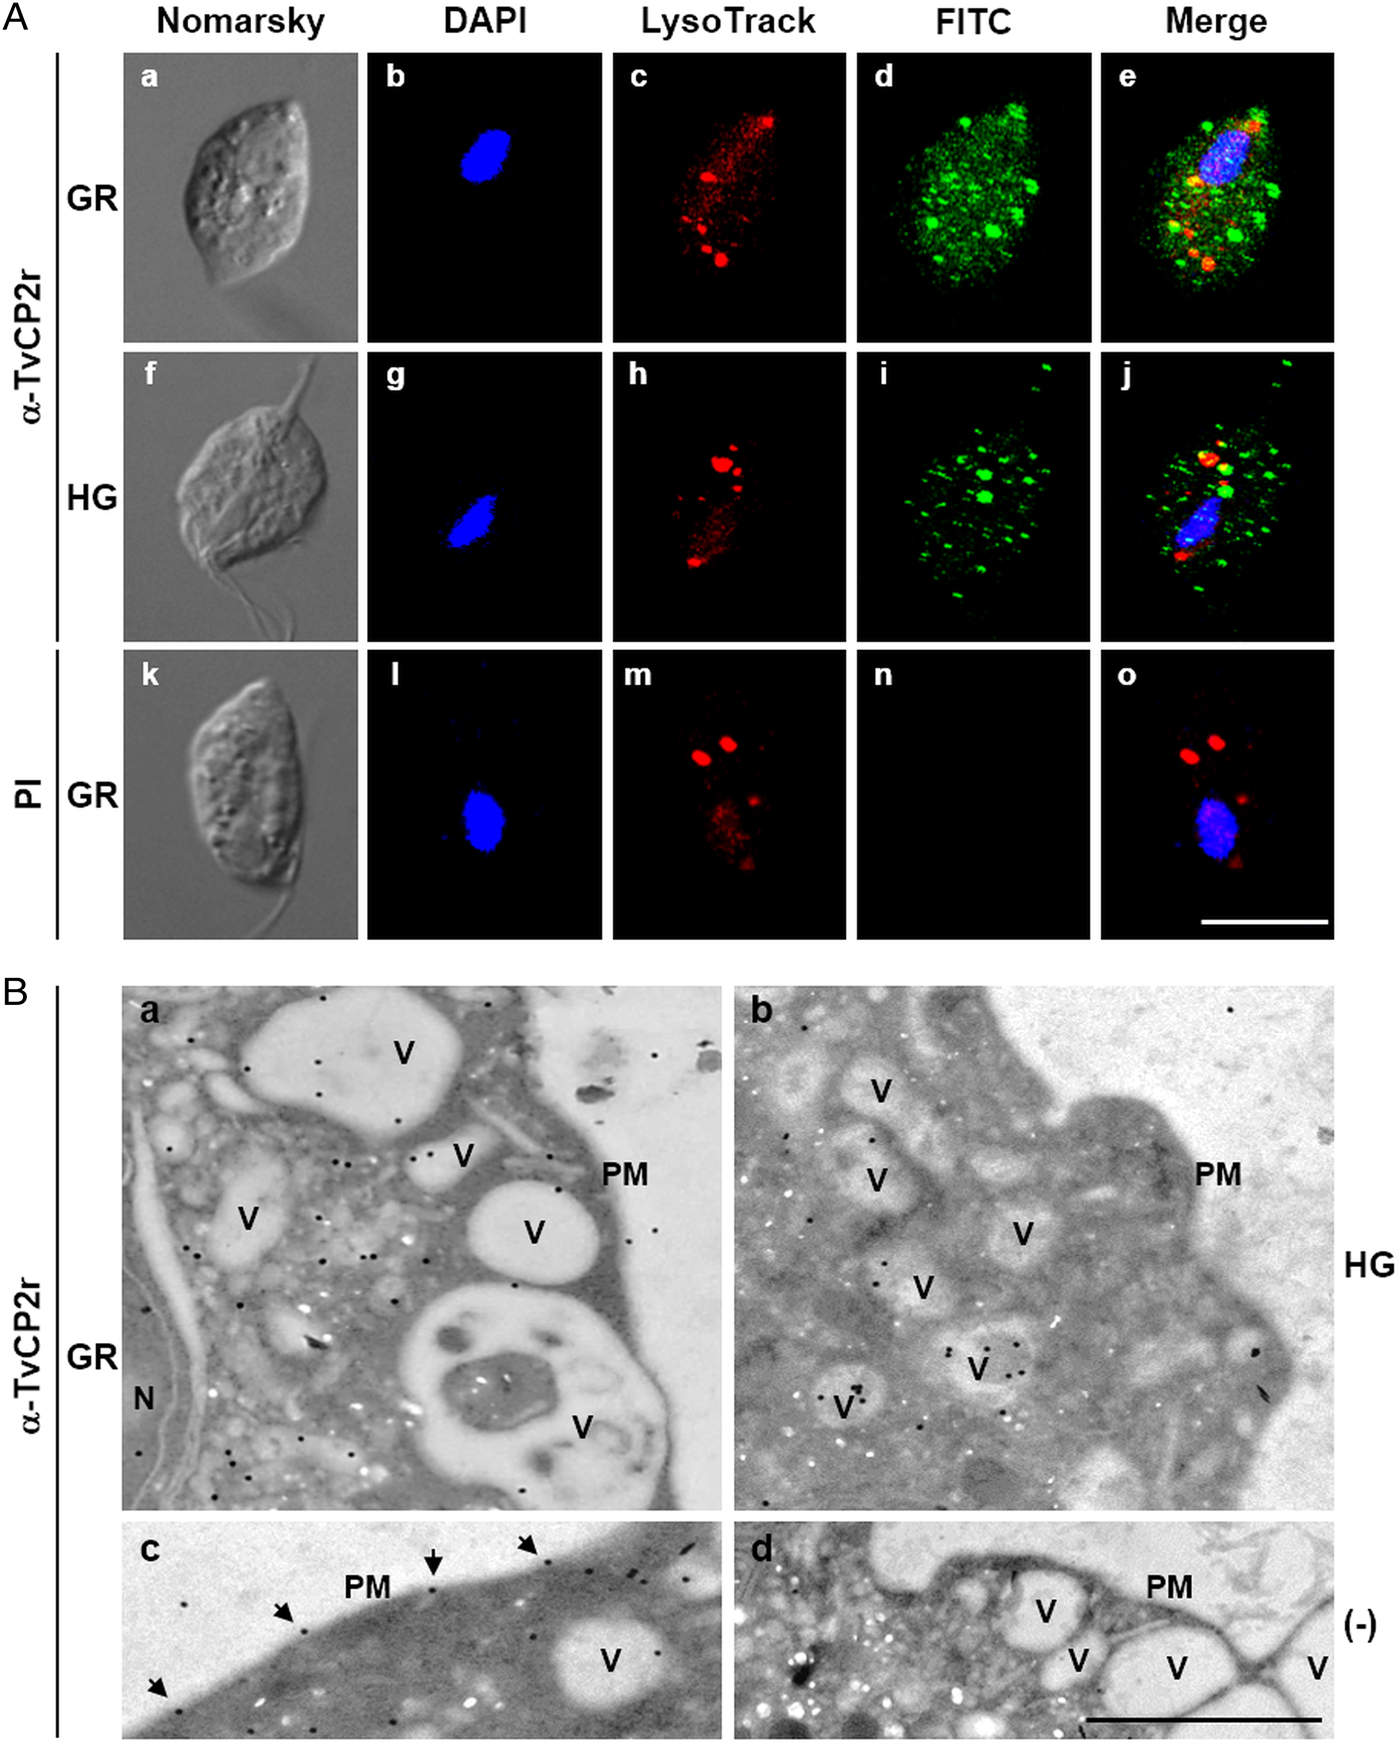
To explore whether TvCP2 may have a typical lysosomal localization, similar to other cathepsin-L CPs, we performed co-localization assays using the anti-TvCP2r antibody and LysoTracker-red DND-99 as a lysosomal marker. Figure 3A shows (in the merged images) very low levels of TvCP2/lysosomal co-localization in parasites under both glucose conditions (Fig. 3A, panels e and j; in yellow) with a Pearson's correlation coefficient of 0.43 for GR and 0.27 for HG conditions. These data suggest that TvCP2 is not a lysosomal CP. Thus, the TvCP2-positive vesicles (in green) could correspond to secretory vesicles (Fig. 3A), mainly under GR conditions.
TEM and immunogold localization assays of parasites grown under both glucose conditions confirmed the subcellular localization of TvCP2. Parasites under GR condition showed localization in the cytoplasm (62%), inside vesicles with different sizes (30%), or on the plasma membrane (6%) (Fig. 3B, panels a and c). Similarly, in trichomonads under HG condition, TvCP2 showed cytoplasmic localization (33%), inside vesicles (54%), or on the plasma membrane (4%) (Fig. 3B, panel b). Interestingly, in parasites under GR condition, TvCP2 was also localized in electron-lucent vesicles close to the plasma membrane (Fig. 3B, panel a) that could correspond to putative secretory vesicles. Moreover, the detection of the gold label on the parasite membrane confirms the surface localization of TvCP2 mainly under GR condition (Fig. 3B, panel c, black arrowheads). The secondary antibody used as a negative control did not show any gold labelling, as expected (Fig. 3B, panel d).
TvCP2 plays a key role in the trichomonal cytotoxicity through apoptosis induction in HeLa cells.
Our results showed that GR increases the cytotoxicity levels of T. vaginalis to HeLa cell monolayers (Fig. 1). In addition, GR increases the amount and promotes surface localization and secretion of TvCP2 (Figs 2 and 3), suggesting a possible role of TvCP2 in the trichomonal cytotoxicity modulated by glucose starvation. To explore this hypothesis, we assessed the protective effect of an anti-TvCP2r antibody against trichomonal cytotoxicity. We first check by SEM the type of cellular damage inflicted by T. vaginalis grown under GR conditions to HeLa cell monolayers during the parasite:host interaction (Fig. 4). Figure 4A shows the morphology of control HeLa cells monolayer and the integrity of the HeLa cells surface with microvilli (zoomed image). The morphology of a control parasite grown in the GR condition is also shown (Fig. 4B). Figure 4C–F show the HeLa cells drastic morphological changes due to the interaction with T. vaginalis. Parasites firmly adhered to cells conserved the ovoid shape (Tv), whereas the cells in contact with parasites presented blebs and long stress fibres, both markers of cell stress and apoptosis induction (Fig. 4C and D). Besides, HeLa cells with or without direct contact with parasites also presented rupture of the cell membrane (Fig. 4E and F, black arrowhead). Rounded HeLa cells in contact with parasite flagella were also observed as another type of damage inflicted by trichomonads (Fig. 4F, asterisk). These results show that the interaction between HeLa cells and GR-parasites induced severe cellular damage that could be related to apoptosis induction.
SEM observation of a HeLa cells monolayer interaction with Trichomonas vaginalis grown in GR condition. (A) Control HeLa cells monolayer with a zoom of their surface (white frame). (B) Control T. vaginalis (Tv), keeps an ovoid shape with free flagella. (C) Interaction of HeLa cells (H) monolayer and T. vaginalis, the blebbing cells and stress fibres are observed during the interaction. (D) Higher magnification of the blebbing cell during the interaction (framed area in C). (E) Disruption on the HeLa cell surface during the interaction (black arrowhead). (F) A parasite over a HeLa cell (H) while flagella interact with another HeLa cell that is rounded (asterisk), disruption on HeLa cell surface (arrowheads).

TvCP2 participates in the cellular damage towards HeLa cells due to apoptosis induction. (A) Cytotoxicity inhibition assay performed with 2 × 10⁵ live parasites grown under GR condition and preincubated with increasing concentrations (0–200 µg mL−1) of anti-TvCP2r or PI serum purified IgGs followed by incubation with HeLa cell monolayers (4 × 10⁴ cells well−1) at 5:1 ratio. HeLa cell monolayers without parasites were used as a negative control. HeLa cell monolayers with parasites grown under GR without antibody treatment were used as a positive control (+) and considered as 100% cytotoxicity levels. (B) Apoptosis inhibition assay was performed similarly to the cytotoxicity inhibition assay. After incubation with live parasites, cell monolayers were incubated with FITC-conjugated Annexin V. Annexin V fluorescence signal (in green) was quantified using a SpectraMax Gemini EM spectrofluorometer. Each point in the bar is the mean of the percentage of cell monolayer destruction or apoptosis induction of representative experiments with triplicate samples. The error bars indicate standard deviations (SDs) of three independent experiments. The Annexin V fluorescence signal of HeLa cell monolayers without parasites but incubated in the interaction media (DMEM:TY) (mock) were used as a negative control (–). HeLa cell monolayers incubated with parasites grown under GR without antibody treatment were used as a positive control (+) and considered as 100% apoptosis induction. The asterisk (*) shows significant differences (P < 0.05), as determined by ANOVA. (C) Annexin-V fluorescence signal was also observed by epifluorescence microscopy (Nikon). In addition to the other assay controls described in (B), HeLa cell monolayers before the host–parasite interaction were used as an extra negative control (–). The green label indicates apoptotic cells accompanied by cellular damage.
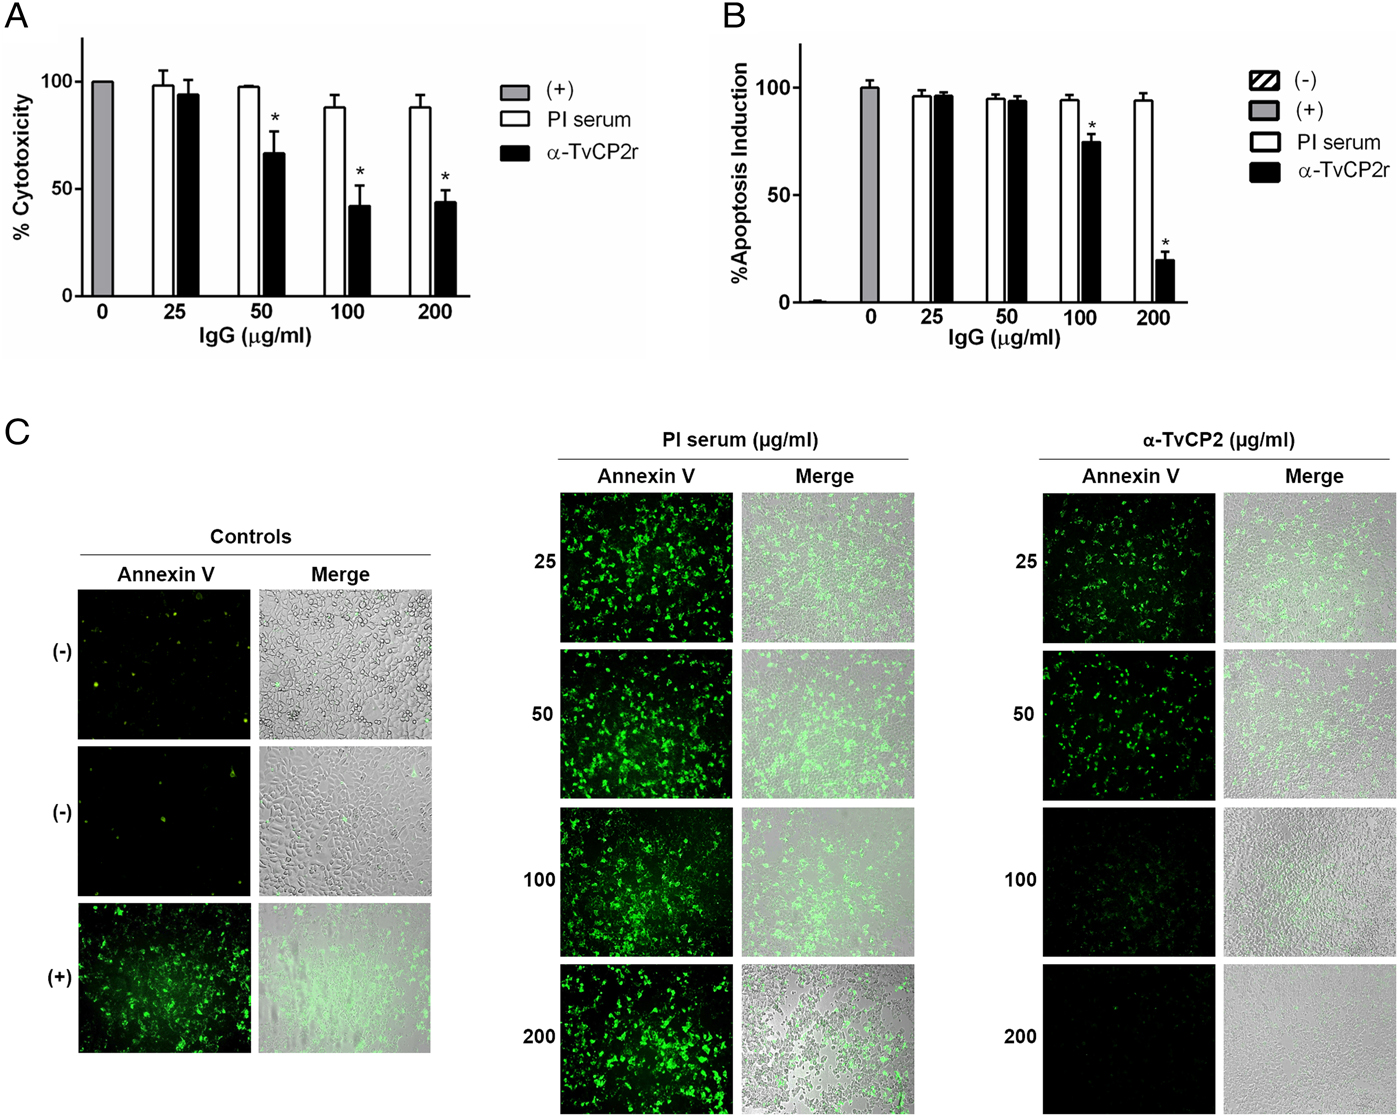
Thus, to evaluate the participation of TvCP2 in this type of cellular damage, live parasites grown under GR condition were pre-incubated with increased concentrations of the anti-TvCP2r IgGs (0–200 µg mL−1) before interaction with HeLa cell monolayers expecting some degree of protection. Figure 5A shows up to ~60% reduction in trichomonal cytotoxicity using 100 and 200 µg mL−1 anti-TvCP2r IgGs compared with the same concentrations of PI serum IgGs used as a negative control, which showed great monolayer destruction (Fig. 5A).
We further hypothesized that cellular damage that leads to cell death of HeLa cell monolayers by live trichomonads is due to apoptosis induction, and TvCP2 is one of the molecules participating in this process. To test this hypothesis, we performed an apoptosis inhibition assay by the Annexin V-FITC method in the presence of increasing concentrations of purified anti-TvCP2r or PI serum IgGs. Figure 5B and C show the apoptosis induction to HeLa cell monolayers by parasites grown under GR condition as a strong Annexin V green label and wide destruction of HeLa cell monolayers, which was taken as 100% apoptosis induction. The damage of HeLa cell monolayer and Annexin V label was reduced in a concentration-dependent manner up to ~80% by the anti-TvCP2r IgGs, but not by the PI serum IgGs used as a negative control (Fig. 5B and C). These differences were significant (Fig. 5B).
We further analysed the HeLa cells damage caused by T. vaginalis through the DNA degradation assays by agarose gel electrophoresis. Figure 6A shows high molecular size bands indicative of the integrity of HeLa cells and trichomonads genomic DNA before the host–parasite interaction used as controls. As a positive control of DNA degradation for both type of cells, we induced apoptosis by treatment with 5% H2O2 for 30 and 60 min at 37 °C (Singh et al., Reference Singh, Sharma and Singh2007) and observed the fragmentation/degradation of both genomic DNAs. As expected, in HeLa cells after H2O2 treatment a DNA laddering with multiple bands was observed; whereas in trichomonads, the H2O2 treatment induced DNA degradation observed as a smear (Fig. 6A, lanes 5–6). Analysis of the genomic DNA after the parasite–host cell interaction showed a massive degradation and the absence of the high molecular size DNA band (Fig. 6B, lane 3) compared with the control DNA bands (Fig. 6B, lanes 1–2). However, a certain degree of protection of the genomic DNA band was observed after the interaction of anti-TvCP2r IgG-pretreated parasites with HeLa cell monolayers (Fig. 6B, lane 4) compared with the interactions with PI serum IgGs-pretreated parasites (Fig. 6B, lane 5) used as a control.
Trichomonas vaginalis induces DNA damage to HeLa cells. (A) DNA degradation assay performed to assess the DNA damage due to T. vaginalis interaction. (A) Lane 1, HeLa cells genomic DNA. Lanes 2 and 3, positive controls of HeLa cell DNA damage induced by 5% H2O2 treatment for 30 and 60 min, respectively. Lane 4, T. vaginalis genomic DNA. Lanes 5 and 6, positive control of trichomonad DNA damage induced by 5% H2O2 treatment for 30 and 60 min, respectively. Arrowheads point to the DNA bands. Asterisk shows the large size genomic DNA band. (B) Inhibition of DNA degradation assay performed with live parasites (4 × 10⁶) grown under GR condition and pre-incubated with 200 µg mL−1 of anti-TvCP2r or PI serum purified IgGs followed by incubation with HeLa cell monolayers (1 × 10⁶ cells well−1) for 30 min (lanes 4 and 5). Genomic DNA from HeLa cell monolayers without parasites and from parasites grown under GR condition were used as controls of intact DNA (lanes 1 and 2, respectively). Genomic DNA obtained from the interaction of HeLa cell monolayers with parasites grown under GR without antibody treatment was used as a positive control of DNA degradation (lane 3). DNA was analysed by electrophoresis in 2% agarose gels. Asterisk shows the presence of large size genomic DNA.
These data confirmed the participation of TvCP2 in the trichomonal cytotoxicity due to apoptosis induction to HeLa cell monolayers, as previously suggested (Sommer et al., Reference Sommer, Costello, Hayes, Beach, Gilbert, Lucas and Singh2005; Kummer et al., Reference Kummer, Hayes, Gilbert, Beach, Lucas and Singh2008).
Discussion
Glucose is the primary carbon and energy source for T. vaginalis. We recently reported that T. vaginalis is exposed to different glucose levels (0.3–36.65 mm) during vaginal infection of women with trichomoniasis (Miranda-Ozuna et al., Reference Miranda-Ozuna, Hernández-García, Brieba, Benítez-Cardoza, Ortega-López, González-Robles and Arroyo2016). Compared to the lowest value of glucose detected in vaginal secretion (0.3 mm) of patients with trichomoniasis, ⩽1 mm glucose, used in in vitro assays as the GR condition, it is representative of the lowest glucose concentration detected during trichomonal infection.
In vitro studies showed that under metabolic stress by GR, T. vaginalis activates several adaptive mechanisms, such as metabolic reprogramming, enhancing antioxidant ability and autophagy as a cell survival strategy (Huang et al., Reference Huang, Chen, Fang, Cheng, Cheng, Chen, Wu, Ku, Chen, Lin and Tang2014, Reference Huang, Ong, Wu, Hsu, Lin, Fang, Cheng, Huang, Chiu and Tang2017). In this work, we focused on studying the effect of GR on the T. vaginalis cytotoxicity, as another cell survival strategy for the acquisition of glucose and nutrients from the host cell.
Here, we report that glucose negatively regulates trichomonal cytotoxicity. Particularly, we observe almost total destruction of HeLa cell monolayers by T. vaginalis under GR conditions, in a contact-dependent manner, suggesting that T. vaginalis activates its cytotoxicity mechanism in response to nutritional stress by glucose. A similar cytotoxic effect induced by GR conditions has been reported in other parasites as Entamoeba histolytica, supporting that glucose has an important role in parasites virulence modulation (Tovy et al., Reference Tovy, Hertz, Siman-Tov, Syan, Faust, Guillen and Ankri2011).
In addition to cell contact, the cytotoxicity of T. vaginalis also involves secreted molecules to the extracellular medium, such as porins, phospholipases and proteinases that contribute to cellular damage (Fiori et al., Reference Fiori, Rappelli, Rocchigiani and Cappuccinelli1993; Lubick and Burgess, Reference Lubick and Burgess2004). Thus, in this work, we explored the effect of glucose on the activity of proteinases released during the interaction of T. vaginalis with HeLa cell monolayers. Zymograms show the presence of at least 4 bands with proteolytic activity in both glucose conditions (GR and HG) released during host–parasite interaction and cellular destruction. Interestingly, the highest proteolytic activity was observed in a 66-kDa band under GR conditions, suggesting that certain proteolytic activity could be linked with the high cytotoxicity levels of T. vaginalis under GR conditions. The CP-dependent cytotoxicity has been related to a 65-kDa (TvCP65) (Alvarez-Sánchez et al., Reference Alvarez-Sánchez, Avila-González, Becerril-García, Fattel-Facenda, Ortega-López and Arroyo2000) and a 39-kDa (TvCP39) (Hernández-Gutiérrez et al., Reference Hernandez-Gutierrez, Ortega-López and Arroyo2003, Reference Hernández-Gutiérrez, Avila-González, Ortega-López, Cruz-Talonia, Gómez-Gutierrez and Arroyo2004; Ramón-Luing et al., Reference Ramón-Luing, Rendón-Gandarilla, Puente-Rivera, Ávila-González and Arroyo2011) proteolytic activities modulated by environmental factors such as iron, zinc, polyamines and other unknown factors that participate in T. vaginalis virulence (Figueroa-Angulo et al., Reference Figueroa-Angulo, Rendón-Gandarilla, Puente-Rivera, Calla-Choque, Cárdenas-Guerra, Ortega-López, Quintas-Granados, Alvarez-Sánchez and Arroyo2012), such as glucose as described in here.
Trichomonas vaginalis exhibits high levels of proteolytic activity, mediated mainly by CPs (Hernandez et al., Reference Hernández, Marcet and Sarracent2014; Arroyo et al., Reference Arroyo, Cárdenas-Guerra, Figueroa-Angulo, Puente-Rivera, Zamudio-Prieto and Ortega-López2015). Some CPs are differentially modulated by iron and play diverse biological roles in trichomonal pathogenesis. In this study, we found that glucose negatively regulates the expression of six CPs: TvCP2, TvCP3, TvCP4, TvCP12, TvCP39 and TvLEGU-1 at the protein level. Interestingly, some of these CPs have been localized on the cell surface of or secreted by T. vaginalis, participating in different steps of the host cellular damage, such as cytoadherence (TvLEGU-1) (Rendón-Gandarilla et al., Reference Rendón-Gandarilla, Ramón-Luing, Ortega-López, Rosa de Andrade, Benchimol and Arroyo2013), haemolysis (TvCP4) (Cárdenas-Guerra et al., Reference Cárdenas-Guerra, Arroyo, Rosa de Andrade, Benchimol and Ortega-López2013), cytotoxicity (TvCP12 and TvCP39) (Hernández-Gutiérrez et al., Reference Hernandez-Gutierrez, Ortega-López and Arroyo2003, Reference Hernández-Gutiérrez, Avila-González, Ortega-López, Cruz-Talonia, Gómez-Gutierrez and Arroyo2004) and apoptosis (the secreted CP30 complex: CP2, CP3, CP4 and CPT) (Kummer et al., Reference Kummer, Hayes, Gilbert, Beach, Lucas and Singh2008; Sommer et al., Reference Sommer, Costello, Hayes, Beach, Gilbert, Lucas and Singh2005). Our results suggest that some of the CPs negatively modulated by glucose could be responsible for the high cytotoxicity levels of T. vaginalis under GR conditions.
We also found that glucose also reduced the amount of one of the endogenous cystatin-like CP inhibitors, TC-2, previously identified in the active degradome of T. vaginalis to be associated with TvCP39 (Ramón-Luing et al., Reference Ramón-Luing, Rendón-Gandarilla, Puente-Rivera, Ávila-González and Arroyo2011; Puente-Rivera et al., Reference Puente-Rivera, Ramón-Luing, Figueroa-Angulo, Ortega-López and Arroyo2014). Their principal function is cellular protection from an exacerbated proteolytic activity, suggesting that overexpression of TC-2 under GR condition could be related with the increase in the CPs amount, proteolytic activity and cytotoxic effect of T. vaginalis toward host cells. In addition to its association with TvCP39, it is possible that the TC-2 inhibitor binds to other CPs as a regulatory mechanism of the endogenous trichomonad CP proteolytic activity under GR conditions.
An opposite effect to the CPs expression was observed for the trichomonad aspartic proteinase Tv-CatD. We found that glucose positively regulates the expression of Tv-CatD at the protein level. The Tv-CatD was recently reported as a proteinase that degrades human haemoglobin (Mancilla-Olea et al., Reference Mancilla-Olea, Ortega-López, Figueroa-Angulo, Avila-González, Cárdenas-Guerra, Miranda-Ozuna, González-Robles, Hernández-García, Sánchez-Ayala and Arroyo2018). In vivo, the erythrocytes are an important source of glucose and haemoglobin for T. vaginalis. We hypothesize that glucose and haemoglobin levels are increased during menstrual flux, positively affecting the expression of Tv-CatD that could be involved in haemolysis.
In vitro studies show that T. vaginalis causes cell detachment followed by cellular destruction as a result of apoptosis induced by secreted CPs of the 30 kDa region (CP2, CP3, CP4 and CPT). Here, we reported that the amount of TvCP2, TvCP3 and TvCP4 increased under GR, a stress condition that promotes the destruction and death of the host cells in up to 30–60 min interaction. Thus, we selected to follow TvCP2 as one of the molecules responsive to glucose, to confirm the cytotoxicity and apoptosis induction under GR condition. First, we used TPE from parasites grown under different glucose condition (GR, NG and HG) to confirm that the amount of TvCP2 and its secretion increased by GR conditions. The negative effect of glucose in cellular damage described in here is similar to the negative influence of iron in cytotoxicity and apoptosis induction (Sommer et al., Reference Sommer, Costello, Hayes, Beach, Gilbert, Lucas and Singh2005; Kummer et al., Reference Kummer, Hayes, Gilbert, Beach, Lucas and Singh2008).
The highest proteolytic activity of T. vaginalis is in acid lysosomes. Therefore, it is expected that cathepsin L-like CPs are localized in this cellular compartment. We investigate the effect of glucose on the lysosomal localization of TvCP2. Our results show that TvCP2 does not have lysosomes as the main localization in trichomonads as other cathepsin-L CPs do. TvCP2 main localization was in different size vesicles close to the plasma membrane, suggesting that TvCP2 was in secretory vesicles. The vesicles localization of TvCP2 was confirmed by TEM microscopy that shows the highest gold particle labelled in parasites grown under GR compared to those under HG conditions. The localization of TvCP2 in secretory vesicles is supported by the in vitro secretion results and consistent with the presence of TvCP2 as part of the CP30 in vitro secreted proteolytic activity (Sommer et al., Reference Sommer, Costello, Hayes, Beach, Gilbert, Lucas and Singh2005).
The parasite–HeLa cell interaction analysed by SEM showed that the apoptosis induction in HeLa cell by parasites in the GR condition is due to the detachment and rounding of HeLa cells and the presence of blebbing cells, a characteristic during the execution phase of apoptosis (Mills et al., Reference Mills, Stone and Pittman1999, Charras, Reference Charras2007). Moreover, we observed the presence of stress fibres and rupture of the cell membrane due to the mechanical stress and cytotoxic effect induced in a short period (30 min) compared with the effect induced by fresh Tv isolates (Midlej and Benchimol, Reference Midlej and Benchimol2010).
The results of cytotoxicity and apoptosis inhibition, using the anti-TvCP2r antibody, confirm that TvCP2 is used by trichomonads to induce cellular destruction, damage to DNA and cell death of the HeLa cell monolayers under GR condition. Our results show a 60 and 80% of cytotoxicity and apoptosis inhibition, respectively, and certain protection of the HeLa cells genomic DNA degradation by the anti-TvCP2r antibody, showing the participation of other trichomonad molecules that contribute to cellular damage, a multifactorial virulence mechanism. Further studies will be necessary to identify and characterize the mechanism of apoptosis induction by TvCP2.
Analysing the events that occur in the apoptosis cascade, we can note that the apoptosis process has 4 stages: (1) Induction, (2) Early stage, (3) Mid-stage, (4) Late stage. The induction stage is divided into 2 pathways such as the intrinsic pathway, mediated by mitochondria in response to internal stimuli such as DNA or plasma membrane damage and the extrinsic pathway, mediated by extracellular death receptors, for example, FasL to CD95 (Elmore, Reference Elmore2007). Our results suggest the activation of the apoptosis pathway during the trichomonads–HeLa cells interaction because we observed HeLa cell plasma membrane asymmetry (Annexin-V fluorescence signal) and DNA damage, and some inhibition of these processes when the parasites were preincubated with the anti-TvCP2r IgGs before the interaction with HeLa cells.
However, we could not analyse the deeper apoptosis pathway such as caspase-3 activation because our assay conditions do not allow analysis of longer interaction times as previously reported (Sommer et al., Reference Sommer, Costello, Hayes, Beach, Gilbert, Lucas and Singh2005; Kummer et al., Reference Kummer, Hayes, Gilbert, Beach, Lucas and Singh2008) due to the high cytotoxicity levels and proteolytic activity of the fresh trichomonad isolate used in this study, properties that were greatly enhanced by glucose restriction studied in here (Miranda-Ozuna et.al., Reference Miranda-Ozuna, Hernández-García, Brieba, Benítez-Cardoza, Ortega-López, González-Robles and Arroyo2016). These particular conditions drove the HeLa cells to rapid cell detachment, lost of the monolayer, cell rounding and blebbing and massive cellular destruction in less than 1 h that appears to be not enough time to detect caspase-3 activation as previously shown for SiHa cells after 4 h (Quan et at., Reference Quan, Kang, Yang, Rhee, Noh, Choi, Cha, Yuk and Lee2017). More experiments will be needed to elucidate the apoptosis process during the interaction between trichomonads and HeLa cells mediated by glucose. Nevertheless, the participation of other trichomonad molecules during the apoptosis cannot be discarded.
Same as glucose, iron also plays an important role in trichomonal cytotoxicity and apoptosis induction (Alvarez-Sánchez et al., Reference Alvarez-Sánchez, Solano-González, Yañez-Gómez and Arroyo2007; Kummer et al., Reference Kummer, Hayes, Gilbert, Beach, Lucas and Singh2008). The parasite responds to iron fluctuations by changing the gene expression of CPs. For example, tvcp4 and tvcp12 mRNAs are upregulated and downregulated by iron, respectively, by a posttranscriptional regulatory mechanism mediated by RNA–protein interactions described for both mRNAs (Solano-Gonzalez et al., Reference Solano-González, Burrola-Barraza, León-Sicairos, Avila-Gónzalez, Gutiérrez-Escolano, Ortega-López and Arroyo2007; Torres-Romero and Arroyo, Reference Torres-Romero and Arroyo2009; Arroyo et al., Reference Arroyo, Cárdenas-Guerra, Figueroa-Angulo, Puente-Rivera, Zamudio-Prieto and Ortega-López2015; Figueroa-Angulo et al., Reference Figueroa-Angulo, Calla-Choque, Mancilla-Olea and Arroyo2015). Based on that, we could hypothesize that a similar mechanism mediated by RNA–protein interactions could also participate in the glucose-related gene expression regulation of trichomonad CPs. However, an unknown mechanism cannot be discarded.
It is also clear from recent data (Huang et al., Reference Huang, Chen, Fang, Cheng, Cheng, Chen, Wu, Ku, Chen, Lin and Tang2014; Miranda-Ozuna et al., Reference Miranda-Ozuna, Hernández-García, Brieba, Benítez-Cardoza, Ortega-López, González-Robles and Arroyo2016; Mancilla-Olea et al., Reference Mancilla-Olea, Ortega-López, Figueroa-Angulo, Avila-González, Cárdenas-Guerra, Miranda-Ozuna, González-Robles, Hernández-García, Sánchez-Ayala and Arroyo2018; Stafkova et al., Reference Stafkova, Rada, Meloni, Zarsky, Smutna, Zimmann, Haranta, Pompach, Hrdy and Tachezy2018) that glucose gene expression regulation is just starting to be unveiled as an attractive new field of research in T. vaginalis. No doubt that the new findings will shed some light in understanding the complex biology that T. vaginalis uses for survival during infection in the highly changing vaginal environment throughout the menstrual cycle.
In summary, our findings demonstrated that GR is another nutritional stress condition that promotes trichomonal cytotoxicity to the host cells, by increasing the amount and proteolytic activity of CPs such as TvCP2, which plays an important role in the apoptosis induction during cellular damage.
Supplementary materials
The supplementary material for this article can be found at https://doi.org/10.1017/S0031182019000209.
Author ORCIDs
Rossana Arroyo, 0000-0002-8193-9700.
Acknowledgments
We would like to thank Carlos Vázquez-Calzada for his help with the confocal microscopy analysis at the Confocal microscopy facility of the DIPM-CINVESTAV-IPN. We also thank QFB Leticia Avila-González for her technical assistance in maintaining parasite cultures, Lizbeth I. Salazar-Villatoro and Anel Lagunes-Guillen for their help with the TEM and SEM sample processing, respectively, and Martha G. Aguilar-Romero for her secretarial assistance. We would also thank Alicia Chagolla for her support with the LC-MS/MS identification in the Proteomics facility at CINVESTAV-Irapuato, Mexico and Daniel Ortega-Arroyo for manuscript editing.
Financial support
This work was partially supported by CINVESTAV-IPN and by the Consejo Nacional de Ciencia y Tecnología (CONACYT) Mexico (RA, grant numbers 162123 and 153093), CONACYT Mexico LARR received a Ph.D. scholarship number 338864 from CONACYT, MSHG received a Ph.D. scholarship number 375264 from CONACYT and SRC received a Ph.D. scholarship number 780847 from CONACYT.
Conflict of interest
None.
Ethical standards
Not applicable.