

Dietary habits and preferences are influenced by demographic, economic and socio-cultural factors, and built, policy and food marketing environments(Reference Swinburn, Sacks and Hall1). Neighbourhood heterogeneity of these attributes manifests as geographic disparities in diet quality and the burden of nutrition-related non-communicable diseases(Reference Swinburn, Sacks and Hall1,Reference Dekker, Rijnks and Strijker2) . Geographic measurements of diets at a fine spatial scale (e.g. city subdivisions) are lacking but needed to identify at-risk communities, mobilise community advocacy for interventions tailored to local needs and evaluate geographically heterogeneous responses to public health policies(Reference Cheadle, Sterling and Schmid3–Reference Bauer, Briss and Goodman5).
Nutrition surveys administering dietary questionnaires are typically designed to measure population diets at the levels of ‘subnational’ geographic unit, such as a province or state. However, they are unable to estimate diets at smaller administrative areas due to limited sample sizes to attain statistically precise estimates(Reference Cheadle, Sterling and Schmid3,Reference Seliske, Norwood and McLaughlin6,7) . The increasing demands for reliable statistics describing health status of small subpopulations, coupled with the increasing non-response and cost of conducting many national surveys, calls for the integration of secondary data sources in population health assessment(7). An emerging data source to capture community food selections is geocoded store-level grocery transaction records that are continuously generated by a geographically representative sample of retail food stores. We previously proposed a geographic indicator of the sales of soda through model-based smoothing of these data(Reference Mamiya, Schmidt and Moodie8). However, the estimated value of the indicator was not intuitively interpretable by practitioners and decision makers, as they represented the value of spatial random effect, which is the estimate of residual (unmeasured) effect, thus framed as ‘residual’ area-level demand of soda not accounted by area-level predictors.
In this research, we developed more interpretable community indicators of food purchasing by generating actual quantities of food purchased in each area through a probabilistic store catchment area analysis combined with store-level transaction data, which results in partitioning and allocation of store-level sales into surrounding areas proportional to store visit probability. The Huff gravity model generates a discrete (area-level) surface of the visit probability for each store as calculated from store size and travel distance from surrounding areas(Reference Huff9). The model has been widely used to convert quantities of store-level sales into surrounding areas for the past four decades among retail management scientists(Reference Joseph, Kuby, Eiselt and Marianov10,Reference Suhara, Bahrami and Bozkaya11) .
Our primary objective was to develop small-area indicators of food purchasing from store-level sales within the Census Metropolitan Area (CMA) of Montreal using the Huff gravity model and to illustrate the use of these indicators in improving the estimation of area-level risk for type 2 diabetes mellitus (T2D) using a model-based small-area estimation of disease burden (disease mapping)(Reference Wakefield, Best and Waller12).
The transaction data we obtained contained data for non-alcoholic beverages and solid food that consists of ultra-processed food (e.g. snacks) and three minimally processed food categories: vegetables, fruits and plain yogurt. As an initial demonstration for our methodology, we developed purchasing indicators for soda (carbonated soft drinks) and yogurt. Among sugar-sweetened beverages that are the largest source of added sugar in population diets, soda is one of the most important sources of total energetic intake in Canada and many economically developing and developed nations and has established associations with both T2D and obesity(Reference Hu13–Reference Malik, Schulze and Hu16). We also developed a separate indicator for diet soda (soda with artificial, low-calorie sweeteners substituting sugars). While its association with T2D is slightly weaker and less investigated than the non-diet soda(Reference Neuenschwander, Ballon and Weber17), we were interested in inspecting its spatial distribution and association with T2D relative to that of soda.
Solid yogurt has been one of the fastest growing food groups in North America(Reference Fernando18) with an important public health consequence: despite some evidence for health benefits(Reference Marette and Picard-Deland19), most yogurt products contain artificially added sugar(Reference Moore, Horti and Fielding20), making yogurt an overlooked source of calories for Canadians, in particular among children who are facing an increasing incidence and regional disparity of T2D(21). This makes yogurt a uniquely polarised food group, classified into two extremes of minimally processed (plain yogurt) and ultra-processed (flavoured) food categories(Reference Monteiro, Cannon and Lawrence22). For this reason, we were interested in developing separating indicators and contrasting the spatial distribution of the two yogurt categories, which are flavoured (sugar-added) yogurt and plain yogurt, the latter containing intrinsic (naturally derived from milk) sugars only. While the other minimally processed food items, fruits and vegetable, have an established or strong and negative association with many non-communicable diseases (most notably cancers and CVD), their associations with T2D – and the quality of evidence – is somewhat lower in comparison with yogurt(Reference Neuenschwander, Ballon and Weber17,Reference Wallace, Bailey and Blumberg23) , we therefore focused on the indicator for yogurt.
Methods
We conducted an ecological, cross-sectional study that developed area-level purchasing indicators for soda and yogurt food categories using store-level sales for the year 2012 within the Montreal CMA (delineation of the CMA is provided in Fig. 1), which contained a population of 3 824 211 in 2011(24). The indicators were subsequently used to estimate spatially high-resolution T2D risk within the CMA for the same year.
Map of 193 neighbourhoods and two excluded neighbourhoods in the Census Metropolitan Area of Montreal, and an illustration of sampled and out-of-sample chain retail supermarkets, pharmacies and supercentres, 2012. Grey squares indicate sampled stores with sales data observed. Empty circles indicate out-of-sample stores, thus missing sales data. The location of points does not reflect exact location of stores, but randomly placed within the neighbourhood boundaries stores belong to. Two dotted areas are the federally registered First Nations communities without census data. These areas were excluded, leaving 193 neighbourhoods with white fill for this study. Black lines represent neighbourhood boundaries. Black fills in the inset map represent water. Census Metropolitan Area is defined as the aggregation of contiguous Canadian census subdivisions that are merged if extensive trips of residents occur. ![]() , Sampled store;
, Sampled store; ![]() , out-of-sample store;
, out-of-sample store; ![]() , Federally Registered First Nation Community (excluded area)
, Federally Registered First Nation Community (excluded area)

Transaction data
Point-of-sales (i.e. store-level) transaction data are collected by several marketing firms that operate internationally. We purchased these data from Nielsen(25), which collects and centralises weekly transactions from a stratified random sample of geocoded chain retail food stores, with the strata defined by store size and store type, namely chain pharmacies, supermarkets and supercentres whose annual store-level revenue was greater than 2 million Canadian dollars. The store types are defined in online supplementary material, Supplemental Appendix S1 and Supplemental Table 1 in a separate file named as SupplementaryMaterial.docx.
There were 1097 chain food stores in the CMA of Montreal in 2012; 125 were sampled by the company to collect transaction data, and the remaining 972 chain stores were not sampled (‘out-of-sample’) stores, thus having unobserved or missing sales. The sampling frame included chain supermarket, pharmacy and supercentre chains; all of which sold soda and diet-soda products. Plain and flavoured yogurt were sold in a subset of 311 stores in Montreal (seventy-two sampled and 239 out-of-sample stores, consisting of all supermarket chains and one supercentre chain) as detailed in online supplementary material, Supplemental Fig. 1 in a separate file. An illustrative map of sampled and out-of-sample stores is shown in Fig. 1. The data are collected in many nations and shared through the company or affiliated academic institutions with the permission of the company. While we had access to transaction records generated by convenience stores, the accuracy of store locations with respect to our spatial unit of interest (neighbourhood, described below) was low for convenience stores, thus leading to misclassification of areas they belong to. We therefore did not include convenience stores in our analysis. In general, the geographic location of convenience stores appears to correlate with that of supermarkets (online supplementary material, Supplemental Fig. 2 a and b), likely reflecting the underlying population density; however, supermarkets had a slightly higher density in the centre of the island of Montreal.
Measure of store-level sales
We extracted transactions of food products belonging to the soda and yogurt categories. We did not have access to a comprehensive database recording nutritional composition of all food items sold in the study region, which would allow objective classification of food items by the presence of artificially added free sugar by manufacturers. We therefore separated diet soda and plain yogurt according to terms suggestive of these products (online supplementary material, Supplemental Appendix S2) and converted the quantity of sales into the Food and Drug Administration standardised serving (240 ml for beverages, 150 g for yogurt). Finally, we calculated the average store-level sales of the four food categories in 2012 by aggregating store-week sales of individual food items, see online supplementary material, Supplemental Appendix S3.
Spatial unit of analysis
Area-level food purchasing indicators were defined at the level of a small urban unit, Montreal neighbourhoods (193 areas, shown in Fig. 1), which were formed by merging contiguous Canadian census tracts to maintain the homogeneity of socio-demographic and economic attributes of residents within each neighbourhood(Reference Ross, Tremblay and Graham26). The median number of residents per neighbourhood was 18 229 (interquartile range: 11 752–25 517).
Neighbourhood-level diabetes prevalence
As described previously(Reference Mamiya, Schmidt and Moodie8,Reference Clottey, Mo and LeBrun27) , we defined T2D cases as residents receiving at least one hospital diagnostic code (International Classification of Diseases version 10) of T2D or at least two diagnoses of T2D in the physician claims database (International Classification of Diseases version 9) within a 2-year period. The numbers of cases and non-cases were determined from the provincial universal health insurance registry, the Régie de l’assurance maladie du Québec. After excluding individuals under the age of 2 or having gestational diabetes, prevalent cases and non-cases were linked to residential neighbourhoods within the CMA (n 193) by postal codes.
Statistical analysis
The analysis followed three steps. First, because most stores had missing sales (i.e. being out-of-sample stores), we predicted store-level sales for the four food categories among out-of-sample stores using a hierarchical Bayesian spatial model (Fig. 2a and b). In the second step, the predicted sales from stores were partitioned and allocated to surrounding neighbourhoods based on weights. The weights represent shopping flow, or visit probabilities, from each neighbourhood to food outlets (Fig. 2c) as calculated by the Huff gravity model. Each neighbourhood therefore is attributed a fraction of sales from surrounding stores proportional to the visit probabilities. In the third step, we illustrated the example utility of our small-area indicators as ecological covariates to improve the fit of a disease mapping model that estimates neighbourhood-level risk of T2D.
Illustration of analytical approach to generate area-level indicator of purchasing from store-level sales data. Panel (a) illustrates hypothetical geographic location of sampled (squares with black fill) and out-of-sample stores (empty circles), the latter missing sales records. Panel (b) illustrates out-of-sample stores with predicted distribution of sales (dark fill in circles) as well as the sampled stores with observed sales. Panel (c) illustrates the neighbourhood-level store visit probabilities for a hypothetical store (star symbol) as generated by the Huff gravity model, which represent a probabilistic catchment zone of the store in the form of discrete (area-level) surface of store visit probabilities. The product of these area-level visit probabilities and population size in neighbourhood represents weights to split and allocate predictive distribution of sales (for out-of-sample stores) or observed sales (for sampled stores) into surrounding areas, with the quantity of store-level sales fixed. Note that there are as many probability maps as the number of other stores that are not displayed in this map. Solid lines represent boundaries of Montreal neighbourhood

Step 1: Sales prediction model
The hierarchical Bayesian model to predict sales for the out-of-sample stores as a function of store- and area-level predictors of sales was described previously(Reference Mamiya, Schmidt and Moodie8). Specifically, the store-level sales of a given food category ${Q_{ij}}$
at store j located in neighbourhood i in 2012 were natural log-transformed to follow a normal distribution. A subset of the sales vector
${Q_{ij}}$
at store j located in neighbourhood i in 2012 were natural log-transformed to follow a normal distribution. A subset of the sales vector ${Q_i}$
had missing values to be predicted for out-of-sample stores and naturally treated as parameters to estimate following the Bayesian paradigm. The mean of
${Q_i}$
had missing values to be predicted for out-of-sample stores and naturally treated as parameters to estimate following the Bayesian paradigm. The mean of ${Q_{ij}}$
, denoted as
${Q_{ij}}$
, denoted as ${\mu _{ij}}$
, was specified as
${\mu _{ij}}$
, was specified as
 $${\mu _{ij}} = {\beta _0} + {\phi _{c\left[ j \right]}} + {Z_i}$$
 $${Z_i} = {A_i}\varphi + {S_i},$$
where the component ${\phi _{c\left[ j \right]}}$
is a random effect representing store chain c to which store j belongs. The random effect accounts for chain-level environmental features, such as product pricing, availability (number of food items) and marketing activities such as flyers and display promotions, which tend to synchronise strongly across stores sharing the same chain identification codes.
${\phi _{c\left[ j \right]}}$
is a random effect representing store chain c to which store j belongs. The random effect accounts for chain-level environmental features, such as product pricing, availability (number of food items) and marketing activities such as flyers and display promotions, which tend to synchronise strongly across stores sharing the same chain identification codes.
Neighbourhood-level attributes are captured by ${Z_i}$
. Its component
${Z_i}$
. Its component ${A_i}$
represents a vector of a store’s neighbourhood socio-demographic and economic predictor of sales obtained from the 2011 National Household Survey(28). They are area-level median family income, education as the proportion of individuals over the age of 25 who have post-graduate certificate or diploma, population density as the number of residents per square kilometre, proportion of residents under 18 years old, family size as the mean number of family members and employment rate as the proportion of those in the labour force employed in full- or part-time work. The corresponding coefficients are denoted as
${A_i}$
represents a vector of a store’s neighbourhood socio-demographic and economic predictor of sales obtained from the 2011 National Household Survey(28). They are area-level median family income, education as the proportion of individuals over the age of 25 who have post-graduate certificate or diploma, population density as the number of residents per square kilometre, proportion of residents under 18 years old, family size as the mean number of family members and employment rate as the proportion of those in the labour force employed in full- or part-time work. The corresponding coefficients are denoted as $\varphi $
. An area-level random effect,
$\varphi $
. An area-level random effect, ${S_i}$
, accounted for a spatially correlated latent (residual) effect in sales as described in online supplementary material, Supplemental Appendix S4 along with the specifications of prior probabilities. Codes are provided in in a separate file named as SupplementaryTextFile1_code1.docx.
${S_i}$
, accounted for a spatially correlated latent (residual) effect in sales as described in online supplementary material, Supplemental Appendix S4 along with the specifications of prior probabilities. Codes are provided in in a separate file named as SupplementaryTextFile1_code1.docx.
Step 2: Calculation of area-level purchasing from store-level sales using the Huff gravity model
The Huff model uses travel cost and store size to model the shopping trip of residents from their residential area to stores(Reference Huff9). For a given food category, the probability, ${\pi _{ij}}$
, of residents in neighbourhood
${\pi _{ij}}$
, of residents in neighbourhood $i$
choosing each alternative store j is derived from a discrete store choice model:
$i$
choosing each alternative store j is derived from a discrete store choice model:
 $${\pi _{ij}} = {{a_j^\gamma d_{ij}^{ - \lambda }} \over {\sum\nolimits_{j = 1}^J {a_j^\gamma } d_{ij}^{ - \lambda }}},$$
for $i = \left\{ {1, \cdots ,I} \right\}$
, where I = 193 neighbourhoods and
$i = \left\{ {1, \cdots ,I} \right\}$
, where I = 193 neighbourhoods and $j = \left\{ {1, \cdots ,J} \right\}$
, where J = 1097 stores for sodas and 311 stores for yogurts. The attraction of store,
$j = \left\{ {1, \cdots ,J} \right\}$
, where J = 1097 stores for sodas and 311 stores for yogurts. The attraction of store, ${a_j}$
, is frequently measured by store size (e.g. square footage) with the coefficient
${a_j}$
, is frequently measured by store size (e.g. square footage) with the coefficient ${\rm{\gamma }} \gt 0$
, which we approximated with the number of employees in each store. The variable
${\rm{\gamma }} \gt 0$
, which we approximated with the number of employees in each store. The variable ${d_{ij}}$
represents the travel cost as defined by the shortest street distance in kilometres between the centroid of neighbourhood i and destination store j, with the distance decay coefficient
${d_{ij}}$
represents the travel cost as defined by the shortest street distance in kilometres between the centroid of neighbourhood i and destination store j, with the distance decay coefficient $\lambda \gt 0$
. Our definition of distance between neighbourhoods and stores accounts for travel through the nearest bridge, if stores and neighbourhoods were separated by the body of water. We calculated the shortest network path for each store-neighbourhood pair using Dijkstra’s routing algorithm available in the pgRouting module in the PostGIS geospatial database(29). These store-visit probabilities are identical for the four food categories.
$\lambda \gt 0$
. Our definition of distance between neighbourhoods and stores accounts for travel through the nearest bridge, if stores and neighbourhoods were separated by the body of water. We calculated the shortest network path for each store-neighbourhood pair using Dijkstra’s routing algorithm available in the pgRouting module in the PostGIS geospatial database(29). These store-visit probabilities are identical for the four food categories.
Empirically evaluated and commonly used value to accurately predict store visit in an urban setting is 2·0 for the distance decay (thus power decay of 2·0), and the value of 1·0 for the attraction coefficient(Reference Huff9,Reference Dolega, Pavlis and Singleton30–Reference Huff and McCallum33) . While the coefficients are ideally estimated from a shopping-related local travel data(Reference Nakanishi and Cooper32,Reference Huff and McCallum33) , such data are uncommonly available to date (including our study) due to the cost of administering a large-scale mobility survey(Reference Huff and McCallum33). We therefore adopted the aforementioned values of $\lambda = 2.0$
and
$\lambda = 2.0$
and ${\rm{\gamma }} = 1.0$
. In sensitivity analyses, we varied the values of the attraction and distance decay parameters (online supplementary material, Supplemental Appendix S5).
${\rm{\gamma }} = 1.0$
. In sensitivity analyses, we varied the values of the attraction and distance decay parameters (online supplementary material, Supplemental Appendix S5).
The calculated store-visit probabilities were used to allocate store-level sales to surrounding neighbourhoods. For I = 193 neighbourhoods and J = 1097 (311 stores for yogurts) stores, the visit probability ${\pi _{ij}}$
populates
${\pi _{ij}}$
populates $I \times J$
origin-destination (i.e. neighbourhood-store) matrix, whose rows are multiplied with population size of area i,
$I \times J$
origin-destination (i.e. neighbourhood-store) matrix, whose rows are multiplied with population size of area i, ${C_i}$
:
${C_i}$
:
 $$G = \left[ {\matrix{
{{\pi _{11}}{c_1}} \cr
{{\pi _{21}}{c_2}} \cr
\vdots \cr
{{\pi _{I1}}{c_I}} \cr
} \matrix{
{{\pi _{12}}{c_1}} \cr
{{\pi _{22}}{c_2}} \cr
\vdots \cr
{{\pi _{I2}}{c_I}} \cr
} \matrix{
{{\pi _{13}}{c_1}} \cr
{{\pi _{23}}{c_2}} \cr
\vdots \cr
{{\pi _{I3}}{c_I}} \cr
} \matrix{
{} \cr
{} \cr
\ddots \cr
{} \cr
} \matrix{
{{\pi _{1J}}{c_1}} \cr
{{\pi _{2J}}{c_2}} \cr
\vdots \cr
{{\pi _{IJ}}{c_I}} \cr
} } \right],$$
$$G = \left[ {\matrix{
{{\pi _{11}}{c_1}} \cr
{{\pi _{21}}{c_2}} \cr
\vdots \cr
{{\pi _{I1}}{c_I}} \cr
} \matrix{
{{\pi _{12}}{c_1}} \cr
{{\pi _{22}}{c_2}} \cr
\vdots \cr
{{\pi _{I2}}{c_I}} \cr
} \matrix{
{{\pi _{13}}{c_1}} \cr
{{\pi _{23}}{c_2}} \cr
\vdots \cr
{{\pi _{I3}}{c_I}} \cr
} \matrix{
{} \cr
{} \cr
\ddots \cr
{} \cr
} \matrix{
{{\pi _{1J}}{c_1}} \cr
{{\pi _{2J}}{c_2}} \cr
\vdots \cr
{{\pi _{IJ}}{c_I}} \cr
} } \right],$$
where the measurement of C was provided by the 2011 Canadian Census(28). The column-normalised version of the matrix, ${G^*}$
(i.e. columns sum to 1, a constraint used to ensure that the store-level quantity of sales was not changed), is multiplied with the
${G^*}$
(i.e. columns sum to 1, a constraint used to ensure that the store-level quantity of sales was not changed), is multiplied with the $J \times 1\;$
vector of the exponentiated predictive distribution of store-level sales
$J \times 1\;$
vector of the exponentiated predictive distribution of store-level sales $Q$
to generate the vector of area-level purchasing quantity in serving, X as
$Q$
to generate the vector of area-level purchasing quantity in serving, X as
 $$X =G^\ast exp\left(Q\right). $$
Thus, $\;{X_i} = \;\mathop \sum \limits_{j = 1}^J {\pi _{ij}}{C_i}exp\left( {{Q_j}} \right)$
. In other words,
$\;{X_i} = \;\mathop \sum \limits_{j = 1}^J {\pi _{ij}}{C_i}exp\left( {{Q_j}} \right)$
. In other words, ${X_i}$
represents the predicted distribution of purchasing quantity for neighbourhood i calculated as the weighted sum of the posterior distribution of the vector
${X_i}$
represents the predicted distribution of purchasing quantity for neighbourhood i calculated as the weighted sum of the posterior distribution of the vector $Q$
consisting of predicted sales from J stores, for a given food category. We then divided these quantities by the number of residents in each neighbourhood to generate our indicator of small-area purchasing that represents per-person purchasing quantity in each neighbourhood.
$Q$
consisting of predicted sales from J stores, for a given food category. We then divided these quantities by the number of residents in each neighbourhood to generate our indicator of small-area purchasing that represents per-person purchasing quantity in each neighbourhood.
We note that there were fourteen inhabited small areas (fourteen rows in $G$
matrix above) that contained no supermarket, pharmacy and supercentre in the CMA of Montreal in 2012, even though residents in these areas shop at stores in surrounding areas. The gravity model allowed generating the measure of food purchasing in these areas despite not containing any stores; in other words, the computed sum of these fourteen rows across columns in the matrix is non-zero. This is because these areas received a portion of sales from each store, or
$G$
matrix above) that contained no supermarket, pharmacy and supercentre in the CMA of Montreal in 2012, even though residents in these areas shop at stores in surrounding areas. The gravity model allowed generating the measure of food purchasing in these areas despite not containing any stores; in other words, the computed sum of these fourteen rows across columns in the matrix is non-zero. This is because these areas received a portion of sales from each store, or ${\pi _{ij}}{C_i}exp\left( {{Q_j}} \right)$
, from other neighbourhoods proportional to the value of store visit probability and population size in these areas. These values reflect the shopping-related flow of residents across neighbourhood boundaries. Note that without consideration of mobility across neighbourhoods, the store visit probability will be binary, simplifying to
${\pi _{ij}}{C_i}exp\left( {{Q_j}} \right)$
, from other neighbourhoods proportional to the value of store visit probability and population size in these areas. These values reflect the shopping-related flow of residents across neighbourhood boundaries. Note that without consideration of mobility across neighbourhoods, the store visit probability will be binary, simplifying to ${\pi _{ij}}= 1\;$
if stores j is located in neighbourhood i, and zero otherwise. Therefore, the matrix will have a large number of zeros, unrealistically assuming that residents shop only in store(s) located in their own neighbourhood.
${\pi _{ij}}= 1\;$
if stores j is located in neighbourhood i, and zero otherwise. Therefore, the matrix will have a large number of zeros, unrealistically assuming that residents shop only in store(s) located in their own neighbourhood.
Step 3: Application of the indicators to a model-based small-area estimation of diabetes risk
We added the small-area indicators of purchasing into disease mapping, the primary spatial epidemiologic and geographic surveillance method to estimate areal-level disease risk using a hierarchical Bayesian model(Reference Waller and Carlin34). The above-mentioned prevalent T2D count in the i th area, ${y_i}$
, is assumed to follow a Poisson distribution with mean
${y_i}$
, is assumed to follow a Poisson distribution with mean ${e_k}{\theta _k}$
, where
${e_k}{\theta _k}$
, where ${e_k}$
is the expected number of cases (i.e. offset) calculated by indirect standardisation with age as detailed in online supplementary material, Supplemental Appendix S6. The outcome of interest for disease mapping, the area-specific relative risk,
${e_k}$
is the expected number of cases (i.e. offset) calculated by indirect standardisation with age as detailed in online supplementary material, Supplemental Appendix S6. The outcome of interest for disease mapping, the area-specific relative risk, ${\theta _i}$
represents the deviation of risk from the expected count: an area i has higher occurrence of cases if the posterior summary of
${\theta _i}$
represents the deviation of risk from the expected count: an area i has higher occurrence of cases if the posterior summary of ${\theta _i}$
(e.g. 95 % credible interval (CI)) is greater than 1. The relative risk is modelled as:
${\theta _i}$
(e.g. 95 % credible interval (CI)) is greater than 1. The relative risk is modelled as:
 $$log({\theta _i}) = {\beta _0} + {G_i}\gamma + {X_i}\beta + {b_i},$$
where ${\beta _0}$
is an intercept, and
${\beta _0}$
is an intercept, and ${G_i}$
is a vector of area-level covariates associated with T2D with the corresponding coefficient vector
${G_i}$
is a vector of area-level covariates associated with T2D with the corresponding coefficient vector $\gamma $
. These covariates are education and median family income used in the sale description models and the proportion of immigrants calculated from the 2011 Canadian National Household Survey(35). The covariates also include the availability of recreational facilities encouraging physical exercise (the number of facilities per resident) obtained from the Canada Business Point data, which are annually updated business enumeration data and validated previously for the accuracy of business locations(Reference Daepp and Black36,37) . The availability of recreational facilities was calculated as the number of facilities divided by 1000 residents for each neighbourhood, where recreational facilities were defined based on the Standard Industry Classification codes as previously described(Reference Boone-Heinonen, Diez-Roux and Goff38). The vector of our indicators (neighbourhood-level per-resident purchasing quantity for the four food categories) and their coefficients are
$\gamma $
. These covariates are education and median family income used in the sale description models and the proportion of immigrants calculated from the 2011 Canadian National Household Survey(35). The covariates also include the availability of recreational facilities encouraging physical exercise (the number of facilities per resident) obtained from the Canada Business Point data, which are annually updated business enumeration data and validated previously for the accuracy of business locations(Reference Daepp and Black36,37) . The availability of recreational facilities was calculated as the number of facilities divided by 1000 residents for each neighbourhood, where recreational facilities were defined based on the Standard Industry Classification codes as previously described(Reference Boone-Heinonen, Diez-Roux and Goff38). The vector of our indicators (neighbourhood-level per-resident purchasing quantity for the four food categories) and their coefficients are ${X_i}$
and
${X_i}$
and $\beta $
, respectively. To account for spatial autocorrelation and Poisson overdispersion of the disease risk, we added an area-level random effect
$\beta $
, respectively. To account for spatial autocorrelation and Poisson overdispersion of the disease risk, we added an area-level random effect ${b_i}$
as specified in online supplementary material, Supplemental Appendix S7; codes are also provided (SupplementaryTextFile2_code2.docx).
${b_i}$
as specified in online supplementary material, Supplemental Appendix S7; codes are also provided (SupplementaryTextFile2_code2.docx).
To investigate whether the addition of our indicators improved the disease risk estimation or not, we investigated their posterior 95 % CI. To supplement model selection where we compared goodness of model fit with and without the indicators, we computed fully Bayesian estimates of pointwise predictive density by Watanabe–Akaike information criterion and approximate leave-one-out cross-validation(Reference Vehtari, Gelman and Gabry39,Reference Gelman, Hwang and Vehtari40) . A lower value indicates better model fit. However, evaluating goodness of it using these metrics requires some caution, as the measures of pointwise predictive errors generally do not acknowledge the spatially structured nature of data(Reference Vehtari, Gelman and Gabry39,Reference Gelman, Hwang and Vehtari40) . We also note that the fully Bayesian approach would jointly estimate the posterior distribution of T2D risk (step 3) and indicators (step 1 and 2), therefore propagating the uncertainty of step 1 and 2 to the distribution of the parameters generated in step 3. We did not take this approach and ran step 3 independently, since the indicator generation step, the main goal of this research and downstream applications of these indicators for public health research and practice (e.g. surveillance) will be inherently disjointed. This is because the indicators are likely to be a priori estimated and disseminated by analysts for use by third parties.
We note that both sales prediction and T2D model include income and education as their covariate. Thus, if the store-level sales were strongly or predominantly driven by income and education, our proposed indicators may simply represent the information (i.e. spatial distribution and posterior distribution of regression coefficients) of these two variables, which is redundant and may in fact exhibit collinearity with neighbourhood education and income in the T2D model. Therefore, we performed another sensitivity analysis, where we generated the proposed indicators with modified sales models excluding the neighbourhood-level covariates, including education and income. The estimated posterior mean and 95 % CI of the regression coefficients for income, education and the proposed indicators in the T2D model were then compared with that of the coefficients in the T2D model in the main analysis.
Results
Descriptive analysis
Table 1 summarises the store-level quantity of standardised servings sold for each food category, which shows a wide variation of sales reflecting store size and chain type. The mean and median quantities of soda and flavoured yogurt servings sold were considerably larger than their low-calorie (diet) counterparts. Neighbourhoods of sampled stores were representative of all neighbourhoods in the Montreal CMA with respect to the distribution of neighbourhood characteristics, except population density (Table 2).
Characteristics of store-level transactions by food category for sampled stores in the Census Metropolitan Area of Montreal, 2012*
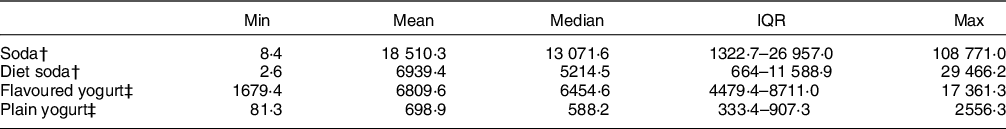
IQR, interquartile range; Max, maximum; Min, minimum.
* These quantities are the average of weekly beverage sales by standard serving.
† Sales of soda represent transactions in supermarkets, supercentres, and pharmacies.
‡ Sakes if yogurts represent transaction in supermarkets and one supercentre chain.
Characteristics of neighbourhoods on which sampled chain stores were located (eighty-three areas) and all neighbourhoods (193 areas) in the Census Metropolitan Area of Montreal, 2011 Canadian National Household Survey

IQR, interquartile range; Max, maximum; Min, minimum; T2D, type 2 diabetes mellitus.
* % of residents with post-graduate diploma or certificate among ages greater than 25.
† The number of recreational facilities was obtained from Canada Business Point data (see main text).
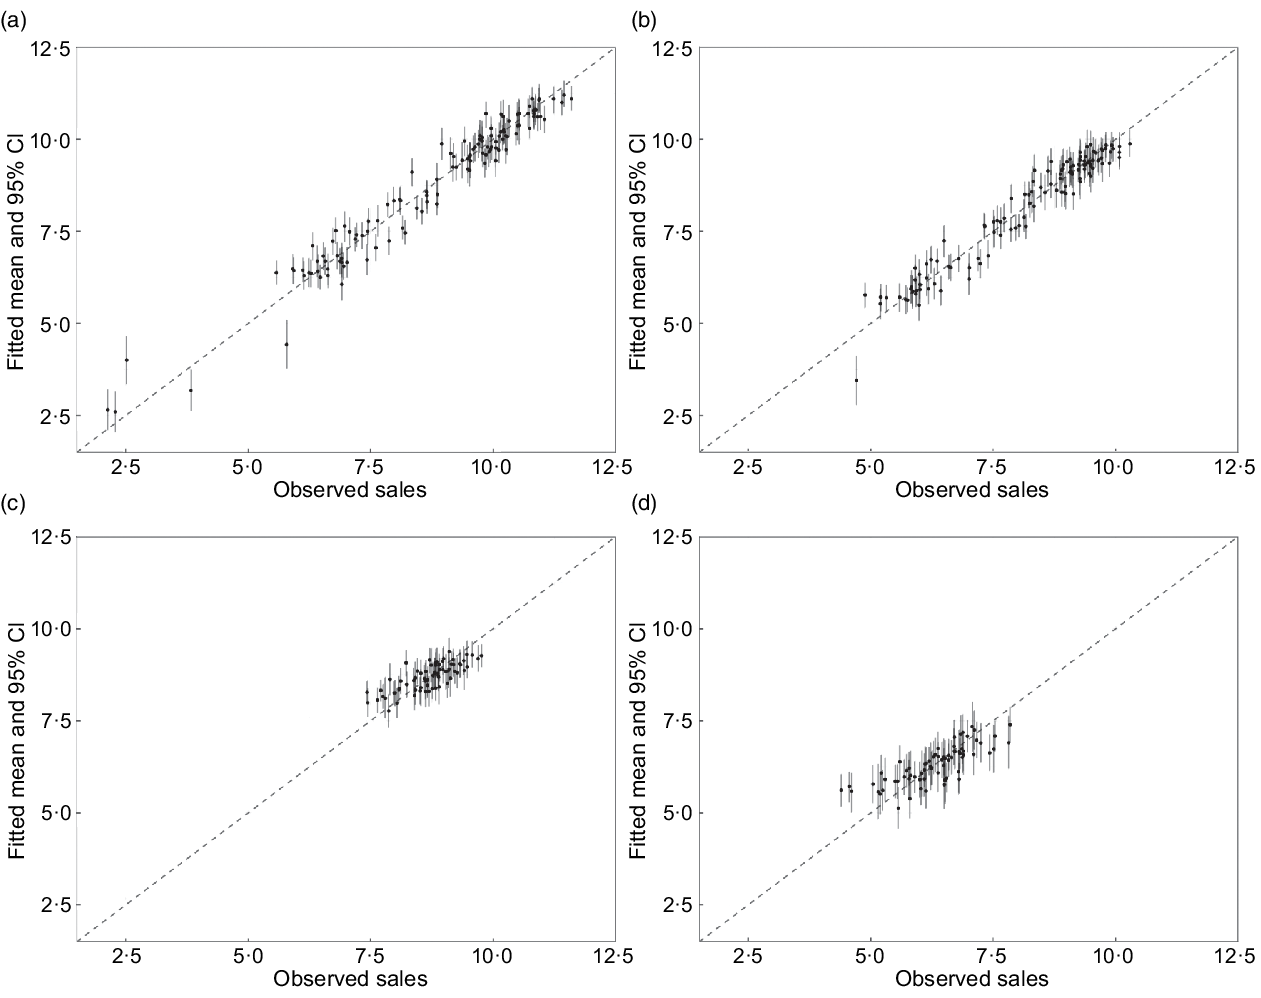
Sales were predicted reasonably accurately: fitted and observed sales of soda and diet soda appeared to correlate well (Fig. 3a and b), although fitted sales of flavoured and plain yogurt (Fig. 3c and d) slightly underestimated sales at larger stores and overestimated sales at smaller stores. Store chain random effects had a prominent association with sales, especially for soda and diet soda in pharmacy chains (Fig. 4), whereas the fixed effect of standardised area-level covariates showed only modest associations with sales, except education (positive association) and income (negative) for the sales of plain yogurt.
Fitted and observed log sales of (a) soda, (b) diet soda, (c) flavoured yogurt and (d) plain yogurt in the sales model. Vertical solid line indicates 95 % posterior credible interval of fitted log sales. Dashed line is reference slope, where y = x
Posterior summary of sales model for each food category. Models for each food category were ran separately. The values of the coefficients represent association with log store-level sales in servings. Store chain indicator represents a retail chain identifier for random effect; unlike a dummy variable in a fixed effect model, there is no baseline category to which the indicator of store chain is compared. Chains 1–5 are pharmacies, chains 6–11 are supermarkets and chains 12 and 13 are supercentres. Fixed effects representing neighbourhood-level predictor of sales were mean cantered and scaled at one standard deviation. The covariate ‘young’ represents the proportion of residents under 18 years old, and the covariate ‘family size’ represents the mean number of family members. The sales models for flavoured and plain yogurts did not include sales in chains 1–5 and 13, as pharmacies and one supercentre chain rarely sold yogurt. ![]() , Soda;
, Soda; ![]() , diet soda;
, diet soda; ![]() , flavoured yogurt;
, flavoured yogurt; ![]() , plain yogurt
, plain yogurt
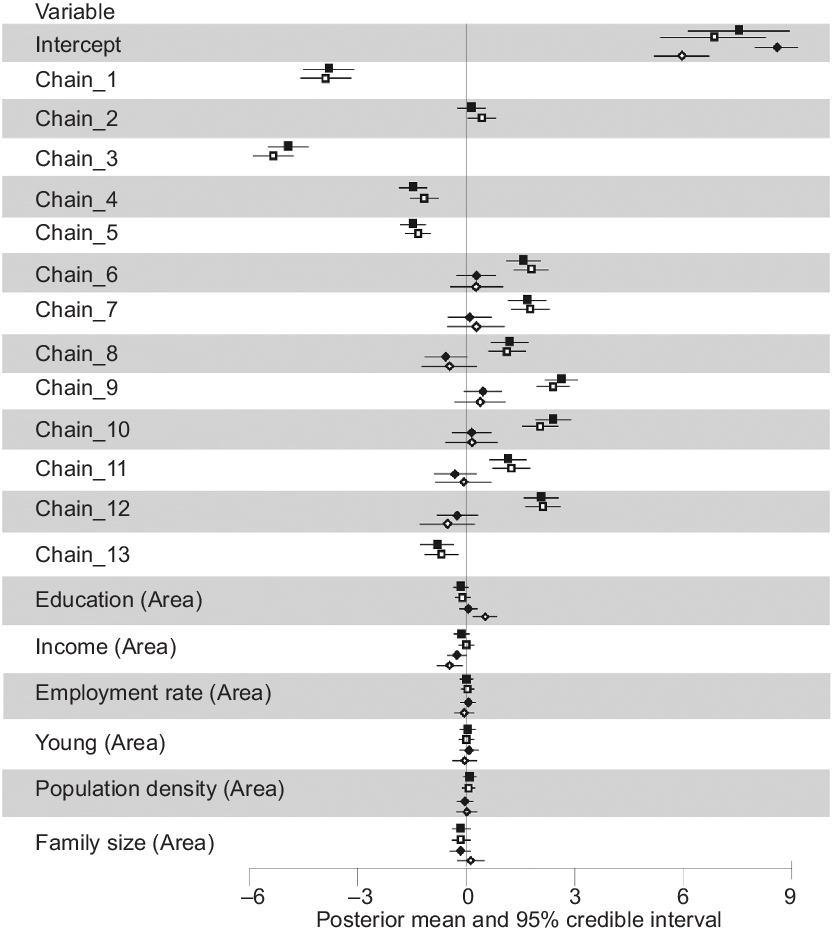
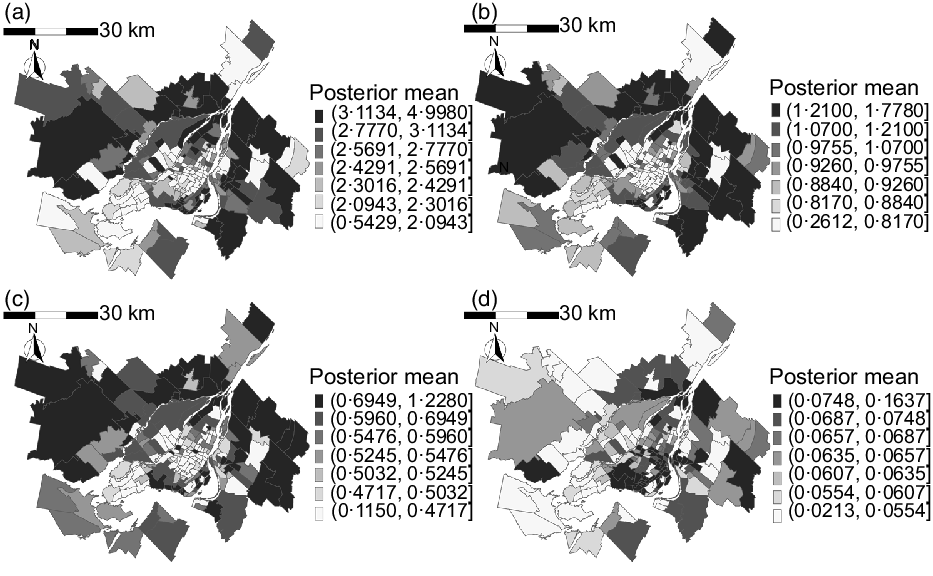
Figure 5 maps the estimated posterior means of our indicators representing neighbourhood-level average weekly purchasing per resident for soda, diet soda, flavoured yogurt and plain yogurt. The spatial trend for plain yogurt was distinct: higher quantities of purchasing were clustered in the centre of the island of Montreal, while for the other food categories, purchasing was more intense in the north of the island and in the North- and Southshore. The corresponding posterior standard deviation of the indicators (Fig. 6) did not show clear spatial trends, but tended to be larger in neighbourhoods with a smaller number of stores (online supplementary material, Supplemental Fig. S3). The sensitivity analyses varying the distance decay coefficient affected spatial smoothing for area-level purchasing of all food categories (online supplementary material, Supplemental Figs. 4–7, b and c), while this smoothing was not prominent for the sensitivity analysis using the smallest value of the attraction coefficient (online supplementary material, Supplemental Figs. 4–7, d). Across all sensitivity analyses, the indicators appear to consistently capture large-scale spatial trends in purchasing, that is, clustering of purchasing quantities in the Island of Montreal for plain yogurt, and the opposite pattern for the other food categories.
Posterior mean of neighbourhood indicator for (a) soda, (b) diet soda, (c) flavoured yogurt and (d) plain yogurt in the Census Metropolitan Area of Montreal, 2012. The greyscale key to the right of each map indicates posterior mean of purchasing quantity per resident in serving. Note that the quantities in the greyscale keys are not standardised across food categories, as the quantities were very different in scale
Posterior standard deviation of neighbourhood indicator for (a) soda, (b) diet soda, (c) flavoured yogurt and (d) plain yogurt in the Census Metropolitan Area of Montreal, 2012. The greyscale keys to the right of each map indicate posterior standard deviation of purchasing quantity per resident in each neighbourhood. Note that the quantities in the greyscale keys are not standardised across food categories, as the quantities were very different in scale
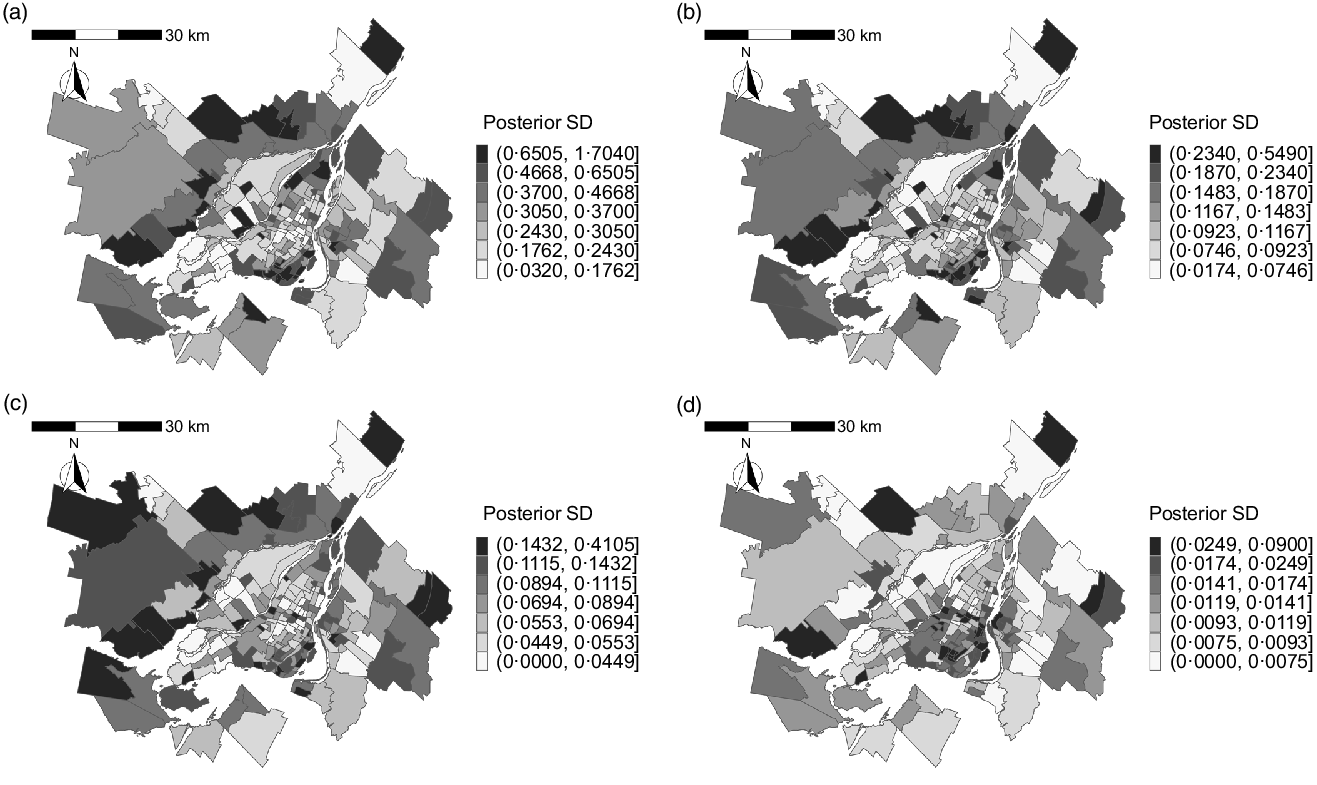
Table 3 shows the posterior mean and 95 % CI of the neighbourhood-level T2D risk associated with neighbourhood-level covariates. The indicator for plain yogurt had a negative association with the relative risk of T2D (posterior mean: 0·93, 95 % CI 0·89, 0·96), while the indicator for flavoured yogurt showed a positive association (1·08, 95 % CI 1·02, 1·14). In contrast, soda did not show a conclusive association (95 % CI 0·97, 1·05). The indicator of diet soda was removed from the model due to its strong correlation with the soda indicator. The fit of the model including our indicators was superior to the model without the indicators (leave-one-out cross-validation = 1874 with the indicators v. 1885 without; Watanabe–Akaike information criterion = 1765 with the indicators v. 1772 without), therefore suggesting a higher accuracy of estimated small-area risk of T2D upon addition of the indicators.
Posterior mean and 95 % credible interval of exponentiated coefficients and model fit of neighbourhood-level (n 193) diabetes risk model, Census Metropolitan Area of Montreal, 2012*
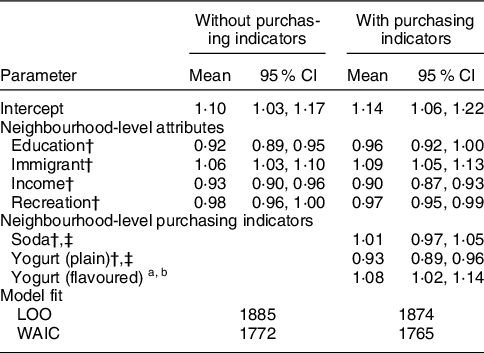
95 % CI, 95 % credible interval; LOO, leave-one-out cross-validation; mean, posterior mean; recreation, recreational facility per resident; WAIC, Watanabe–Akaike information criterion.
* The indicator of diet soda was removed from the model due to its strong correlation with soda indicator.
† Variables were mean cantered and scaled to one standard deviation, and the regression coefficients were exponentiated. The value of coefficients represents neighbourhood-level relative risk of T2D, which is the ratio of the risk at one unit increase of the covariates to the risk at mean value of the covariates.
‡ The value of the indicators represents neighbourhood-level purchasing quantity per resident.
Our sensitivity analysis generating the proposed indicators from varying value of the distance decay and store attraction coefficients also resulted in superior model fit over the model without the indicators (online supplementary material, Supplemental Table 3). However, the association of the indicator for the yogurt categories tended to be attenuated by the greater spatial smoothing of purchasing induced by the lower value of the distance decay coefficient in the Huff model (online supplementary material, Supplemental Fig. 8). Another sensitivity analysis, removing the neighbourhood socio-demographic and economic predictors from the sales models and fitting the T2D models to the resulting purchasing indicators, showed largely similar posterior mean of the purchasing indicators to those generated in the main analysis (online supplementary material, Supplemental Fig. 9 a–c), except for the indicator for plain yogurt that showed a noticeable difference from the main analysis for neighbourhoods with higher values of purchasing quantity (online supplementary material, Supplemental Fig. 9d). The finding led to unsurprising results in the downstream application of these indicators to the T2D model; the posterior summary of the coefficient for income, education and our indicators in the T2D models was very similar to that of coefficients in the main analysis (online supplementary material, Supplemental Table 4).
Discussions
We generated small-area public health indicators of food purchasing from routinely generated store-level grocery sales data to addresses the current lack of measurements to identify neighbourhood heterogeneity and patterning of food selections.
Visually similar spatial distributions of the indicators for soda and diet soda purchasing may reflect non-differential preference for diet soda products. However, the spatial trend of purchasing for plain yogurt was distinct from that of sodas and flavoured (sugar-added) yogurt. Given that store chain random effects in the sales prediction model had a considerably stronger association with sales than neighbourhood attributes such as income and education, the geographic patterns of our purchasing indicators (and therefore community food selection) maybe predominantly driven by the neighbourhood composition of store chains. Because plain yogurt was the only food category whose store-level sales were conclusively (albeit modestly) associated with neighbourhood education and income, it is not surprising that only the indicator of this category resulted in a notable disagreement with the main analysis when the neighbourhood socio-economic attributes from the sales prediction model were removed. However, the largely invariant association of T2D risk with neighbourhood income and education as well as the proposed indicators in this sensitivity analysis suggests that our indicators contain information unique to the neighbourhood socio-economic determinants, rather than simply being their correlates.
The quantity of flavoured yogurt purchased was far higher than that of plain yogurt in all neighbourhoods, a finding that may support yogurt being ranked in the top ten sources of total sugar intake among Canadian children(21). Our indicator for plain yogurt was associated with a decreased areal risk of T2D, while the association was positive for flavoured yogurt. While accumulating evidence suggests the association of frequent yogurt intake with a decreased risk of non-communicable diseases including T2D(Reference Marette and Picard-Deland19), the potential benefit may be limited to plain yogurt, if the consumption of flavoured yogurt contributes to excess energetic intake that is linked to obesity and T2D(Reference Moore, Horti and Fielding20). Our study is ecological and thus does not permit an individual-level epidemiologic link between yogurt and non-communicable diseases. However, the distinct spatial distribution and the direction of the association with T2D across the yogurt categories indicate the importance of monitoring yogurt items (and likely other food products) separately based on sugar composition.
Ongoing measurement of neighbourhood food selection through nutrition surveys is infeasible given the lack of adequate sample sizes in each area, and often many areas have zero survey participants as the spatial unit of analysis becomes smaller in physical size. A potential remedy, increasing sample size by combining multiple years of data collection, is not possible for nutrition surveys which are infrequently conducted. Our study overcomes this sparseness of survey sampling using the predicted store-level aggregated sales combined with gravity model that allocated sales from stores to neighbouring areas. Alternative and previously utilised data source for small-area estimation is large sample loyalty card transaction data that are generated by millions of members; however, the representativeness of such data is limited to the participating members of loyalty club in a single major supermarket chain(Reference Howard Wilsher, Harrison and Yamoah41,Reference Aiello, Schifanella and Quercia42) , potentially excluding subpopulations under an elevated risk of obesity who may preferentially use discount supermarkets(Reference Chaix, Bean and Daniel43). To our knowledge, ours is the first small-area estimation of food selection that can be generated at ongoing basis and reflects purchasing behaviours from multiple chains of supermarkets and other store types. Equally importantly, many studies analysing geographically indexed data fail to address spatial autocorrelation of measurements(Reference Lamb, Thornton and Cerin44), which can overestimate precision and may bias the association of interest. Our sales and T2D risk model accounted for latent spatial effects due to spatially structured unmeasured variables.
An important limitation of our work is the exclusion of convenience stores, a potentially important source of soda sales (yogurts were rarely sold in convenience stores). Supermarkets are reported to be the dominant location of unhealthy food purchasing(Reference Vaughan, Cohen and Ghosh-Dastidar45), and our previous study indicates chain supermarkets sold considerably higher quantity of soda than convenience stores (median sales: 22 026 v. 898 servings, respectively)(Reference Mamiya, Moodie and Ma46). However, convenience stores outnumber supermarket: there were 2732 chain and independent convenience stores and 662 supermarkets in the Metropolitan Montreal in 2012. It is thus possible that the estimated values of the indicators were biased and led to the inconclusive association of the indicator of soda and diet soda with the risk of T2D. While the current analysis better captures food categories not sold in convenience stores, further research and data to obtain accurately geocoded sales of these store are needed. As well, purchasing data capture food selection rather than consumption, although sugar intake measured by household purchasing and consumption data from recall appears to correlate well(Reference Appelhans, French and Tangney47). We also note that our approach to classify food items into sugary and non-sugar (absence of artificially added free sugars) may not be nutritionally objective, since the accuracy of product descriptor to categorise food items in transaction data is not known and some key terms are ambiguous, reflecting nutritional claims by food industries rather than actual sugar content. As an example, food items whose descriptor contains product claim label such as ‘no added sugar’ may still contain sugar, albeit less energy dense than items without these claims, depending on national labelling regulation(Reference Bernstein, Franco-Arellano and Schermel48). Finally, while the law of retail gravitation suggests that travel distance and store size are the key factors influencing store selection, other potential predictors of store visit, such as pricing (discount chain or not) and in-store marketing activities, should also be added to the gravity model in future applications(Reference Krukowski, Sparks and DiCarlo49,50) .
Future research includes scaling-up of food categories beyond soda and yogurt to capture comprehensive purchasing patterns that will better inform programmes to improve diets and estimate disease risk. While we focused on spatial analysis and used disease mapping to illuminate the application of our indicators, our work leads to a window of opportunities to enhance population assessment of food selections, including the incorporation of the temporal dimension to generate weekly or monthly evolution and fluctuation of neighbourhood-level purchasing patterns in response to socio-economical events and interventions. Such work will complement relatively infrequent updates of population health assessment driven by national nutrition surveys, which is, in case of Canada, conducted once every 10 years(Reference Tugault-Lafleur and Black51). As well, the increasing availability of spatially detailed travel data from cell phone records, with appropriate anonymisation of travellers, implies new research opportunities to estimate the distance decay and attraction parameter based on mobility patterns specific to the study population(Reference Chaix52,Reference Chen, Ma and Susilo53) . Such data will also allow researchers to learn distance decay and attraction coefficients specific to store types, as we expect that stores utilised for smaller and shorter shopping excursions, such as pharmacies, have a larger distance decay than supermarkets(Reference Sandhu31). As previously demonstrated, empirical mobility data may also allow learning the variation of distance decay coefficient across areas (e.g. areas with low median household income may show larger distance decay due to lack of access to vehicle for shopping)(Reference Suárez-Vega, Gutiérrez-Acuña and Rodríguez-Díaz54).
Given the increasingly acknowledged local disparities of chronic diseases burdens and neighbourhood effects of health, measurement capacity of public health surveillance and research should encompass small-area heterogeneity of behavioural risk factors including food purchasing(7,Reference Wang and DeSalvo55,Reference Khoury, Armstrong and Bunnell56) . Our analysis applied to ubiquitous grocery sales data provides a foundation to expand the measurement capacity.
Acknowledgements
Acknowledgements: None. Financial support: The results reported herein correspond to specific aims of grant 1516-HQ-000069 to investigator David Buckeridge from the Public Health Agency of Canada. This work was also supported by an Institut de valorisation des données (post-doctoral fellowship awarded to Hiroshi Mamiya), the Canadian Institute for Health Research (Applied Public Health Chairs program, grant number: CPP-137904 awarded to David Buckeridge and Foundation Grant, grant number: CIHR FDN-167267 awarded to Erica Moodie). The funders had no role in the design, analysis and writing of this article. Conflict of interest: None. Authorship: The study was conceived and designed by H.M. AM.S. and E.E.M.M. provided inputs on the statistical analysis and interpretation of the results. Y.M. and D.L.B. provided the data and substantive knowledge to aid study design and interpretation of the results. Data analysis and drafting of manuscript was performed by H.M. All authors reviewed and commented on the manuscript, and they approved the final manuscript. Ethics of human subject participation: This study used secondary data that are aggregated store-level measurements of consumer purchasing, rather than individual consumer-level data. The study therefore did not require a separate written or verbal consent from human subjects.
Supplementary material
To view supplementary material for this article, please visit https://doi.org/10.1017/S1368980021003645


