


1. Introduction
Creativity is a key component of the design process, and it shapes how designers generate, refine and implement ideas (Amabile Reference Amabile1996). Creativity can be characterized by two key processes, divergent and convergent thinking, which together highlight cognitive components of the design process. Guilford (Reference Guilford1956) describes divergent thinking as the process of exploring responses in several directions, whereas convergent thinking represents the process in which individuals reach one best answer. More recently, Cropley (Reference Cropley2006) expanded upon this framework to describe divergent thinking as the “generation of novelty” and convergent thinking as the “evaluation of novelty,” highlighting the intertwined nature of both processes.
Alongside these general applications of divergent and convergent thinking, these processes play a crucial role in design. Designers typically rely on their divergent thinking processes to explore the solution space and generate ideas that are unique and useful (Lee & Ostwald Reference Lee and Ostwald2022). In this process, designers often leverage their domain expertise (Ball et al. Reference Ball, St.B.T. Evans, Dennis and Ormerod1997) and employ concept-generation tools and methods such as heuristics (Yilmaz & Seifert Reference Yilmaz and Seifert2011; Blösch-Paidosh & Shea Reference Blösch-Paidosh and Shea2021) and external stimuli (Goucher-Lambert et al. Reference Goucher-Lambert, Gyory, Kotovsky and Cagan2020). Similarly, designers rely on their convergent thinking skills to narrow down their solution space and make concept selection decisions (Okudan & Tauhid Reference Okudan and Tauhid2008). The convergent thinking processes are often coupled with designers’ domain-specific knowledge and expertise (Boudier et al. Reference Boudier, Sukhov, Netz, Le Masson and Weil2023) and are implemented using concept evaluation and selection tools such as Pugh Charts and Quality Function Deployment (Okudan & Tauhid Reference Okudan and Tauhid2008). Moreover, designers cyclically shift between convergent and divergent thinking, as measured by moments of focused and defocused attention (Goldschmidt Reference Goldschmidt2016).
Due to the distinct outcomes of convergent and divergent thinking, both processes play critical roles in engineering design. Understanding designers’ use of these processes could help uncover approaches to encouraging creativity in design, therefore motivating the study of cognitive mechanisms of divergent and convergent thinking (Zhang, Sjoerds & Hommel Reference Zhang, Sjoerds and Hommel2020). One approach to studying these cognitive aspects is using eye-tracking. Eye tracking is a noninvasive, portable and feasible method that tends to effectively capture pupillometric data across individual factors (Mele & Federici Reference Mele and Federici2012). Eye-tracking methods yield rich and granular data that can highlight cognitive processes that are not always measurable through behavioral and self-reported measures (Cass & Prabhu Reference Cass and Prabhu2025), while expanding insight into how individuals process information, allocate attention and perform on tasks (Bera, Soffer & Parsons Reference Bera, Soffer and Parsons2019).
Moreover, researchers have highlighted the utility of eye-tracking metrics as a proxy for cognitive load (Krejtz et al. Reference Krejtz, Duchowski, Niedzielska, Biele and Krejtz2018; Walter & Bex Reference Walter and Bex2021; Liu et al. Reference Liu, Li, Yeh and Chien2022). Of the various constructs for which eye tracking could be a proxy for, cognitive load plays a particularly important role in design and creativity. Cognitive load theory describes the limited nature of our working memory system, which makes it critical to avoid overstraining these processes in order to maximize performance (Sweller Reference Sweller1988). Researchers find that the cognitive load experienced during concept generation is positively associated with the novelty and fluency of the ideas generated (G. Sun & Yao Reference Sun and Yao2012; Calpin & Menold Reference Calpin and Menold2023). Despite several studies existing on the relationship between cognitive load and creativity, these studies either look at the effects of cognitive load on creative performance or the degree of cognitive load experienced during creative tasks (Hernandez Sibo, Gomez Celis & Liou Reference Hernandez Sibo, Gomez Celis and Liou2024). There remains a research gap concerning the differences in cognitive load between divergent and convergent thinking tasks, and we aim to address this research gap.
Importantly, individuals with Attention-Deficit/Hyperactivity Disorder (ADHD) are disproportionately affected by cognitive overload. ADHD – one of the most common psychiatric disorders (Kooij et al. Reference Kooij, Bijlenga, Salerno, Jaeschke, Bitter, Balázs, Thome, Dom, Kasper, Nunes Filipe, Stes, Mohr, Leppämäki, Casas, Bobes, Mccarthy, Richarte, Kjems Philipsen, Pehlivanidis, Niemela, Styr, Semerci, Bolea-Alamanac, Edvinsson, Baeyens, Wynchank, Sobanski, Philipsen, McNicholas, Caci, Mihailescu, Manor, Dobrescu, Saito, Krause, Fayyad, Ramos-Quiroga, Foeken, Rad, Adamou, Ohlmeier, Fitzgerald, Gill, Lensing, Motavalli Mukaddes, Brudkiewicz, Gustafsson, Tani, Oswald, Carpentier, De Rossi, Delorme, Markovska Simoska, Pallanti, Young, Bejerot, Lehtonen, Kustow, Müller-Sedgwick, Hirvikoski, Pironti, Ginsberg, Félegyházy, Garcia-Portilla and Asherson2019) – is characterized by symptoms such as poor executive functioning (Biederman et al. Reference Biederman, Monuteaux, Doyle, Seidman, Wilens, Ferrero, Morgan and Faraone2004; Martel, Nikolas & Nigg Reference Martel, Nikolas and Nigg2007) and impaired impulse inhibition (Winstanley, Eagle & Robbins Reference Winstanley, Eagle and Robbins2006). Individuals with ADHD are more likely to experience higher levels of cognitive load due to reduced speed and working memory capacity (Weigard & Huang-Pollock Reference Weigard and Huang-Pollock2017). Furthermore, individuals with ADHD are more likely to experience the adverse effects of cognitive load, such as reduced performance (Fisher, Hopp & Weber Reference Fisher, Hopp and Weber2023). In addition to cognitive load, ADHD could influence creativity and is often associated with enhanced divergent thinking and hindered convergent thinking (White & Shah Reference White and Shah2016). Therefore, in a design context, designers with ADHD may be highly effective at tasks that leverage divergent thinking (e.g., concept generation) and may struggle with tasks that rely on convergent thinking (e.g., concept selection). Despite prior research on the impact of ADHD on convergent and divergent thinking, there remains a gap in how ADHD influences eye-tracking metrics – a proxy for cognitive load – during convergent and divergent thinking tasks.
We aim to explore this gap in research and toward this aim, we conducted a causal-comparative study consisting of design-based divergent and convergent thinking tasks. To contextualize our research, we first discuss prior research and present our research questions in Section 2. Next, we present our study design and data collection in Section 3. The analysis of the data and the corresponding results are presented in Section 4, and the implications of these results are discussed in Section 5. We close the paper with the limitations and future directions of our study in Section 6 and offer concluding remarks in Section 7.
2. Related work
Our aim in this research is to investigate the impact of ADHD on eye-tracking metrics during convergent and divergent thinking tasks, and how these metrics compare between the two tasks. We review prior research that informed this research in the rest of this section.
2.1. Divergent and convergent thinking in design and creativity
Divergent thinking enables engineers to devise several unique solutions to a given problem and is often measured by originality (novelty of ideas), fluency (quantity of ideas generated) (Dumas & Dunbar Reference Dumas and Dunbar2014) and flexibility (the breadth of contexts in which ideas can be applied) (Weiss & Wilhelm Reference Weiss and Wilhelm2022). Divergent thinking occurs throughout the design process and ensures that the ideas generated are novel, plentiful and widely applicable. Alternatively, convergent thinking ensures that high-quality ideas are implemented, as ideas are evaluated and selected after generation (Pathan et al. Reference Pathan, Khwaja, Reddy and Kamat2016). Convergent thinking helps ensure that ideas are practical, useful and accessible.
Convergent thinking has been shown to require more focused visual attention than divergent thinking (Maheshwari et al. Reference Maheshwari, Tuladhar, Thargay, Sarmah, Sarmah and Rai2022). These differences may influence the cognitive demands required in effectively performing convergent and divergent thinking tasks. Cognitive load theory highlights the adverse effects of working memory overload on learning and demonstrates the role of our limited processing capacity on cognition (Sweller Reference Sweller1994). Acquiring new information requires the cognitive means to do so, and the “requested memory capacity” cannot exceed the resources available (De Jong Reference De Jong2010). Individuals vary in the capacity of their working memory, but regardless of individual capacities, as individuals are loaded with more information, there are fewer resources available for processing, therefore, reducing efficiency. In the context of convergent thinking, researchers have found that workload capacity and performance are negatively correlated (Shang et al. Reference Shang, Little, Webb, Eidels and Yang2021). These negative effects of cognitive overload become evident within problem solving (Mangaroska et al. Reference Mangaroska, Sharma, Gašević and Giannakos2022), decision-making (Deck & Jahedi Reference Deck and Jahedi2015) and quality of ideas (George & Chen Reference George and Chen2025), all critical components of convergent thinking. Similarly, cognitive overload can also negatively affect divergent thinking by reducing performance in flexibility (Orzechowski, Gruszka & Michalik Reference Orzechowski, Gruszka and Michalik2023) and fluency (Rodet Reference Rodet2022).
As discussed in a recent review by Hernandez Sibo et al. (Reference Hernandez Sibo, Gomez Celis and Liou2024), several researchers have studied the impact of cognitive load on creative thinking; however, the authors find that these findings are often contradictory. More importantly, these studies either study the effects of cognitive load on creative performance or the cognitive load experienced during a task. There remains a research gap comparing the cognitive load experienced between divergent and convergent thinking tasks, and we aim to explore this research gap. Such an examination is important because these tasks often occur together and are rarely performed in isolation. Therefore, designers must balance their performance on convergent and divergent thinking, which, in turn, requires carefully managing their cognitive resources when performing these tasks (Dietrich & Kanso Reference Dietrich and Kanso2010). Before presenting the details of our study, we review prior work on the use of eye tracking to measure design cognition, next.
2.2. Using eye tracking to measure design cognition
Eye-tracking metrics such as saccades, fixations and pupil diameter serve as proxies for cognitive load and provide insights into designers’ cognitive experiences during convergent and divergent thinking tasks. Eye-tracking studies often rely on one or more of three aspects: (1) saccades, (2) fixations and (3) pupil diameter.
Various cognitive constructs have been shown to correlate with saccades, fixations and pupil diameter. For example, increased cognitive load is associated with a decreased saccade frequency (Walter & Bex Reference Walter and Bex2021) and increased fixation durations (Liu et al. Reference Liu, Li, Yeh and Chien2022). Saccades and fixations are indicators of individuals’ attention (Kowler et al. Reference Kowler, Anderson, Dosher and Blaser1995; Jonikaitis et al. Reference Jonikaitis, Szinte, Rolfs and Cavanagh2013), as saccades occur in moments of disengaged visual attention (Fischer & Breitmeyer Reference Fischer and Breitmeyer1987). This relationship has been observed among professional and student engineers during open-ended design problems (Ahmed et al. Reference Ahmed, Hurwitz, Gestson and Brown2021). In addition to attention, memory mechanisms also influence saccades (Wang et al. Reference Wang, Huang, Yep and Munoz2018), wherein higher saccade frequency has been shown to have a complex effect on working memory. External factors such as the intensity of visual stimuli can also impact saccadic reaction times by modulating neural response latency (Bell et al. Reference Bell, Meredith, Van Opstal and Munoz2006). In addition to saccades and fixations, pupil diameter is also an indicator of mental stress (Torres-Salomao, Mahfouf & El-Samahy Reference Torres-Salomao, Mahfouf and El-Samahy2015), emotional regulation (Maier & Grueschow Reference Maier and Grueschow2021), arousal (Chen et al. Reference Chen, Kuo, Hsu and Wang2022), fatigue (Hopstaken et al. Reference Hopstaken, Van Der Linden, Bakker and Kompier2015) and attention (Van Den Brink, Murphy & Nieuwenhuis Reference Van Den Brink, Murphy and Nieuwenhuis2016). For example, pupil diameter often increases with cognitive load and arousal and decreases with fatigue.
The rich understanding of cognitive experiences provided by eye-tracking metrics makes them useful for examining the design process, and researchers have used eye tracking to measure various aspects of design cognition (Borgianni & Maccioni Reference Borgianni and Maccioni2020). One approach to using eye-tracking data is to code the content present in the participants’ gaze (e.g., using areas of interest) as a proxy for design behavior. These characteristics are quantified using metrics such as fixation duration and dwell time within an area of interest, and saccade frequency between areas of interest. Examples of such studies include examining design heuristics during CAD modeling (Mehta et al. Reference Mehta, Malviya, McComb, Manogharan and Berdanier2020), comparing designers’ use of different design representations (Prabhu & Cass Reference Prabhu and Cass2024) and investigating designers’ information-seeking behaviors (Bi et al. Reference Bi, Shergadwala, Reid and Panchal2015; Hess, Lehmeyer & Meboldt Reference Hess, Lehmeyer and Meboldt2017; Cao et al. Reference Cao, Xiong, Li, Liu and Wang2018). Alongside these studies on designer behavior, researchers have conducted similar studies on concept evaluation behaviors by analyzing the content of the gaze. Some examples include studying the effect of product representations on individuals’ preferences for products (Boa, Hicks & Aydin Reference Boa, Hicks and Aydin2013), evaluators’ use of certain product features to determine product similarity (Boa, Ranscombe & Hicks Reference Boa, Ranscombe and Hicks2015) and the importance placed on certain features when choosing products (Du & MacDonald Reference Du and MacDonald2014; Borgianni, Maccioni & Basso Reference Borgianni, Maccioni and Basso2019).
From a cognitive lens, Petkar et al. (Reference Petkar, Dande, Yadav, Zeng and Nguyen2009) present a controlled laboratory study in which they find that some eye-tracking metrics demonstrate strong correlations with cognitive demands. For example, their results indicate a decrease in both the blink rate and the variation in blink duration with an increase in task difficulty. Similarly, Cass & Prabhu (Reference Cass and Prabhu2025) demonstrate that CAD modeling is associated with lower minimum pupil diameters compared to writing notes. On the other hand, CAD modeling is also associated with a wider range of pupil diameters compared to writing and manufacturing simulation. Alongside these studies of designer cognition, researchers have also found similar results when examining concept evaluation. For example, Carbon, Hutlzer & Minge (Reference Carbon, Hutlzer and Minge2006) demonstrate that evaluating more innovative designs is cognitively demanding, as characterized by a greater increase in pupil diameter over time. Similarly, Guo et al. (Reference Guo, Ding, Liu, Liu and Zhang2016) demonstrate that more engaging user interfaces are associated with longer fixation durations and larger pupil diameters. Relatedly, Ho & Lu (Reference Ho and Lu2014) find smaller pupil diameters when individuals assess products that elicit a negative emotional response compared to positive emotional response, indicating the relationship between pupillometry and emotional response.
Researchers have also extended the use of eye-tracking metrics to compare cognitive factors in more general divergent and convergent thinking performance. For instance, researchers have found that spontaneous eye blink rate is positively or curvilinearly related to divergent thinking performance measured using the alternate uses test (AUT) (Chermahini & Hommel Reference Chermahini and Hommel2010; Ueda et al. Reference Ueda, Tominaga, Kajimura and Nomura2016). On the other hand, blink rate is negatively associated with convergent thinking performance measured using the remote associations task (RAT) (Chermahini & Hommel Reference Chermahini and Hommel2010; Ueda et al. Reference Ueda, Tominaga, Kajimura and Nomura2016). De Rooij & Vromans (Reference De Rooij and Vromans2020) extend these findings to suggest that these relationships may be governed by motivation and affective perception. Kwon et al. (Reference Kwon, Ryan, Bazylak and Shu2020) examine eye movements during the AUT and find that divergent thinking may involve a combination of internal cognition (e.g., memory recall) and external information retrieval. Colombo et al. (Reference Colombo, Mazza, Montagna, Ricci, Dal Monte and Cantamessa2020) present a similar study comparing eye movements between designers and nondesigners when presented with common and uncommon AUT stimuli. They found that designers tend to fixate on the left side of the visual stimuli, especially when presented with uncommon stimuli, indicating more frequent engagement with internal cognition. Ceh et al. (Reference Ceh, Annerer‐Walcher, Körner, Rominger, Kober, Fink and Benedek2020, Reference Ceh, Annerer-Walcher, Koschutnig, Körner, Fink and Benedek2021) further extend these findings to examining eye-tracking metrics. They find that internally directed cognition was associated with longer fixation duration and less frequent saccades. Additionally, they found higher pupil diameters during divergent thinking compared to convergent thinking, results also observed by Mazza et al. (Reference Mazza, Dal Monte, Schintu, Colombo, Michielli, Sarasso, Törlind, Cantamessa, Montagna and Ricci2023). These results suggest that divergent thinking tasks may require greater internal cognition and memory recall, which could be associated with higher pupil diameters – a proxy for higher cognitive load.
Two commonalities emerge in these studies that compare eye-tracking metrics between divergent and convergent thinking. First, several of these studies use peak-based measures of eye-tracking metrics (e.g., the maximum pupil diameter and peak to peak range) (Hershaw & Ettenhofer Reference Hershaw and Ettenhofer2018). Peak-based measures only represent momentary highs and lows and may not fully capture variation in these metrics over time. Understanding variation over time, and in reference to central tendency is important as the effects of cognitive load may be cumulative and result in fatigue over time (J. Sun & Liao Reference Sun and Liao2025), and these variations may not be fully captured using peak-based measures. Therefore, in addition to examining the maximum and range of pupil diameter, saccade frequency and fixation duration, we examine the standard deviation of an individual’s pupil diameter across time. Using standard deviation, we intend to measure the variation of pupil diameter within an individual across time, in reference to its central tendency (i.e., mean). Second, these studies use controlled test batteries such as the AUT, for measuring divergent and convergent thinking. Design tasks are often complex and context-dependent, requiring designers to consider numerous situational factors in the process (Amabile Reference Amabile1996; Gero & Kannengiesser Reference Gero and Kannengiesser2004; Atman et al. Reference Atman, Borgford-Parnell, Deibel, Kang, Ng, Kilgore, Turns, McDonnell, Lloyd, Reid, Luck and Cross2022). Building upon these points, in a parallel investigation to this study, we find that test batteries for measuring divergent and convergent thinking may not always represent creative performance in design tasks (Prabhu et al. Reference Prabhu, Kimball, Halpern and Zilberstein2026). Therefore, although researchers have examined differences in eye-tracking metrics between divergent and convergent thinking, these results might not directly translate in the context of design. We aim to test this aspect by comparing eye-tracking metrics between divergent and convergent thinking design tasks.
Taken together, eye tracking provides rich information regarding the content and context of designers’ behaviors through an examination of their gazes. It also provides a proxy for cognitive experiences through metrics such as saccades, fixations and pupil diameter, and these metrics could serve as a proxy for cognitive load beyond self-report scales (Cass & Prabhu Reference Cass and Prabhu2025). However, as discussed next, neurodevelopmental factors such as ADHD may also impact eye-tracking metrics, and these relationships have not been previously examined in the context of design cognition. We aim to address this gap through our study by examining these relationships in the context of convergent and divergent thinking tasks.
2.3. The impact of ADHD on eye-tracking metrics and divergent and convergent thinking
Prior research shows that neurodevelopmental factors and disorders often impact pupillometric measures. For example, individuals with Parkinson’s disease (Pretegiani & Optican Reference Pretegiani and Optican2017), schizophrenia (Zhu et al. Reference Zhu, Zhou, Zhou, Lin, Cai, Wu and Shi2024), ADHD (Munoz et al. Reference Munoz, Armstrong, Hampton and Moore2003), autism (B. P. Johnson et al. Reference Johnson, Lum, Rinehart and Fielding2016) and dyslexia (Tiadi et al. Reference Tiadi, Gérard, Peyre, Bui-Quoc and Bucci2016) often exhibit saccadic patterns that differ from neurotypical adults. Therefore, despite the knowledge surrounding eye-tracking metrics and divergent and convergent thinking in design, these relationships become complicated among individuals with ADHD.
ADHD is one of the most common psychiatric disorders (Kooij et al. Reference Kooij, Bijlenga, Salerno, Jaeschke, Bitter, Balázs, Thome, Dom, Kasper, Nunes Filipe, Stes, Mohr, Leppämäki, Casas, Bobes, Mccarthy, Richarte, Kjems Philipsen, Pehlivanidis, Niemela, Styr, Semerci, Bolea-Alamanac, Edvinsson, Baeyens, Wynchank, Sobanski, Philipsen, McNicholas, Caci, Mihailescu, Manor, Dobrescu, Saito, Krause, Fayyad, Ramos-Quiroga, Foeken, Rad, Adamou, Ohlmeier, Fitzgerald, Gill, Lensing, Motavalli Mukaddes, Brudkiewicz, Gustafsson, Tani, Oswald, Carpentier, De Rossi, Delorme, Markovska Simoska, Pallanti, Young, Bejerot, Lehtonen, Kustow, Müller-Sedgwick, Hirvikoski, Pironti, Ginsberg, Félegyházy, Garcia-Portilla and Asherson2019), influencing individuals from childhood to late adulthood and causes deficits in prefrontal cortex function and working memory (Arnsten Reference Arnsten2006). Individuals with ADHD experience more adverse effects from increased cognitive load than their neurotypical counterparts, including impaired performance and reaction time (Fisher et al. Reference Fisher, Hopp and Weber2023). Furthermore, individuals with ADHD experience higher levels of cognitive load (Weigard & Huang-Pollock Reference Weigard and Huang-Pollock2017). ADHD is associated with challenges with visual attention (Lin et al. Reference Lin, Chang, Hsieh, Yu and Lee2021) and saccade and fixation control (Munoz et al. Reference Munoz, Armstrong, Hampton and Moore2003). Students with ADHD spend less time looking at relevant stimuli in classrooms, exhibit more saccades (Yıldırım Demirdöğen et al. Reference Yıldırım Demirdöğen, Akıncı, Bozkurt, Turan, Esin, Donbaloğlu, Bingöl, Tümüklü Özyer, Kılıç and Dursun2024) and experience difficulty in maintaining ocular fixations (Falck-Ytter et al. Reference Falck-Ytter, Pettersson, Bölte, D’Onofrio, Lichtenstein and Kennedy2020).
The difficulties in ocular coordination associated with ADHD may indicate dysfunction with the prefrontal cortex, cingulate cortex and basal ganglia, regions of the brain influenced by ADHD (Goto et al. Reference Goto, Hatakeyama, Kitama, Sato, Kanemura, Aoyagi, Sugita and Aihara2010). ADHD is also associated with reduced connectivity in white matter tracts as well as dopamine dysregulation (Curatolo, D’Agati & Moavero Reference Curatolo, D’Agati and Moavero2010). Individuals with ADHD exhibit larger tonic pupil diameter, decreased phasic pupil dilation (Shirama et al. Reference Shirama, Takeda, Ohta, Iwanami, Toda and Kato2020) and pupil asymmetry (Kumano et al. Reference Kumano, Nobukawa, Shirama, Takahashi, Takeda, Ohta, Kikuchi, Iwanami, Kato and Toda2022).
Alongside pupillometric measures, ADHD is also associated with higher levels of divergent thinking among students (White & Shah Reference White and Shah2016), and even subclinical ADHD-like symptoms are associated with higher levels of originality and creativity in problem solving (Boot, Nevicka & Baas Reference Boot, Nevicka and Baas2017). While ADHD symptoms can be negatively correlated with engineering GPA, such symptoms are also positively correlated with divergent thinking (Taylor et al. Reference Taylor, Esmaili Zaghi, Kaufman, Reis and Renzulli2020). However, despite the enhanced divergent thinking associated with ADHD, individuals with ADHD often experience worsened convergent thinking performance, as demonstrated by the remote associates task (White & Shah Reference White and Shah2016).
While there is existing knowledge surrounding the relationships between ADHD and convergent and divergent thinking, as well as trends between ADHD and eye-tracking metrics, there is a lack of understanding regarding the impact of ADHD on eye-tracking proxies during convergent and divergent thinking tasks. Therefore, in this study, we aim to study saccade frequency, fixation duration and pupil diameter among individuals with and without ADHD during different design tasks. Specifically, we aim to study the effects of ADHD on individuals’ eye-tracking metrics during convergent and divergent thinking tasks.
2.4. Research questions
Our aim in this exploratory research is to study the effects of ADHD on individuals’ eye-tracking metrics during convergent and divergent thinking tasks, by examining the following RQs:
-
1. RQ1: How do eye-tracking metrics – a proxy for cognitive load – compare between divergent and convergent thinking tasks?
-
2. RQ2: How do eye-tracking metrics compare between individuals with and without ADHD when performing convergent and divergent thinking tasks?
Answering the first RQ will help us establish a baseline for any differences in eye-tracking metrics between convergent and divergent thinking design tasks and validate the results from prior research within a design context. Answering the second RQ will expand upon these results and examine the effects of ADHD on these metrics, a novel contribution from our work. Such an investigation is particularly important because cognitive overload can have negative implications for design performance (Zimmerer & Matthiesen Reference Zimmerer and Matthiesen2021), and utilizing eye-tracking metrics as a proxy for cognitive load can provide insight into this phenomenon. We hypothesize that participants with ADHD will exhibit longer fixations and fewer saccades and a larger range, standard deviation and maximum latent pupil diameter. This hypothesis is based on prior work by Walter & Bex (Reference Walter and Bex2021), who found that higher cognitive load results in longer fixations and fewer saccades, and work by Cass & Prabhu (Reference Cass and Prabhu2025), who found that cognitive load and pupil diameter are positively correlated. We also hypothesize that participants will demonstrate higher pupil diameters, longer fixation durations and less frequent saccades during the divergent thinking task. This hypothesis is based on prior results demonstrating similar patterns in eye-tracking metrics when performing the AUT and the RAT, general assessments of divergent and convergent thinking task performance, respectively (Ceh et al. Reference Ceh, Annerer‐Walcher, Körner, Rominger, Kober, Fink and Benedek2020, Reference Ceh, Annerer-Walcher, Koschutnig, Körner, Fink and Benedek2021; Mazza et al. Reference Mazza, Dal Monte, Schintu, Colombo, Michielli, Sarasso, Törlind, Cantamessa, Montagna and Ricci2023). However, one caveat is that these hypotheses assume that these general divergent and convergent thinking tasks translate into performance of design-based divergent and thinking tasks. This assumption may not always be true (Prabhu et al. Reference Prabhu, Kimball, Halpern and Zilberstein2026), especially in light of prior work by Ohno et al. (Reference Ohno, Tominaga, Anzue-Satoi, Nakata, Yanagawa, Korenaga, Uchida, Nakayama and Abe2025), who find that the cognitive demands and neural bases of convergent and divergent thinking differ in complex ways.
3. Data-collection methods
To answer these RQs, we conducted a causal-comparative study comprising a divergent and convergent design task. The details of the data-collection methods are discussed in the remainder of this section. The data used in this study were collected as part of a larger study, some preliminary results of which were presented by Kimball & Prabhu (Reference Kimball, Prabhu and Gero2024, Reference Kimball and Prabhu2025).
3.1. Participants
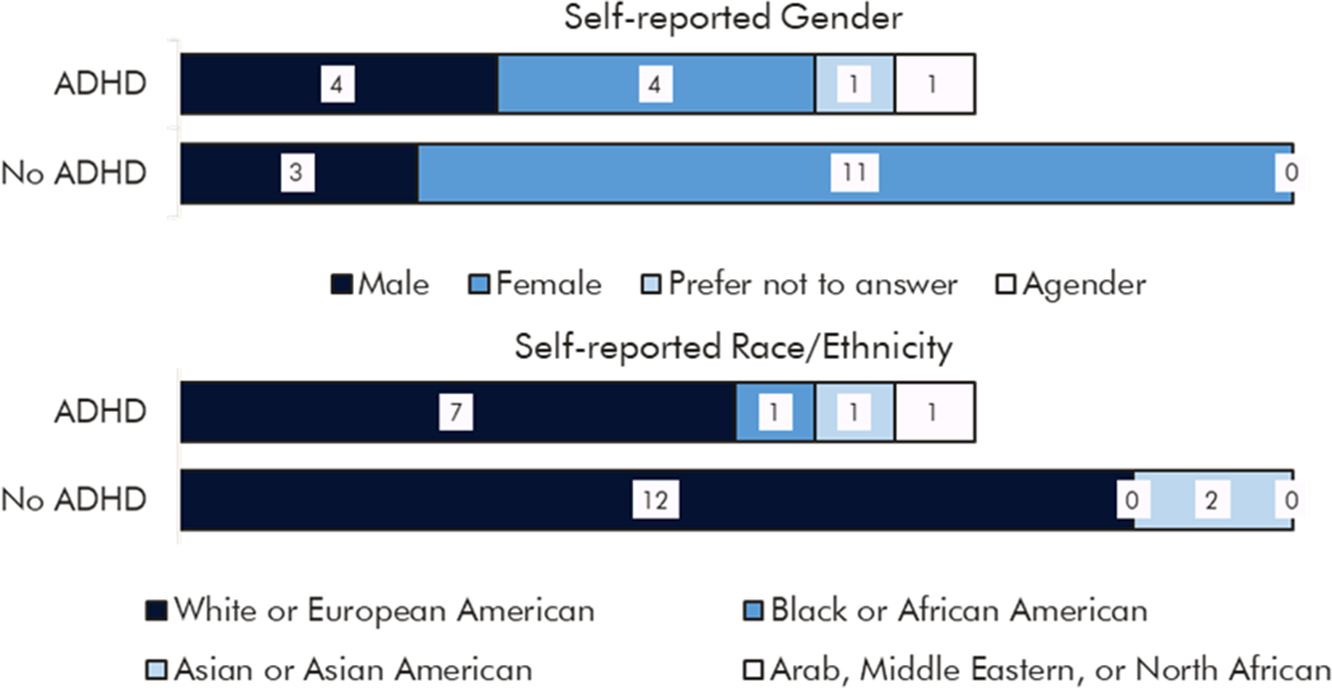
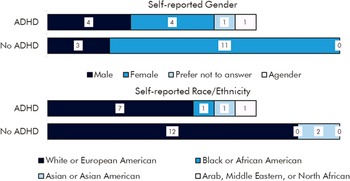
Participants were recruited from a liberal arts college in the Northeastern United States. Third- and fourth-year engineering students with and without ADHD were eligible to participate, leading to 10 participants with ADHD and 14 without ADHD. Marketing from the Academic Resource Hub on campus ensured that a sufficient sample of students with ADHD could be included in the study. Of the 24 participants, 7 identified as male, 15 identified as female, 1 identified as agender and 1 preferred not to answer when asked about their gender identity. Nineteen participants identified as White, three as Asian, one as Black and one as Arab when asked for their race and ethnicity. Finally, the participants were distributed across the six programs offered by the Engineering Division: (1) Mechanical Engineering (N = 11), (2) Chemical Engineering (N = 5), (3) Civil Engineering (N = 2), (4) Electrical & Computer Engineering (N = 2), (5) Integrative Engineering (N = 3) and (6) Engineering Studies (N = 1). The demographic data were collected in the form of open-ended surveys based on the guidelines proposed by Hughes et al. (Reference Hughes, Camden, Yangchen, Smith, Domenech Rodríguez, Rouse, McDonald and Lopez2022). Additionally, these data were collected after the study, rather than before, to minimize stereotype threat (Spencer, Logel & Davies Reference Spencer, Logel and Davies2016) and performance expectations (Brock et al. Reference Brock, Edelman, Edwards and Schuck1965). The distributions of participants based on their demographics are presented in Figure 1. It should be noted that these demographic details were used to characterize the sample as recommended by E. Johnson, Toh & Menold (Reference Johnson, Toh and Menold2025). Given the small sample size, we did not control for each demographic variable, an effort that could be explored in a larger-scale replication of the study. Additionally, researchers have found a higher prevalence of ADHD diagnosis among men compared to women, and this difference is attributed to various factors such as age of onset and physician bias (Cheng et al. Reference Cheng, Illango, El-Kadi, Ma, Mitchell, Rajapakse and Robb2022). The gender distribution in our sample is consistent with this finding, in that, the male to female ratio among participants diagnosed with ADHD is 1:1, and this ratio jumps to approximately 1:3.5 among participants without an ADHD diagnosis. Similarly, the ratio of male-identifying participants with and without a diagnosis is 4:3, whereas this ratio is 4:11 among female-identifying participants.
Breakdown of participants based on self-reported gender and race/ethnicity.
Participants were categorized into the ADHD/non-ADHD groups based on self-reported data on a formal diagnosis. Some participants reported that they may have ADHD or demonstrate some common symptoms, but do not have a formal diagnosis, and these participants were excluded from our study. Furthermore, participants without a formal diagnosis of ADHD, but who reported immediate family members with ADHD were excluded. Participants without a history of ADHD but with other mental health, psychiatric, neurodevelopmental disorders or learning disabilities (i.e., dyslexia) were excluded from the control group. Due to the high comorbidity rates between ADHD and other disorders (Katzman et al. Reference Katzman, Bilkey, Chokka, Fallu and Klassen2017), participants with other disorders (e.g., anxiety and autism) and a formal ADHD diagnosis were included in the study.
3.2. Procedure
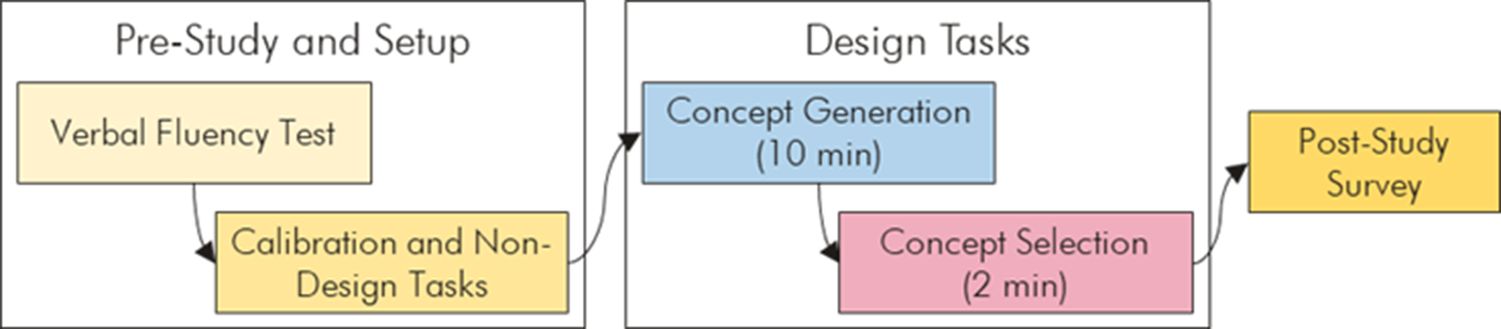
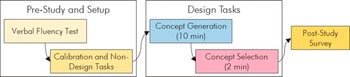
The data were collected in three steps outlined in Figure 2, with the freedom to take breaks in between each step as needed. Participants first completed a verbal fluency assessment based on the Controlled Oral Word Association Task (Spreen & Risser Reference Spreen, Risser and Taylor Sarno1998), wherein they were prompted to generate as many words as they could relevant to a specific category (e.g., words that began with the letter “A”) within 1 minute. A score lower than an average of 10 words across the two trials was used as an exclusion criterion, as later tasks in the study required verbal idea generation, which can be influenced by verbal fluency. Verbal fluency is influenced by factors such as anxiety and depression (Kryza-Lacombe et al. Reference Kryza-Lacombe, Kassel, Insel, Rhodes, Bickford, Burns, Butters, Tosun, Aisen, Raman, Saykin, Toga, Weiner, Nelson, Nelson and Mackin2024), language impairments (Gonçalves et al. Reference Gonçalves, Mello, Pereira, Ferré, Fonseca and Joanette2018), executive functioning challenges (Hedman, Hartelius & Saldert Reference Hedman, Hartelius and Saldert2022), effort (Cohen et al. Reference Cohen, Lohr, Paul and Boland2001) and fatigue (Cockshell & Mathias Reference Cockshell and Mathias2010). Incorporating the verbal fluency assessment ensured that participants met the criteria for being able to generate ideas within a limited period and avoid impaired semantic access as an extraneous variable.
Outline of the data-collection procedure.
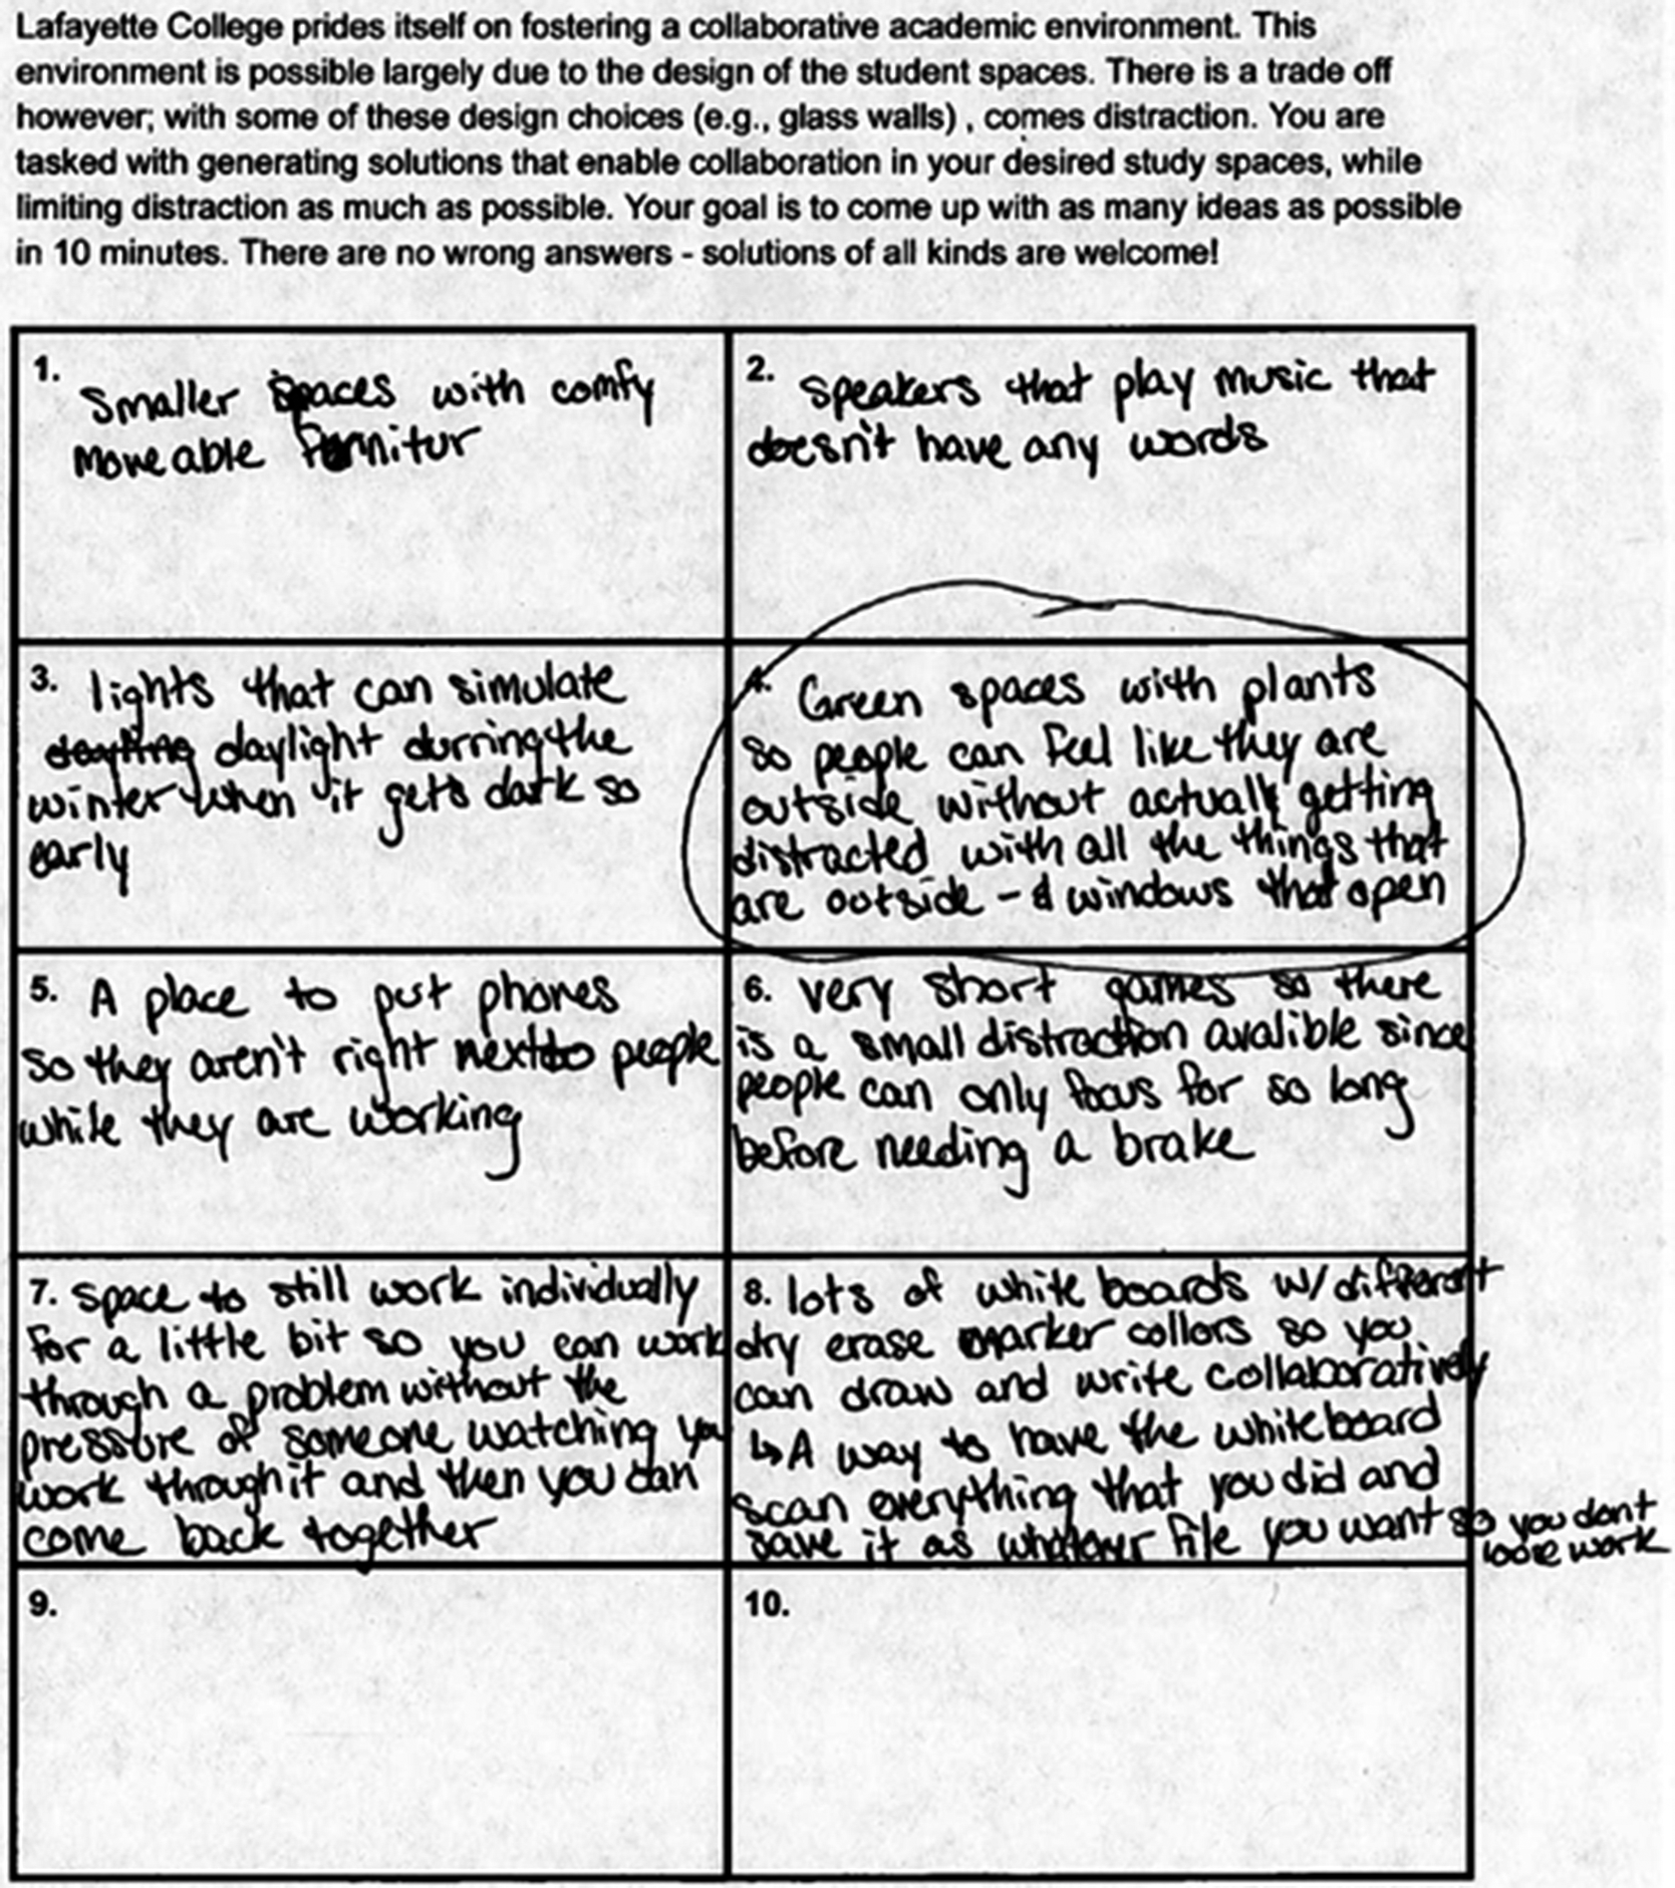
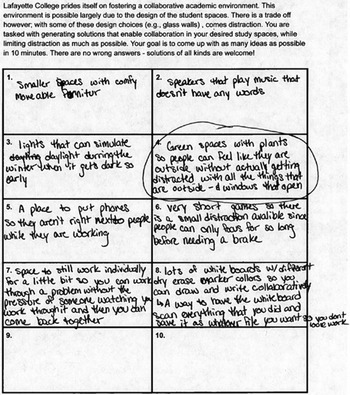
After completing the verbal fluency test, participants completed design-based divergent and convergent thinking tasks. During both tasks, participants wore the Tobii Pro Glasses 3 eye tracker, which measured pupillometric measures at a frequency of 50 Hz. Before data collection, the eye tracker was calibrated for measurement using the protocol recommended by Tobii, to ensure that the participants’ pupillometric measures were accurately captured. They were also instructed to avoid using their peripheral vision and instead turn their head for bigger movements. Participants were presented with the following design prompt in written format and asked to generate and write down as many original, out-of-the-box solutions as possible within 10 minutes, a representation of divergent thinking. Examples of ideas generated by participants are presented in Figure 3.
The College prides itself on fostering a collaborative academic environment. This environment is possible largely due to the design of the student spaces. There is a trade-off, however, with some of these design choices (e.g., glass walls) comes distraction. You are tasked with generating new solutions that enable collaboration in your desired study spaces while limiting distractions as much as possible. There are no wrong answers – solutions of all kinds are welcome!
This design task was chosen for three reasons. First, the task context is domain agnostic and does not rely on any specific engineering domain knowledge. Therefore, students across all engineering majors can identify potential solutions for the problem. It should be noted that although Lafayette does not offer a major in architectural engineering, a small number of students pursue a minor in architectural studies. This affinity of the problem toward architecture could have influenced the performance of certain participants; however, given the relatively small proportion of students enrolled in the minor, we do not believe this relationship had a significant effect on our results. Second, the task is both open-ended, therefore allowing for creative idea exploration, while being constrained enough to avoid participants from feeling lost in the ideation process (Onarheim Reference Onarheim2012; Prabhu et al. Reference Prabhu, Miller, Simpson and Meisel2020). Finally, students across all engineering majors are familiar with the commonly used study spaces on campus and within the engineering building. This familiarity makes this design problem approachable for all participants.
Example of ideas generated by a participant in the design task, including the selected idea (circled).
Next, participants were tasked with selecting the best idea, a representation of convergent thinking. As decision-making is a critical component of convergent thinking, participants were asked to select the idea that best met the requirements of the problem. Of their generated ideas, they were prompted to select one that they thought (1) most promoted collaboration, (2) best reduced distraction, (3) was most original and (4) most practical. Participants were provided with 2 minutes to complete the idea selection task, which terminated when they circled and shared the idea they had selected.
The order of tasks was kept consistent (in contrast to counterbalancing) to replicate real world design tasks, wherein designers may have to make concept selection decisions from within the set of ideas generated by them during concept generation. Therefore, participants’ divergent thinking outcomes may be dependent on the outcomes of divergent thinking. It should be noted that the entire experiment was conducted in the same laboratory space with the same lighting conditions. This space is an indoor room with no windows or sources of natural light. Therefore, the lighting and other environmental conditions were kept consistent among all participants. Due to scheduling constraints and the need to schedule participants one at a time, we did not schedule all participants at the same time of the day. This lack of consistency combined with differences in individual schedules (e.g., class and sleep schedules) present temporal confounding variables that were not controlled. Additionally, the timing of the two tasks (i.e., divergent and convergent thinking) were based on a pilot study. However, the differences in duration and the fixed order of the tasks could have influenced the results, calling for a future counterbalanced replication of the study.
3.3. Metrics
The data collected from the study were assessed using the following metrics. It should be noted that all eye-tracking data were processed using the fixation gaze filter, as it is more suitable for pupillometry in still movements (e.g., looking at a screen or a sheet of paper), as opposed to the attention filter, which is suited for dynamic movements (e.g., walking through a shopping market).
-
1. Saccade Frequency: Saccades are rapid eye movements between fixations, and frequent saccades indicate attentional shifts (Zhao et al. Reference Zhao, Gersch, Schnitzer, Dosher and Kowler2012) and decreased cognitive load (Walter & Bex Reference Walter and Bex2021). Saccade frequency was defined as the number of saccades per second. As visual attention becomes more scattered or cognitive load decreases, saccades increase. The eye tracker sampling rate was 50 Hz, providing data on whether a saccade or fixation was occurring in each 20-millisecond timestamp. We extracted the occurrence of saccades from the data set and calculated the total number of saccades throughout each task for each participant. The total number of saccades within a task was then divided by the task duration to normalize saccade frequency to task duration. The divergent thinking task was 10 minutes, and the convergent thinking task was 2 minutes, but using timestamps enabled more precise measurements. This calculation can be represented by the following formula:
 $$ \mathrm{Saccade}\ \mathrm{frequency}=\frac{Total\ Number\ of\ Saccades\ Recorded\ During\ Task}{Final\ Computer\ Timestamp- Initial\ Computer\ Timestamp} $$
-
2. Fixation Duration: Fixations represent periods in which the eyes remain still, enabling individuals to focus on specific points. Fixation durations are used as indicators of attention and cognitive load (Walter & Bex Reference Walter and Bex2021). As visual attention becomes more scattered and/or cognitive load decreases, the duration of fixations tends to decrease. Saccade frequency and fixation duration are often negatively correlated, as more eye movement is indicated by more saccades, thus shorter fixations, and less eye movement is characterized by fewer saccades, thus longer fixations. The same preprocessed data from Tobii Pro Lab was used for determining fixation duration, where each 20-millisecond timestamp was characterized as a saccade or fixation. We determined the average fixation duration for each participant. First, consecutive fixation timestamps were grouped and labeled as one fixation (i.e., three consecutive fixation timestamps do not represent three fixations, but rather one 60 millisecond fixation). The number of fixations was extracted. Next, the duration of each fixation was calculated by calculating the difference between the timestamp at the end of each fixation and subtracting the timestamp at the beginning of the corresponding fixation. Each fixation duration was then averaged by dividing the time the participant spent in fixations by the number of fixations with the following formula:
 $$ \mathrm{Average}\ \mathrm{Fixation}\ \mathrm{Duration}=\frac{\sum Duration\ of\ each\ fixation\ produced\hskip0.32em by\hskip0.32em participant}{Number\ of\ fixation s\ produced\hskip0.32em by\hskip0.32em participant} $$
-
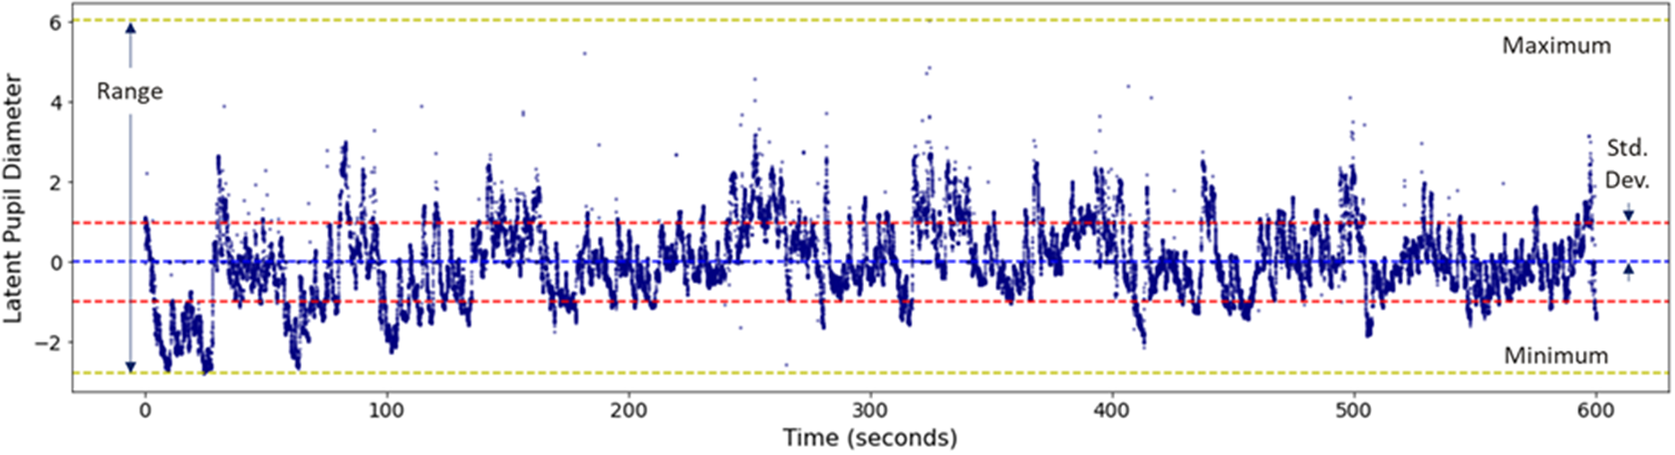
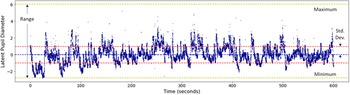
3. Latent Pupil Diameter: We used pupil diameter due to its correlation with cognitive load (Cass & Prabhu Reference Cass and Prabhu2025), and an increase in pupil diameter is associated with higher cognitive load (Jerčić, Sennersten & Lindley Reference Jerčić, Sennersten and Lindley2020). Each 20-millisecond timestamp included a left and right pupil diameter measured in millimeters. These two measures were combined using factor analysis-based dimensionality reduction to yield a combined latent pupil diameter (Alavi et al. Reference Alavi, Visentin, Thapa, Hunt, Watson and Cleary2020; Cass & Prabhu Reference Cass and Prabhu2025). As this approach normalizes the data, the data are unitless and centered around zero. This normalization also minimizes any effects caused by differences in baseline pupil diameters between participants and centering all participants’ data about the same mean. Then, we calculated the maximum, range (i.e., the difference between maximum and minimum) and standard deviation of the latent pupil diameter for each participant for each task. The maximum latent pupil diameter provides a peak-based representation of the maximum cognitive load experienced by a participant. Similarly, the range of latent pupil diameter provides a peak-based representation of the variation in cognitive load experienced and indicates the differences between the highest and lowest levels of cognitive load. Finally, the standard deviation of latent pupil diameter provides a central tendency-based representation of variation in cognitive load. Specifically, it represents the typical deviation of latent pupil diameter from the central tendency (e.g., mean, in this case, zero) and is independent of peak-based measures such as minimum and maximum. We chose to consider standard deviation in addition to range as it provides a more robust representation of variation of cognitive load over time, as opposed to the difference in momentary peaks represented by range. An example of the three metrics derived from the time series data for latent pupil diameter is presented in Figure 4.
Figure 4.An example of time series data of latent pupil diameter with corresponding minimum, maximum, range and standard deviation indicated.

4. Data analysis and results
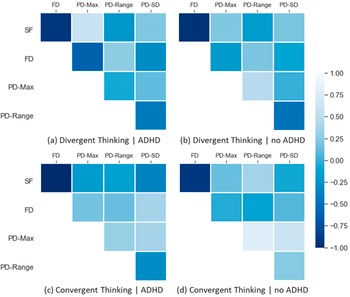
The data collected were analyzed using statistical methods. Before analyzing the collected eye-tracking data to answer our RQs, we were interested in examining the relationship between our eye-tracking metrics, namely, (1) saccade frequency (SF), (2) fixation duration (FD) and (3) latent pupil diameter metrics (i.e., maximum, range and standard deviation). Therefore, we computed a series of Spearman Correlation Coefficients between the five eye-tracking metrics, separating the participants by the two independent variables: (1) ADHD vs. no ADHD, and (2) convergent and divergent thinking. The correlation coefficients are visualized in Figure 5.
Spearman Correlations between the five eye-tracking metrics, separated by the independent variables. SF = Saccade Frequency, FD = Fixation Duration, PD = Latent Pupil Diameter, and SD = Standard Deviation.
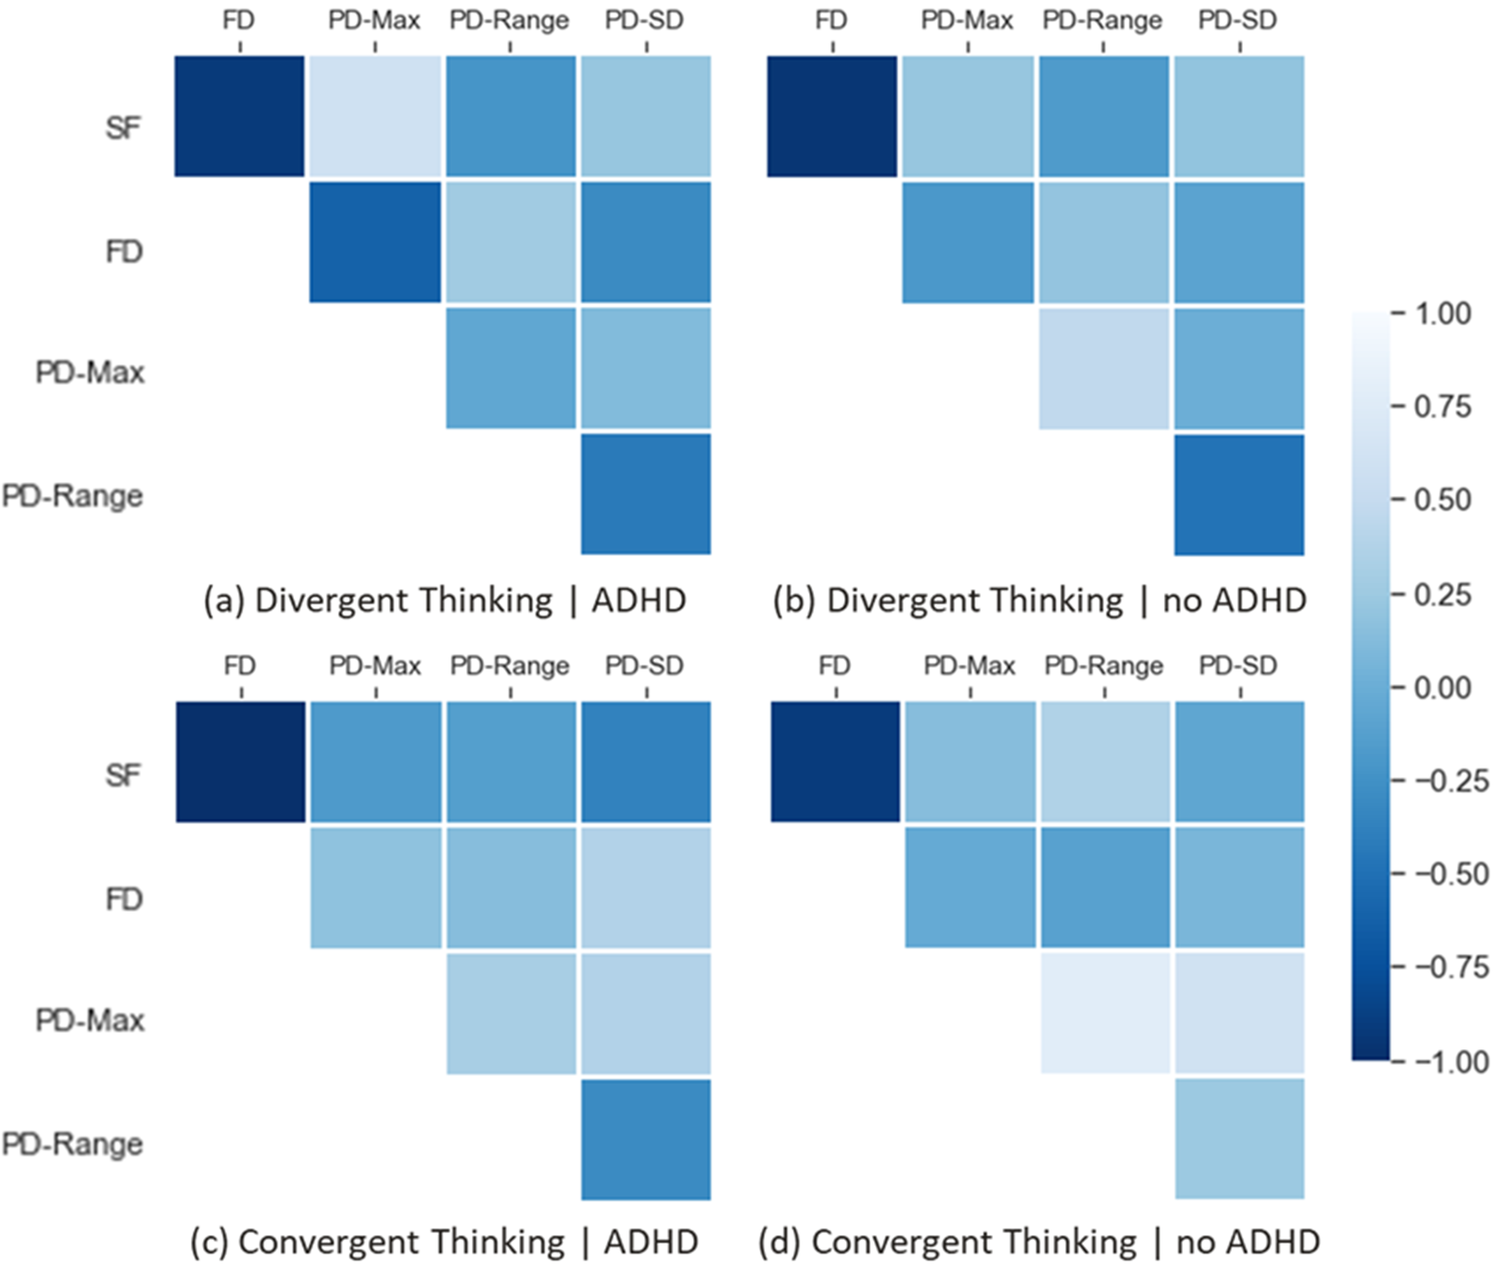
The correlation coefficients highlight strong relationships between some eye-tracking metrics. Across both tasks and both diagnostic groups, strong negative correlations emerged between saccade frequency and fixation duration, highlighting that as saccades became more frequent, fixations became shorter. Furthermore, relationships between some metrics varied based on task type and ADHD diagnosis, potentially reflecting differences in task demands, cognitive load or regulation during the tasks. For instance, there was a strong positive correlation between the maximum and range of latent pupil diameter; however, this correlation was only observed among participants without ADHD when performing the convergent thinking task. This result suggests a potential relationship between the peak and spread of cognitive load among this subset of participants when performing the convergent thinking task. These variations in the correlations prompted us to consider all dependent and independent variables in our further analyses.
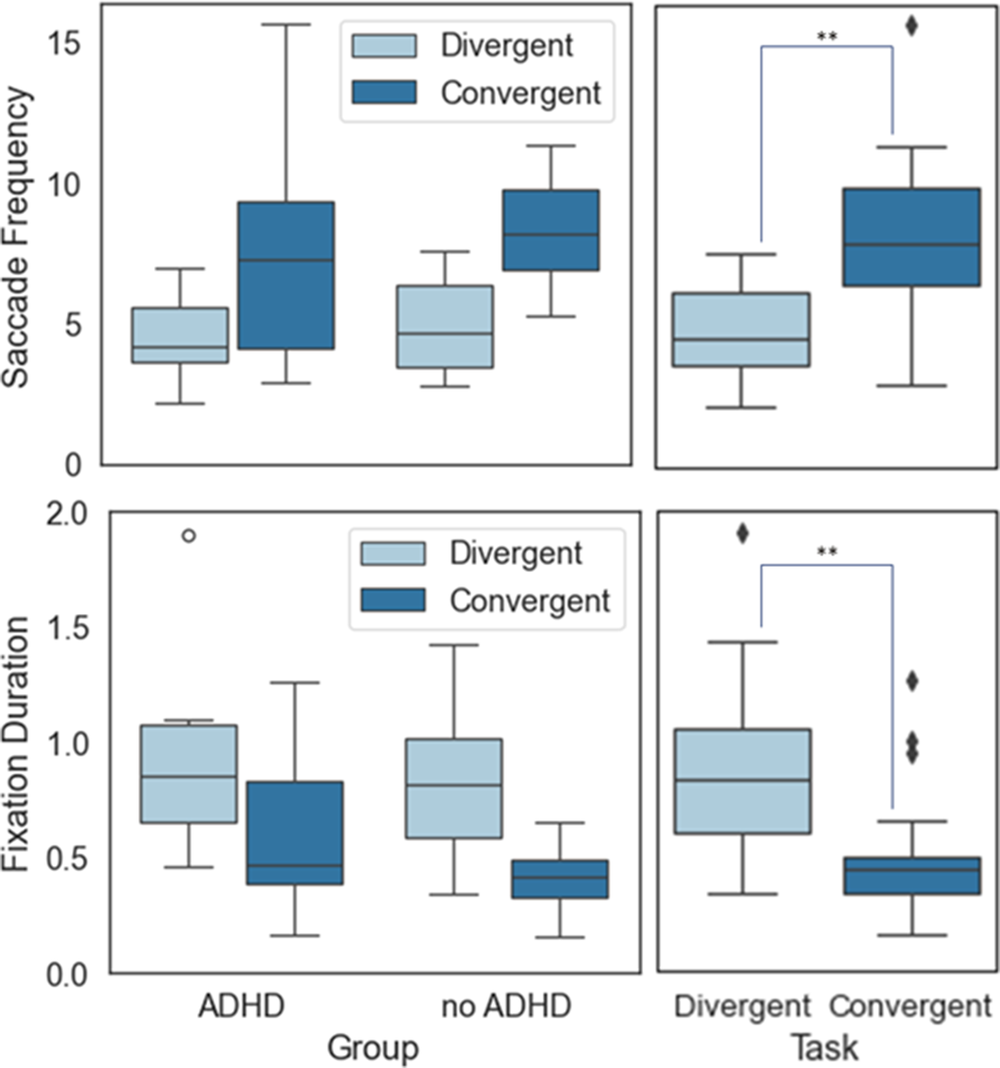
Next, we conducted a series of two-way ANOVAs with the eye-tracking metrics as the dependent variable and the diagnostic group (i.e., ADHD and no ADHD) and task type (i.e., divergent and convergent thinking) as the independent variables. The assumptions of the ANOVA (i.e., normal distribution, homogeneity of variances and presence of outliers) were tested, and any violations were treated accordingly. The results of the assumption testing and the subsequent ANOVAs are discussed next and are summarized in Figures 6 and 7.
Comparing saccades and fixations between individuals with and without ADHD during convergent and divergent thinking tasks. ** indicates statistically significant differences (p < 0.01).
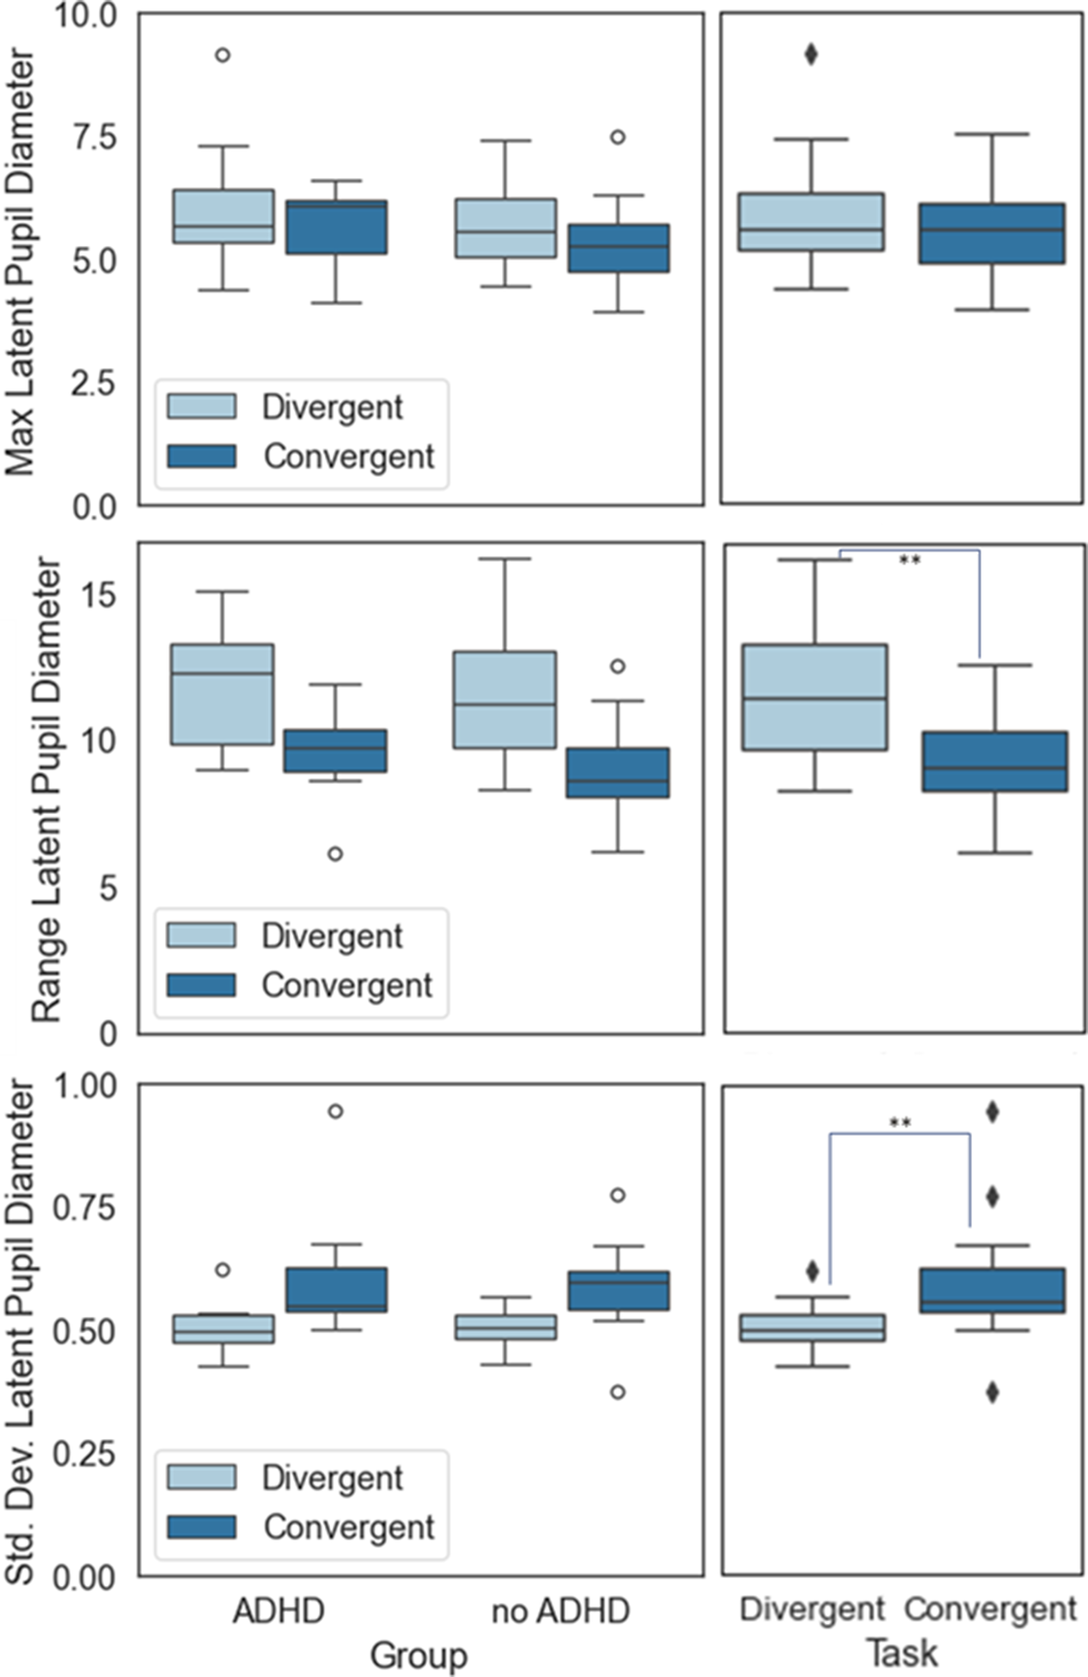
Comparing pupil diameter metrics between individuals with and without ADHD during convergent and divergent thinking tasks. ** indicates statistically significant differences (p < 0.01).
4.1. Saccade frequency
First, we tested for outliers by computing z-scores and found one outlier (z = 3.41), and this participant was excluded from the analysis. With outliers excluded, Levene’s test for homogeneity of variances indicated that the variances were not significantly different, F (1, 21) = 2.10, p = 0.11 and the Shapiro–Wilk test of normality indicated that the residuals did not significantly deviate from normality, W (24) = 0.95, p = 0.06. With outliers excluded, there were no statistically significant differences in saccade frequency between the participants with ADHD and participants without ADHD, F (1, 22) = 3.71, p = 0.06. Participants exhibited more frequent saccades during the convergent thinking task, F (1, 22) = 25.03, p < 0.001. Finally, no significant interaction effect was observed between diagnostic group and task, F (1, 22) = 1.26, p = 0.27. These results support and refute different aspects of our hypothesis. It refutes that there are significant differences in individuals with and without ADHD in saccade frequency during convergent and divergent thinking tasks. The results also support that there are differences in saccade frequency between the two tasks, with more saccades during the convergent thinking task.
4.2. Fixation duration
Similar to saccade frequency, we first tested the dataset for potential outliers by computing z-scores and found one outlier (z = 3.33). This participant was excluded as an outlier during the divergent-thinking task. With outliers excluded, Levene’s test for homogeneity of variances indicated that the variances were significantly different, F (1,21) = 3.43, p = 0.03, and the Shapiro–Wilk test of normality indicated that the residuals significantly deviated from normality, W (24) = 0.92, p = 0.005. Despite this violation of the assumption of normality, we chose to perform the ANOVA due to its robustness to deviations from normally distributed data. The results of the ANOVA indicated that there were no statistically significant differences in saccade frequency between the participants with ADHD and participants without ADHD, F (1, 22) = 0.42, p = 0.52. However, participants exhibited shorter fixation durations during the convergent thinking task, F (1, 22) = 20.77, p < 0.001. Finally, no significant interaction effects were observed between diagnostic group and task type, F (1, 22) = 1.16, p = 0.29. These results support and refute different components of our hypothesis. It refutes that there are significant differences in individuals with and without ADHD in fixation duration during convergent and divergent thinking tasks. The results also support that there are differences in fixation duration between the two tasks, with shorter fixation durations during the convergent thinking task.
4.3. Maximum latent pupil diameter
First, we tested for outliers by computing the z-scores, and one participant (z = 3.56) was excluded during the divergent-thinking task. With outliers excluded, Levene’s test for homogeneity of variances indicated that the variances were not significantly different, F (1, 21) = 0.02, p = 1.00, and the Shapiro–Wilk test of normality indicated that the residuals did not significantly deviate from normality, W (24) = 0.98, p = 0.54. With outliers excluded, there were no statistically significant differences in maximum latent pupil diameter between the participants with ADHD and participants without ADHD, F (1, 22) = 0.26, p = 0.61. Additionally, there were no statistically significant differences in maximum pupil diameter between the convergent and divergent thinking tasks, F (1, 22) = 0.90, p = 0.35. Finally, there was no significant interaction between diagnostic group and task type, F (1, 22) = 0.37, p = 0.55. These results refute our hypothesis and indicate that there are no differences in maximum latent pupil diameter between individuals with and without ADHD or between task types.
4.4. Range of latent pupil diameter
First, a test for outliers using z-scores revealed no statistical outliers (z < 3.0). Levene’s test for homogeneity of variances indicated that the variances were not significantly different, F (1, 22) = 1.58, p = 0.21, and the Shapiro–Wilk test of normality indicated that the residuals did not significantly deviate from normality, W (24) = 1.58, p = 0.21. Next, the results of the two-way ANOVA revealed no statistically significant differences in the range of latent pupil diameter between the participants with ADHD and participants without ADHD, F (1, 22) = 0.69, p = 0.41. However, participants exhibited a larger range in pupil diameter during the divergent thinking task, F (1, 22) = 17.24, p < 0.001. Finally, no significant interaction effects between diagnostic group and task type were observed, F (1,22) = 0.01, p = 0.90. These results support and refute different aspects of our hypothesis. It refutes that there are significant differences in individuals with and without ADHD in the range of latent pupil diameter during convergent and divergent thinking tasks. The results also support that there are differences in the range of latent pupil diameter between the two tasks, with a smaller range during the convergent thinking task.
4.5. Standard deviation of latent pupil diameter
First, we tested for outliers by calculating z-scores, and one outlier participant (Z = 4.27) was identified and excluded from the convergent thinking task data. With outliers excluded, Levene’s test for homogeneity of variances indicated that the variances were not significantly different, F (1, 22) = 2.31, p = 0.09, and the Shapiro–Wilk test of normality indicated that the residuals did not significantly deviate from normality, W (24) = 0.95, p = 0.03. Next, we found no statistically significant differences in the standard deviation of latent pupil diameter between the participants with ADHD and participants without ADHD, F (1, 22) = 0.59, p = 0.45. However, participants exhibited larger standard deviations in pupil diameter during the convergent thinking task, F (1, 22) = 18.52, p < 0.001. Finally, no significant interaction effects were observed between diagnostic group and task type, F (1,22) = 0.14, p = 0.71. These results support and refute different aspects of our hypothesis. It refutes that there are significant differences in individuals with and without ADHD in the standard deviation of latent pupil diameter during convergent and divergent thinking tasks. The results also support that there are differences in the standard deviation of latent pupil diameter between the two tasks, with a larger standard deviation in pupil diameter durations during the convergent thinking task.
5. Discussions and implications for creativity research and practice
Our aim in this study is to investigate whether there are differences in eye-tracking metrics, such as saccades, fixations and pupil diameter, between individuals with and without ADHD when completing convergent and divergent thinking tasks. Overall, we found no significant differences in the eye-tracking metrics between participants with and without ADHD during each task. However, participants from both diagnostic groups differed in eye-tracking metrics between convergent and divergent thinking tasks. Specifically, during the convergent thinking task, we found that participants exhibited (1) more frequent saccades, (2) shorter fixation durations, (3) smaller ranges in pupil diameter and (4) larger standard deviations in pupil diameter compared to the divergent thinking task. The implications of these results are discussed next.
We see that participants exhibited more frequent saccades during the convergent thinking task compared to the divergent thinking task, and this difference could be attributed to a variety of factors. First, frequent saccades have been related to lower levels of cognitive load, whereas high cognitive load is associated with a reduction in saccades (Walter & Bex Reference Walter and Bex2021). Therefore, participants may exhibit higher cognitive load during the divergent thinking task compared to the convergent thinking task. Second, frequent saccades are associated with dispersed visual attention, and our results indicate that participants may experience more dispersed visual attention during the convergent thinking task. This inference contradicts past research highlighting that attention is more dispersed during divergent thinking (Goldschmidt Reference Goldschmidt2016). Finally, more frequent saccades in the convergent thinking task could be attributed to task demands related to voluntary eye movements. For example, reading in the convergent thinking task may require more voluntary eye movements compared to fewer movements required when writing in the divergent thinking task. Similarly, this finding could be attributed to greater internally directed cognition during divergent thinking tasks, which has been associated with more frequent saccades (Ceh et al. Reference Ceh, Annerer‐Walcher, Körner, Rominger, Kober, Fink and Benedek2020, Reference Ceh, Annerer-Walcher, Koschutnig, Körner, Fink and Benedek2021).
Second, we find that participants exhibited shorter fixation durations during the convergent thinking task compared to the divergent thinking task. With more frequent saccades come shorter fixations, as eyes move more and stay fixated for shorter periods of time. This inverse relationship was observed in the results of our study, as participants exhibited more saccades but shorter fixation durations during the convergent thinking task. Shorter fixations indicate that participants kept their eyes fixated on each point for shorter periods of time during the convergent thinking task. Similar to the insights provided by saccade frequency, shorter fixation durations highlight a variety of possible factors, including cognitive load, visual attention and task demands. Cognitive load and fixation duration are positively correlated (Walter & Bex Reference Walter and Bex2021; Liu et al. Reference Liu, Li, Yeh and Chien2022). Longer fixation durations during the divergent thinking task could be attributed to higher cognitive load; these results could also be influenced by visual attention and task-specific demands. Similarly, longer fixation duration could also be attributed to more internally directed cognition (Ceh et al. Reference Ceh, Annerer‐Walcher, Körner, Rominger, Kober, Fink and Benedek2020, Reference Ceh, Annerer-Walcher, Koschutnig, Körner, Fink and Benedek2021), a cognitive process associated with divergent thinking tasks (Kwon et al. Reference Kwon, Ryan, Bazylak and Shu2020). Whereas saccades and fixations can be influenced by voluntary eye movements, pupil diameter is more strictly exogenously controlled or the result of involuntary processes. Therefore, pupil diameter data could provide valuable insights into participants’ cognitive load, as it is more directly the product of internal processes.
Our third finding is that participants exhibited a larger range in latent pupil diameter during the divergent thinking task compared to the convergent thinking task. Prior research suggests that pupil diameter is positively correlated with the cognitive load experienced (Van Der Wel & Van Steenbergen Reference Van Der Wel and Van Steenbergen2018). Therefore, participants exhibiting a larger range in pupil diameter during the divergent thinking task may also experience a larger range of cognitive load when performing the task. This finding is particularly important because we observed no significant differences in maximum pupil diameter between the convergent and divergent thinking tasks. As pupil diameter range accounts for individual differences in baseline pupil diameter, the range of pupil diameter may provide more meaningful information compared to peak-based measures (e.g., maximum), which are often used in cognitive studies. The broader range in pupil diameter during the divergent thinking task may also indicate shifts between extremely high and low cognitive loads. Such patterns may reflect the complexity of the divergent thinking task, requiring a broader range of cognitive resources.
Next, we find that participants exhibited larger standard deviations in pupil diameter during the convergent thinking task compared to the divergent thinking task. As pupil diameter is positively correlated with cognitive load, a large standard deviation in pupil diameter during convergent thinking could indicate frequent fluctuation in cognitive load throughout the task. Despite the smaller range in pupil diameter during the convergent thinking task, participants exhibited a larger standard deviation. This difference in results highlights that although the absolute difference between maximum and minimum cognitive load during convergent thinking may be smaller than that of divergent thinking, there may be more frequent fluctuations in cognitive load expended during convergent thinking. This result also suggests that while divergent thinking may require momentary high and low peaks of cognitive load, convergent thinking may lead to cognitive fatigue due to two reasons. First, the frequent and consistent fluctuations in cognitive load may lead to individuals feeling greater levels of fatigue as they progress through the task. Second, these consistent fluctuations may lead to greater cognitive resources cumulatively expended by the end of the task. These inferences call for future studies that use an “area under the curve” approach to examine the cumulative cognitive resources consumed during convergent and divergent thinking tasks (Mann et al. Reference Mann, Cuevas, Clouston, Freilich, Krizan, Zuber, Wänström, Muniz-Terrera, O’Keefe, Voll, Hofer, Rodgers and Krueger2024).
Finally, we found no differences in any of the eye-tracking metrics between individuals with and without ADHD. This lack of differences could be attributed to underlying conflicting factors, particularly in individuals with ADHD. For example, ADHD is associated with a lower working memory capacity (Alderson et al. Reference Alderson, Kasper, Hudec and Patros2013), and since cognitive load is dependent on working memory systems, individuals with ADHD are often more likely to experience cognitive overload (Weigard & Huang-Pollock Reference Weigard and Huang-Pollock2017). Since less frequent saccades and longer fixations are associated with higher levels of cognitive load, individuals with ADHD may be more likely to experience fewer saccades and longer fixations. On the other hand, individuals with ADHD also exhibit higher rates of distractibility (Ross & Randolph Reference Ross and Randolph2014). Heightened levels of distractibility and disengaged visual attention can lead to more saccades as individuals with ADHD keep their eyes fixed for shorter periods of time. These two factors contradict one another, as the increased distractibility would increase saccades, but the increased cognitive load would lead to fewer saccades. Our results, therefore, highlight the complexity of analyzing eye-tracking metrics among individuals with ADHD, as their oculomotor behavior may be shaped by competing cognitive mechanisms. The metrics may be representative of both endogenous top-down and exogenous bottom-up attentional control factors. Together, the null findings in saccades and fixations between groups may not necessarily indicate similarities among cognitive processes between individuals with and without ADHD. Rather, this could be comprised of opposing factors, highlighting the need for more nuanced analysis and interpretation. These results could be further complicated by task-based demands, such as motivation toward solving the design problem.
6. Limitations and directions for future work
Despite the useful insights obtained from our results, our study has several limitations, presenting opportunities for future research. First, the sample size consisted of only 10 participants with ADHD, which may limit statistical power. Future work should aim to expand this work with a larger sample. Furthermore, using a community sample, rather than a sample limited to the college students, could enable the results to be more generalizable. Such an expansion may also mitigate the effects of coping mechanisms among participants. As the participants in our study attend a selective undergraduate institution, they may have developed better coping and attentional control practices, which may not be true for individuals with ADHD in general. Second, some of the participants within the ADHD group had co-occurring conditions. Autism, for example, is associated with increased saccades and shorter fixations (B. P. Johnson et al. Reference Johnson, Lum, Rinehart and Fielding2016); therefore, autism only occurring in the ADHD group could also influence between-group comparisons, potentially contributing to the null results between groups in this study. Additionally, some of the participants with ADHD may have taken medication to reduce symptom severity, while others may be unmedicated; the effects of stimulants and other ADHD medications on creativity are not fully known (McBride et al. Reference McBride, Appling, Ferguson, Gonzalez, Schaeffer, Zand, Wang, Sam, Hart, Tosh, Fontcha, Parmacek and Beversdorf2021).
Third, participants who relied on eyeglasses and were unable to wear contacts were not invited to participate in the study due to eyeglasses not being compatible with the Tobii Pro Glass eye tracker. However, the remaining participants likely had variability in eye acuity, which we did not measure or account for (e.g., participants with minor prescriptions who normally wear eyeglasses and took them off for the study). Differences in visual acuity and eye health could influence eye movement patterns (Nieboer et al. Reference Nieboer, Ghiani, De Vries, Brenner and Mann2023), irrespective of cognitive load or visual attention. Future work should measure baseline and corrected visual acuity for eligibility.
Next, to further determine whether individuals with and without ADHD vary in eye-tracking metrics during design tasks, one future direction could be to account for individual differences in tonic pupil diameter and resting-state saccade frequencies and fixation durations. This process may better highlight group differences by normalizing data to individual participants. In addition, we used range and peak-based analyses without accounting for changes in metrics throughout the task. Future work should investigate changes in cognitive load throughout the task through the area under the curve (Mann et al. Reference Mann, Cuevas, Clouston, Freilich, Krizan, Zuber, Wänström, Muniz-Terrera, O’Keefe, Voll, Hofer, Rodgers and Krueger2024) and moment-by-moment analysis to understand how these trends change throughout the task and if event-based changes differ between individuals with and without ADHD. Such an investigation could also employ higher-order statistical moments to represent the time-series eye-tracking data as suggested by Cass & Prabhu (Reference Cass and Prabhu2025).
Regarding task design, the convergent thinking task relied on reading, while the divergent thinking task required writing; the task demand differences between reading and writing alone could lead to differences in saccades and fixations. Reading elicits frequent saccades, especially when reading real words (Zachary Jacobson & Dodwell Reference Zachary Jacobson and Dodwell1979). Furthermore, while pupil diameter was used as a proxy for cognitive load, extraneous variables can influence pupil diameter, such as luminance (Cherng, Crevecoeur & Wang Reference Cherng, Crevecoeur and Wang2021), emotions, arousal, attention (Peinkhofer et al. Reference Peinkhofer, Knudsen, Moretti and Kondziella2019) and decision-making (Murphy, Vandekerckhove & Nieuwenhuis Reference Murphy, Vandekerckhove and Nieuwenhuis2014). Future research should aim to control for external factors that may influence pupil diameter outside of cognitive load, such as the environment, and covary pupil metrics with stress responses through self-report or skin conductance levels. Additionally, future assessment should either not incorporate visual stimuli or keep visual stimuli and visual task demands universal and consistent across tasks (i.e., not having just one task rely on reading) if comparing eye-tracking metrics between tasks to prevent differences in eye-tracking metrics due to different task demands from varying visual stimuli.
It is important to note that since participants in our study had to make a concept selection decision after generating ideas, counterbalancing was not possible within these tasks. The choice to keep the divergent and convergent design tasks connected was made to replicate real-world design projects wherein designers often must make concept selection decisions within the designs they produce during concept generation. Therefore, future work should consider incorporating design-based divergent thinking and convergent thinking tasks that can be counterbalanced, so participants do not experience the tasks in the same order. A counterbalanced approach would control for order effects such as fatigue when looking at between-task comparisons. Such an expansion of this work will also consider the characteristics of design outcomes generated and selected by the participants (e.g., their quality, novelty and fluency). This consideration of design outcomes is important as it could illustrate the relationship between cognitive load and task performance, and whether ADHD impacts these relationships. Relatedly, such future work could examine the effects of different design task contexts, particularly those that may leverage different levels of domain knowledge and expertise. Such an investigation is particularly important as prior research suggests that individuals’ motivation to pursue a task may impact the manifestation of different symptoms of ADHD (Lasky et al. Reference Lasky, Weisner, Jensen, Hinshaw, Hechtman, Arnold, Murray, D and Swanson2016). Therefore, different task contexts may elicit different motivational responses, therefore impacting the performance of design tasks and the effects of ADHD on design cognition.
Finally, self-report scales could be incorporated to assess self-perceived cognitive load through the NASA-TLX and self-perceived symptom severity, such as through the Adult ADHD Self-Report Scale (ASRSv1.1) or Barkley Adult ADHD Rating Scale (BAARS). These measures could further contextualize findings by enabling researchers to investigate ADHD symptom severity on a continuous scale rather than binary group characterization to highlight individual differences and consider the vast breadth of symptom combinations that individuals with ADHD experience. Similarly, self-reported measurements of cognitive load could illuminate differences between participants’ perceptions of their experienced cognitive load and the biophysical proxies such as eye-tracking metrics (Cass & Prabhu Reference Cass and Prabhu2025).
7. Concluding remarks
In this study, we aimed to study the impact of ADHD on eye-tracking metrics (e.g., saccade frequency, fixation durations and pupil diameter) when performing divergent and convergent thinking tasks. Toward these aims, we conducted a causal-comparative study that included a divergent and convergent thinking task while extracting eye-tracking metrics. We found that participants with ADHD and without ADHD did not differ in their eye-tracking metrics, regardless of task type. However, irrespective of the diagnostic group, individuals differed significantly in their eye-tracking metrics between the two tasks. Specifically, participants exhibited fewer saccades, longer fixations, a larger range in pupil diameter and a smaller standard deviation of pupil diameter during the divergent thinking task compared to during the convergent thinking task. These results suggest that individuals with and without ADHD may not always differ in their oculomotor representations of cognition. Furthermore, divergent thinking may require higher levels of cognitive load, as indicated by fewer saccades and longer fixations. Such an inference must be taken with caution, as task demands (e.g., reading and writing) could influence saccades and fixations, which are not just involuntarily, but also voluntarily controlled by individuals, especially in the presence of external factors. To this extent, exploring less voluntarily controlled metrics such as pupil diameter could provide insights into factors beyond voluntary factors that influence oculomotor tendencies. This observed inverse relationship between fixations and saccades also highlights the intertwined relationship between the metrics, highlighting the usefulness of considering both factors together.
The larger range in pupil diameter during the divergent thinking task highlights that relative to individual baseline, individuals may exhibit higher peaks in cognitive load during divergent thinking than convergent thinking. Notably, there were no significant differences between the tasks when looking at maximum pupil diameter, necessitating the consideration of baseline minimum pupil diameter to account for individual differences. Furthermore, the need for more consistent and frequent shifts in cognitive load during convergent thinking is apparent through the larger standard deviation in pupil diameter. These findings, taken together, challenge the assumption that larger ranges in cognitive load are synonymous with more variability and highlight that even when the range between maximum and minimum pupil diameter is smaller, variability as measured by standard deviation of pupil diameter can be higher, as seen in the convergent thinking task. This complex relationship highlights that eye-tracking metrics can provide valuable insight into the cognitive processes during divergent and convergent thinking. However, to extract these insights, researchers must be careful when interpreting such metrics, especially among neurodivergent individuals. It is critical to acknowledge extraneous factors that influence eye movements beyond cognition, such as voluntary eye movements, and external factors such as environment and task demands. Understanding how individuals engage with different types of thinking can inform the development of design environments to better support the variety of ways in which individuals process information. By doing so, we can move toward an even more inclusive and evidence-based understanding of design.


 Open access